Downloaded 142 times

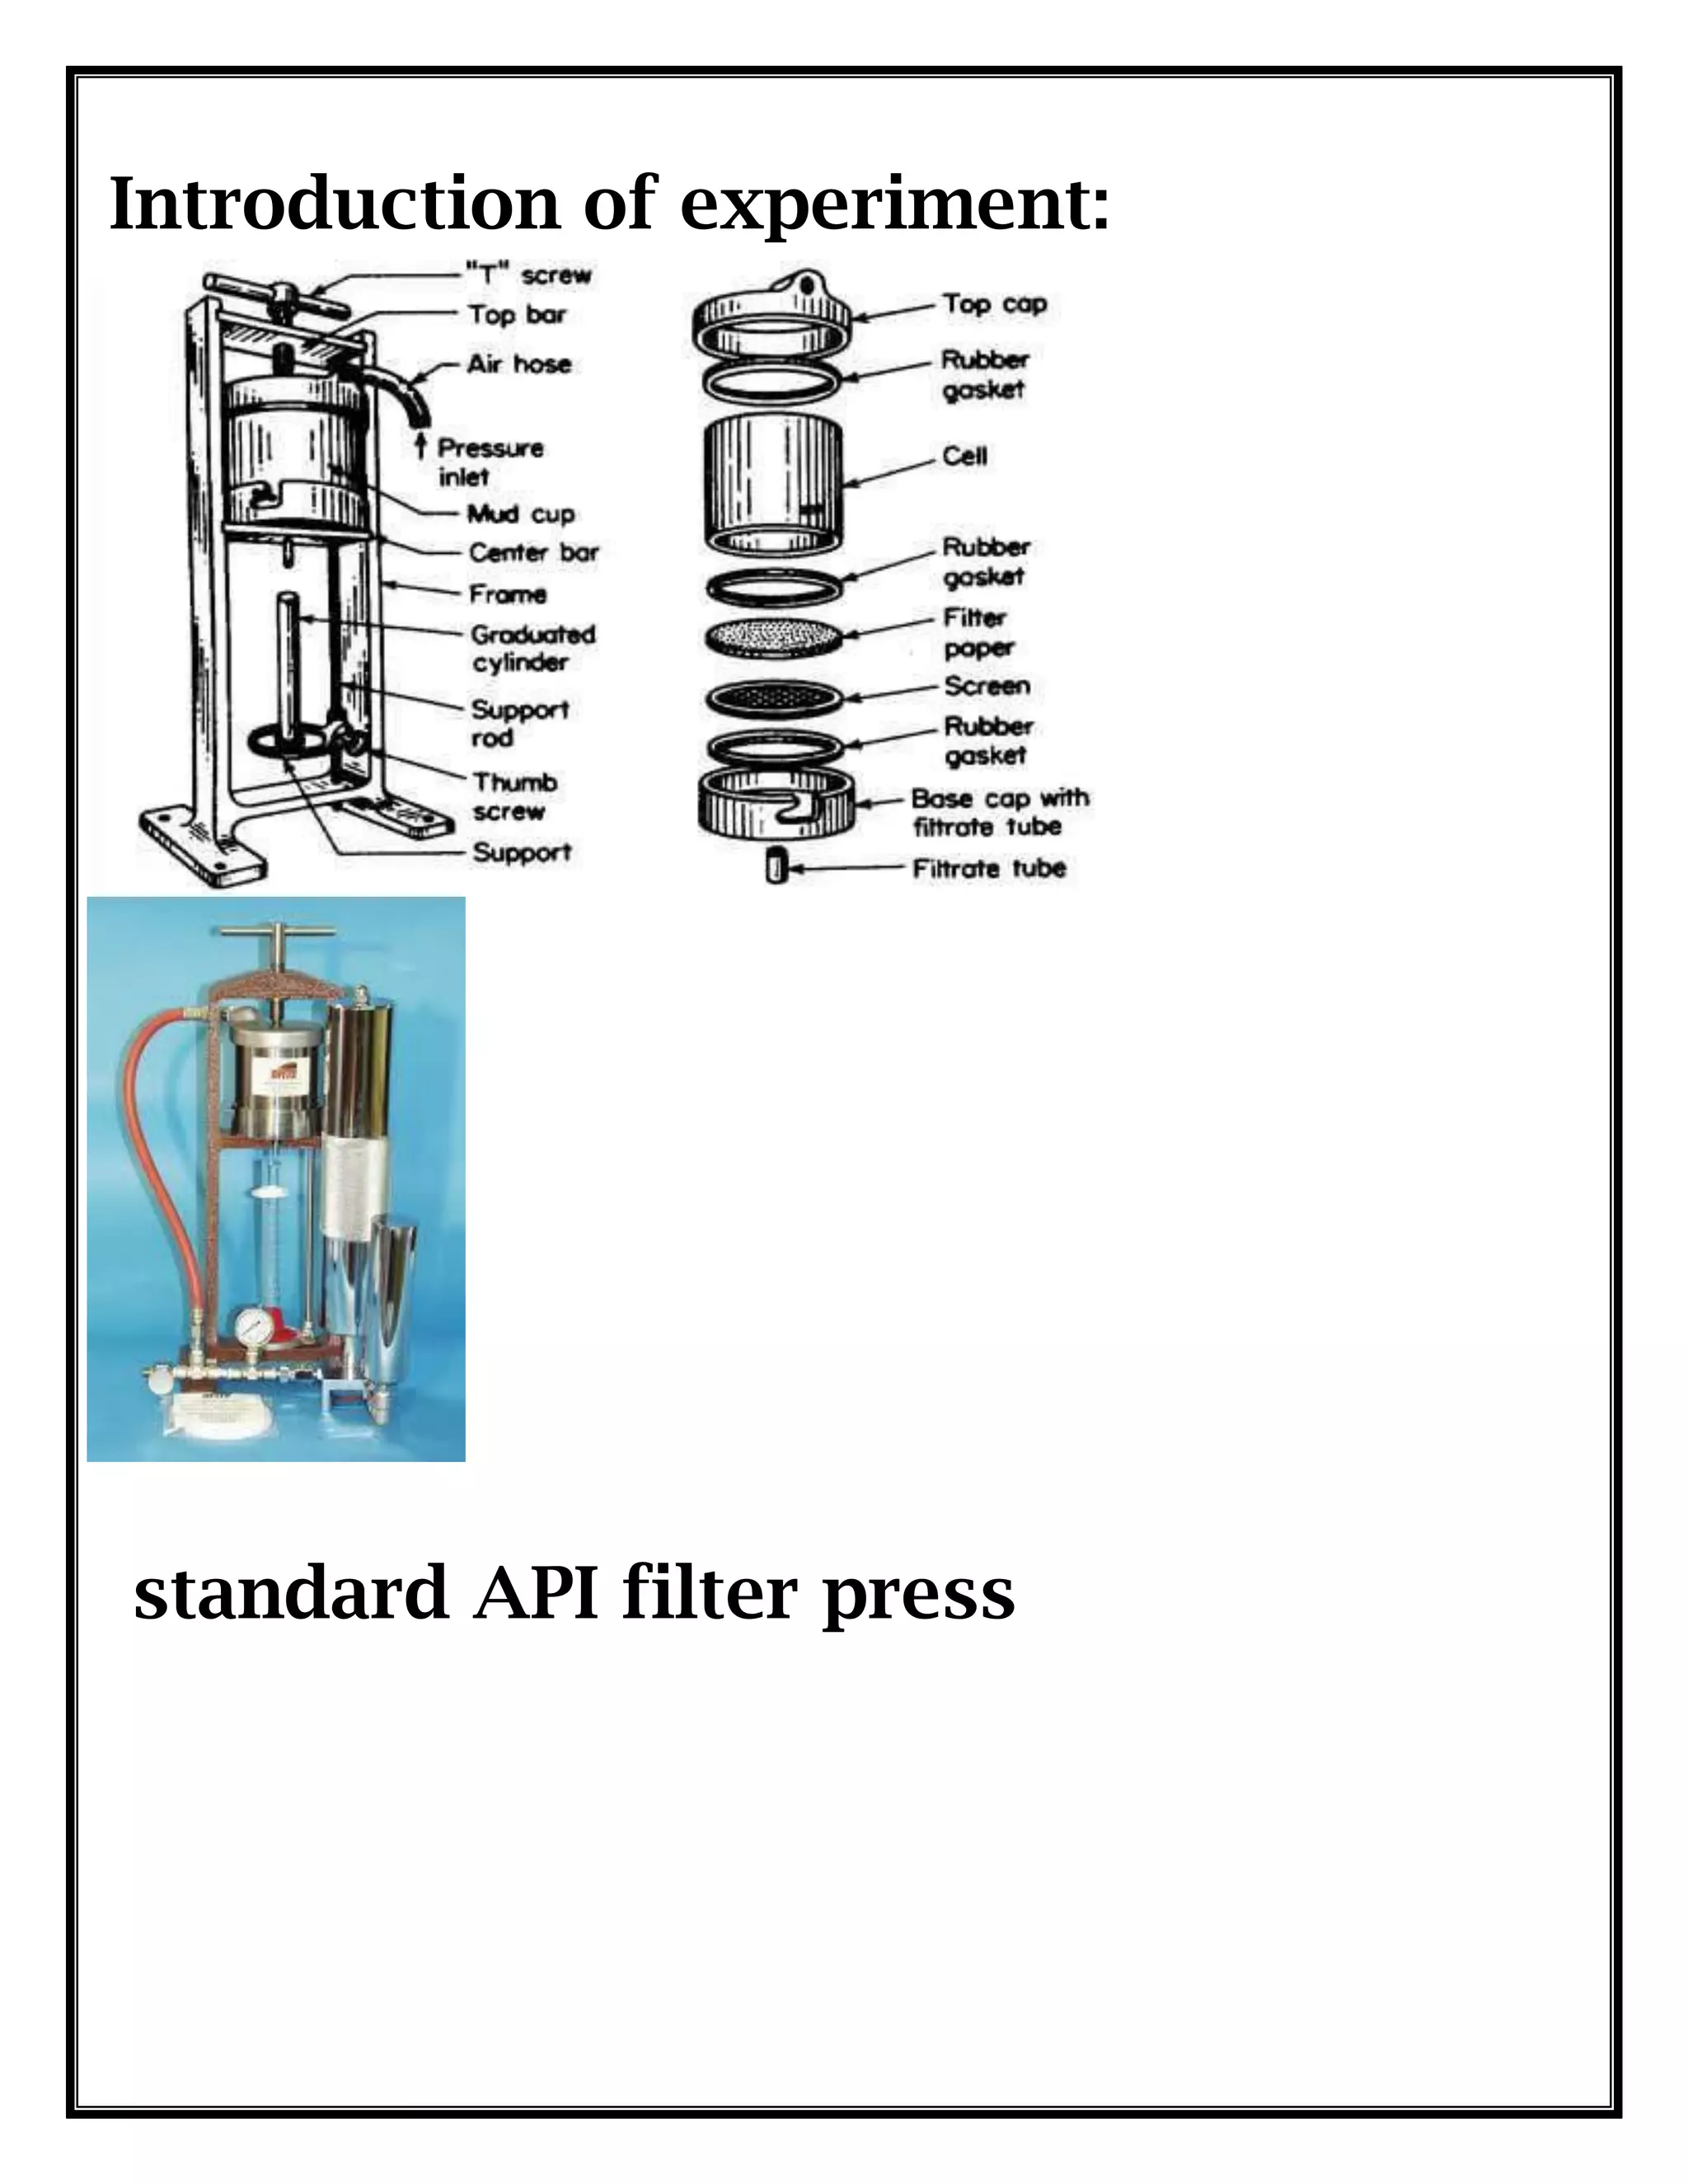
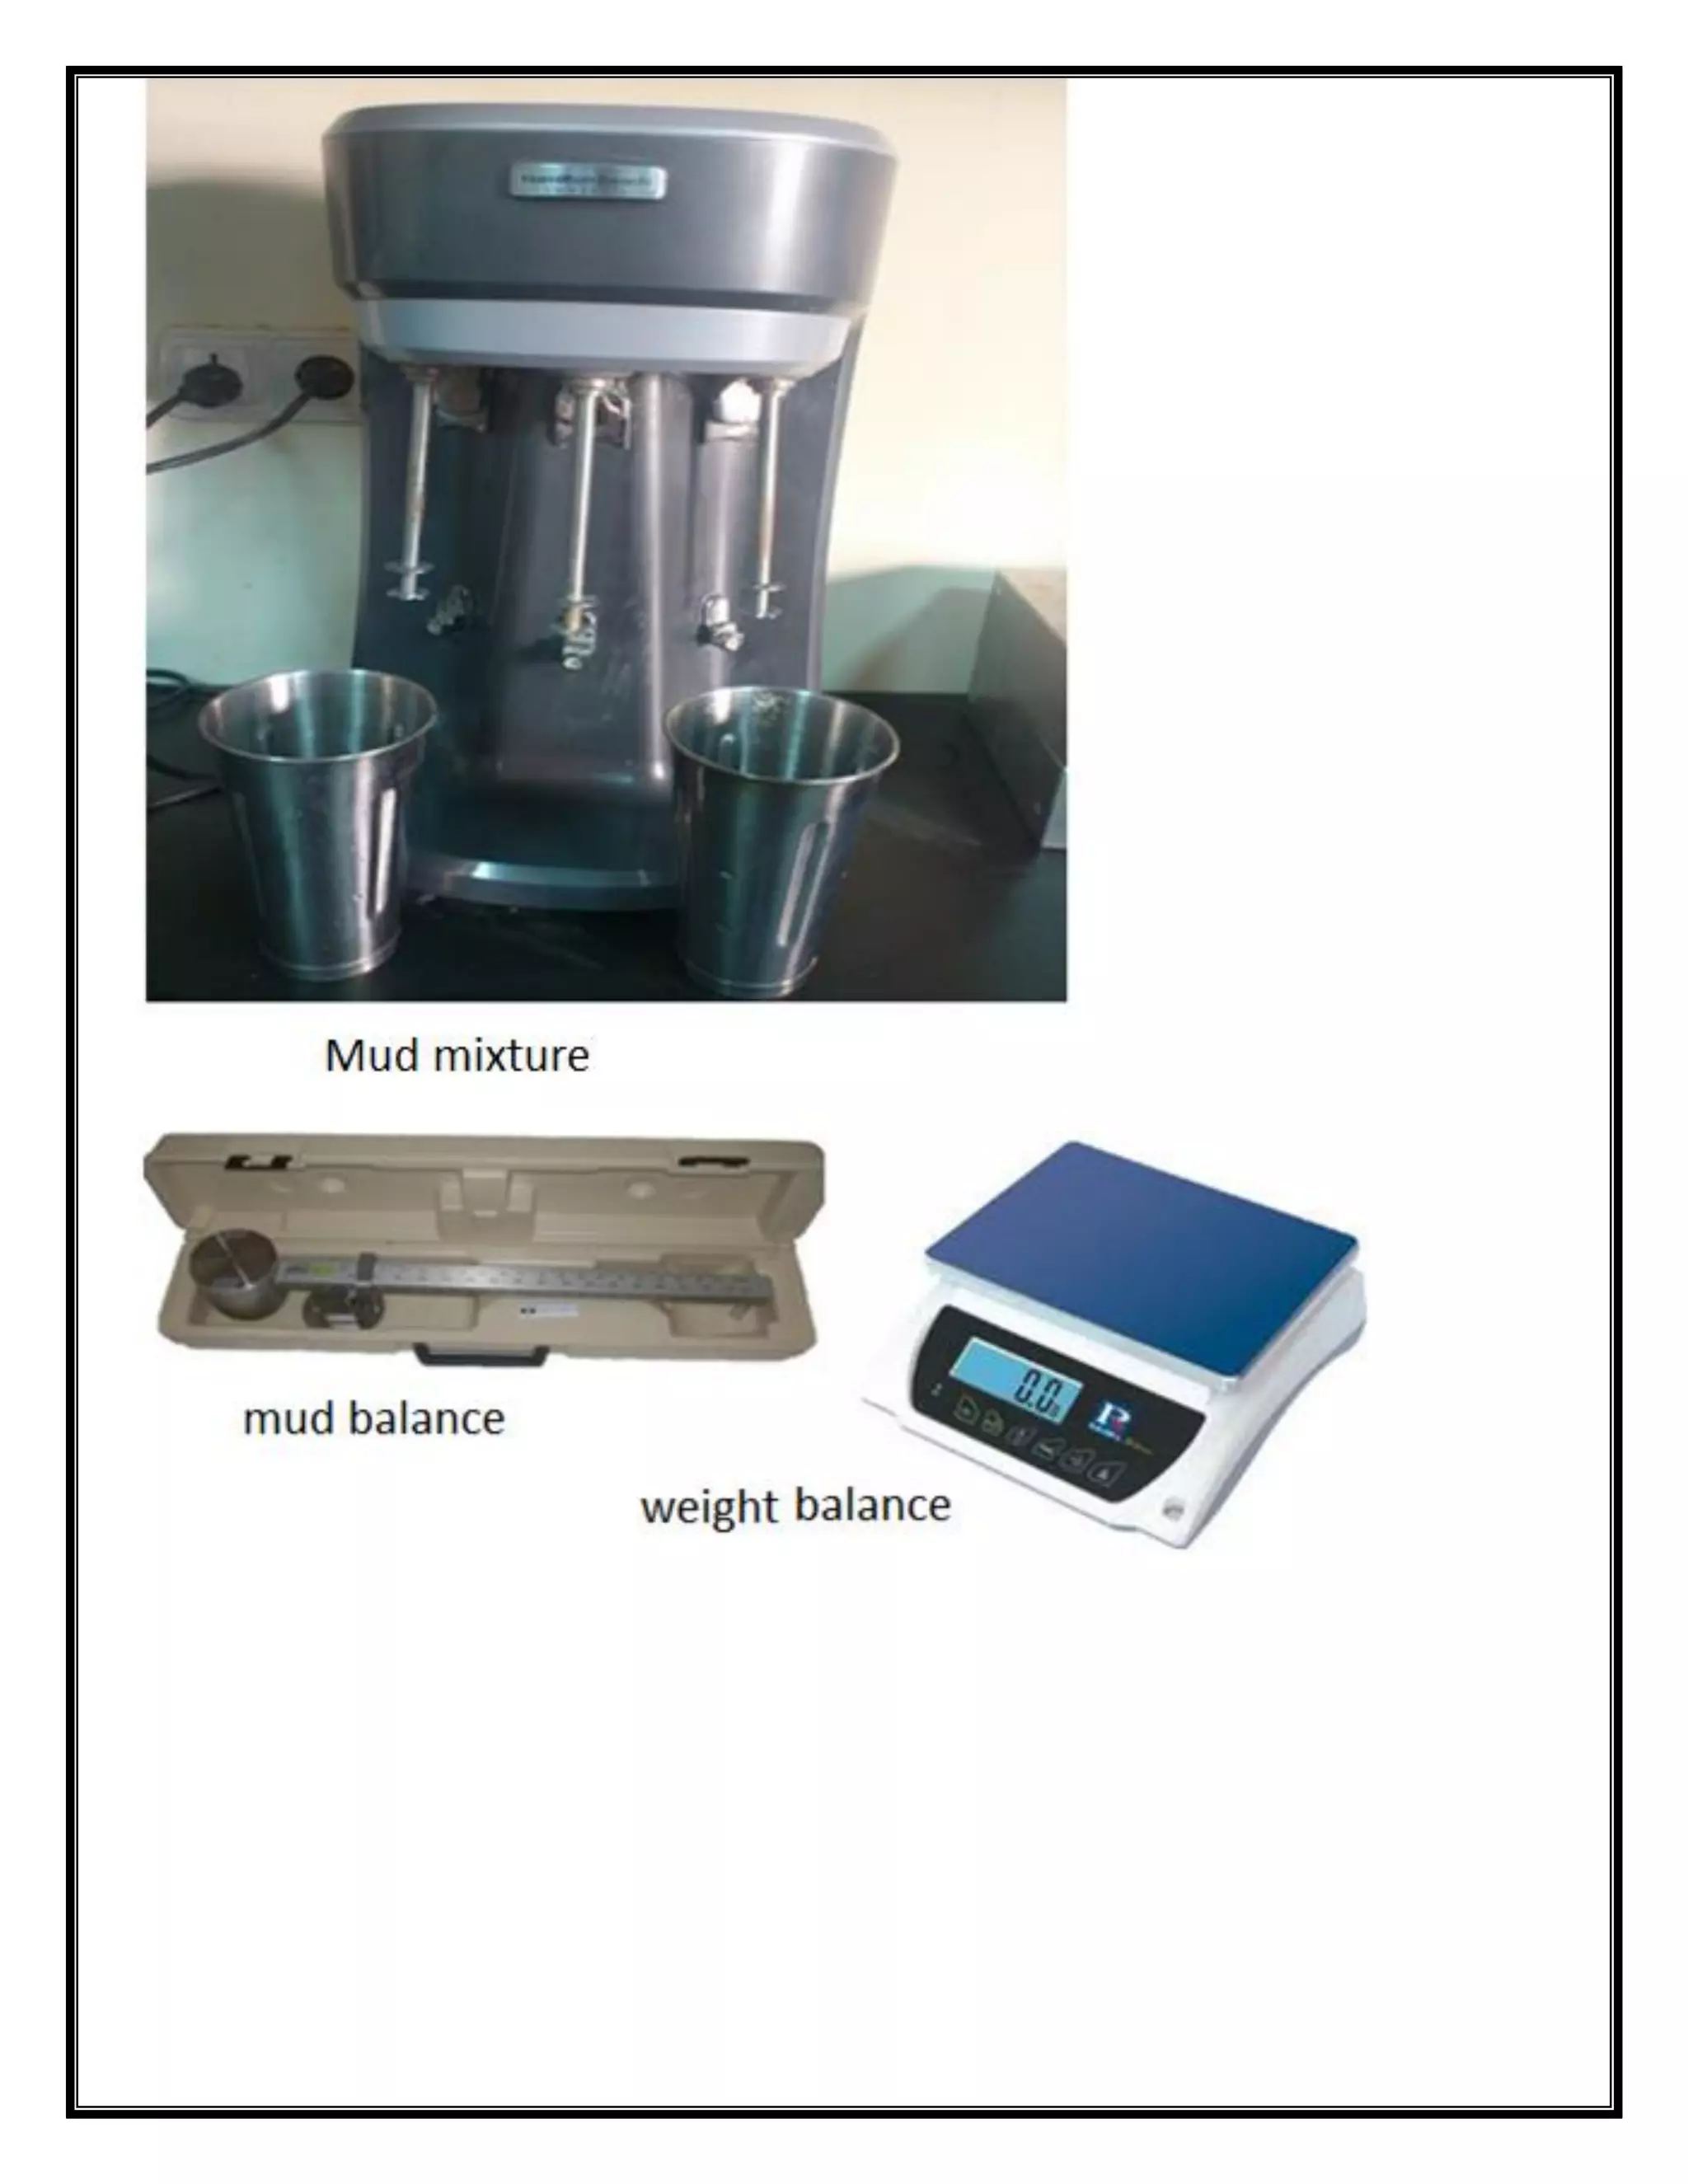


The document details a laboratory experiment conducted at Koya University's Faculty of Engineering, focused on determining the filtration rate and thickness of mud cake using a standard API filter press under controlled conditions. It outlines the objective, theoretical background, experimental procedure, and discussion of findings, including factors affecting filtration such as pressure, temperature, and time. Key results illustrate the relationship between dynamic filtration and fluid loss, while recommendations highlight the impacts of excessive filtration and filter cake buildup on drilling operations.


