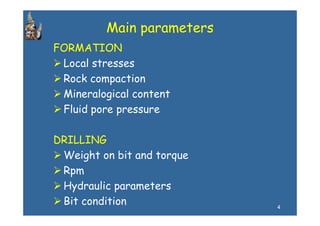
1) Monitoring drilling parameters such as weight on bit, rotational speed, fluid flow rate, and penetration rate allows for optimization of drilling rates.
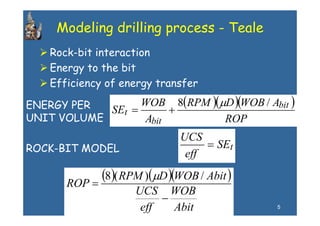
2) Drilling simulation software uses historical data to model the complex interaction between drill bits and rock formations and predict optimal drilling parameter combinations.
3) A case study analysis of a drill site in the Norwegian Continental Shelf demonstrated that increasing weight on bit, rotational speed, and fluid flow rate can increase penetration rates, while an overestimation of rock strength by 50% could decrease penetration rates by up to 82%.