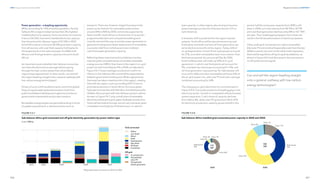
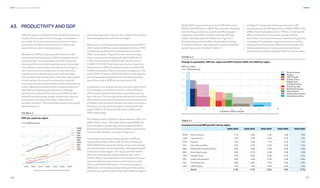
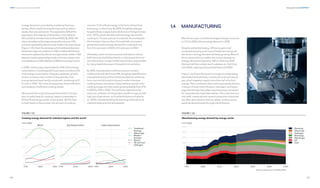
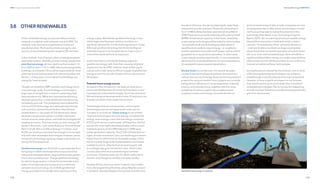
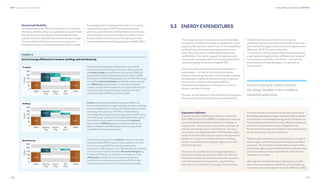
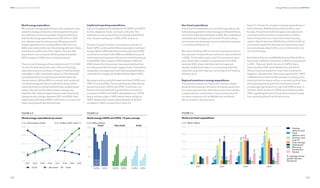
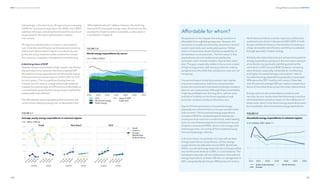
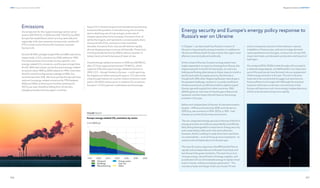
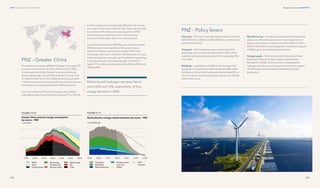
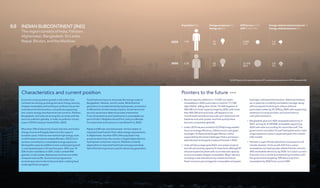
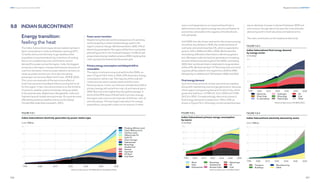
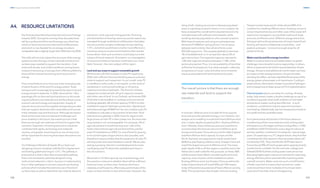
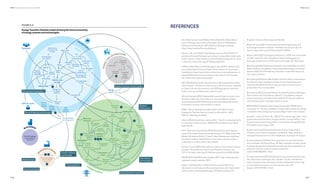
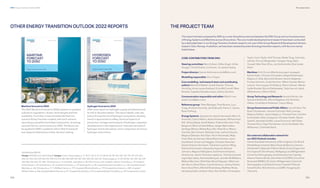
1
ENERGY
TRANSITION
OUTLOOK
2022
A global and regional forecast to 2050
2
SHORT TERM
High energy prices and a greater focus on energy security due to the war in Ukraine will not slow
the long-term transition
− Europe aims to accelerate its renewables build-out to achieve energy security
− In the rest of the world, tackling high energy and food prices may shift decarbonization down the list of priorities
in the short term
− The long-term influence of the war on the pace of the energy transition is low compared with main long-term
drivers of change: plunging renewables costs, electrification, and rising carbon prices
COP26 and the IPCC have called for urgent action which has not materialized: emissions remain at record levels
− Emissions must fall by 8% each year to secure net zero by 2050
− Opportunities for intensified action abound – the transition is opening up unprecedented opportunities
for new and existing players in the energy space
LONG-TERM FORECAST
Electricity remains the mainstay of the transition; it is growing and greening everywhere
− With an 83% share of the electricity system in 2050, renewables are squeezing the fossil share of the overall
energy mix to just below the 50% mark in 2050
− Despite short-term raw material cost challenges, the capacity growth of solar and wind is unstoppable:
by 2050 they will have grown 20-fold and 10-fold, respectively
Hydrogen only supplies 5% of global energy demand in 2050, a third of the level needed for net zero
− Pure hydrogen use scales in manufacturing from the early 2030s and in derivative form (ammonia, e-methanol
and other e-fuels) in heavy transport from the late 2030s
− Green hydrogen from dedicated renewables and from the grid will become dominant over time;
blue hydrogen and blue ammonia retain important roles in the long term
PATHWAY TO NET ZERO
We are heading towards a 2.2°C warming; war-footing policy implementation is needed to secure net zero by 2050
− Massive, early action to curb record emissions is critical; the window to act is closing
− No new oil and gas will be needed after 2024 in high income countries, and after 2028 in middle-
and low-income countries.
Net zero means leading regions and sectors have to go much further and faster
− OECD regions must be net zero by 2043 and net negative thereafter; China needs to reduce emissions
to net zero by 2050
− Renewable electricity, hydrogen and bioenergy are essential, but insufficient: almost a quarter of net decarbonization
relies on carbon capture and removal combined with land-use changes (reduced deforestation).
HIGHLIGHTS
Highlights
FOREWORD
The present turbulence in energy markets is not inconse-
quential, however. Europe will transition to a renewables-
dominated power system more rapidly, but higher
energy prices may dampen investment in clean energy
elsewhere. These two effects tend to offset each other
globally over time. Supply-chain disruptions will continue
in the shorter term, delaying the global EV ‘milestone’
(when the EV share of new vehicle sales surpasses 50%)
by one year in our forecast — to 2033. But here too there
are compensatory developments, where high prices will
encourage energy-saving behaviour among power
consumers. For aviation, we also forecast a permanent
reduction of 7% in annual passenger trips due to
pandemic-related changes in work habits.
This year, our forecast sees non-fossil energy nudge
slightly above 50% of the global energy mix by 2050.
The principal underlying dynamic is rapid electrification,
with supply climbing from 27 PWh/yr now to 62 PWh/yr
in 2050. We detail how this leads to enormous energy-
efficiency gains in power generation and end-use.
We are entering a prolonged period where efficiency
gains in our energy system outstrip the rate of economic
growth. Over the long term this means the world will
spend significantly less on energy as a proportion of GDP.
In theory, that should provide policymakers with confi-
dence to accelerate the transition.
Bold and brave policy choices are critical in the face of
climate change. This year, for the first time, we include
our ‘Pathway to Net Zero’ alongside our ‘best estimate’
forecast for the energy transition. Put another way,
we compare a forecast that we think will unfold with a
pathway that we hope the world will embrace. Even
under a net zero pathway we think it infeasible for the
world to completely discontinue fossil-fuel use, which
is why you will find a 13% fossil share in the energy mix
in our Pathway to Net Zero in 2050. That overshoot
in fossil use will require huge expenditure on carbon
capture and removal efforts in the 2040s – running
to USD 1 trillion per year.
Deglobalization is much talked about. However, the
energy transition is likely to see unprecedented regional
and cross-industry cooperation — for example within
hydrogen ecosystems or the creation of green shipping
corridors. DNV will, as an independent provider of
technical expertise, strive to catalyse such cooperation
wherever we can.
I hope you find this Outlook a useful strategy and
planning tool, and, as ever, I look forward to your
feedback.
Looking beyond today’s high energy prices to see what the longer-term
energy future holds is difficult. That is what this Outlook does. Our forecast
considers the demand shock of the pandemic and the supply shock that
camewithRussia’sinvasionofUkraineandconcludesthatthosedevelopments
exertlittlelong-terminfluenceoveratransitionthatwillberapidandextensive.
Remi Eriksen
Group President and CEO
DNV
3
High energy prices and a heightened focus on energy
security due to the war in Ukraine will not slow the
long-term transition
Europe is likely to accelerate its energy transition during
and after the war in Ukraine. There will be a rapid phase-
out of imported Russian fossil fuel sources and rising to
the top of the agenda will be energy security, which
hinges on a renewables-dominated energy system and
measures to accelerate energy efficiency. Energy security
and sustainability thus pull in the same direction. Afforda-
bility is a major short-term concern with record high
prices for natural gas and electricity. The policy response
focuses on diversification of supply initially, giving some
fossil sources a short-term boost, but the main policy
thrust is to achieve energy independence for Europe
earlier, based primarily on renewable energy.
Outside Europe, and particularly in low- and middle-
income countries, high energy and food prices plus the
looming risk of global recession have shifted attention to
short-term priorities. Long-term climate change invest-
ments and actions like electricity infrastructure build-out
are likely to be postponed. High-priced LNG could make
for a short-term coal resurgence, and although renewables
are local and support domestic energy security, domestic
coal could find favour over imported gas.
The net effect is that, due to short-term pressure, there is
reduced likelihood of extraordinary action being taken to
reach a net-zero future; however, the steady pace of the
financially-driven energy transition will continue. Short-
term commodity cost increases and the war in Ukraine
will not put the brakes on the big drivers of the transition
like the plunging costs of renewables, electrification, and
rising carbon prices.
COP26 and the IPCC have called for urgent action which
has not materialized: emissions remain at record levels
At COP26, UN Secretary António Guterres stressed the
urgency of immediate action on global warming, calling
it a Code Red for humanity. His warning has been
amplified by the successive AR6 reports from the IPCC.
COP26 saw agreements on important issues like coal
phase-down, methane reduction, and land-use
changes, but that sense of urgency has generally not
been reflected since then in national policy plans or
actions.
Global GHG emissions reduction of some 8% every year
is needed for a net-zero trajectory. In 2021, emissions
were rising steeply, approaching pre-pandemic all-time
highs, and 2022 may only show a 1% decline in global
emissions. That makes for two ‘lost’ years in the battle
against emissions.
The lack of action is attributed to a weakening global
economy amid inflation challenges. However, our
analysis points to enormous opportunities inherent
in decarbonization for both companies and nations.
Renewables expenditures are expected to double over
the next 10 years to more than USD 1,400 billion per
year, while grid expenditures also are likely to exceed
USD 1,000 billion per year in 2030. We show that
building out renewable technologies does not come
at a green premium, but rather as a green prize. Owing
to the considerable efficiencies linked to electrification
and the plunging costs of renewables, the world will be
spending far less on energy as a proportion of GDP by
2050. There is scope for accelerated action, and for
private sector frontrunners to run well ahead of antici-
pated governmental support.
Hydrogen will be only 5% of global energy demand
in 2050, a third of the level needed for net zero
Hydrogen is inefficient and expensive compared with
direct electricity use but is essential for decarbonizing
hard-to-abate sectors like high-heat processes in manu-
facturing, and maritime transport and aviation. However,
the global uptake of hydrogen as an energy carrier sees it
supplying only 5% of energy demand in 2050, a third of
the level needed in a net-zero energy mix.
Hydrogen will scale in the manufacturing sector from
the early 2030s in the leading regions. In heavy trans-
port like aviation and maritime, we will see the hydrogen
derivates ammonia, e-methanol and other e-fuels
starting to scale in the late 2030s. We see a more limited
uptake of hydrogen in heavy, long-distance trucking,
and in the heating of buildings in areas with existing gas
distribution networks, but almost zero use in passenger
vehicles. Green hydrogen from dedicated renewables
and from the grid will dominate hydrogen production;
blue hydrogen remains important, for example in
ammonia production. The number of hydrogen initia-
tives in hard-to-abate sectors is growing rapidly, but few
have reached final investment decision.
Highlights – short term Highlights – long term
Electricity remains the mainstay of the transition;
it is growing and greening everywhere
The strongest engine of the global energy transition is
electrification, expanding in all regions and almost all
sectors, while the electricity mix itself is greening rapidly.
Electricity production will more than double, with the
share of electricity rising from 19% to 36% in the global
energy mix over the next 30 years. In addition, electricity
will take over and dominate hydrogen production.
The share of fossil fuels in the electricity mix reduces
sharply from the present 59% to only 12% in 2050.
Solar PV and wind are already the cheapest forms of new
electricity in most places, and by 2050 it will grow 20-fold
and 10-fold, respectively. Solar PV takes a 38% share of
electricity generated in 2050 and wind 31%.
Nuclear will only manage to slightly increase present
production levels due to its high costs and long lead
times; its share of the electricity mix will therefore decline.
The strong growth of renewables in electricity is the main
reason why the fossil-fuel share of total energy use in
2050 is pushed to just below the 50% mark.
DNV Energy Transition Outlook 2022 Highlights
4 5
We are heading towards 2.2°C warming;
war-footing policy implementation is needed
to secure net zero by 2050
The Paris Agreement aim of limiting global warming to
1.5°C is still possible, but the window to act is closing.
Securing 1.5°C without a temporary carbon overshoot is
already out of reach. DNV’s ETO forecast of the 'most
likely' energy future — one driven by market forces and
often dilatory climate policies — results in 2.2°C warming
by the end of the century.
On their own, technological and market developments
are insufficient drivers of the change needed for net zero;
war-footing-like policy implementation with massive
early action across regions and sectors is needed.
Low-income regions need dedicated technology and
financial assistance to transition at the required rate.
No new oil and gas will be needed after 2024 in high-in-
come countries and after 2028 in middle- and low-income
countries. However, renewables need to triple and grid
investment rise more than 50% over the next 10 years.
Closing the gap to 1.5°C Highlights – Pathway to Net Zero
Net zero means leading regions and sectors must
go below zero before 2050
Different regions and sectors have different starting
points and capabilities, and if the world is to reach net
zero in 2050, leading regions and sectors have to go
much further and faster. OECD regions must be net zero
by 2043 and net negative thereafter via carbon capture
and removal. China needs to reduce emissions to zero by
2050, while the remaining regions all reduce emissions
significantly, but do not reach net zero by mid-century.
Some sectors, like power, will reach net zero before
2050, while other sectors, like cement and aviation,
will still have remaining emissions. Maritime needs a
strengthened IMO strategy to reduce emissions by
95% by 2050.
Renewable electricity, hydrogen and bioenergy are
essential, but insufficient: almost a quarter of net
decarbonization relies on carbon capture and removal,
including CCS from power and industry, direct air
capture, and nature-based solutions.
Between 2050 and 2100, the ETO projection is that net
annual emissions reduce slowly from 22 Gt towards 0,
while the PNZ has net-negative annual emissions from
2050.
In 2100, the emissions gap is 7 Gt CO2
of negative
emissions, corresponding to around 0.7 °C temperature
difference and 1,050 Gt of cumulative CO2
emissions.
How to close the gap?
The gap must be closed by a combination of:
— Reduced combustion of fossil fuels, replacing
coal, oil and gas with renewables and nuclear
— Energy efficiency improvements
— Carbon capture and removal, including net
negative emissions from:
— Bioenergy with CCS
— Direct air capture
— Nature-based solutions (e.g. reforestation)
In this year’s ETO, DNV has added a Pathway to Net
Zero scenario that outlines what needs to be done by
2050 for the world to close the gap from the most likely
2.2°C trajectory to the agreed 1.5°C future.
How big is the gap?
Global CO2
emissions were 38 Gt in 2020 and by 2050
the annual emissions gap is 22 Gt CO2
with cumulative
emissions resulting in about 0.2°C difference.
174
DNV Energy Transition Outlook 2022
175
Pathway to net zero emissions CHAPTER 8
PATHWAY
TO
NET
ZERO
EMISSIONS
8
PATHWAY TO
NET ZERO
EMISSIONS (PNZ)
Highlights
This chapter presents DNV’s Pathway to Net Zero
emissions, which we consider to be a technically and
economically feasible — but unavoidably challenging
scenario.
Unlike our ETO forecast (the main focus of this report),
which results in global warming of 2.2°C by 2100, our
Pathway to Net Zero emissions (PNZ) is a ‘back-cast’
estimation of what is needed to achieve a net-zero
energy system by 2050 with the aim of securing a 1.5°C
warming future.
We detail here the size of the gap between our forecast
and the PNZ, and detail what needs to change in the
supply and demand sectors to achieve net zero. A key
principle is that not all sectors will be able to reach net
zero emission by 2050. Moreover, not all regions will be
able to do so — implying that some demand sectors
(e.g. transport) and regions (typically high-income
regions) must go below zero before 2050. Chapter 9
provides more detail on the net zero pathways for each
of our 10 world regions.
8.1 Pathway to net zero
emissions (PNZ) 176
8.2 Net zero policies 180
8.3 Net zero demand and supply 182
8.4 Net zero expenditures 192
8.5 CO2
and methane emissions 194
8.6 Sectoral roadmaps 198
Highlights
Highlights
DNV Energy Transition Outlook 2022
6 7
8
DNV Energy Transition Outlook 2022
9
Highlights
2015 2020 2025 2030 2035 2040 2045 2050
2036
Feedstock use of
fossil fuel peaks
2033
Wind overtakes hydro
2040
Seaborne container trade
exceeds crude oil trade
2044
Every third commercial vehicle
on the road is electric
2034
Maritime energy
demand peaks
2033
Half of all passenger vehicles
sales electric
2014
Coal peaked
2025
Oil peaks
Highlights of our forecast energy transition to 2050.
The green slope represents the share of non-fossil energy
sources in the energy mix.
**Average primary energy used for production of H2
& derivatives.
*Energy peaks not to scale relative to primary energy
2036
Natural gas peaks
2036
Primary energy
supply peaks
2041
Final energy
demand peaks
2.2ºC
warming
by 2100
2030
Transport energy
demand peaks
2047
CCS captures 5% of global
energy-related CO2 emissions
2038
Nuclear
peaks
2020
COVID-19 drop-off, removing
6% of energy demand
2043
Half of world’s road
vehicles electric
2044
Electricity use doubles
relative to 2020
2050
Hydrogen 5% of energy demand
2041
Manufacturing energy
demand peaks
2022
PV installations
1TW
2018
Energy demand for
space heating peaked
2029 1.5ºC carbon budget exceeded
COP15 Paris Agreement 2056 2ºC carbon budget exceeded
Hydrogen**
Maritime non-fossil
Maritime fossil
Energy transitions sea
Energy peaks*
Non-fossil share
Energy milestones
Energy transitions
20%
of energy mix
non-fossil
51%
of energy mix
non-fossil
ENERGY TRANSITION TIMELINE
-6%
2045
Solar PV 35% of power supply
2042
Wind 30% of
power supply
10
DNV Energy Transition Outlook 2022
11
CONTENTS
Foreword 2
Highlights 3
Introduction 12
1 Energy Demand 14
Contents
Foreword 2
Highlights 3
Introduction 12
1 Energy Demand 14
1.1 Energy demand 16
1.2 Transport 22
1.3 Buildings 36
1.4 Manufacturing 47
1.5 Non-energy use (feedstock) 54
1.6 Final energy demand from all sectors 56
2 Electricity and hydrogen 58
2.1 Electricity 60
2.2 Grids 68
2.3 Storage and Flexibility 71
2.4 Hydrogen 74
2.5 Direct heat 81
3 Renewable energy 82
3.1 Solar 85
3.2 Wind 91
3.3 Hydropower 95
3.4 Nuclear power 97
3.5 Bioenergy 99
3.6 Other renewables 102
4 Energy supply and fossil fuels 104
4.1 Coal 107
4.2 Oil 109
4.3 Natural gas 113
4.4 Summarizing energy supply 119
5 Energy efficiency and finance 124
5.1 Energy intensity 126
5.2 Sectoral energy efficiency 129
5.3 Energy expenditures 131
6 Policy and the energy transition 138
6 .1 The policy landscape shaping the
		transition 140
6.2 Drivers and barriers 142
6.3 Key regional policy developments 146
6.4 The policy toolbox 148
6.5 Policy factors in our Outlook 154
7 Emissions and climate implications 160
7.1 Emissions 163
7.2 Climate implications 169
8 Pathway to net zero emissions (PNZ) 174
8.1 Pathway to net zero emissions (PNZ) 176
8.2 Net zero policies 180
8.3 Net zero demand and supply 182
8.4 Net zero expenditures 192
8.5 CO2
and methane emissions 194
8.6 Sectoral roadmaps 198
9 Regional transitions 220
9.1 North America 224
9.2 Latin America 236
9.3 Europe 246
9.4 Sub-Saharan Africa 260
9.5 Middle East and North Africa 274
9.6 North East Eurasia 284
9.7 Greater China 292
9.8 Indian Subcontinent 304
9.9 South East Asia 314
9.10 OECD Pacific 324
9.11 Comparison of the regions 332
Annex 334
References 347
The project team 355
12
DNV Energy Transition Outlook 2022
13
INTRODUCTION
Introduction
Our best estimate,
not the future we want A single forecast, not scenarios
Long term dynamics,
not short-term imbalances
Continued development
of proven technology, not
uncertain breakthroughs
Main policy trends included;
caution on untested
commitments, e.g. NDCs, etc.
Behavioural changes: some
assumptions made, e.g. linked
to a changing environment
ETO Model
Our analysis covers the period 1980-2050, with changes
unfolding on a multi-year scale that in some cases is
fine-tuned to reflect hourly dynamics. We continually
update the structure of and input data to our model. The
most significant changes to the model since our 2021
Outlook are listed on page 343.
The figure below presents our model framework. The
arrows in the diagram show information flows, starting
with population and GDP per person, while physical flows
are in the opposite direction. Policy influences all aspects
of the energy system. Energy-efficiency improvements in
extraction, conversion, and end use are cornerstones of
the energy transition.
About this Outlook
This annual Energy Transition Outlook (ETO), now in its
6th edition, presents the results from our independent
model of the world’s energy system. It covers the period
through to 2050 and forecasts the energy transition
globally and in 10 world regions. Our forecast data may
be accessed at eto.dnv.com/data.
More details on our methodology and model can be
found on page 342. The changes we forecast hold
significant risks and opportunities across many indus-
tries. Some of these are detailed in our supplements:
— Maritime forecast to 2050
— Hydrogen forecast to 2050
All ETO reports are feely available on www.dnv.com.
In addition, we draw our readers’ attention to ongoing
insights into the energy industry published by DNV,
which include our most recent Insight report,
Future-proofing our power grids.
Our approach
DNV presents a single ‘best estimate’ forecast of the
energy future, with sensitivities considered in relation to
our main conclusions. However, this year, we include our
‘Pathway to Net Zero Emissions’ scenario (Chapter 8),
which is effectively a ‘back cast’ of what we consider to
be a feasible, albeit challenging, pathway for the world
to achieve net zero emissions by 2050 to secure a 1.5°C
warming future. We believe readers will find it useful to
explore the dimensions of the gap between our ‘best
estimate future’ and our net zero pathway scenario.
Foundational aspects of our approach are illustrated
opposite. These include the fact that we focus on long
term dynamics, not short-term imbalances. However,
given the scale of the impact on energy supply and
demand of both COVID-19 and Russia’s invasion of
Ukraine, we describe how we take these developments
into consideration in Chapter 1.
Independent view
DNV was founded 158 years ago to safeguard life, prop-
erty, and the environment. We are owned by a foundation
and are trusted by a wide range of customers to advance
the safety and sustainability of their businesses.
70% of our business is related to the production, genera-
tion, transmission, and transport of energy. Developing
an independent understanding of, and forecasting, the
energy transition is of strategic importance to both us
and our customers. This Outlook draws on the expertise
of over 100 professionals in DNV. In addition, we are very
grateful for the assistance provided by a number of
external experts. All contributors are listed on the last
page of this report.
ETO model framework
ENERGY SECTOR’S
OWN USE
POWER GENERATION
HYDROGEN
OIL REFINERIES
Electricity
Direct heat
Energy
transformation
OTHER
Road
Maritime
Aviation
Rail
Pipelines
Residential
Commercial
Manufactured
goods
Base materials
Iron and steel
Construction
and mining
Feedstock
TRANSPORT
Final energy
demand
BUILDINGS
MANUFACTURING
NON-ENERGY
Solar
Wind
Hydropower
Nuclear
Bioenergy
Geothermal
Crude oil
Natural gas
Coal
Primary
energy supply
FOSSIL FUEL
EXTRACTION
Source of
demand
TRANSPORT
BUILDINGS
POPULATION
GDP PER
PERSON
POLICY
DIRECT USE
ENERGY EFFICIENCY
Space heating
& cooling,
water heating,
cooking, and
appliances &
lighting
Measured in
tonne-miles,
passenger-
kilometres and
vehicles
MANUFACTURING
Production
output measured
as Manufacturing
Value Added
14
DNV Energy Transition Outlook 2022
15
Energy demand CHAPTER 1
1
ENERGY
DEMAND
1.1 Energy demand 16
1.2 Transport 22
1.3 Buildings 36
1.4 Manufacturing 47
1.5 Non-energy use (feedstock) 54
1.6 Final energy demand
from all sectors 56
Highlights
In the next 30 years, global energy demand will level
off even as the global economy grows. This historic
decoupling is due to the dramatic effect of efficiency
gains, largely enabled by accelerated electrification,
that will outpace economic growth in the coming years.
We analyse the lingering effects of the energy demand
shock from the COVID-19 pandemic, and the impact of
the disruption to energy supply brought on by Russia’s
invasion of Ukraine. While both developments have
seen large shifts in demand and supply in the short
term, their impact over the longer term is marginal
compared with the key drivers of the transition: rapid
electrification, tightening policy on decarbonization,
and the plunging cost of renewables and storage.
This chapter details expected shifts in the key demand
sectors, with a modest growth in energy demand
expected in buildings and manufacturing, and a small
decline in transport over the coming decades. This
occurs despite tremendous growth in energy service
linked to expanding floor space and cooling needs,
growth in demand for manufactured goods, a rise in
annual passenger trips in aviation, and a near-doubling
in the size of the vehicle fleet.
16
DNV Energy Transition Outlook 2022
17
Energy demand CHAPTER 1
1.1 ENERGY DEMAND
The shock to energy demand caused by the pandemic was a forceful
reminder that understanding the nature and dimensions of energy
demand is fundamental to any energy forecast. This chapters covers
developments in the four sectors responsible for almost all energy
demand: transport, buildings, manufacturing, and feedstock. Part of our
analysis involves a consideration of effects of the pandemic and Russia’s
invasion of Ukraine on energy demand.
Historically, energy demand has grown in lockstep with
GDP — population growth and improvements in standards
of living — moderated by efficiency improvements. Global
population growth is slowing down and is expected to
reach 9.4 billion people in 2050. Economic growth will
continue, and the size of the global economy in 2050 will
be USD 300 trillion, with an average growth rate of 2.5%
from 2019 to 2050. Further details on population and
economicgrowthareincludedintheannexofthisOutlook.
More and wealthier people imply ever-more energy
services — for transportation, housing, consumer goods
and so on. This leads to increased energy demand, unless
countered by strong efficiency gains.
The effect of energy efficiency
In the coming three decades this counterforce will, indeed,
be strong, and we forecast that massive efficiency gains,
particularly those enabled by electrification, will offset the
population and economic growth propelling demand for
energy services. Put another way, a burgeoning middle
class will drive ever-higher demand for energy services in
the form of a growing car fleet, more buildings with more
cooling requirements, appliances, and so forth. But, owing
to compounding efficiencies, the world will be using
progressively less primary energy to satisfy the rising
demand for energy services. We forecast, therefore, that
final energy demand will, in fact, level off just below 500EJ,
a level only 13% higher than today.
In the years between 2035 to mid-century, final energy
demand varies by less than1%,meaningitisvirtuallyflat,
asillustratedinFigure1.1.
It is not a given that energy demand will remain flat after
2050. Once most energy services are converted to
electricity, which automatically improves energy efficiency
in most sectors, energy demand may start to increase
again. This could well be countered by an eventual decline
in the global population and a world economy dramati-
cally hobbled by the effects of global warming. Post 2050,
rising energy demand will almost certainly not be accom-
panied by rising emissions.
‘Final’ energy in this Outlook and as shown in Figure 1.1,
means the energy delivered to end-use sectors, excluding
losses and excluding the energy sector’s own use of
energy in power stations, oil and gas fields, refineries,
pipelines, and similar infrastructure.
Sectoral shifts
Global energy use is relatively equally distributed across
the three sectors of transport, buildings, and manufactur-
ing, with a modest growth expected in buildings and
manufacturing, and a small decline in transport over the
coming decades.
In buildings, energy use will grow particularly in
space cooling, and in appliances, whereas in space
heating, efficiency gains and new technologies like heat
pumps will reduce energy needs. Most of the growth will
occur in commercial buildings. In total, buildings will
collectively consume 23% more final energy in 2050 than
in 2021.
In manufacturing, substantial energy-efficiency
gains, including increased recycling, will balance the
growth in demand for goods, such that manufacturing
energy use will grow by 14% to 2035 and thereafter
remain flat to 2050. The feedstock sector will see energy
demand grow by 17% and peak in the mid-2030s,
reducing slowly thereafter owing to increased recycling
and efficiency gains.
Although transport services will grow signifi-
cantly, overall energy demand in the transport sector will
reduce over the forecast period. This is strongly associ-
ated with the switch from internal combustion to battery
electric engines, with half of the world’s fleet of passenger
vehicles electrified by 2043. Efficiency gains in the road-
transport subsector will more than counterbalance growth
in energy demand in aviation. This trend will also be
helped by the maritime subsector undergoing significant
efficiency gains that lead to a peak in its energy use in the
mid-2030s, despite growth in the size of the world fleet.
Regional developments
Although global final energy demand will level off, this is
not the case for all the regions. In Europe and OECD
Pacific, energy demand has already peaked, while in many
of the middle- and low-income regions, energy demand
will continue to increase through to 2050, as illustrated in
Figure 1.2. Greater China's share of global energy demand
is at 25%, but will reduce to about 20% in 2050, while the
Indian Subcontinent will overtake North America as the
second largest energy consuming region in 2040.
Energy carriers
Energy demand by carrier is summarized in Section 1.6.
It is in carrier form that the story of the energy transition is
most apparent. Historically, energy carriers have shifted
gradually from solids to liquids; in recent decades, there
has been a partly shift from liquids to gases. The coming
decades are characterized by a shift to electricity.
18
DNV Energy Transition Outlook 2022
19
Energy demand CHAPTER 1
At the time of publication, Russia continues to wage war
on Ukraine. Devastating consequences are being felt
mostly in that country, but the reduction in commodities
output, notably cereal, oilseed and potash for fertilizers
is deepening worldwide food insecurity — already
impacted by climate change and COVID-19 before the
invasion. The war has also sent shockwaves through
world energy markets, due to OECD-led sanctions
against Russian energy exports, that are likely to have
considerable long-term consequences even after what
now looks to be a protracted war is over. Some 40% of
European gas consumption has been covered by
Russian exports in recent years. Terminating this source
of supply — in line with EU plans — before 2025, will lead
to large changes in not only the European arena, but
also globally. In the short term, energy efficiency and
the LNG trade will be the main beneficiaries of a choking-
off of Russian gas exports. But in the longer term, the
combined effect of higher gas prices, and policy
support — including tough mandates — for renewable
energy, will hasten the European energy transition.
Our initial assessment (DNV, 2022) showed that, relative
to our pre-invasion forecast, sanctions on Russian energy
exports and its consequences will reduce overall
European final energy demand. Since then, the war on
gas has become even stronger, and we now find European
2030 gas consumption to be 26% lower, and European
2030 energy related CO2
emissions to be 8% lower, than
we found a year ago.
Despite the fall in European gas demand, global gas
shipments (LNG and LPG — measured in tonne-miles) will
expand by 12%, as empty gas pipelines from Russia will
be replaced not only by piped gas from the North Sea
and Middle East / North Africa to Europe, but notably by
North American shale and Middle East gas — on-keel.
The North East Eurasia region, where Russia is the major
economy and fossil energy producer, will see its gas
output reduced by one third in 2030 compared to last
year’s forecast. Its gas exports will be cut in half, but even
its domestic gas demand will decline as its economy
suffers from sanctions, and export products such as
fertilizers that use fossil fuels are also affected.
We assume that sanctions against Russia remain predom-
inantly a western policy tool. With low transport costs, oil
trading patterns will shift. Compared to our 2021 ETO,
North East Eurasia’s oil production in 2026 will decline by
17% to 12.6 Mbpd. Compared to 2021 levels, this repre-
sents a 12% decline, as we discuss further in Section 9.6.
However, global adjustments will ensure that the region
will be less affected in the longer run. Thus, in 2050, the
lingering effect will only be a 4% decline in the region’s
oil production: some oil exports will be subjected to
successful embargo, with previous importers of Russian
oil importing from elsewhere. Russian exports that used
to go to Europe and North America will be diverted to
new consumers, principally those regions crowded out
by the western demand seeking to replace Russian oil.
Such Russian oil will be traded at a discount.
Though clearly material in the short term, and with
Europe inching towards a faster transition, it must be
noted that over a three-decade perspective to mid-
century, the impact of the present war on the energy
transition will be vastly outweighed by other factors like
carbon price developments and the declining costs of
renewables and storage. A critical issue for Europe in its
pursuit of energy independence will be its ability to
fast-track the permitting of new, multinational renewables
projects, where issues like the impact on biodiversity of
these large projects require an efficient, coordinated
approach.
Over a three-decade perspective to
mid-century, the impact of the present
war on the energy transition will be vastly
outweighed by other factors like carbon
price developments and the declining costs
of renewables and storage.
Ukraine and Russia are key producers for many critical
minerals for the energy transition. Both western sanctions
and Russian trade war policy tools limit such exports.
This means less availability of materials and higher costs.
These higher costs will lead to more exploration and
production elsewhere in the medium term. However, in
the meantime, they imply higher battery, wind turbine,
and solar PV costs amplifying pandemic-related supply
chain challenges. These factors contribute to a slower
transition speed, but are counteracted by emerging
energy independence policies, particularly in Europe,
that lead to faster uptake of renewable energy sources.
The regional transition stories in Chapter 9, notably for
North East Eurasia and Europe, provide more details
and data on the energy implications of the invasion and
related western sanctions on Russian energy exports.
The Russian invasion of Ukraine
20
DNV Energy Transition Outlook 2022
21
Energy demand CHAPTER 1
This Outlook is being released almost 3 years after the
SARS-CoV-2 virus was first detected in Wuhan, People's
Republic of China. Although the risk remains of the
emergence of an immunity-evading variant, much of the
world, with the notable exception of China, is now on a
path to COVID-19 as an endemic. However, the pandem-
ic’s social and economic impact endures.
The present inflationary environment, although exacer-
bated by the war in Ukraine, is strongly linked to the
pandemic stimulus packages put in place by govern-
ments which have driven unemployment to near record
lows in many OECD countries, coupled with supply-chain
disruptions related directly to COVID-19, and wild swings
in consumer spending habits as a consequence of
lockdowns.
Stimulus packages have also gone directly to energy
sector activities. Our previous Outlooks (DNV 2020, DNV
2021) forecast stimulus packages for fossil end renewable
industries to be balanced, producing a neutral effect from
the pandemic over the longer term. What we see now is
that because fossil energy production, especially shale
developments, has shorter time delays than the expan-
sion of wind and solar supply chains, fossil energy has
been the main beneficiary of support schemes, and only
6% of stimulus has gone towards greening and carbon
emissions reduction (Nahm et al., 2022). A case in point
is Norway’s stimulus package. With an oil and gas sector
directly providing 17% of GDP (Hernes et al., 2021), and
network effects of a similar scale, support packages
favoured fossil industries, keeping workers and engineers
active, leading to higher oil and gas production than
otherwise would have been the case.
As noted on the page 8-9 timeline, the global GDP
negative effect of COVID-19 was 6% in 2020. Note,
however, that though economic growth in 2021 was
stronger than forecast pre-COVID-19, and 2022 growth
will be stronger than expected three years ago, the net
effect on accumulated GDP over the last three years has
been negative. IMF (2022) and World Bank (2022a)
forecasts have substituted our own macroeconomic
projections through 2027, and leave them slightly lower
(1.5%) than our pre-pandemic economic projections.
This difference is kept through to 2050 and contributes
to dampen energy demand, but only marginally.
Supply-chain disruptions will delay the
transition in the short term but the pandemic
lowers some energy demand permanently.
Other developments will also leave permanent
pandemic scars. That COVID-19 caused havoc across
global supply chains, already made vulnerable by ‘just in
time’ policies, is now well established. However, more
consequential for the long term is how businesses have
begun responding. There is evidence that while many
companies have invested in smarter analytics and more
diverse sourcing to de-risk their supply chains, the
overwhelming response has been to pursue near-
shoring or localization plans for supply chains
(McKinsey, 2022). Re-shoring means lower efficiency
in the use of resources and thus lower GDP-growth,
now factored into IMF forecasts, and consequently
less demand for energy-related services.
The aviation and buildings sectors will see permanent
changes. Reflecting IATA and other forecasts, ETO
assumes that leisure air travel will rebound to pre-covid
growth rates in 2024. By contrast, with the pandemic
advancing the practice of virtual collaboration, business
travel will reduce permanently to 80% of its pre-covid
path. As leisure travel counts for two thirds of air travel,
however, the airline industry will experience a drop off
in air travel of only 7%. A similar, but weaker effect will
be found in real estate. Home office use will remain
higher than pre-covid forecasts and the people working
from home will demand more space there. Home office
expansion will dampen commercial and office space
demand. Bigger homes and smaller offices will tend to
cancel out and so the net permanent effect on energy
demand is marginal.
Rivalry between the major trading blocs created global
challenges long before the COVID-19 pandemic and the
Ukraine war. Yet both events have exacerbated the
deglobalization trend. Less trade will impact world GDP
negatively. Supply chains, notably for some critical metals
will experience increased vulnerability. Disruptions are
likelytohaveagreaterinfluenceonproductionofbatteries,
solar panels, and wind turbines than on the production
of fossil fuels. However, our analysis shows that for most
critical resources, such disruptions will eventually be
circumvented by alternative chemistries (for batteries),
new sites of production (for batteries, solar panels, and
wind turbines), and new materials. Yet, in the short run —
to 2030 — supply-chain disruption effects will delay the
transition. For example, we now expect the timing of the
‘yardstick’ measure for EV uptake (i.e. when EVs constitute
50%ofnewcarsales)tobedelayedbyanotheryear,to2033.
The pandemic and energy
Business travel will be permanently impacted by COVID-19, remaining 20% lower
throughout our forecast period relative to pre-pandemic projections.
22
DNV Energy Transition Outlook 2022
23
Energy demand CHAPTER 1
1.2 TRANSPORT
Current developments
The transport sector has seen pandemic-associated
reductions in energy demand in all subsectors — air, road,
rail, and at sea — albeit with significant differences. In 2020,
the combined demand across these sectors fell by more
than a tenth (11%). Aviation, which experienced the highest
percentage reduction, almost halving from 2019 to 2020,
has not yet fully recovered and will not do so in our forecast
period because business travel is expected to remain
lower than the pre-pandemic level. By contrast, energy
demand for maritime transportation fell by 4%, rail by 5%
and road by 7%.
In 2020, transport was responsible for 26% of global final
energy demand, supplied almost entirely by fossil fuels.
Figure 1.3 shows that 89% of transport energy use is oil,
with natural gas and biofuels taking 6% and 4% shares,
respectively, and electricity 1%. At present, the energy
mixes in aviation, maritime and road almost mirror that of
the global transport sector, whereas rail energy is mainly
from electricity.
To reduce local air pollution and global emissions, natural
gas and biofuels — either pure form or blended with
gasoline and diesel — were introduced decades ago.
Greater China and North East Eurasia have a leading
natural gas share (8%) in road transport. All regions, except
Middle East and North Africa, have biofuel-blend
mandates or give biofuels preferential treatment. Biofuel
mandates are prime examples of the role of public policy
in transport fuels. Decarbonization and fuel efficiency are
interlinked — some regions, notably Greater China and
OECD countries, use a mixture of push-and-pull policy
measures to achieve decarbonization ambitions. We
envisage public policy targeting and banning emissions
continuing for at least another decade, supported by
significant industrial and consumer approval.
Over time, though, technology cost-learning dynamics will
make such policies superfluous — at least in road transport,
which accounts for almost 75% of transport-energy use.
Vehicle manufacturers are increasingly overhauling their
strategies to cope with the looming market dominance of
EVs. For almost all use cases, EVs will soon become more
cost effective than internal combustion engine vehicles
(ICEVs). EVs typically have less than a third of the energy
consumption of ICEVs, and lower maintenance costs.
However, removing EV support too soon will reverse
EV-uptake dynamics (Testa and Bakken, 2018). If one
factors in both direct and indirect subsidies, EVs have
already reached cost parity with ICEVs in most world
regions, and sales will accelerate as an ever-larger range
of models enters the market.
Removing EV support too soon will reverse
EV-uptake dynamics.
EJ, TWh, or Mtoe? The oil and gas industry normally
presents its energy figures in tonnes of oil equivalents
(toe) based on m³ of gas and barrels of oil, whereas the
power industry uses kilowatt hours (kWh). The main
unit for energy, according to the International System
of Units (SI), is, however, joules, or rather exajoules (EJ)
when it comes to the very large quantities associated
with national or global production. EJ is therefore the
primary unit that we use in this Outlook.
So, what is a joule? Practically, a joule can be thought of
as the energy needed to lift a 100 g smartphone one
metre up; or the amount of electricity needed to power
a 1-watt LED bulb for 1 second (1 Ws). In other words,
a joule is a very small unit of energy, and, when talking
about global energy, we use EJ, being 1018
J, or a billion
billion joules.
While we use J or EJ as the main unit of energy, in a few
places we use Wh. For measurements of quantities of
energy production, we use tonnes, m³, and barrels.
For ease of comparison, conversions are:
1 EJ = 277.8 TWh
1 EJ = 23.88 Mtoe
Measuring energy; joules, watts and toes
*Mbpd = million barrels per day of crude oil.
53Mbpd*
89%of transport
demand
Oil for transport
29Mbpd*
51%of transport
demand
2021 2050
24
DNV Energy Transition Outlook 2022
25
Energy demand CHAPTER 1
Road
Vehicle fleet size, categories and dynamics
Standard of living (GDP/person) drives vehicle density
(vehicles per person). Regionally, this relationship is
influenced by geographical, cultural, technological,
infrastructure and environmental factors, and by the
availability of alternatives to road transport. To predict
future developments in vehicle density, we have fitted
historical data to a Gompertz-curve (a type of S-shape
curve), as illustrated in Figure 1.4. In some regions this
is supplemented by expert opinion, enabling us, for
example, to adjust for the effects of policy support for
alternatives to road transportation.
We break down the road transport sector into three
categories: passenger vehicles, commercial vehicles,
and two-and three-wheelers. ’Passenger vehicles’
encompasses all vehicles with three to eight passenger
seats; thus, it includes most taxis, but excludes buses.
Other non- passenger vehicles with at least four wheels
are considered ‘commercial vehicles’. These tend to be
a significant fraction of road vehicles in less-developed
countries; but, as these nations become more prosperous,
the passenger-vehicle share of the fleet increases. We
expect this trend to bottom out within the next few
years, however.
Taxis represent a significant fraction of today’s global
passenger-vehicle fleet. In the coming years however, a
number of structural changes must be taken into account
in calculating the overall size of the car fleet and, impor-
tantly, aggregate vehicle kilometres. Communal use of
passenger vehicles is typically more prevalent in low-
income regions. Because platform-based ridesharing
services can offer improved services at higher efficiency
and lower costs, this segment will continue to grow. A
reduction in private ownership will ensue, especially in
high-income regions. In addition, we assume automated
vehicles, which we will see increasingly towards mid-
century, are driven 50% more, and shared vehicles five
times as much, as conventional, privately-owned vehicles.
The latter is in line with the fact that taxis typically drive five
times as much as privately-owned passenger vehicles.
Consequently, an automated, communal vehicle will be
driven 7.5 times as much as a non-automated private
vehicle. The growing use of digitally-enabled forms of
transport (automation and ridesharing) may happen at the
expense of traditional public transportation, as well as
walking and bicycle use, but these modal shifts have not
been analysed. As we expect several factors to counter-
balance each other, we assume that aggregate vehicle-
kilometres driven will not be significantly affected by
automation or car sharing.
Image courtesy: Volvo Trucks.
27
Energy demand CHAPTER 1
EV uptake
The uptake of EVs — passenger EVs first — will occur
rapidly. Supported by contemporary findings (Keith et
al., 2018), we assume that people choosing to acquire an
EV will base their decision on weighing costs against
benefits. Within our approach, simulated buyers have
the choice between EVs (becoming increasingly
cheaper and providing a longer range over time) and
ICEVs in the categories: passenger vehicle, commercial
vehicle, and two- and three-wheelers. Potential buyers
of passenger vehicles will consider purchase price to be
the main factor, putting less emphasis on the advanta-
geous operating costs. Owners of commercial vehicles
will give greater weight to the advantages of EV opera-
tional costs.
Currently, having too few charging stations within range
or at the final destination (e.g. at home or at work) is a
major barrier to EV uptake in most regions. Significant
uptake of EVs cannot be achieved without both the
average fleet range leaping higher and charging-station
density increasing. We assume that the current battery
cost-learning rate of 19% per doubling of accumulated
capacity will continue throughout the forecast period.
Consequently, vehicle prices will fall in the long run, in
contrast to a near-term increase in the price of EVs due
to base material shortages and supply-chain problems.
In our view, higher prices will be partly mitigated by
rising competition among EV manufacturers and by
innovation such as cell-to-body and cell-to-chassis
configurations.
In Europe, the average battery size will grow from
today’s 60 kWh/vehicle to about 90 kWh/vehicle in 10
years, resulting in an expanded vehicle range and EVs
seeming even more attractive. Elsewhere, we will see
different average battery sizes, depending on regional
commuting and thus range needs.
Total cost of ownership
Total cost of ownership (TCO) is a purchase decision
construct, reflecting public policy support. Figure 1.5
shows that EV TCO will decrease only slightly between
2020 and 2025, as increasing battery sizes almost offset
lower battery costs. Moreover, material scarcity and
supply-chain constraints, including localization, will
place further pressure on vehicle costs, but will ease
over time due to competitive forces and innovation.
After 2030, low operating costs will start to inch driving
distances upwards, which will in turn raise the TCO per
vehicle.
Current policies impacting TCO include buyer incen-
tives for passenger EVs. Per vehicle, the value of these
incentives varies from zero in low-income countries,
to a few hundred USD in others, and to more than a
thousand USD in OECD regions. Both passenger and
commercial vehicles are supported by subsidies. When
calculating the value of subsidies, we have included
significant support provided to vehicle and battery
manufacturers.
The two countries with highest EV uptake rates, China
(commercial vehicles) and Norway (passenger vehicles),
use a mixture of preferential treatment of EVs and de
facto subsidies on the buyers’ side, as shown by Testa
and Bakken (2018). In Europe current policies favouring
EVs are implemented as vehicle-emissions limits, giving
carmakers bonuses for zero-emissions vehicles, and
surtaxing fleets that exceed the target (EC, 2019).
Commercial vehicles require much larger batteries,
and we expect significantly higher and more-prolonged
subsidy levels per vehicle. We assume that in OECD
regions, and Greater China, there will be willingness to
continue such support, which boosts commercial EV
uptake through the TCO effect by making ICEs less
attractive through higher carbon prices.
Aside from direct purchase and manufacturing subsi-
dies, a host of other preferential operating treatments
for EVs are used, including, among others, permission
to drive in bus lanes, free parking, and low-to-zero
registration costs or road taxes. Except in a few oil-rich
countries in Middle East and North Africa (Mundaca,
2017), direct fossil-fuel subsidies are not widespread.
On the contrary, road taxes are prevalent across the
world and, in OECD countries, typically also include an
explicit carbon tax element (OECD, 2019). We foresee
increasing tax and carbon-price levels to reflect local
air-pollution prevention, and efforts to limit congestion
and GHG emissions.
2021 2035 2050
0
4000
3000
2000
1000
5000
6000
Annualized passenger vehicle price
Units: USD
Combustion vehicle Electric vehicle
Commercial vehicle cost of ownership
Units: USD/Vehicle
2015 2020 2025 2030 2035 2040 2045 2050
Passenger vehicle cost of ownership
Units: USD/Vehicle
2015 2020 2025 2030 2035 2040 2045 2050
350k
300k
250k
200k
150k
100k
50k
0
120k
100k
80k
60k
40k
20k
0
Vehicle operating cost
Units: USD/100 km
2050
2021
10
5 15 25
0 20 30
Relative availability of gas stations for Petrol and EV
The size of stations are relative to each other for each year, and cannot be compared visually across years.
2021 2035 2050
Drivers of EV uptake
towards 2050
Today, new EVs tend to be priced higher than their combustion
counterparts, which is why many countries have subsidies and
incentives to support their uptake. EVs will become significantly
cheaper within a decade and remain cheap. As scale
advantages for Original Equipment Manufacturers (OEMs)
erode, combustion vehicle prices are likely to rise.
Despite the fact that EVs already have much lower running cost
per 100 km, private buyers mainly look at purchase price.
As upfront costs decline and total cost of ownership (TCO)
advantages become clearer, passenger and commercial EVs
will soon outcompete combustion vehicles.
Unlike private buyers, commercial owners are strongly
motivated by TCO calculations.
While EVs have already plunged through the fossil TCO line,
buyer behaviour lags cost developments as other
considerations like range and ease of charging come into play.
By 2050, 78% of all vehicles worldwide will be EVs.
This will significantly alter road transport infrastructure.
As ever more petrol stations are transformed into EV charging
facilities, range anxiety may become an issue for combustion
vehicles drivers.
26
DNV Energy Transition Outlook 2022
Figures are based on OECD data, including 2021 average gasoline prices, electricity prices and vehicle costs. Vehicle operating costs include maintenance costs.
28
DNV Energy Transition Outlook 2022
29
Energy demand CHAPTER 1
and automation. The passenger vehicle fleet climbs from
1.2 billion cars today to slightly above 2 billion in 2050,
with the ICEV share falling precipitously from 97% to
less than 25% by mid-century. Almost the entire fleet of
two- and three-wheelers will be electrified by 2040, while
EV uptake in commercial vehicles clearly lags develop-
ments in the other two categories.
We foresee that fuel-cell electric vehicles (FCEVs) will
only play a role in road transport after 2030. These will
account for up to 7% of the commercial EV fleet in China
by 2050, with modest single digit shares in the other
regions where hydrogen uptake is supported by respec-
tive policies. The cost and energy-efficiency disadvan-
tage of fuels cells compared with BEVs will prevent their
large-scale uptake in all but one market segment –
heavy, long-distance commercial vehicle transport.
But even in this category, a significant share will be taken
by battery electric trucking, sharing the market for non-
fossil transport with FCEV-propelled trucking. This
segment will also continue to use combustion technolo-
gies, although it should be noted that this also allows
for biofuel use. Whereas policy support is essential for
hydrogen uptake in the demand sectors, and some
countries, such as Japan and South Korea, strongly
support the uptake of FCEVs as part of their automotive
emission-reduction plans (see Chapter 9 for more
details), there are still significant barriers hindering a
stronger uptake of hydrogen in road transport. There
is a significant energy loss (by a factor of two) when
converting power to hydrogen. Additional well-to-
wheel efficiency reduction happens when hydrogen is
converted to electricity in the vehicle. Consequently,
FCEVs can only reach an overall well-to-wheel efficiency
of 25% – 35%, significantly lower than the 70% - 90%
range for BEVs. Furthermore, FCEV propulsion is more
complicated, and thus more costly, than that of BEVs.
For these reasons, most major vehicle manufacturers
appear to be introducing solely BEV models.
Two- and three-wheelers are a form of transport repre-
senting only marginal energy use in most regions — except
in Greater China, the Indian Subcontinent, and South East
Asia. Consequently, we have modelled vehicle demand
and electrification of two- and three-wheelers in those
three regions only, limited to those vehicles requiring
registration (electric bikes are categorized as household
appliances rather than road vehicles). We forecast rapid
electrification in this segment — already more than a third
of all Chinese two- and three-wheeler sales are BEVs.
Relative utility: EVs and ICEVs
In considering the relative utility of EVs compared with
ICEVs, we assume four factors, of different weight, to be
important:
— Recharging/refuelling speed
— Charging/fuelling stations within range
— EV convenience
— EV footprint advantage
The EV footprint advantage reflects the value, if any,
assigned to low-emission electricity as fuel and the
associated sustainability gains. However, even EVs
powered by electricity generated from a high-fossil
energy mix have superior lifetime carbon efficiencies
than size-equivalent ICEVs (ICCT, 2018). Comparing the
utility of EVs and ICEVs across the four factors listed
above, EV-uptake rates are significantly slower for
commercial than for passenger vehicles — despite
prolonged subsidies being expected.
Figure 1.6 reflects our forecast that EVs will reach 50% of
new passenger vehicle market share in Greater China and
Europe in the late 2020s, in the early 2030s in OECD
Pacific and North America, and globally by 2033. This
milestone is central in our forecast and has not changed
significantly between our Outlooks over the last five years.
In low-income regions, uptake will come later as early
uptake is hindered by a low density of charging infra-
structure and by the dearth of subsidies. However, even
in the region of slowest uptake, the 50% milestone will be
reached by mid-century. By 2050, hardly any ICEVs will
be sold in Greater China and Europe; sales of ICEVs will
continue elsewhere, notably accounting for 30% of new
passenger vehicles sales in North East Eurasia at that
time.
Electrification will be more prolonged for commercial
vehicles. The world is split into frontrunner regions and
laggards regarding uptake of commercial battery-
electric vehicles (BEVs). Greater China will see a 50% sales
share for commercial BEVs within five or so years, with
Europe following two years later, while North East Eurasia
will not see a 50% split in sales within our forecast period
(Figure 1.7).
Figure 1.8 shows our combined forecast for vehicle
numbers, including two- and three-wheelers, with
demand attenuated by an increase in both car sharing
30
DNV Energy Transition Outlook 2022
31
Energy demand CHAPTER 1
and, doubling them from our base case, will bring much
faster uptake — some 35 million more commercial EVs.
Note, however, that the main conclusion is that EV uptake
over time is not insensitive to subsidies, with support given
during early market uptake being the most important.
Our sensitivity analysis indicates that were manufacturers
to install larger batteries in their EVs, this would be
detrimental to short-term sales, if battery costs per kWh
remained the same. For example, a 25% increase in
battery sizes would lead to a 11% reduction in global EV
stock and 22% fewer EV sales in 2025. The long-term
impact, however, would be negligible.
Aviation
Prior to the pandemic, civilian aircraft consumed almost
9% of the world’s oil, and that share was growing. Driven
by rising standards of living, global aviation had tripled in
the first two decades of this century, revealing a clear
relationship between GDP growth and the number of
people that fly, and the number of flights they take. By
2050, we will see annual global passenger flights growing
to 10.2 billion flights (Figure 1.10), 130% higher than
pre-pandemic levels. The strongest growth will occur in
Greater China, followed by South East Asia. The growth in passenger trips occurs despite COVID-19,
which really put the brakes on air travel, which more than
halved from the onset of the pandemic. The rebound has
been slower compared with other sectors. While we do
not foresee a permanent effect on leisure travel, the
pandemic introduced new work patterns that will have a
long-term impact — re-basing business travel down 20%
through our forecast period.
Efficiency, as measured in energy use per passenger km,
will continue to improve due to efficiency gains in aircraft
and engine technology, better routes and operational
patterns, and some gains in higher load factors and larger
planes. Annual efficiency improvements will slow from
1.9%/year today to 1.2%/year in 2050 but cumulatively
they will lead to fuel use increasing by only 40% (Figure
1.11) despite a 140% rise in the number of flights. The
number of cargo flights will also increase, but aviation is
and will continue to be dominated by passenger flights.
Today, cargo trips represent 15% of global aviation energy
use (WEF, 2020), and we keep this fraction constant for all
regions and throughout the forecast period.
Conclusions
Despite the dampening effect on demand due to car
sharing and automation, the size of the global passenger-
vehicle fleet will increase by about two thirds by 2050. As
noted previously, vehicle-kilometres will also rise, more
than doubling by mid-century. A similar dynamic is
anticipated for commercial vehicles, though growth will
be slightly lower, with the fleet size expanding about 50%
towards 2050.
Importantly, the expansion of the world’s passenger and
commercial fleet over the next three decades will not
result in a similar pattern of growth in road-sector energy
demand. In fact, quite the opposite: road-sector energy
demand will be considerably lower in 2050 than it is
today, principally because EVs are three to four times
more efficient than vehicles with combustion engines.
Figure 1.9 shows that while over three quarters of vehicles
globally (78%) will be EVs in 2050, they will constitute just
about 30% of the road subsector’s energy demand, with
hydrogen FCEVs taking a further 3%. Mostly through
mandated blend rates, 3% of this sub-sectoral energy
demand will come from biofuel. The smaller part of the
vehicle fleet still reliant on fossil-fuel combustion will be
responsible for the lion’s share of energy consumption.
Fossil fuel oil constitutes close to 60% of the global road-
subsector’senergydemand in2050,with natural gas at 4%.
Sensitivities
New chemistries and configurations could drive the
already high cost-learning rates (CLRs) for batteries even
higher. A 50% higher battery CLR (27% instead of 18%)
results in 150 million more passenger vehicles (+11%) and
85 million more commercial vehicles (+50%) by 2050,
powered by batteries at the expense of combustion
vehicles.
Subsidy levels for passenger and commercial EVs, which
are assumed to be substantial, have a considerable
effect. Cutting them by 90% from the base case, will
result in six million fewer passenger EVs in 2050. Subsi-
dies are even more important for commercial vehicles,
World road subsector energy demand by carrier
and split between ICEs and EVs
World road subsector energy demand by carrier
and split between ICEs and EVs
2.8bn
electric
vehicles
0.77bn
combustion
vehicles
Electricity
33%
Oil
57%
Hydrogen and synthetic fuels
Bioenergy
Natural gas
In 2050, electricity is one third of energy
demand in road transport, but powers
nearly 80% of the global vehicle fleet.
32
DNV Energy Transition Outlook 2022
33
Energy demand CHAPTER 1
power are better suited for decarbonizing aviation
because they are viable drop-in fuels, using existing
infrastructure and combustion technology.
Weighing the different advantages of hydrogen and
e-fuels against each other, we will see three times more
e-fuels — a 13% share in the mix — than pure hydrogen in
the aviation subsector, principally because as a drop-in
option, e-fuels can serve all types of flights, whereas pure
hydrogen is limited mainly to medium-haul flights.
However, oil will remain the main fuel source for aviation,
retaining a 59% share in 2050, though in absolute terms oil
use will be 26% lower than today. The efficiency gains and
the gradual change in fuel mix mean that in our forecast,
aviation will fare better longer term than the (currently
under revision) CORSIA goals of carbon-neutral aviation
growth to 2050.
Maritime
Maritime transport is by far the most energy efficient
transportation in terms of energy per tonne-kilometre.
Consequently, over 80% of the volume of internationally
traded goods is carried by sea (UNCTAD, 2021). Nearly
3% of global final energy demand, including 7% of the
world’s oil, is presently consumed by ships, mainly by
international cargo shipping. The IMO regulation
capping the sulfur content of ship fuel came into force
in 2020, dramatically changing the type of fuels being
used. The main shift has been to a much larger share of
lighter distillates in the overall fuel mix, or other variants
of fuels with less sulfur. However, a significant share of
marine heavy fuel oil is still being used on ships with
scrubbers installed.
In the longer run, the IMO targets a 50% absolute
reduction in CO2
emissions between 2008 and 2050.
The strategy was established in 2018 and there is now
mounting pressure from regulators and parts of the
maritime industry for it to be further strengthened,
and, indeed, the IMO plans to revise the strategy.
Our analysis expects that the current target will be
met through decarbonization involving a mixture
of improved fleet and ship utilization, wind assisted
propulsion, on-board CCS, energy efficiency improve-
ments and a massive fuel switch including conversion
from oil to gas and ammonia and other low- and
zero-carbon fuel alternatives. Potential for electrification
in the maritime subsector is limited to shore power
when berthing and to the short-sea shipping segment.
This is because the energy density of batteries today
and in the future is likely to remain too low to play any
sizeable role in deep-sea shipping. In the short term,
the IMO’s 2020 target for reducing sulfur emissions will
result in an increase in carbon emissions as scrubbers in
particular require additional use of energy that other-
wise would be used for propulsion.
A world in which GDP doubles by 2050 will see cargo
transportation needs considerably outweighing
efficiency improvements. Cargo tonne-miles will
therefore increase in almost all ship categories
(Figure 1.12), with a total growth of 35% between 2020
and 2050. The later part of the forecast period will see
growth in some categories such as gas carriers, but also
reductions in most segments as efficiency improve-
ments equal demand growth and ongoing decarboniza-
tion is reflected in global trade patterns. Consequently,
coal transport halves by 2050 in tonnes, and crude oil and
oil products transport reduces by 20%.
Fuel mix
From a technology standpoint, aviation has relatively
few options to replace oil-based fuel and is frequently
termed a hard-to-abate sector. Yet, with a limited set of
stakeholders, and an international governance structure
enabling decision-making, it could be relatively easy to
implement and monitor the uptake of technologies and
fuels that emit less GHGs. However, even if alternatives to
fossil fuels progress in the future, they are still prohibitively
expensive and less readily available in terms of supply and
infrastructure.
Batteries weight makes electrification a realistic propul-
sion option only in the short-haul flight segment.
Deployment of electric airplanes is likely to start before
2030 on very small aircrafts with fewer than 20 passengers,
expanding in the 2030s to slightly larger short-haul
planes in leading regions. Batteries have very low
energy density, and only hybrid-electric solutions are
relevant for medium and long-haul flights. Since only a
minor part of aviation fuel is consumed on short-haul
flights, electricity will represent only 2% of the aviation
fuel mix in 2050.
The two remaining routes investigated and expected
to change the aviation fuel mix are pure hydrogen and
sustainable aviation fuels (SAF), including biomass-
based first- and second-generation fuels as well as
power-to-liquid- / e-fuels based on hydrogen. Common
to all alternative solutions is that costs, both short-term
and towards 2050, will be higher than current oil-based
fuel. All changes in fuel and technology are therefore
expected to come as the result of regulatory and
consumer-supported forces. Examples include the
ReFuelEU Aviation initiative in the ‘Fit for 55’ legislative
package, higher carbon pricing from removal of free
allowances to aviation in the future EU emissions-trading
scheme (EU ETS) (EC, 2021), and individual willingness
to pay for sustainable aviation.
As an aviation fuel, pure hydrogen has some advantages
over SAF. Produced from renewable sources, a hydrogen
value chain in aviation could guarantee almost zero
emission transport, assuming the produced by-products
(water vapour and NOx emissions) are treated carefully.
However, hydrogen is less suitable from a technical
perspective due to its low energy density. The tanks
needed for the large amount of hydrogen would require
a very different airplane design with higher costs per
passenger. Furthermore, the implementation of new
designs takes at least 20 years due to the long operating
life of aircraft. Aircraft design and infrastructure adjust-
ments, handling and safety regulation would also need
to adjust to evolve in synchrony with technology devel-
opments. All these barriers to a widespread implemen-
tation of pure hydrogen in aviation before mid-century
result in its relatively small share of around 4% of the
subsector's energy demand by 2050.
Bio-based SAF is already implemented at small scale
because of mandatory biofuel blend rates in certain
countries and is expected to scale relatively fast given
regulatory push and consumer pull. Thus, in the short
and medium term, SAF is likely to consist mainly of
biofuels. As described in the bioenergy section in
Chapter 3.5, providing large amounts of sustainably
produced biofuel is a challenge, but aviation has fewer
decarbonization options and a higher ability to pay. We
will see small shares of e-fuels based on hydrogen in
aviation from the 2030s onwards, but, as with hydrogen
in general, significant uptake will only happen in the
2040s. Liquid SAFs from biogenic origin or renewable
34
DNV Energy Transition Outlook 2022
35
Energy demand CHAPTER 1
For passenger transport, especially in urban areas, the
space efficiency of rail transport is superior to other
options. The ease of electrification also makes it a
favourable option for transport decarbonization.
Growth can also be explained by the increasing speed
and competitiveness of high-speed trains compared
with aviation, again with decarbonization as a main
driver. The greatest passenger growth will happen in
the Indian Subcontinent and Greater China, driven by a
significant rise in standards of living, and a strong public
policy push for rail transport development. As Figure
1.14 shows, almost all passenger rail growth will be in
these two regions, with Indian Subcontinent having a
57% share in global rail passenger transport in 2050,
and Greater China 27%.
In all regions apart from Europe, where rail freight has
traditionally been strong, GDP growth and transport
sector decarbonization strategies are drivers of
increased rail freight volumes. Europe has seen the
greatest increase in road-freight demand, but the
region’s potential for further growth in rail freight is
constrained by already-crowded tracks, improved roads,
and prioritization of passenger rail transport.
Energy-efficiency improvements will be strong and relate
mainly to electrification, though diesel-powered units will
also experience significant efficiency gains. As Figure
1.15 shows, we predict that current growth trends in
electrification will be sustained to meet demand for rail
transport, with the fuel mix in 2050 becoming 54%
electricity (41% today), 41% diesel, and 5% biofuel.
Hydrogen has potential to replace diesel on non-
electrified rail. Though single projects are frequently
announced, such as the world’s largest fleet of hydrogen
trains to be operated close to Frankfurt, Germany, with a
total volume of 27 hydrogen trains, no large-scale use of
gaseous energy carriers (e.g. hydrogen) in rail transport is
foreseen. This is due to barriers such as limits in pulling
power for rail freight transport, a need for governmental
support, and the lack of installation of a hydrogen fuelling
infrastructure along main rail tracks.
World cargo shipping is an integral part of our analysis.
Fossil-fuel demand and supply are regionally deter-
mined: any mismatch between regions is shipped from
the regions in surplus to those in deficit. There is also
considerable seaborne transport of fossil fuel within
regions. Similarly, base material supply and manufac-
tured products are shipped on keel within, and, more
importantly, between regions.
Fuel mix
Driven by the decarbonization push, the fuel mix in the
maritime subsector will change significantly over the
coming decades. It will transition from being almost
entirely oil-based today to a mix dominated in 2050 by
the use of low- and/or zero-carbon fuels (50%), natural
gas (19%, mostly liquefied natural gas) and biomass
(18%), as shown in Figure 1.13. Ammonia will have the
highest share (35%) of low-and zero-carbon fuels and
e-fuels 15%. Electricity will have only 2% for reasons
previously explained.
This massive fuel switch will be supported by many
regionally imposed decarbonization efforts. In our main
ETO forecast, we use one of several scenarios analysed
within “IMO ambitions” in our Maritime Forecast to 2050
(DNV, 2022c). That report details 24 scenarios across two
maritime decarbonization pathways: IMO ambitions
complying with the current IMO GHG Strategy, and
Decarbonization by 2050 achieving net-zero shipping by
then. The report’s fuel mix information is included here,
converted into the main energy-carrier categories used
in this Outlook.
Rail
This subsector consists of all rail-using transportation,
including urban rail systems. In 2020, a little less than 2%
of global transport energy demand was from rail, about
0.5% of global energy demand. Passenger numbers will
more than double (+140%) globally by 2050, driving rail
travel up to 9.9trn passenger-kilometres.
Rail freight transport grows 90% by mid-century, with
significant regional differences. The strongest growth is
expected in Greater China, where rail freight demand will
double in the next three decades while the equivalent
demand in Europe remains stable.
DNV Maritime Forecast to 2050
36
DNV Energy Transition Outlook 2022
37
Energy demand CHAPTER 1
Despite increasing electrification and improvements in the
efficiency of thermal insulation and heating/cooling
equipment, global energy demand for buildings is set to
grow nearly a quarter (24%) in the next three decades, from
120 EJ per year in 2020 to 148 EJ per year in 2050. The
sector’s share in final energy demand is also expected to
grow slightly from 29% now to 30% by mid-century. This is
mainly driven by an increase in population and therefore in
floor area demand, as well as a rise in per capita incomes
leading to growing demand for space cooling and other
electric appliances. Global warming further intensifies the
demand for cooling. However, thanks to significant energy
efficiency gains, energy demand will not grow as fast as
what would have been implied by trends in population,
incomes, and average temperatures.
In 2020, 29% of the world’s total final energy and 48% of
global electricity was consumed in buildings. About
three-quarters (88 EJ) of this final energy demand was in
residential buildings, and the rest (32 EJ) in commercial
buildings including private and public workspaces, hotels,
hospitals, schools, and other non-residential buildings.
Total CO2
emissions from this sector, including indirect
emissions associated with electricity and hydrogen
production, amounts to 8 GtCO2
, or about a quarter (25%)
of total energy-related CO2
emissions.
As the world population continues to increase and the
standard of living rises across the world, we will see a
continuation of the historical growth in energy services
provided in the buildings sector. However, the associ-
ated energy consumption will not increase at the same
speed thanks to energy-efficiency improvements,
driven by higher efficiency standards, continued decline
in the costs of energy efficient technologies and
improvements in the building stock. For example,
heat pump technology enables heat provision with an
efficiency above 300% (the ratio between useful heating
energy provided over the electricity used). Figure 1.16
shows developments in useful and final energy demand
for four different end uses in buildings. As a general
pattern, note the starkly different growth rate in the two
bars representing useful and final energy demand a
result of improving efficiencies in equipment. This is
most visible in space cooling which, despite the improv-
ing efficiency, is still expected to be the most important
source of growth in energy demand from buildings over
the next three decades.
1.3 BUILDINGS
Zero Carbon Building in Hong Kong
38
DNV Energy Transition Outlook 2022
39
Energy demand CHAPTER 1
in demand for appliances and lighting services that leads
to an energy demand growth in this subsector (residential
and commercial buildings combined) of 87% between
2020 and 2050. In terms of this end use, the Indian
Subcontinent, Sub-Saharan Africa, and South East Asia
are the top three fastest growing regions. This is linked
to rapid increases in both access to electricity and per
capita incomes in these regions. Another reason is the
expansion of off-grid solar PV in these vast regions where
grid-coverage is often sparse. Where electricity load is
low due to large distances, the cost of grid connection is
high, and off-grid solar PV systems will be an economically
feasible alternative for lighting and basic applications
such as mobile phone charging. Although off-grid solar
PV represents only 1% (511 TWh) of global electricity in
2050, it could meet 45% of Sub-Saharan Africa’s energy
demand for appliances and lighting, and up to 18% of
such demand across the Indian Subcontinent.
The energy consumption of cryptocurrencies like bitcoin
continues to draw significant attention. Concerns
escalated when the price of bitcoin surged to over 65,000
USDin late 2021,makingminingmore attractive.Electricity
consumption from bitcoin mining is estimated to be
40-180 TWh per year (University of Cambridge, 2022), or
0.2-0.8% of global electricity consumption. The explosive
growth in electricity-intensive bitcoin mining has raised
concerns over the capacity of grids to respond to this
rapidly rising demand and over its environmental impact.
Future demand for mining of bitcoin and other crypto­
currencies is linked to government actions that help or
hinder their use. China, for example, completely banned
domestic cryptocurrency mining and the use of associ-
ated exchanges in 2021. On the other end of the spectrum
are crypto mining-friendly countries like Kazakhstan or
some US states like Texas, whose policies see crypto
mining businesses as a potential boon to their economies.
Building stock
The floor area of the building stock is one of the most
important drivers of energy demand in buildings, since
energy consumption in key end uses, such as space
heating and cooling, scale with floor area. In 2020, the
total global floor area of residential and commercial
buildings covered 250,000 km², just above the size of the
United Kingdom. The floor area of residential buildings is
expected to grow globally by 52% through to 2050, while
commercial floor area will more than double in line with
the growth in economic activity. This will result in a 64%
expansion of residential/commercial floor area.
Figure 1.17 shows developments in buildings' final
energy demand by energy carrier. The most salient
feature of the graph has to do with electricity taking an
increasingly larger share in the mix, up from 32.5% in
2020 to 55.5% in 2050. This reflects the growing domi-
nance of more efficient electric appliances in buildings,
most importantly heat pumps. The growing share for
electricity mostly comes out of the share of natural gas
and biomass, going down from 29% in 2020 to 18.5% in
2050 and from 24% in 2020 to 14% in 2050, respectively.
In the 2030s, we will start to see hydrogen use for heating
purposes in buildings rising to a modest 1.6% share in the
energy mix by 2050. This will be mostly in the form of
hydrogen blended into natural gas pipelines at first,
transitioning to some use of pure hydrogen as fuel further
ahead. As outlined in more detail in DNV’s Hydrogen
Forecast to 2050 (DNV, 2022a) published earlier this year,
hydrogen use will be rather limited in buildings because
it will be relatively expensive from a levelized cost
perspective, losing out competitively to increasingly
cost-efficient heat pumps.
Appliances and lighting
In 2020, appliances and lighting used 24 EJ of final energy,
20% of global buildings energy demand. We expect this
demand to reach 45 EJ by 2050, with its share of global
buildings’ energy demand rising to 30%. This projection is
despite significant expected improvements in the energy
efficiency of appliances and lighting. First postulated by
Jevons (1865) in the context of the impact of blast-furnace
efficiency on coal consumption, the Jevons Paradox
asserts that efficiency gains will lead to a demand increase
as savings from efficiencies will be used to consume more.
This rebound effect has many examples, from cars to
refrigerators, across various times and cultures.
When it comes to the energy intensity of appliances and
lighting, measured as watt-hours per US dollar of GDP, the
top two most energy-intensive regions are OECD Pacific
(OPA) and North America (NAM) (Figure 1.18). Greater
China (CHN) and the Indian Subcontinent (IND) are the
least energy-intensive economies in this regard. This
ranking is not expected to change dramatically by 2050
(except that Greater China replaces the Indian Sub-
continent as the least energy-intensive for appliances
and lighting). However, these regions are expected to
converge somewhat, with higher-income economies
becoming generally more efficient in terms of appliances
and lighting use and lower income regions requiring more
appliance and lighting energy per unit of GDP. In 2020,
energy intensity of this end use ranges from 20 Wh/USD
(IND) to 85 Wh/USD (OPA) but this range narrows slightly
to between 21 Wh/USD (OPA) and 78 Wh/USD (CHN) in
2050.
We expect the steepness of the relationship between
GDP and appliances’ energy consumption to reduce very
gradually (by 0.6% per year) in unit energy intensity.
These modest efficiency gains contrast with the rapid rise
Despite increasing electrification and
improvements in the efficiency of thermal
insulation and heating/cooling equipment,
global energy demand for buildings is set
to grow nearly a quarter.
40
DNV Energy Transition Outlook 2022
41
Energy demand CHAPTER 1
temperature and reference indoor temperature
of 21.1°C) as a result of global warming;
— Developments in building-envelope insulation
that reduce the loss of cool air inside buildings;
— Improved efficiency of air conditioners.
Growth in floor area, increasing market penetration of air
conditioners and increasing CDD; all heighten cooling-
energy demand, while developments in building-
envelope insulation and improved efficiency have a
dampening effect. The increase in final energy demand
for space cooling due to greater floor area and more use
of air conditioners will exceed savings from insulation and
improved equipment efficiency, thus resulting in a
quadrupling of energy demand for space cooling. This is
despite a 30% increase in efficiency and an insulation and
retrofit-driven reduction in energy losses of 28% on
average between 2020 and 2050.
This quadrupling also has regional variations, mostly
driven by the increases in CDD and in air conditioner
penetration, the latter due to rising income levels. North
America presently accounts for half of global electricity
demand for cooling. However, in 2050, about 30% of
cooling demand will be from Greater China, and only 14%
from North America. Europe’s electricity consumption for
cooling will grow by a factor of 2.7 between 2020 and
2050 (Figure 1.21).
Those regions with the greatest economic growth also
happen to be those that demand the most cooling,
measured in CDD. Currently, four regions have CDD
above 1000 Celsius degree-days per year: IND, MEA,
SEA and SSA. Collectively, their economic output is
expected to more than triple by 2050. The result would
be a ten-fold increase in electricity consumption associ-
ated with space cooling for these regions (Figure 1.21).
By mid-century almost half of all energy consumed for
cooling will be in these regions with high CDD.
Global warming will drive an increase in
cooling degree-days and hence energy
demand
Figure 1.19 shows forecast developments in the shares of
residential and commercial buildings in five selected
regions. The share of commercial buildings is expected
to grow in all these regions, with GDP growth outpacing
population growth. This is most visible in regions such as
Greater China and the Indian Subcontinent, where GDP
will be growing much faster than population.
By 2050, Greater China’s total floor area will be about
105,000 km2
, which is equal to the current (2020) floor
area across all four of the regions shown in Figure 1.19.
It is perhaps not surprising then that buildings in Greater
China will continue to consume about one-sixth of energy
use in buildings globally.
Figure 1.20 shows trends in total floor area of buildings in
the same regions, distinguishing between new buildings
(25 years) and old buildings (25years). Globally, the
share of new buildings in total floor area is expected to
fall from 63% now to 58% by 2050, although there are
differences across regions and over time in this trend.
New building lifetime is driven by the region’s GDP per
capita. In higher-income regions, where existing build
quality is higher and population growth is slower, build-
ing stock renewal will be slower, resulting in a higher
average age of buildings. The age distribution of build-
ings has implications regarding the ease and cost of
adoption of new and more-efficient technologies and
insulation. In higher-income parts of the world, where the
building stock is older, governments should provide
stronger incentives for energy efficiency as part of their
emissions-reduction policies.
Space cooling
We estimate that space cooling accounted for only 5.3%
of the buildings' energy demand in 2020 but predict an
increase to 18% by 2050, with a roughly 60-40 split
between residential and commercial buildings, respec-
tively. Energy demand for cooling will grow from 6.3 EJ
per year in 2020 to 26.7 EJ per year in 2050.
Demand for space-cooling energy is shaped by five
factors which are:
— Growth in floor area that requires cooling;
— Increasing market penetration of air conditioners, as
increases in both income levels and standards of living
mean more people can afford them;
— Increasing cooling degree-days (CDD; the cumulative
positive difference between daily average outdoor
42
DNV Energy Transition Outlook 2022
43
Energy demand CHAPTER 1
Space and water heating
Space and water heating accounted for 32% and 21%,
respectively, of the buildings sector’s total energy
consumption in 2020, respectively. With increase in
population and greater floor area, demand for space
heating will also continue to grow, rising 9% in terms of
useful heat demand by 2050. Improvements in insulation,
and fewer heating degree days (when energy is required
for heating buildings) due to global warming, will help
reduce the rate of this growth. GDP per capita is the main
driver of demand per person for water heating in residen-
tial buildings. The water heating demand of commercial
buildings — about 26% of total final energy used for water
heating — is driven primarily by floor area. Globally,
demand for hot water will rise more than 60% from
11.4 EJ of useful heat in 2020 to 18.4 EJ in 2050.
Regions with colder climates (North East Eurasia, North
America, Europe, and Greater China) create most of
the demand for space heating. For water heating, the
regional differences are mostly driven by standard of
living. In higher-income regions, increasingly efficient
hot water tanks are used continuously to serve multiple
needs, from daily showers to washing dishes. In some
lower-income countries, water is heated as required for
basic needs using inefficient methods.
Average efficiency of heating equipment is defined as
the ratio of useful energy provided to final energy
demand. This efficiency varies widely between technolo-
gies, from less than 10% for traditional open wood-burn-
ing to more than 300% for heat pumps. Heat pumps
extract more energy in the form of heat from the air or
earth than the energy they consume in the form of
electricity. Figure 1.22 shows developments in the share
of heat pumps in providing useful heat and in final energy
use. It also tracks the impact of these developments in
technology uptake on the overall efficiency of space and
water heating. By 2050, heat pumps will provide 51% of
total useful energy for space heating and 20% for water
heating, while using only 19% and 5% of final energy,
respectively. Thanks mainly to the expected transition
from less efficient technologies such as gas boilers to
using heat pumps for space and water heating — and
because of gradual efficiency improvements in technolo-
gies — we see average efficiency rising from 0.94 in 2020
to 1.58 in 2050 for space heating, and from 0.46 to 0.76
for water heating.
Although energy-efficiency improvements in buildings
are typically profitable, governments face challenges in
encouraging homeowners to implement such measures.
One prominent example is the UK government’s Green
Spraying Eco wool insulation in a home. Policies to incentivize energy efficiency improvements need to overcome
underinvestment due to split incentives.
Deal scheme. It aimed to support the retrofitting of 14
million homes by 2020 but was terminated by 2020 after
only 14,000 supported retrofits in 2016, and is now being
widely seen as a failure (Rosenow and Eyre, 2016). One
factor that hinders energy efficiency retrofits is the ‘split
incentive’ mechanism that arises in the rental sector
where the homeowners' interests differ from those of
tenants, with the costs of retrofitting typically borne by
the landlord, and the benefits accruing mostly to the
tenant. Smarter policy interventions are needed to tackle
split incentives that frequently result in underinvestment
in efficiency measures. In our forecast, we expect a 24%
reduction in space heating demand by 2050 due to
better insulation and retrofitting, representing a relatively
modest improvement trajectory.
The increased uptake of heat pumps is a result of the
reduction in their cost, helped by cost-learning feedback
loops where the cumulative installed capacity of the
technology brings down production costs. Costs vary
between regions, but with a global learning rate of 20%
decreasing gradually to 12% in 2050, we expect to see a
reduction by mid-century in the levelized cost of heating
by heat pumps in all regions (except for North East
Eurasia, due to rising electricity prices). This cost reduc-
tion is expected to be between 17% and 34% for various
44
DNV Energy Transition Outlook 2022
45
Energy demand CHAPTER 1
regions, and 25% on average. Figure 1.23 presents the
average levelized cost of selected heating technologies
per MWh of heat for selected regions. This contains the
fuel cost and the annualized investment cost over the
equipment’s lifetime. European households carry a tax
burden averaging over 30% of the electricity price,
whereas the rates are less than half of this is other regions.
Thus, although heat pumps reach a levelized cost parity
with gas boilers in Greater China during the 2020s, they
remain relatively expensive in Europe. Nonetheless, in
some local markets like Norway, where cheaper electricity
prices reduce operating costs, and long winters ensure a
higher investment profitability, heat pumps constitute the
majority of the market even though cold temperatures
mean a lower seasonal coefficient of performance. Thus,
in Europe, heat pumps maintain over 30% market share in
space heating capacity additions, going as high as 70% by
2050. Globally, heat pumps will provide about 40% of the
useful heat for space heating in 2050 while consuming only
19% of the total final energy supply.
The move away from traditional biomass stoves for water
heating is another big driver of efficiency improvements.
Although consuming 25% of the final energy used globally
forwaterheatingin2020,traditionalbiomassonlyprovided
7% of the useful energy. Increased energy access will bring
the final energy represented by traditional biomass to 15%
by 2050, resulting in savings of 2.5 EJ per year.
Figure 1.24 shows developments in the global energy
mix for space and water heating in buildings, and total
final energy demand for each end use. As a result of the
above developments, final energy demand for water
heating will stay stable in the range 24 to 25 EJ from 2020
to 2050, with a slight shift from residential to commercial
buildings. Final energy demand for space heating will fall
from 38 EJ per year to 25 EJ per year in the same period
with further implementation of insulation and retrofitting
measures, and as the use of heat pumps spreads. In terms
of energy mix, we see a stronger growth in electricity in
space heating than in water heating. In space heating, the
share of natural gas shrinks, giving way to electricity and
to direct heat. Water heating will be more stable, both in
terms of total energy demand and energy mix, the only
notable development being natural gas replacing
biomass.
Cooking
There are large regional variations in cookstove use. We
estimate that globally in 2020, almost half of the cooking
46
DNV Energy Transition Outlook 2022
47
Energy demand CHAPTER 1
energy demand is provided by traditional biomass
stoves, which entails burning biomass such as animal
waste, charcoal, and wood. This represents 25% of the
population, the majority of whom live in Sub-Saharan
Africa (SSA) and Indian Subcontinent (IND). By 2050, the
share of traditional biomass stoves will reduce to 31%,
primarily replaced by electric and modern biomass stoves
(Figure 1.25). Even the phasing out of traditional biomass
stoves has regional variations. In IND, traditional biomass
stoves are replaced by electric and gas stoves, while in SSA
they are mostly replaced by modern biomass stoves, due
to availability and affordability of different energy carriers.
In 2020, cooking was responsible for 22% of the energy
consumption in buildings (26 EJ per year), and about 6%
of all energy consumption. Despite population growth
and an increase in the number of households, final
energy demand sees hardly any growth, remaining at 27
EJ year in 2050. This is the consequence of electrification
and adoption of efficient cooking stoves.
We assume that a typical household needs 4.3 GJ per
year of useful heat for cooking, based on estimates in
2014 of final energy use for cooking (IEA, 2017b). Due
to heat losses in the process, this amount of cooking
requires 12 GJ of final energy, in the form of fossil fuel,
bioenergy, or electricity. By 2050, the global average
household size is expected to decline to 2.4 (Ürge-Vorsatz
et al., 2015), which will reduce final energy demand for
cooking to 7 GJ per year per household. Accounting for
the increase in the number of households, we expect
global total useful energy demand for cooking to rise
from 6 EJ per year in 2020 to 8 EJ per year in 2050.
Ultimately, lower-income countries will seek to reduce
both burning of solid biomass for cooking and the local
use of kerosene, a major health hazard that is responsible
for many deaths because of household air pollution.
By 2050, the population without access to modern
cooking fuels will decline by 44%, bringing large efficiency
improvements that will be further boosted by switching
from coal and oil to electricity and modern biomass
cooking stoves. Gas stoves, using methane, persist in the
cooking energy mix, their share growing slightly from 27%
in 2020 to 29% in 2050. This will have implications for
indoor air pollution and respiratory health in regions with
high use of gas stoves, such as North America (Lebel et
al., 2022), notwithstanding the warming implications of
methane leaking to the atmosphere.
1.4 MANUFACTURING
Manufacturing is currently the largest energy consumer
at 133 EJ (32%) of final energy demand in 2020.
Despite substantial energy-efficiency gains and
increased recycling and reuse of materials and goods,
the sector’s energy demand will keep growing. Most of
the increase will occur within the current decade, as
energy demand will grow by 16% to 154 EJ by 2030.
Demand will then slowly reach a plateau at ~162 EJ by
mid-2030s, staying at around that level until 2050.
Figure 1.26 shows the sector’s energy mix today being
dominated by fossil fuels, in particular coal and natural
gas, which together supply more than half of its final
energy. Their combined share will progressively decline
in favour of direct electrification, hydrogen, and bioen-
ergy. But the high heat often required poses a problem
for using decarbonized alternatives. This is why the iron
and steel, chemicals and cement production industries
are often described as ‘hard-to-abate’, as they cannot
easily be decarbonized through electrification.
48
DNV Energy Transition Outlook 2022
49
Energy demand CHAPTER 1
Sectoral energy demand
Trends, regulatory frameworks and technological
possibilities are different in the various subsectors that
are modelled in the Outlook, and details of the evolu-
tion of both energy demand and fuel mix are provided
in Figure 1.27.
Iron and steel
The steel production subsector is the single biggest
energy user in manufacturing, representing 35 EJ (31%)
of the whole sector’s energy demand in 2020. Steel
production has doubled in two decades, due mainly to
infrastructure and industrial developments in China; we
forecast it will increase 15% to the mid-2030s, thereafter
plateauing.
Steel production involves two main, competing methods,
with different inputs and energy needs:
— Blast furnace, basic oxygen furnace (BF-BOF), is the
conventional method. It converts virgin iron ore into
steel in a very energy-intensive process using coke, a
coal derivative, as a reducing agent.
— Electric arc furnace (EAF) uses scrap steel or direct
reduced iron. EAF is much more energy efficient,
needing on average 54% less energy per tonne of steel
compared with BF-BOF.
EAF’s share in global steel production will progressively
increase from 26% in 2020 to 49% in 2050 (Figure 1.28),
driven by reduced demand for steel and an increasing
quantity of scrap steel becoming available.
Consequently,energydemandforsteelmakingwillplateau
around 40 EJ from 2030. Coal use will progressively
decreasebutwillstillmeetmorethanhalfofthesubsector’s
energydemandbythen.Steelwillplayakeyroleinsustain-
ingdemandforcoalthroughtomid-century.Thesubsector
accounted for a sixth of global demand for coal in 2020.
In 2050, steel will represent a third of that demand.
The increased share of EAF will lead to a 58% increase in
electricity demand for steelmaking, from 1.3 PWh in 2020
to 2.1 PWh in 2050. A drive towards ‘green’ steel and DRI
will increase the subsector’s use of hydrogen for energy,
from practically zero today to 9% of its fuel mix by 2050.
China and the Indian Subcontinent will together account
for two thirds (62%) of total hydrogen consumption for
iron and steel production in mid-century, and a fifth (20%)
will go to European steelmaking.
Although most steel production is for domestic markets,
steel and its by-products are globally traded commodi-
ties. Production is today dominated by China. Steel plants
in China today are 15 years’ old on average, and even if
demand there declines, these plants will have a few more
decades of economic lifetime ahead of them (IEA,2020).
China will thus remain the main steel producer, with the
Indian Subcontinent playing a growing second-place role.
Chemical and petrochemical
This subsector includes the manufacture of plastics and
other petrochemicals, including ammonia and methanol
used as feedstock. It traditionally needs fossil fuels as
feedstock for the final product as well as for energy, as the
atoms from these fuels are embedded into the plastics,
fertilizers and other final chemical products produced.
This closely linked non-energy use is accounted for
separately (see Section 1.5).
The subsector’s energy demand is expected to grow by
about half from 21 EJ in 2020 to 31 EJ in the mid-2030s,
then slowly decrease to 26 EJ in 2050. The variation of
energy demand is mostly attributed to demand for virgin
plastics. This demand is initially expected to continue
increasing exponentially but will become progressively
attenuated by higher recycling rates in all regions (see
Section 1.5 for more details).
Energy and non-energy uses are for the most part
intertwined in today’s industrial processes. Future
processes like green ammonia production or electrified
steam cracking will progressively decouple these two
distinct uses in the subsector.
However, long-life, multi-billion-dollar petrochemical
sites operate on a fragile equilibrium. Heat recovery is
well-developed, and excess heat or by-products from
some processes often fuel others. Retrofitting options are
consequently limited, as are potential energy-efficiency
gains. This leads us to expect a slow transition in the
energy mix, slow uptake of hydrogen for energy, and slow
electrification.
50
DNV Energy Transition Outlook 2022
51
Energy demand CHAPTER 1
Cement
Making cement, the main raw material for concrete, is
also very energy-intensive, accounting for 11 EJ (8%) of
manufacturing demand in 2020. Cement has turned into
an indispensable raw material for construction around
the world but is under scrutiny due to its high carbon
footprint (see discussion, opposite).
In recent decades. cement production has more than
doubled from 1.7 billion tonnes in 2000 to 4.2 billion
tonnes in 2020. Most of this growth is attributed to
massive development in buildings and infrastructure in
Greater China, where around half of all cement production
occurs today. Global production will increase only slightly
in the future, to 5.0 billion tonnes in 2050, as production
in China slows and other regions such as the Indian
Subcontinent step in.
Most energy demand for cement making is related to
energy-intensive production of clinker, the binding
constituent of cement. Dry kilns where most clinker
production takes place today are long-life equipment
and already quite energy efficient. Energy-efficiency
gains will be obtained by reducing the overall share of
clinker in cement, and the subsector’s energy demand
will plateau around 12 EJ from 2030 onwards.
For the 1,500°C high-heat clinkering phase, the subsector
relies heavily on coal, oil (as petroleum coke, ‘pet coke’,
a by-product of oil refining) and, to a lesser extent,
natural gas.
Recycling schemes in some regions have also created an
abundant source of highly calorific and subsidized waste
to fuel the process. The cement industry, in Europe in
particular, has thus specialized in energy recovery, which
is expected to grow. The corresponding share of bioen-
ergy is expected to increase, but political decisions and
competition from recycling technologies will limit the
available waste stream.
Hydrogen and electrification are expected to play limited
roles, due to the necessity to abate the process emissions
of cement regardless of the energy mix. The fuel mix will
remain highly carbon-intensive, and decarbonization
goals will be covered with carbon capture and storage.
Manufactured goods
The manufactured goods subsector includes production
of general consumer goods; food and tobacco; electron-
ics, appliances, and machinery; textiles and leather; and
vehicles and transport equipment.
In 2020, manufactured goods energy demand was 42 EJ.
As economies grow, the demand for finished goods
experiences a similar rise. Despite efficiency improve-
ments, this expected growth in demand will lead to an
increase of 26% in the subsector’s annual energy demand
by 2050.
The subsector’s great diversity is reflected in its energy
use and fuel mix. Fossil fuels cover half of its energy
demand now, but their share will progressively decline
as electricity, bioenergy, and hydrogen to a lesser extent,
become attractive options to fuel the usually low- or
medium-temperature industrial processes.
Around 60% of today’s energy demand is concentrated in
three regions: Greater China, the Indian Subcontinent and
Middle East and North Africa. These regions will continue
todominate,buttheIndianSubcontinent will progressively
take over China’s leading position and will represent a
third of the subsector’s energy demand by 2050.
Base materials
The base materials subsector covers the production of
non-metallic minerals (excluding cement); non-ferrous
materials, including aluminium; wood and its product,
including paper, pulp, and print.
These energy-intensive industries had an energy
demand of 20 EJ in 2020, which will slowly increase to
22 EJ in 2050.
Construction and mining
Construction (of roads, buildings, and infrastructure) and
mining is the smallest of the ETO manufacturing subsec-
tors, with 6 EJ of energy demand in 2020. However, it will
see the largest relative increase in energy use, growing
50% to 9 EJ in 2050. The growth is especially pronounced
in regions that will see rapid economic growth, including
Sub-Saharan Africa (+260%), the Indian Subcontinent
(+247%) and South East Asia (+88%).
Cement is a carbon-intensive material, representing
around 6% of global CO2
emissions. The production of
clinker accounts for most of the emissions. As in other
manufacturing processes, high heat is necessary for the
clinkering phase. This is usually achieved using coal, pet
coke or natural gas. However, energy use accounts for
only 40% of the emissions. The remaining 60% comes
from the chemical reaction itself, where CO2
is released
from limestone and other minerals to form clinker. These
so-called process emissions are inseparable from today’s
cement production.
Decarbonizingcement productionis consequently a
challenge.This is exacerbatedby the fact that no process
so far exists for cradle-to-cradle cement or concrete
recycling.
Carbon capture is currently the favoured
option to decarbonize cement production,
as it would target both combustion and
process emissions.
Acting on cement chemistry is a first available option.
Lowering the clinker content in cement decreases
the total footprint, and there is already a global trend
towards a slow decrease of the clinker-to-cement
ratio. Clinker-free cementitious materials are already
produced at industrial scale, for example, by
Hoffmann Green Cement Technologies (World Cement
Magazine, 2022). Other solutions such as substitution of
limestone in clinkering are also possible. However, raw
material availability, lock-in mechanisms and inflexible
construction standards will slow the uptake of these
different solutions.
Acting on fuel mix is a second option. Hydrogen could be
a solution to retrofit current installations, with a pilot test
being recently conducted by buildings materials supplier
Hanson UK, for example. Kiln electrification is also an
option, though it is not suitable for retrofitting, and no
commercial-scale installation has ever been in use. This
could eliminate direct emissions from combustion, but
process emissions would remain. In regions with high
carbon prices like Europe, where hydrogen could be
competitive, solid recycling schemes are also in place.
Waste recovery often creates a substantial source of
income as well as a replacement for fossil fuels, which can
represent up to 100% of the fuel mix and easily compen-
sate for high carbon price.
Carbon capture is currently the favoured option to
decarbonize cement production, as it would target both
combustion and process emissions, with little impact on
kiln operation. As part of the Northern Lights project, the
world’s first industrial-scale capture facility will start
operating in 2024 at Norcem Brevik in Norway.
Cement producers operate on tight margins in a very
competitive environment. Cement is a low value-added
product, and decarbonization costs could double its price
(ETC, 2018). Public procurement is then essential to drive
decarbonized cement demand, and strong policies would
be necessary to protect the leading regions against
carbon leakage.
The complexity of decarbonizing cement production
52
DNV Energy Transition Outlook 2022
53
Energy demand CHAPTER 1
Industrial heat represents fully two thirds of the energy
demand in the manufacturing sector. Heat is often
needed to perform material transformations, chemical
reactions, or metal melting. As Figure 1.29 shows, heat
demand differs among the manufacturing subsectors
and can represent up to 90% of their total energy
demands. Despite energy-efficiency gains, these shares
of heat demand are forecast to remain relatively constant
to 2050. The source of the heat will, however, change.
Temperature requirements differ across the subsectors
and will influence the trajectory of their heating energy
mixes.
In manufactured goods, heating temperature require-
ments are usually moderate and can, and will increas-
ingly be, supplied by industrial heat pumps. The
competitiveness of these pumps will grow as their high
coefficient of performance will increase, by a factor of
up to six. As a result, electricity will see its share in the
heat mix of the manufactured goods subsector increase
from 7% in 2020 to 12% in 2050.
But where energy is used for high-heat processes —
cement, petrochemicals, base materials, iron and steel
— fossil fuels will remain the most competitive energy
carrier. Electrification of heat processes in these high-
heat subsectors will be significantly less-pronounced
than in the manufactured goods subsector, due to the
limited efficiency gains from switching to electricity in
high-heat furnaces. Because electricity is still mainly
produced from fossil-fuel sources in the near-term, there
are significant losses during its production. Thus, the
losses and increased costs associated with electrification
compared with using direct heat from fossil-fuel sources,
make the base materials subsector reliant on fossil fuels
for the coming decades. This is one of the main reasons
why the subsector's associated emissions are considered
hard to abate.
There will consequently be only moderate changes in
the fuel mix for industrial heat during our forecast
period, as Figure 1.30 illustrates. Coal will remain the
largest energy carrier, driven by persistent use of coal in
Greater China and the Indian Subcontinent which,
together, will still represent two thirds of demand by
mid-century. However, coal’s share in heating for
manufacturing will decrease from 37% in 2020 to 28%
by 2050. Natural gas will also lose ground, from 30%
in 2020 to 24% by 2050.
Hydrogen will be used for heating and as a reducing
agent and will hold a share of 9% of industrial heating
energy demand by the end of our forecast period.
Europe will be the largest consumer of hydrogen for
these purposes (54% of demand), followed by North
America (34%) and OECD Pacific (11%). Hydrogen will
become a viable source of heating in industry only in
these high carbon-price regions where it will partly
outcompete natural gas.
With lower emission factors, bioenergy will also become
an interesting alternative, growing from 11% to 16% of the
heat demand in manufacturing.
Focus on industrial heat
54
DNV Energy Transition Outlook 2022
55
Energy demand CHAPTER 1
Fuel mix
Oil and natural gas dominate today’s fuel mix for non-
energy use, meeting 54% and 41%, respectively, of
demand in 2020, with coal covering the rest of the mix.
90% of this coal use is in China, mainly for ammonia and
methanol production.
Plastics production necessitates primary chemicals like
ethene (ethylene) or propene (propylene), which can be
obtained from cracking oil or from natural gas. Feedstock
choice is dependent on local availability and prices.
North America relies, for instance, on natural gas due
to the abundance of ethane, a by-product of natural gas
extraction. Regions with little fossil fuel extraction, such
as Europe or Greater China, will usually use naphtha, a
fraction of oil which can be easily imported. In 2020, 64%
of plastics feedstock demand was covered by oil and the
rest via natural gas (methanol-to-olefins is not included
here). These shares will remain stable to 2050.
80% of ammonia is produced from natural gas by steam
methane reforming, and this share is expected to stay
constant. Coal gasification will be progressively phased
out and will represent 11% of ammonia production in
2050 versus 20% in 2020.
The fuel mix for other chemicals is closely related to that
for plastics, given that in most cases (not for methanol),
the same primary chemicals obtained via steam cracking
are used. Non-chemical uses are and will be covered by
oil; for example, bitumen is essential for roads.
Overall, non-energy demand for oil and natural gas will
increase. As Figure 1.33 shows, non-energy will maintain
a constant share of total natural gas demand. For oil, the
share of non-energy demand will gradually increase from
14% in 2020 to 22% in 2050 as demand grows for feed-
stock (particularly plastic) but will decline for other end
uses like lubricants for road transport. Feedstock use will
therefore be one of the key drivers for oil demand in the
coming decades, with the caveat that it will peak in the
2030s and thereafter steadily decline.
1.5 NON-ENERGY USE (FEEDSTOCK)
Non-energy use reflects consumption of coal, oil, natural
gas, or biomass as industrial feedstock, and typically
results in tangible products like plastics, paints or
fertilizers. In 2020, 39 EJ (about 8%) of global primary
fossil-fuel supply was used for non-energy purposes.
Demand
Plastics production represented 18 EJ (45%) of total
non-energy demand in 2020. Global plastics demand has
grown significantly in recent decades, reaching 450 Mt per
year in 2020. This growth is expected to continue and
reach 860 Mt per year in 2050, as plastics consumption is
strongly related to increasing GDP per capita. However,
even if plastics demand increases by 91%, non-energy use
will only rise 28%. This is due to a significant increase in
recycling rates. Secondary plastics obtained by mechani-
cal recycling covered 7% of global demand in 2020. This
will grow to 27% by 2050, thanks to the generalization
of recycling schemes in all regions, and to advances in
recycling technologies, including feedstock recycling.
At the same time, the uptake of chemical recycling via
pyrolysis and similar technologies will create a stream
of recycled fuel that could be directly fed into traditional
steam crackers, as a replacement for oil. By 2050, 1.1 EJ
of this recycled fuel will be produced each year, covering
about 1% of oil primary energy demand.
Demand for ammonia, mainly driven by fertilizer consump-
tion, is expected to slightly increase. Natural gas or coal
(mainly in China) are used to provide hydrogen for the
production. Ammonia produced via electrolysis-based
hydrogen could reduce the non-energy demand, but
subsequent reuse of CO2
in the process to produce urea,
will limit the interest for this alternative. Thus, production
using fossil fuels (with and without CCS) will retain a 90%
share in 2050. Non-energy demand will be stable at 4 EJ
over the coming decades.
Demand for other chemicals (methanol, paints, cosmetics,
pharmaceuticals) is expected to slightly decrease from
8 EJ in 2020 to 6 EJ in 2050. Non-chemical uses include
applications for asphalt (bitumen), lubricants and solvents.
Demand for these purposes is expected to increase from
6 EJ in 2020 to 10 EJ in 2050, driven by increased demand
for road infrastructure in growing economies.
Quantafuel’s advanced plastic recycling plant
at Skive, Denmark. Image courtesy Quantafuel.
56
DNV Energy Transition Outlook 2022
57
Energy demand CHAPTER 1
1.6 FINAL ENERGY DEMAND FROM ALL SECTORS
The final energy demand by energy carrier for all sectors
combined is summarized in Figure 1.34. The ongoing
transition is extraordinary in relation to the growing role
of electricity in the final energy demand mix. In 2021,
electricity represented just 19% of the world’s final
energy use. In 2050, this will be 36%, with growth in
electricity demand more than doubling from 84 EJ per
year in 2020 to 179 EJ per year by mid-century. In the first
10 years, the growth is above 3% per year. As electricity
has a higher efficiency in its end use, it could be argued
that more than half of all energy services in mid-century
will be provided by electricity.
The reason for a steady increase in electrification is a
combination of cost, technology, and policy. As costs of
solar and wind will continue to decline rapidly, and their
shares of the electricity mix also increase, electricity will
become cheaper relative to other fuels. Technological
progress will make electricity available and viable for use
in ever-more subsectors and new applications, often in
sectors where electric alternatives were either non-exist-
ent or very expensive. New applications requiring
modern energy are emerging — e.g. communication
appliances and air conditioning — for which there are few
or no alternatives to electricity. Finally, more ambitious
decarbonization policies favour electricity’s low-carbon
footprint, an advantage that further strengthens as the
electricity mix becomes greener.
The share of hydrogen and hydrogen derivatives like
ammonia and e-fuels also increases significantly, from
a negligible share today to 5% combined in 2050.
In addition, direct use of biomass has been and will
keep increasing, but at a much lower rate.
Direct use of fossil fuel reduces over the coming years,
but the decline is less than for the fossil fuel used in
electricity production. Still, direct use of fossil fuel
reduces its share from 67% to 45% of final energy
demand over the next 30 years, with the reduction
of oil and coal being bigger than for natural gas.
58
DNV Energy Transition Outlook 2022
59
Electricity and hydrogen CHAPTER 2
2
Highlights
2.1 Electricity60
2.2 Grids68
2.3 Storage and flexibility71
2.4 Hydrogen74
2.5 Direct heat81
Electrification is the main engine of the ongoing energy
transition: it is not only more than doubling — increasing
from 27 PWh/yr in 2020 to 62 PWh/yr by 2050 — but it is
greening at the same time, with the proportion supplied
by wind and solar PV rising from 11% now to close to
70% by 2050.
Critically, indirect electrification via green hydrogen,
half of which will be produced by dedicated renewable
sources by 2050, will help to decarbonize hard-to-
electrify sectors like aviation, maritime transport, and
high heat processes in manufacturing. We find however,
that low and zero-carbon hydrogen will be only 5% of
energy demand by 2050 — whereas a net zero energy
system would require roughly three times as much
hydrogen.
This chapter covers a range of subjects associated with
rising electrification, including estimations on the scale
of transmission and distribution infrastructure needed,
requirements for storage and flexibility, and invest-
ments in analytics and digitalization. We also cover new
categories of demand, including EVs, space cooling,
manufacturing, and the production of green hydrogen.
ELECTRICITY
AND
HYDROGEN
60
DNV Energy Transition Outlook 2022
61
Electricity and hydrogen CHAPTER 2
2.1 ELECTRICITY
Electrification is the main engine of the energy transition. Electricity
demand will more than double by 2050, and it will be greening at the same
time – also penetrating sectors that have hitherto been hard to electrify via
green hydrogen.
Electricity supply
Global grid-connected electricity supply increases from
27 PWh/yr in 2020 to 62 PWh/yr by 2050. This signifies a
2.7%/yr annual average growth in electricity generation.
At present, the biggest share of the power generation in
the world comes from coal-fired power plants (35%), as
seen in Figure 2.1. This will shrink to just 4% by 2050
owing to decarbonization, pressure on financing of
coal-fired power plants, and the declining costs for
renewable electricity generation.
The second-largest electricity generator in the world at
present is the gas-fired power plant. Its current share of
the electricity mix, 24%, will be maintained through to
2030, despite the short-term supply shock caused by
Russia’s invasion of Ukraine. From 2030, this share enters
a period of steady decline to reach 8% by 2050. Because
it is relatively cleaner than coal, we expect gas-fired
power plants, primarily run with methane, to have a
longer staying power. Such plants have a larger share in
regions such as Middle East and North Africa and North
East Eurasia, where domestic natural gas resources are
plentiful.
The role of fossil-fuel powered power stations will be
increasingly confined to providing flexibility and backup
in power systems when variable renewable energy
sources (VRES) are unavailable, especially through
low-capital expenditure (CAPEX) gas-fired power
stations. In 2050, fossil fuels will generate just 12% of
power needs and nuclear 5%. By mid-century dispatcha-
ble power, under intense pressure to decarbonize, will
still have a price-setting role, possibly not as pronounced
as today, and will continue to play a pivotal role in the
power system. We are likely therefore to see considera-
ble attention being paid to maintaining fossil-fuel
generation, despite its diminishing role in the electricity
supply.
Hydrogen in electricity generation
In the long term, hydrogen also has potential to be
blended into gas-fired power plants. We project a
maximum volumetric blending fraction of 60% in
gas-fired power plants, starting from 2026, a ratio
determined by the price differential between methane
and hydrogen. Despite high volumetric blending frac-
tions, globally, hydrogen-fired electricity reaches only a
maximum of 1% in 2038, and then reduces to 0.3% by
2050, as a share of world electricity generation.
In some regions, however, hydrogen takes a significant
share of gas-fired electricity. In the OECD Pacific, we
project almost 50% of electricity from gas-fired power
plants to be running on hydrogen in 2050 (Figure 2.2).
Similarly, in Europe and Greater China, 20 and 30% of the
electricity from gas-fired power plants will be generated
by hydrogen in 2050, respectively.
In these regions, hydrogen will increasingly be produced
by grid-connected electrolysers. These grid-connected
electrolysers will produce hydrogen when electricity
prices are low, typically when VRES have a large produc-
tion share, and then blend the hydrogen produced and
stored when gas-fired power plants need to be ramped
up, typically in hours when electricity prices are high.
So, while hydrogen on the global scale will not have a
significant share even in 2050, in regions where hydrogen
is present as an energy carrier, we foresee hydrogen
playing a significant role in gas-fired electricity genera-
tion, as well as reducing the need for curtailment of VRES,
and thus keeping electricity costs low.
In 2020, renewables generated 29% of the electricity,
with almost two thirds of this from hydropower. As
decarbonization pressure grows and the costs of solar
PV, wind generation, and battery storage costs continue
to fall, VRES will take an ever-greater share. We expect
VRES to overtake fossil-based electricity generation
globally by 2035 (Figure 2.3). By 2050, 83% of the world’s
grid-connected electricity will be generated from renewa-
ble sources, and 69% alone from variable renewables.
Reflecting its lowest levelized costs, solar PV’s share in
the 2050 power supply will be 38%. A third of this will
be utility-scale solar farms with on-site storage (solar +
storage), with storage helping the business case for solar.
Despite having somewhat higher costs than solar, wind
will also have growing shares in all regions, as, unlike solar
energy, it does not have a cyclical daily intermittency
problem. This ensures a higher income for wind plants on
the yearly average and results in continued investments.
In 2050, one third of grid-connected electricity supply
will be wind-based, with that share split between: 75%
onshore wind, 22% bottom-fixed offshore wind, and 3%
floating offshore wind. Due to higher and more-reliable
wind speeds, and less constraints on hub heights and site
locations, offshore wind will show a 13% average annual
growth from 2020 to mid-century.
62
DNV Energy Transition Outlook 2022
63
Electricity and hydrogen CHAPTER 2
The role of carbon capture and storage (CCS)
The role of CCS in the power sector will be limited all the
way through to 2050. Globally, only 7% of the coal- and
oil-fired power station emissions will be captured by 2050
(Figure 2.4). While we expect coal-fired power emissions to
be continuously captured from 2030s, oil-fired emissions
will see significant uptake only from 2040. Given the
marginal role oil-fired power plants play in the global
electricity system in 2050, this is not very significant.
Gas-fired power emissions will see an earlier CCS uptake
than coal-fired power plants, but the fraction of capture
stabilizesbetween5%to6%ofthetotalgas-fired emissions
by 2040. The main reason for the capture share staying
constant is the higher share of hydrogen blending in
regions such as OECD Pacific, Greater China and Europe.
In regions such as Middle East and North Africa and North
East Eurasia (NEE), where gas-fired generation is dominant
the challenge is that the projected carbon prices remain
too low to incentivise higher rates of capture.
The cost of CO2
avoided ranges from USD 40/tCO2
in NEE
and USD 60/tCO2
in Europe in 2050 for coal-fired genera-
tion. The difference in the costs is mainly due to the cost
of fuel. But NEE carbon price is lower than the cost of CO2
capture, which limits the uptake of CCS in NEE. In fact,
most of the costs of avoided CO2
are significantly higher
than the carbon prices in most regions, even in 2050.
Electricity demand
World electricity demand grew 3%/yr from the 1980s
until 2020, as both a consequence and cause of economic
growth. In 2020, global electricity demand, including
off-grid rural demand was 27 PWh/yr. We project
demand to grow to 62 PWh/yr by 2050. This is an average
annual growth of 2%/yr. In 2050, we expect electricity to
make up 36% of the global energy demand. At present,
electricity’s share is 19% of final energy demand.
Figure 2.5 shows the evolution of the global electricity
demand by sector, and this includes off-grid rural demand
and off-grid dedicated electrolyser power demand. It is
evident that not all demand sectors have the same growth
trajectories. Dedicated off-grid electrolyser demand does
not exist to any significant degree today. But by 2050,
it will comprise of 8% of the electricity demand. Similarly,
transport only has a share of 2% at present, which
burgeons to 12% by 2050, spurred on by electrification
of passenger, and later, commercial transport.
Contrastingly, the residential space and water heating
and cooking segment had a share of 8% of electricity
demand in 2020, which reduces to 5% by 2050. The
electrification of cooking stoves, space and water heating
lead to increasing electricity demand over the world for
this segment and commercial space and water heating as
well. But, this rate of absolute demand increase is lower
than the growth other segments experience, which
reduces their share of total electricity demand. The
demand for this segment increases from 2 PWh/yr in
2020 to 3 PWh/yr by 2050.
Similarly, space cooling, both in residential and
commercial buildings, which only contributes to a
combined demand of 1.7 PWh/yr today, will grow
four-fold by 2050. An increase in the number of cooling
degree days (Chapter 1: Buildings) in the world because
of global warming, along with higher penetration of
air-conditioners due to increasing prosperity in warmer
regions, such as the Indian Subcontinent and South East
Asia, are the reasons for this growth.
The electricity demand for appliances and lighting in
both residential and commercial buildings almost
doubles from now to 2050, mostly driven by the increased
electrification in currently under-electrified regions such
as the Indian Subcontinent and Sub-Saharan Africa.
Most electricity in the manufacturing sector is used either
as industrial heat or to run machines, motors and appli-
ances. Of these two, machines, motors and appliances
make up 33% of the total electricity demand, which is the
single largest share among all demand segments. By 2050,
energy efficiency in this demand segment, and growth in
transport sector electricity demand ensures that its
relative share reduces to 19%, despite its absolute
demand increasing from 8 PWh/yr in 2020 to 12 PWh/yr.
Regional variation in electricity demand
Not all regions experience the same growth in electricity
demand. In 2020, Greater China had the largest share of
electricity demand (31%), followed by North America
(19%) and Europe (13%). We foresee Greater China
remaining the region with the largest electricity demand
in 2050, but its share will reduce to 26%. Furthermore, we
project the Indian Subcontinent overtaking both North
America and Europe and having the second largest
electricity demand in 2050, with a regional share of 15%
of the global demand. Given that the Indian Subcontinent
will remain the most populous region in 2050, and with
increasing GDP per capita, it is not surprising that it
overtakes North America and Europe in terms of electric-
ity demand, given that it has lower electrification rates
compared with higher-income regions.
64
DNV Energy Transition Outlook 2022
65
Electricity and hydrogen CHAPTER 2
It is instructive to investigate how growth of electricity
demand will vary over time in the different regions.
Figure 2.6 shows these variations for six selected regions.
The growth rate is calculated and presented for each year
relative to the previous year.
In the short term, we expect the Indian Subcontinent and
Sub-Saharan Africa to have the highest growth rates;
7.5% in 2024 and 6% in 2026, respectively. As discussed
before, both these regions have low electrification rates
in almost all the key demand sectors today, and as such
we foresee massive electrification drives in the regions
leading to very high demand growth in the short term.
Interestingly, while the growth rate of the Indian Subcon-
tinent reduces after 2026, Sub-Saharan Africa’s demand
growth rate continues to increase into the 2030s and
2040s. Given the potential for economic growth, and the
projected population increase, Sub-Saharan Africa will
have the highest growth in electricity demand globally.
This signifies the enormous potential the region has to
invest in renewables, and in electrifying much of its
demand segments.
Unlike the Indian Subcontinent and Sub-Saharan Africa,
North America and Europe have stable and near-constant
growth rates of about 2% year on year owing to already
high electrification rates, and comparatively low
economic growth. On the other hand, the growth of new
demand segments such as transport and grid-connected
electrolyser demand, ensure that their growth rates do
not reach zero, even by mid-century.
We foresee Greater China’s very high growth rate (5.3% in
2027) reducing in the 2030s. This is to be expected given
the expected stabilization of China’s population and
economy and front-loading of vehicle electrification
today. By 2050, almost all of China’s vehicle fleet will be
EVs, with relatively little electrification in transport in the
late 2040s. Furthermore, unlike North America and
Europe, Greater China will not prioritize grid-connected
electrolysers, which otherwise could be responsible for
the later uplift demand. Due to these reasons, we expect
electricity demand growth in Greater China to reach zero
by mid-century.
In the Middle East and North Africa region, we see rapid
electrification in buildings, thanks to higher penetration
of space cooling spurred on by increasing GDP per
capita. This leads to the increasing growth rate of elec-
tricity demand in the 2030s.
Power demand
In this Outlook, peak power demand is the highest
electricity demand of each region over a given year on an
hourly basis.
Peak power demand increases year on year for all regions
in our forecast, except for North East Eurasia in the short
term. That region’s two major economies are Russia and
Ukraine, and due to the Ukraine war, we project a reduc-
tion in peak power demand.
World total peak power demand was 3.9 TWh/h in 2020,
and this increases to 10 TWh/h by 2050, a 3.1%/yr aver-
age growth. This average growth is higher than that of the
electricity demand growth.
This has implications not only for the power generators,
but also for the physical transmission and distribution
grid in the regions. The grid infrastructure needs to be
designed and capable of transporting this peak power at
instantaneous speeds from the power generators to
consumers, which means strengthening and expansion
of the transmission and distribution grids, even in regions
which are at 100% electrification today.
Figure 2.7 shows how peak power demand and average
electricity demand is expected to evolve in selected
regions for 2030, 2040 and 2050, relative to each region’s
2020 peak power and average electricity demand.
The largest growth in peak power demand is expected in
the Indian Subcontinent and South East Asia, due to high
rates of electrification in buildings, manufacturing and
transport. By comparison, regions such as North America
and OECD Pacific have lower rates of growth.
In all the regions, the growth in peak power demand is
higher than the growth in average electricity demand.
We project that as regions consume more and more
electricity, their peak power demand will also rise, at a
proportion higher than the growth in average electricity
demand.
World peak power demand was 3.9 TWh/h
in 2020, and grows to 10 TWh/h by 2050, a
3.1%/yr average growth.
66
DNV Energy Transition Outlook 2022
67
Electricity and hydrogen CHAPTER 2
Modelling power hour by hour
Here we illustrate how our model determines the operating hours of power stations with reference to region North
America and year 2041. Annual electricity demand by segment comes from the corresponding parts of the model.
We expand the year 2041 over 52 weeks. All profiles are aggregated over North America. Over the year, nuclear performs as the baseload
with very little variation, while solar increases generation over the non-winter months.
This next chart zooms in on week 36. How storage and hydrogen production plants operate is based on price signals. In the middle
of the day, when solar resources are plentiful and electricity is cheaper, the grid-connected electrolysis plants operate, and storage
is charged. At nighttime, the stored electricity is discharged, while solar+storage plants continue to supply.
At each hour, the model establishes demand and supply curves, as shown below, demonstrating supply and demand at each possible
price. The point at which supply, and demand curves intersect indicates the realized supply, demand, and price.
68
DNV Energy Transition Outlook 2022
69
Electricity and hydrogen CHAPTER 2
2.2 GRIDS
Physical infrastructure
More grid connections will be needed as the global
grid-connected electricity demand will grow by 2.7%/yr
from 2020 to 2050. As Figure 2.8 shows, world transmis-
sion lines will increase from just over 6 million circuit-kilo-
metres in 2020 to almost 18.5 million by 2050. The fastest
progress will occur in regions with relatively weaker
infrastructure: the Indian Subcontinent, Sub-Saharan
Africa, and South East Asia. In terms of volume, the Indian
Subcontinent and Greater China will be the regions with
the longest new lines, with 40% of all new transmission
lines installed in these two regions. Although it could be
argued that distributed renewables remove the need for
centralized electricity systems, our modelling highlights
that transmission infrastructure does not become
obsolete in transitioning to a more-decentralized grid
despite a shift towards distribution lines, as power plants
become smaller.
Modern societies require the highest reliability level from
their electrical infrastructure, and this can be provided by
a greater number of more-widely distributed elements
connected via a strong backbone. Furthermore, while the
electricity demand grows 2.7%/yr, peak power demand
grows at a slightly higher rate of 3.1%/yr, which has a
direct impact on the growth of physical grid infrastruc-
ture, which needs to be able to handle the high power
and ensuing congestion. This is another reason why the
transmission grid will expand more rapidly than the rate
of the electricity demand growth.
A development we project is the more widespread use of
high-voltage direct current (HVDC) lines in the transmis-
sion grid in the future. HVDC lines make up only 1% of the
transmission grid in terms of circuit-kilometres at present.
This will increase to 5% by 2050. But, in terms of power
capacity, they will have a share of 20% in the transmission
grid, by 2050.
Distribution lines will almost triple from 2020 to 2050,
reaching about 230 million circuit-kilometres globally,
from 80 million circuit-kilometres. As the percentage of
VRES grows significantly, integration of renewables and
grid modernization will have to work hand-in-hand to
achieve the reliable grids needed for modern societies
and successful economies. Modernization of the grid will
involve: reinforcement or upgrade of transmission and
distribution systems, investments in international
interconnections, implementing decentralized energy
data and information processes, installing advanced grid
features (smart meters, sensors, remote controls),
changing processes and business models, establishing
more flexible energy markets, undergoing regulatory
review, and modernizing system operations.
Investment in transmission and distribution infrastructure
Although total grid investments were at around USD
270bn/yr in 2020, post-COVID recovery and expansion
of renewable power will ensure a steady increase in grid
investments, reaching levels of USD 500bn/yr in the
2030s, and growing up to USD 1trn/yr by 2050. The
continued growth in grid investments shown in Figure 2.9
is driven by actions from grid operators accelerating
renewables integration, grid modernization to improve
resilience and reliability, and digital transformation. Grid
investments are typically reflected to consumers over
years.
World transmission lines will increase from
just over 6 million circuit-kilometres in 2020
to almost 18.5 million by 2050.
As global power grids steadily expand, the annualized
depreciation cost of past investments is higher than the
investment expenditures (Figure 2.9). We estimate global
transmission and distribution depreciation costs to be
about USD 700bn/yr. The operating expenditures (OPEX)
add another USD 310bn to the bill, bringing the total
expenditures (TOTEX) to USD 1trn in 2020. This rises to
about 3trn by 2050. The total cost of grid operators
includes additional costs, such as tax, levies, dividends,
profits, and interest rates. These make up about 30% of
the total costs of the grid operators.
Investments are not only for grid expansion; some 15% of
grid investment today goes into digital infrastructure, to
address the complexity of a more decentralized power
system and to support decision making in asset manage-
ment and operations. Investments in digital tools will
A great deal of attention, investment, and policy is rightly
focused on clean energy generation and decarbonization
ofindustry.Buttheroleofpowergridsissometimes
under-appreciated and misunderstood, which could
ultimately contribute to the failure of an expedient
energy transition — one fast enough to support the goals
of the Paris Agreement. Future Proofing our Power Grids:
Making mass electrification possible is part of DNV’s
Industry Insights series. It is based on research with over
400 industry leaders involved in the transmission and
distribution sector as well as nine in-depth interviews
with senior figures from Ofgem, The World Bank,
Alliander, E.ON, Enel, Eurelectric, Stratkraft, Siemens,
and Strategen. The report explores power grids' readi-
ness to support the demands of the energy transition
and highlights challenges involved in transforming the
grid to suit a new energy mix, as the sector embarks on
fundamental, structural change to revolutionize a
system — rapidly — that must keep functioning, reliably,
all day, every day.
70
DNV Energy Transition Outlook 2022
71
Electricity and hydrogen CHAPTER 2
Flexibility
With a 16-fold increase in global VRES capacity over the
next 30 years the need for flexibility will increase between
two- and four-fold across the world regions. Figure 2.10
shows how VRES, especially PV panels, will create
substantially more variability in the future power system.
This will not only require more storage, but the increased
need for flexibility will also influence thermal generation
technologies, where existing plants will increasingly
operate alongside renewables and hence the premium
on the flexibility of the thermal sources will increase.
Flexibility in this context means shorter start-up times and
higher ramp rates. Thermal sources are not uniformly
conducive to these objectives — ranging from nuclear
where flexibility is difficult, followed by coal, gas
(particularly open cycle gas turbines) to oil-fired plants
which offer most flexibility, but are costly. Equally impor-
tant will be the ability of thermal plants to run economi-
cally at predominantly low load factors when
the bulk of power is provided cheaply by VRES.
Adapting for flexibility requires both physical changes,
for example retrofitting certain components, but also
investment in automation and analytics. Better prediction
of renewable-power generation levels and demand
response will assist with reacting to excess renewables
and shifting electricity usage from peak periods to times
of lower demand. In addition, new market designs will be
needed that incentivise the flexible operation of thermal
plants, and which create room for new contract structures,
grid code changes and new standards (IRENA, 2019b).
From a system perspective, implementation of smart grid
features (such as smart meters, IoT sensors, remote
control, and advanced automation) will enable better
management of energy flows. There is also a rising
'prosumer' phenomenon: new technologies and market
mechanisms will allow ever more consumers to provide
flexibility in the form of demand response, vehicle-to-grid
(V2G) and behind-the-meter storage.
It is worth outlining the scale of the contribution that EVs
will make in power storage. Clearly, the rapid decline of
Li-ion battery prices is mainly driven by the increasing
number of EVs. Moreover, smart meters, smart grids, and
regulatory changes will incentivize car owners to use V2G
2.3 STORAGE AND FLEXIBILITY
expand to enable collection of data and information from
the grid and feed these to core processes. These tools
include: advanced analytical algorithms enhanced with
machine learning to translate data from various sources
into validated information about market processes, asset
conditions, and decision-support functions; IT infrastruc-
ture to store and manage data for authorization and data
quality; standardized and secure data-communication
infrastructure to transfer market and field data, enabling
connectivity and interoperability; and sensor arrays,
collecting asset data to be utilized by a digitally enabled
workforce. This digital ecosystem enables the operation
of equipment closer to physical limits, and for optimizing
maintenance and replacement plans, as well as integrating
distributed energy resources.
By allocating total cost of grid operators to the total
electricity consumption, the grid charges in the end
users’ electricity bills can be estimated. The world
average for the unit grid charges has been around USD
60/MWh for the last two decades; we forecast this
number to be stable in the USD 63-70/MWh band in the
future. Regionally, the picture will vary. In Europe and
North America, where strong renewable growth is not
accompanied by equally strong growth in electricity
demand, unit grid charges will rise and constitute a larger
portion of the electricity bill. In Europe, grid charges will
rise from about USD 75/MWh in 2020 to USD 90/MWh by
2050, while in North America it will reach USD 75/MWh
by 2050. In both these regions, grid charges constitute
about 25% of the residential electricity price at present
and will increase its share to about 40% by 2050.
FIGURE 2.10
72
DNV Energy Transition Outlook 2022
73
Electricity and hydrogen CHAPTER 2
solutions. EV-charging systems can provide the grid with
10% of all EV storage capacity. From 2040 onwards, the
impact of V2G systems worldwide will be almost as large
as that of dedicated Li-ion batteries (or more advanced
chemistries) and pumped hydro, reaching 220 TWh/yr
globally by mid-century.
Converting VRES to other energy carriers, such as hydro-
gen, is yet another option that will provide flexibility. Invest-
ment in physical transmission systems, and in the links
between generation and load centres, will also contribute
towards better utilization of renewable power supply.
Storage
Storage in today’s power system is mostly in the form of
pumped hydro (Figure 2.11). Limited by geography,
pumped hydro is a mature technology, and will only
provide marginal increase in the dramatic added require-
ment to power storage over the next three decades.
Li-ion is today’s dominant battery chemistry for utili-
ty-scale storage, EVs, and information and communica-
tion technologies. Approximately 95% of storage
projects in which DNV is currently involved through
feasibility assessment, development, and construction,
are Li-ion. Costs have long been declining strongly, but
supply-chain shortages, amplified during and after the
pandemic, has seen battery costs increase. At cell level,
the ‘threshold’ of USD 100/kWh will be delayed by a year,
also creating a one-year-delay in reaching 50% new
passenger vehicle market share for the battery-electric
vehicles. This will partly be offset through innovation and
adjustments at both cell- and pack-level and through
manufacturing efficiencies as scale builds. Towards the
end of this decade, solid state batteries appear to offer
the best potential for a next wave in performance and
cost improvements (DNV, 2018b and Haouche et al., 2022).
Over the longer term, prices for batteries will continue to
plunge in line with a cost-learning rate of 19%, with more
than 80% cost reduction between now and 2050.
Ongoing improvements in the cost, energy density,
weight, and volume of electric batteries will enable wider
use of battery-storage systems. New battery chemistries,
will have to compete with existing Li-ion energy density,
manufacturing infrastructure, and costs. If significantly
cheaper batteries, based on Earth-abundant materials,
emerge, that could lead to cost reductions affecting the
speed at which batteries are deployed to meet energy-
storage challenges in power production and transport.
However, while new discoveries may lead to some step
changes in cost, we don’t foresee the cost trajectory of
batteries deviating too far from the long-term 19%
learning rate. Furthermore, there are limiting factors on
the total market for batteries, such as the total demand
for electricity or road vehicles, which will eventually limit
the growth of battery deployment in a self-regulating
manner as the market saturates.
Where there are larger markets for utility-scale battery
storage (e.g. China, South Korea, Japan, the US), a shift in
the charge/discharge duration required from projects is
already seen. As storage capacity exceeds 0.5% of grid
capacity, the trend is for business models to shift from
frequency-response management as a primary applica-
tion, often requiring one-hour duration or less, to price
arbitrage or, in some markets, capacity provision. Average
storage duration therefore extends from two to four hours.
As this trend for longer-duration batteries continues,
alternative chemistries and technologies with 8-24 hours
storage will have increasing value: e.g. flow batteries,
zinc-based chemistries, compressed air, liquid air, liquid
CO2
, or gravity-based storage technologies. These
alternative, long-duration storage solutions look set to
enter the market at scale in the second half of the 2030s.
Seasonal storage
Seasonal storage involves the storage of energy to
accommodate yearly cycles in electricity demand and
generation. In a sense, it moves electricity from the months
in the year when electricity output is high to the times
where electricity demand is high. The need for seasonal
storage will become more apparent as the future electric-
ity system becomes increasingly seasonal in terms of both
supply and demand. From a load perspective for example,
as space heating electrifies, the electricity demand of
regions with a cold winter will become more seasonal. On
the supply side, VRES, and especially solar, will create a
pronounced imbalance in summer and winter electrical
output in countries in higher latitudes.
The factors determining whether a technology is suitable
for seasonal storage are storage losses, cost of storage,
and roundtrip efficiency. Only chemical energy, i.e. energy
stored in molecules, is capable of delivering low-loss,
high-efficiency and low-cost storage in large quantities.
Among chemical storage technologies, storing
compressed hydrogen in salt caverns or depleted hydro-
carbon fields, appears to offer a low-cost viable solution.
Figure 2.12 shows our forecast for global underground gas
storage capacity in salt caverns and depleted oil and gas
fields, based on an analysis of weekly production and
consumption patterns of natural gas and hydrogen, and
the likely need for storage to ensure enough supply is
available when it is needed — not only for reconversion for
electricity but also for other uses like heating or transport.
As the demand for gas for space heating starts to decline,
especially in high-latitude regions of Europe and North
America, the global need for seasonal natural gas storage
will peak within five year. In contrast, by 2050, about 70
billion m³ of hydrogen storage will be developed, about
40% of which will be repurposed methane storage sites.
In a 2020 position paper titled: The Promise of Seasonal
Storage, (DNV, 2020b), DNV investigated the need for
seasonal storage, the promising technologies that can be
used, and how short and medium storage interacts with
seasonal storage. Using the Netherlands as a case study,
the paper highlights that it is not easy to distinguish
between adequacy capacity and seasonal storage due to
the variability in demand and VRES generation between
years. The paper also highlights that seasonal storage will
only work if all relevant players in the supply chain invest in
power-to-gas, physical storage, and power generation.
Co-locating hydrogen production and storage may help
to ensure that investments in key stages go hand in hand.
An example of an integrated generation-storage project is
the Advanced Clean Energy Storage I project in Utah, the
world’s largest to date, combining 220 MW of alkaline
electrolysis-based green hydrogen production with salt
cavern storage for grid scale energy conversion. The
projectwasrecentlyawardedaUSD500mnloanguarantee
fromtheUSDepartmentofEnergy(Fischer,2022).
74
DNV Energy Transition Outlook 2022
75
Electricity and hydrogen CHAPTER 2
Transport
Maritime: Hydrogen will be critical for the decarboniza-
tion of international shipping. With electrification limited
to shore power when berthing as well as the short-sea
shipping segment, hydrogen-based fuels like ammonia
and e-fuels, are likely to make up the bulk of zero-emis-
sion fuels for shipping by 2050.
Our forecast of the most likely hydrogen future to 2050
includes e-methanol uptake in shipping of 360 PJ (2% of
shipping fuel mix) in 2030, 1400 PJ (10%) in 2040 and
1800 PJ (14%) in 2050.
Similar to e-methanol, ammonia can use large parts of the
existing infrastructure, but has the same challenges with
significantly higher production costs than the present
alternatives. If produced from renewable energy, the
conversion losses are significant, and we would need a
massive ramp-up of renewable power. Capturing CO2
from natural gas during ammonia production is, however,
relativelysimple,andthedominantshareofammoniabeing
usedinshippingintheforecastwilllikelybeblueammonia.
Use of ammonia by ships has toxicity risks, but we believe
this will be solved and that there will be large-scale
transport taking place from cheap producing regions to
the global bunkering hubs. Ammonia will likely have a
lower initial uptake than e-methanol until 2040, but then
scale faster towards the end of the forecast period. Our
hydrogen forecast projects ammonia uptake in shipping
of 43 PJ (0.3% of shipping fuel mix) in 2030, 1100 PJ (8%) in
2040 and 4500 PJ (35%) in 2050.
Aviation: Hydrogen, either in its pure form, or in derived
e-fuel form will only start to scale for aviation in the 2030s
for reasons of cost and availability. A wider use of e-fuels
is achievable only with an immense scale-up of renewa-
ble power production, and the current cost difference
of a factor of four to five, compared with fossil kerosene,
needs to be reduced. We will see three times more
e-fuels than pure hydrogen in the aviation subsector,
representing a 13% share, mainly due to the fact that
e-fuels as a type of drop-in fuel can serve all types of
flights. Hydrogen by contrast is limited to mainly medium-
haul flights owing its low energy density, and the hydrogen
tanks needed for the large amount of hydrogen would
require a very different airplane design with higher costs
per passenger. In combination, the share of pure hydro-
gen and hydrogen-based e-fuel represents around 17%
of energy use in aviation by 2050.
2.4 HYDROGEN
Renewable and low-carbon hydrogen is crucial for
decarbonizing hard-to-abate sectors and meeting Paris
Agreement goals. To achieve Paris targets, hydrogen
would need to meet around 15% of world energy demand
by mid-century. We forecast that global hydrogen uptake
is very low and late relative to Paris Agreement require-
ments — reaching 0.5% of global final energy mix in 2030
and 5% in 2050, although the share of hydrogen in the
energy mix of some world regions will be double these
percentages.
Even at 5% of global energy demand, developments in
hydrogen over the next 30 years will be substantial, and in
some cases, industry changing. Global spend on produc-
ing hydrogen for energy purposes from now until 2050
will be USD 6.8trn, with an additional USD 180bn spent
on hydrogen pipelines and USD 530bn on building and
operating ammonia terminals.
Hydrogen demand
Demand for hydrogen as an energy carrier will rocket
upwards from negligible levels today to well over 250
MtH2
per year by 2050 — with demand climbing steeply
by then (Figure 2.13). The bulk of hydrogen end use will
be for manufacturing (61%), followed by transport (17%)
and buildings (14%), with the remainder going to
electricity generation and other uses.
Editor’s note: This section on hydrogen is summarized
from our companion report: Hydrogen Forecast to 2050,
published June 2022 (eto.com/hydrogenforecast2050).
The report contains much more detail on, inter alia,
policy driving the rise of hydrogen ecosystems,
developments in approaches to safety, technical aspects
of production, storage and transport of hydrogen,
expected developments in the regional and international
trade of hydrogen and its derivatives, and a comparison
of various hydrogen value chains.
76
DNV Energy Transition Outlook 2022
77
Electricity and hydrogen CHAPTER 2
Road transport: Fuel cell electric vehicle (FCEV) propul-
sion is much less efficient, more complicated, and thus
more costly, than that of battery electric vehicles (BEVs).
For these reasons, major vehicle manufacturers are
focusing almost exclusively on BEV models for passenger
transport which will lead to a global share for BEVs of 85%
of new car sales in 2050, versus only 0.01% FCEVs.
Regarding light commercial vehicles, the shares will be
64% and 4%, respectively in 2050.
Hydrogen was long seen as the only solution to decar-
bonize heavy trucking, but as things now stand,
battery-electric solutions are likely to have a decent share
in this segment. As a result, we project hydrogen to play
only a minor role in road transport, namely for heavy-duty
long-distance trucking. By mid-century, hydrogen will
account for a 2.5% share of road transport energy
demand, slightly less then biomass and natural gas.
Accounting for the fact that hydrogen will be used in
heavy-duty and long-distance trucking where fuel
consumption is naturally higher, this still amounts to
about 2,000 PJ in 2050 (16.7 MtH2
/yr). Half of this will be
consumed in Greater China alone, owing to the large
vehicle fleet and policy focus on decarbonized transport,
followed by Europe and North America each having a
15% share and OECD Pacific with a 9% share.
Manufacturing
Hydrogen can be used instead of fossil fuels to generate
high-temperature heat. However, at present, negligible
quantities of hydrogen are used for industrial high-heat
processes. This is because hydrogen remains an expen-
sive alternative fuel, uncompetitive against conventional
fossil-fuelled technologies, and losing out to bioenergy in
most contexts even under higher carbon prices.
Nevertheless, low-carbon hydrogen is expected to play
an important role in the manufacturing sector by 2050 in
front-runner regions, such as Greater China and Europe.
In our forecast, demand for hydrogen as an energy
carrier in manufacturing is set to grow gradually up to
nearly 10.1 EJ/yr (~84 MtH2
/yr) by 2050, amounting to
around 7% of total manufacturing energy demand, and
around 33 % of global demand for hydrogen as energy
carrier. In terms of direct use of hydrogen (as opposed to
blended hydrogen or hydrogen derivatives), manufactur-
ing will dominate usage with an over 90% share until 2030
and over 65% share in 2050. The largest share of hydro-
gen demand in manufacturing (2.8 EJ/yr or 28% of total)
comes from the iron and steel industry. This is in addition
to the non-energy demand of hydrogen used for direct
reduction of iron at 1.6 EJ/yr (~13.5 MtH2
/yr).
Buildings
In our analysis, we project an uptake of 1.9 EJ/yr (~15.8
MtH2
/yr) of hydrogen in buildings by 2050, constituting a
mere 1.3% of the total energy demand in the buildings
sector. The largest shares of the demand will come from
space and water heating (36 and 38%, respectively), as
shown in Figure 2.17. We expect hydrogen to have a
slightly higher share of total demand (about 3-4%) in
space and water heating than in the building sector as a
whole. However, the share of hydrogen is still minuscule
compared with the share of natural gas which accounts
for over a third of buildings heating demand by 2050. The
limited projected uptake of hydrogen in buildings is
explained by comparative efficiency, costs, safety, and
infrastructure availability in relation to competing
technologies, mainly electric heat pumps and district
heating.
Use of hydrogen in buildings will be concentrated in four
regions with existing natural gas infrastructures and with
access to relatively more affordable hydrogen — North
America, Europe, Greater China and OECD Pacific.
Power and seasonal storage
In areas and regions with significant penetration of VRES,
the use of hydrogen for peak balancing and long-term
storage of 'surplus' electricity has advantages, but it does
come with significant energy losses and storage demands.
In the merit order of hydrogen applications, re-electrifica-
tion is likely to come last. However, we will see hydrogen
being used in power stations from 2030 onwards, though
in very small amounts and at first mainly due to feeding
hydrogen into natural-gas grids. Later, peak-balancing
increases the share. OECD Pacific will be the frontrunner in
this development, followed by Europe and Greater China.
The same regions will increasingly use hydrogen for
electricity generation, and a small amount will be used in
North America from the mid-2040s. By mid-century, we
foresee that those regions will use almost 8 Mt hydrogen
per year in power generation.
Hydrogen as feedstock
Currently, two major needs for feedstock hydrogen are
for oil refineries, and for producing ammonia for fertilizers.
Our forecast shows that while in absolute quantities the
demand for hydrogen in these segments sees a slight
decrease, there will be a burgeoning need for derivatives
to be used for energy purposes. In fact, by 2050, the
hydrogen demand for producing e-fuels and ammonia
fuel will be more than that of the combined demand for
hydrogen for oil refineries and fertilizer production.
By 2050, CO2
—intensive production routes for feedstock
hydrogen, such as methane reforming and coal gasifica-
tion will lose their dominant positions, replaced by
methane reforming coupled with CCS, grid-connected
electrolysis and electrolysis coupled to dedicated
renewables.
Hydrogen supply
The future hydrogen supply mix will be shaped by two
related trends: firstly, the use of hydrogen as an energy
carrier will increase, and secondly, there will be a gradual
replacement of existing production capacity with
lower-emission alternatives. As the main motivation for
hydrogen use in energy systems is to decarbonize
sectors that cannot be electrified, only low-carbon
production routes are future contenders. In 2030, we
forecast that a third of global supply will be low-carbon
and renewable, with fossil fuels with CCS taking a 14%
share of the global total and hydrogen from electrolysis
18%. In 2050, 85% of world’s hydrogen supply will be
78
DNV Energy Transition Outlook 2022
79
Electricity and hydrogen CHAPTER 2
from low-carbon routes, broken down as follows: 27.5%
from fossils with CCS, 25.5% from grid-connected
electrolysis, 17.5% from dedicated solar-based electroly-
sis, 13% from dedicated wind-based electrolysis and 1%
from dedicated nuclear-based electrolysis.
Blue hydrogen: Cost and the speed of build-up are the
main factors determining the shares of production routes
in the supply mix. Currently, the cheapest low-carbon
hydrogen production route, on average, is methane
reforming with CCS, commonly referred to as blue
hydrogen, with an average cost just below USD 3/kgH2
in
2020. This global weighted average is more representa-
tive of regions like North America and North East Eurasia
with access to cheap natural gas, and does not reflect the
increase in the gas prices since 2020, which has raised
prices for blue hydrogen from 2020 to 2022 by 20-30% in
gas producing regions, and 60-400% in gas importing
regions.
Although we foresee gas prices falling from the current
high levels by 2030s, there are additional challenges for
blue hydrogen. CCS is still a developing technology and
concerns about long-term storage sites, uncertainties on
future costs, and only marginal benefits from economies
of scale are limiting the speed of deployment. Moreover,
CO2
capture rates beyond 90% will remain uneconomi-
cal, and will result in a weaker support for blue hydrogen
compared with other low-carbon, renewable alternatives.
Nonetheless, with the continued reduction in CAPEX for
methane reforming (particularly ATR technology) and
carbon capture, and with reducing risk premiums for
hydrogen investments, and increasing carbon prices,
blue hydrogen will gain significant market share, espe-
cially in ammonia and methanol production. The cost of
carbon capture for ammonia production is lower than the
cost of carbon capture for merchant hydrogen. Of the 78
MtH2
/yr produced globally from methane reforming with
CCS in 2050 (which will constitute 24% of the global
hydrogen supply), 68 MtH2
/yr will be captive hydrogen —
produced in the same facility in which it is consumed in
ammonia and methanol production or in refineries or in
the direct reduction of iron.
Green hydrogen: The cost of dedicated renewables-
based electrolysis is presently prohibitively expensive,
with a global weighted average of USD 5/kgH2
in 2020.
But, in the decade to 2030, we will see a sharp reduction
in the cost of electrolysis with dedicated solar or wind
capacity reducing on average towards USD 2/kgH2
. The
main driver of this trend will be a 40% reduction in solar
panel costs and a 27% reduction in turbine costs.
With continued improvements in turbine sizes and solar
panel technologies, the annual operating hours will
simultaneously increase by 10-30%, varying between
technologies and regions. Moreover, the cost of capital
for electrolysers of any kind will see 25-30% reduction as
the perceived financial risk keeps coming down.
For grid-connected electrolysers, the largest cost
component is the cost of electricity, specifically, the
availability of cheap electricity. In the longer term, the
share of variable renewable energy sources (VRES) in
power systems will be the main factor in determining
the future electricity price distribution; more VRES
means more hours with very cheap (or even free)
electricity. However, before 2030, the penetration of
VRES in the power systems will not be sufficient to
exert large impacts on the electricity price distribution.
Hence, any reduction we see in the cost of grid-
connected electrolysers in the remaining years of this
decade is due to a decline in CAPEX along with any
support governments provide.
Towards 2050, we will see two main trends that affect
annual operating hours: increased competition from
alternative hydrogen production routes and more hours
with cheap electricity. With increased VRES in the system,
the number of hours where hydrogen from electricity will
be cheaper than blue hydrogen increase towards 2050.
As a result, grid-connected green hydrogen accounts for
a very similar share of the total market as blue hydrogen.
HydrogenPro taking delivery of the world's largest electrolyser at its test facilities in Herøya, Norway.
Image courtesy HydrogenPro, September 2022.
80
DNV Energy Transition Outlook 2022
81
Electricity and hydrogen CHAPTER 2
Hydrogen transport
Hydrogen will be transported by pipelines up to medium
distances within and between countries, but almost
never between continents. Ammonia is safer and more
convenient to transport, e.g. by ship, and 59% of energy-
related ammonia will be traded between regions by
2050. Cost considerations will lead to more than 50%
of hydrogen pipelines globally being repurposed from
natural gas pipelines, rising to as high as 80% in some
regions, as the cost to repurpose pipelines is expected
to be just 10-35% of new construction costs.
The transport of pure hydrogen between regions will be
relatively marginal. Pipeline transport is most economical
if transported volumes are high, and at medium
distances. Shorter distances and smaller volumes call
for trucking and rail — in tanks, usually as ammonia.
For longer distances seaborne transport is the logical
alternative where depths and/or distances make pipeline
transport uncompetitive. However, that requires energy-
intensive and costly liquefaction at the exporting end,
and a similarly costly regasification at import locations,
together adding USD 1.5-2/kgH2
to costs. Less than 2% of
global hydrogen will have spent time on keel in 2050, and
only about 4% will come through interregional pipelines.
Ammonia is likely to be the zero-emission fuel of choice
for international shipping, the present analysis assumes
that all seaborne hydrogen transport is liquid ammonia.
We expect a twenty-fold increase in ammonia seaborne
transport from 2030 to 2050, with fuel use growing from
virtually nothing in the mid-2030s to 95% of the trade in
2050 — of a total shipment of 150 million tonnes at that
time.
Further details on hydrogen storage and transport can
be found in our Hydrogen Forecast to 2050 (DNV, 2022a).
Cost considerations will lead to more than
50% of hydrogen pipelines globally being
repurposed from natural gas pipelines, rising
to as high as 80% in some regions.
We define direct heat as the thermal energy produced
by power stations for selling to a third party, e.g. district
heating, or by industries for their own activities. In
practice, such heat is always delivered as hot water or
steam. Direct heat has the major benefit of economies
of scale by providing heat to whole neighbourhoods or
cities from one facility, making it the obvious choice of
heating for households that has the pipeline distribution
lines brining the heat. Space and water heating in
residential, commercial, and public buildings currently
uses 42% of the direct heat globally, only surpassed by
manufacturing with 43%.
North East Eurasia and Greater China both have 40%
share in global direct heat demand. Other major
consumer is Europe with 15%, led by Germany. In 2020,
coal and gas provided 45% and 44%, respectively, of
global direct heat supply. More than two thirds of this
came from combined heat and power (CHP) plants.
We forecast a plateauing in the use of direct heat demand
due to thermal power losing ground to variable renewable
power supply. Direct heat energy demand will increase
marginally from around 15 EJ/year in 2020 to just
below 16 EJ/year by 2030, and remain at that level until
mid-century.
Generating heat centrally is an advantage for countries
aiming to decarbonize their heat supplies. Instead of
replacing many individual boilers, moving to lower-
emission alternatives can be achieved by replacing one
central power station. By 2030, coal will be replaced by
bioenergy technologies, which mostly use municipal and
industrial waste as fuel, and natural gas-fired technologies,
bringing the share of coal in direct heat demand down to
36%. In 2050, bioenergy will provide 23% of direct heat,
while coal’s share will have shrunk to 9%. The share of
natural gas will increase to 67%.
2.5 DIRECT HEAT
82
DNV Energy Transition Outlook 2022
83
Renewable energy CHAPTER 3
3
RENEWABLE
ENERGY
Highlights
This chapter covers current developments in and
forecast growth of solar PV, wind energy, hydropower,
bioenergy and nuclear energy. All of these sources are
set to grow, but at very different rates.
For the first time, our forecast finds that non-fossil
sources will edge slightly beyond a 50% share of
primary energy by 2050. Solar PV will see a 22-fold
growth over our forecast period, spurred by the highest
technology cost-learning rate among renewable sources.
This chapter expands on the growing trend to couple
solar PV with storage. Within a decade, about one fifth
of all PV installed will be with dedicated storage, and
by mid-century this share will have risen to half.
Wind energy will expand 9-fold, (onshore 7-fold and
offshore 26-fold). We describe developments that will
improve capacity factors for both onshore and offshore
wind.
Hydropower will remain important, supplying 13% of
electricity in 2050, and we find that the renewed interest
in nuclear energy over the last year will see an uptick
(13%) in its output by mid-century, although in relative
terms, its share of the power mix declines. 3.1 Solar85
3.2 Wind91
3.3 Hydropower95
3.4 Nuclear Power97
3.5 Bioenergy99
3.6 Other renewables103
84
DNV Energy Transition Outlook 2022
85
Renewable energy CHAPTER 3
Solar panels on earth-orbiting satellites generated some
of the first-ever electricity produced by solar photovoltaic
(PV) means. The cost of such power was at that time
prohibitive for general use of solar PV for supplying
electricity to the public. Solar PV costs have since
declined spectacularly, the technology’s efficiency has
increased, and the scale and forms in which it is imple-
mented have diversified.
Solar PV today comes as household installations meas-
ured in kW; commercial-industrial scale (MW scale)
installations on industrial rooftops and car ports, to
reduce corporate energy bills; and multi-gigawatt,
utility-scale solar farms usually on remote, unproductive
land. Utility-scale production dominates and will
continue to do so because smaller installations cannot
compete on energy cost. Small installations, however,
offer flexibility and local security of supply. These advan-
tages will ensure that rooftop and micro-grid-sized
installations will grow significantly in absolute terms,
though their market share will decline (DNV, 2019).
Cost developments
The global weighted average levelized cost of energy
(LCOE) for solar PV is currently around USD 50/MWh for
solar and USD 120/MWh for solar+storage. In the case of
solar PV, we expect it to break the USD 50/MWh barrier
and reduce to around USD 30/MWh by mid-century
(Figure 3.2), with individual project costs well below USD
20/MWh. The main driver for this reduction in LCOE is the
reduction of unit investments costs, which are around
USD 900/kW as a global average now. This will fall
significantly with every doubling of solar PV installation
globally, reaching USD 650/kW in 2050.
The panel cost-learning rate for solar PV will remain high
throughout our forecast period. It is currently 26%, and
while that rate will decline to 17% in 2050, solar PV will
be in unassailable position as the cheapest source of
new electricity globally, except in unfavourable areas
such as in high northern latitudes. The OPEX-learning
rate of 9% is expected to remain unchanged until
mid-century, as enhanced data monitoring, remote
inspections and predictive maintenance continue to
drive down operating costs.
The panel cost-learning rate for solar PV will
remain high throughout our forecast period.
It is currently 26%, and while that rate will
decline to 17% in 2050, solar PV will be in
unassailable position as the cheapest source
of new electricity globally.
3 RENEWABLE ENERGY 3.1 SOLAR
By contrast, VRES growth is non-linear to 2050 — solar
capacity increases 22-fold, wind capacity: 9-fold.
Onshore wind: 7-fold, offshore wind: 56-fold. Driving this
are both plunging costs and a growing realization that
VRES offer the cheapest and quickest route to both
decarbonization and energy security.
In a world seeing doubling of electricity generation by
2050, hydropower generation will still provide 13% of
total electricity supply, down from 16% in 2020. While
growing in absolute terms, this loss of share is trans-
ferred to solar and wind.
Waste management and high construction costs and
long lead times remain stubborn realities for nuclear
power. However, current energy security concerns are
leading to renewed interest in this source, and our
forecast this year reflects a modest uptick in nuclear,
growing by 13% from today’s levels to 2050.
VRES offer the cheapest and quickest route
to both decarbonization and energy security.
This chapter covers the non-linear rise of renewable energy sources.
Coal and gas decline to 4% and 8%, respectively of the power mix by 2050,
when they are largely confined to providing flexibility and backup in a
power system 70% reliant on variable renewable energy sources (VRES).
86
DNV Energy Transition Outlook 2022
87
Renewable energy CHAPTER 3
The levelized cost of solar+storage is currently more than
double that of solar PV without storage. A continuous
decline in battery prices will narrow this gap to around
50% by mid-century.
Despite its higher costs, solar+storage has an advantage
over solar PV on capture price (Figure 3.2). Plants with
storage can charge their batteries when sunlight is
plentiful during the day and sell the stored electricity when
the price is high. By 2038, the capture price advantage of
solar+storage over regular solar PV plants will surpass the
cost disadvantage on a globally averaged basis.
PV is intermittent: it will only produce electricity during
daylight, and mostly during sunny conditions. To work
around this, a host of flexibility options are being devel-
oped. These include:
— energy storage, such as pumped hydro, bespoke power
batteries, and grid-linked EVs
— connectivity, distributing power through a reinforced
power grid with extensive connections that can be used
both ways depending on production and demand
— demand-response solutions that shift demand to
periods of higher production and lower cost; for
example, making industrial hydrogen by solar-powered
electrolysis during peak power generation.
While flexibility solutions will improve over time, they
will have to cope with a rapidly rising share of variable
renewables in the power mix. Variability will therefore
always be a challenge, and LCOE should not be the sole
indicator of solar PV’s competitive position. In our ETO
model, we allow for various generation technologies to
receive different power prices; hence, levelized profita-
bility accounting for both price and costs is more
relevant than only levelized costs. We find that solar PV
remains the technology with the lowest average capture
prices due to its variability. These low prices will vary
between regions, influenced by the regional solar PV
share, the competing power mix, and the affordability
of flexibility options.
Lower capture prices will not, however, be a showstopper
for the strong growth of PV generation. Increasingly, as
discussed above, PV and storage systems are designed as
a ‘package’ that can produce energy on demand, just like
hydropower, nuclear, or combustion power plants.
Forecast
The growth of solar PV has been remarkable: 1 GW per
year was installed for the first time in 2004, 10 GW added
in 2010, and 100 GW in 2019. In 2021, 150 GW was added
despite disruptions in global production and supply of
solar panels and related equipment due to COVID-19 and
the looming threat of war in North East Eurasia.
We predict global annual installations will continue to rise,
reaching about 550 GW per year of net capacity additions
by 2040 (Figure 3.3). Within a decade, about one fifth
of all PV installed will be with dedicated storage, and by
mid-century this share will have risen to half.
By mid-century, total installed capacity will be 9.5 TW for
solar PV and 5 TW for solar+storage. The resulting 14.5 TW
of solar capacity is 24 times greater than in 2020.
In Figure 3.4, we can observe the rise of solar capacity
as a share of total installed capacity. While the share
of other types of power plants remains more or less
constant, solar capacity rises globally while fossil
capacity reduces. In 2050, more than half of all installed
capacity globally will be solar.
While solar will have a share of 54% of installed capacity
in mid-century, it will account for 30% of global on-grid
electricity generation (Figure 3.5). This is due to the
lower capacity factors of solar power stations compared
with other VRES such as wind and hydropower. Never-
theless, 23 PWh per year of solar electricity will be
generated globally in 2050.
Regional variations
Figure 3.6 presents the solar electricity generated by
each region. In 2020, Greater China was the largest
producer of solar electricity, with a regional share of
30%, closely followed by North America at 20%. But by
2050, Greater China’s regional solar dominance will
reduce slightly, while the Indian Subcontinent catches
up, with a share of 25% by 2050. As in 2020, we expect
North East Eurasia to have the lowest regional share in
2050, a paltry 2%.
In addition to total solar generation, it is instructive to
observe the relative importance of solar electricity in
total electricity generation for different regions. Figure
3.7 presents the evolution of the share of solar electricity
in the power generation mixes of five selected regions,
88
DNV Energy Transition Outlook 2022
89
Renewable energy CHAPTER 3
all of which are expected to see such shares increase
between 2020 and 2050. But there are some key differ-
ences when it comes to when solar will overtake fossil-
fuel generation or other VRES and nuclear.
For example, other VRES and nuclear are expected to
increase their shares in Europe. But climate change
concerns, power sector decarbonization, and policies
favourable to solar mean that European solar overtakes
fossil-fuel generation well before 2040.
On the other hand, we expect solar electricity to gener-
ate more than half the total electricity in Middle East and
North Africa in 2050. This is due to the prevalence of
favourable conditions such as high solar irradiation, and
relatively less availability of other VRES, such as wind in
the region. But high availability of domestic oil and gas
resources results in solar electricity overtaking fossil
electricity only after 2040.
Solar electricity generation in the Indian Subcontinent
will have a share of 52% in 2050, the highest among all
regions. To achieve this, the region will have about 3 TW
of solar capacity connected to the grid (Figure 3.8). This
will be second to 4.5 TW installed in Greater China, which
will have 30% of all the solar capacity installed in 2050.
Off-grid solar capacity
In addition to the grid-connected solar, we expect
off-grid solar to be installed for hydrogen production
through electrolysis and to supply off-grid and mostly
rural demand, particularly in Sub-Saharan Africa and the
Indian Subcontinent. By 2050, a little more than 1 TW
capacity of solar PV will exist exclusively producing
hydrogen, the majority of which will be in Greater China
and the Indian Subcontinent (Figure 3.9). About 260 GW
of off-grid solar capacity will be installed to provide
electricity in hard-to-reach districts of Sub-Saharan Africa
and the Indian Subcontinent.
Sensitivities
Solar PV mainly competes with wind and other renewables
in power generation and is therefore not so sensitive to
carbon prices. Furthermore, future renewable subsidies
are of limited importance to the results, as the renewable
electricity sources mainly compete with each other.
Increasing natural gas prices results in an increasing
solar PV share in the power mix. More interestingly,
when gas-fired generation decreases because of
sustained high natural gas prices, contribution of
solar+storage increases. This is because solar+storage
has the advantage of supplying electricity more evenly
when compared with solar PV alone.
90
DNV Energy Transition Outlook 2022
91
Renewable energy CHAPTER 3
3.2 WIND
Solar PV co-located with storage technologies (referred to
simply as solar+storage) refers to power stations where
solar modules and storage, usually battery storage, are at
the same site and invariably financed and developed in
tandem. We can contrast solar+storage with standalone
battery systems and with standalone solar power stations.
A utility-scale standalone battery can buy electricity from
the grid when power is cheap and sell it back when
expensive. Storage in a solar+storage plant recharges
only with power from the on-site solar panels, and sells
power to the grid when advantageous. Compared to a
standalone solar PV power station, solar+storage has the
clear advantage of selling its generated power at a time
other than the time of generation, meaning it can sell
power when the price is higher.
Co-locating solar and storage has clear cost advantages.
During the investment phase, the costs of permitting,
siting, and equipment are shared. Also, by making a single
connection to the power grid instead of two, the grid
connection cost is also slashed. During the operating
phase, further advantages can be gained by sharing
transaction costs. Furthermore, co-locating solar and
storage may help prevent curtailing solar output. In a
normal solar power plant, the inverter capacity is usually
designed to be lower than the solar module capacity, thus
ensuring higher utilization of the inverter, which has a high
cost. This inevitably results in curtailment when the solar
output exceeds inverter capacity. But in a solar+storage
plant, all solar output can be stored and released at the
same power rate as the inverter capacity, thus avoiding
curtailments.
The biggest financial incentive, however, has been
government incentives. In the US, prior to the Inflation
Reduction Act in August 2022, energy storage projects
qualified for the Federal investment tax credit only if
charged from a qualifying generation source such as a
wind or solar project. It meant storage developers had
about a 30% capital cost advantage if they co-located
with solar or wind. This incentive was preferred by solar
developers more than wind developers because the
production tax credit was more advantageous for the
latter. This policy has been so successful that, as of 2021,
North America leads the world in solar+storage, hosting
more than a third of global solar+storage capacity.
However, the lifting of the requirement to charge batteries
from renewables will significantly reduce the incentive to
co-locate solar and storage.
Despite the potential advantages, co-locating solar and
storage can also lead to inefficiencies. Selecting the site
of solar+storage plants is usually dictated by the solar
output. But the biggest potential revenue source for
standalone batteries is price arbitrage; buying the
electricity cheap and selling it high. Therefore, its location
in the power grid is critical for the battery storage. There
will be no ultimate victor in the competition between
standalone systems and solar+storage, but only local
winners where conditions in time and space favour one
over the other. One thing is clear though; with cheaper
batteries and solar modules, solar and storage, as both
co-located and standalone systems, will be two of the
main components of the power system.
In a solar+storage plant, all solar output can
be stored and released at the same power
rate as the inverter capacity, thus avoiding
curtailments.
Solar and Storage — why co-locate?
Wind power provided 6% of the world’s electricity output
in 2020, almost exclusively in the form of onshore wind. In
some regions, like Europe and North America, its share of
electricity generated was as high as 15% and 8%, respec-
tively (Figure 3.10). This uptake has been driven by
financially supportive policies and growing awareness
of the impact of conventional energy sources on the
environment and climate. We foresee onshore wind
being more cautiously supported in the future in some
high-income countries where the industry has reached
a high maturity level and conflicts over wind-turbine
locations loom. For offshore wind, we expect strength-
ened support in countries with limited land areas,
bypassing community opposition. By 2050, Europe and
OECD Pacific will be the key regions where offshore wind
generates more energy than onshore wind.
Electricity generation
We foresee electricity generation from on-grid wind
increasing from 1,600 TWh per year in 2020 to 19,000
TWh per year in 2050, with Greater China, Europe and
North America providing the largest output. After 2030,
regions like OECD Pacific, and the Middle East and North
Africa, will also see significant growth. By 2050, wind will
provide almost 50% of on-grid electricity in Europe, 40%
in North America and Latin America, and more than a
third of electricity generation in Greater China (Figure
3.10). The share of offshore wind in total wind electricity
generation will increase steadily, rising globally from 8%
in 2020 to 34% in 2050, 6% of which is floating offshore.
In terms of the percentage of regional electricity demand
supplied from bottom-fixed and floating offshore wind,
Europe will remain in the leading position throughout the
forecast period.
Capacity factors and costs
In 2020, a 1 MW onshore wind turbine generated on
average 2.1 GWh per year of electricity. In other words,
the average utilization, or capacity factor, of all onshore
wind turbines in the world was 26%. As wind capacity
expands, new wind regimes will be exploited. Although
some farms may have lower average wind speeds, new
turbine types will allow better performance under
varying wind conditions. Such developments along with
continued increases in turbine, blade, and tower sizes,
will lead to improvements in the capacity factors,
92
DNV Energy Transition Outlook 2022
93
Renewable energy CHAPTER 3
bringing the world average for onshore wind turbines to
34% by 2050. For offshore wind turbines, the average
capacity factor is already 38% due to the more favourable
wind conditions offshore. We expect this to rise to 43%
by 2050.
Figure 3.11 shows where the cost savings will originate.
Though onshore wind is the most mature segment, it will
still see cost reductions of 50% over the period 2020 to
2050. The largest reduction in the average LCOE from
onshore wind will come from higher capacity factors.
TABLE 3.1
Installed wind capacity by region
Units: GW
2020 2030 2050
Region Onshore
Fixed
offshore
Floating
offshore
Onshore
Fixed
offshore
Floating
offshore
Onshore
Fixed
offshore
Floating
offshore
NAM 136 0 0 270 29 2 662 148 31
LAM 33 0 0 97 29 0 331 120 7
EUR 183 25 0.1 274 98 8 449 312 55
SSA 3 0 0 12 0 0 34 13 3
MEA 13 0 0 59 18 0 250 78 14
NEE 3 0 0 15 11 0 29 41 5
CHN 280 10 0 744 103 2 1669 515 94
IND 41 0 0 103 17 0 415 120 38
SEA 3 0 0 27 15 0 282 96 27
OPA 13 0 0 43 26 2 107 101 16
World 708 35 0.1 1 645 345 14 4 228 1544 289
New turbine types will allow better performance under varying wind conditions. Such developments along with
continued increases in turbine, blade, and tower sizes, will lead to improvements in the capacity factors: rising to 34%
for onshore turbines, and 43% for offshore wind by 2050.
94
DNV Energy Transition Outlook 2022
95
Renewable energy CHAPTER 3
3.3 HYDROPOWER
Hydropower is the historical means of renewable electric-
ity generation. It represented 55% of total renewable
energy generation in 2020, and 16% of overall electricity
generation. But in contrast to solar PV and wind, growth
will be moderate.
In many parts of the world, VRES (i.e. variable renewable
energy sources like solar PV and wind) will be a strong
competitors against hydropower, causing average
electricity prices to decline, and creating adverse
conditions for new hydropower. However, policy continu-
ity for hydropower projects and rising electricity demand
will ensure that hydropower projects will continue to
be pursued, at least in developing economies.
There is a ‘frenemy’ relationship between VRES and
hydropower. As solar PV and wind energy will grow
strongly, hydropower will increasingly complement them
and provide the necessary flexibility for the grid, both for
daily and seasonal variation management.
Pumped hydro, which increases water volumes by
harnessing surplus solar and wind energy to pump water
back up to the reservoir, will remain a part of this picture.
However, because pumped hydro requires new invest-
ments and involves energy losses, many areas will
continue with traditional hydropower, including reser-
voirs without pumping facilities. Run-of-river hydro,
though lacking storage and therefore resembling PV and
wind energy, will also continue to play a role. Compared
with wind and solar power, dammed hydropower
production can be withheld on sunny and windy days.
This enables hydropower to receive much higher average
prices and ensure profits despite having a higher LCOE
than wind and solar PV.
Forecast
Hydropower generation has doubled over the last 20
years, and growth will continue until it slows down in the
2040s (Figure 3.13) as suitable resources in prime loca-
tions will have been exploited. Until 2040, most of the
growth will take place in Greater China, the Indian
Subcontinent, and South East Asia. After 2040, growth
in generation from hydropower will mainly happen in
Sub-Saharan Africa. In a world seeing doubling of
electricity generation by 2050, hydropower generation
As onshore wind projects move to less favourable
locations and to regions with higher costs, there will be
a slighter decrease in the ‘non-turbine investment cost’
component — comprising non-turbine material costs, as
well as labour, overhead, and tax costs — but its impact
will be limited. The reductions in the levelized costs for
fixed and floating offshore wind will be 39% and 84%,
respectively. The majority of the cost savings will be
from capacity factors and turbine costs for fixed
offshore wind, while capacity factors and non-turbine
investment costs will decrease the most for floating
offshore wind, as experience of installing and operating
offshore wind turbines builds.
Forecast
Globally, wind power has been growing steadily since the
early installations in the 1980s. Grid-connected installed
capacity reached 743 GW at the beginning of 2020. We
forecast 1 TW in 2023, 2 TW in 2030, 4 TW in 2042, and
6 TW in 2050, of which 1.8 TW will be offshore (Table 3.1).
These developments are linked to larger turbines,
mega-sized projects, and a more dedicated offshore
supply chain. In addition, the 2020s will see floating
offshore wind progress to full-scale demonstration
projects and on to commercial-scale deployment.
We predict that floating offshore wind projects will have
289 GW of grid-connected installed capacity by 2050.
Global wind capacity additions will increase from 92 GW
per year in 2020 towards 374 GW per year by mid-century,
with a brief stagnation period in the early 2020s due to
COVID-19. Starting from the mid-2020s, some of the
capacity additions will be due to the replacement of early
installations that have completed their lifetimes. Our
model assumes 28 years for the lifetime of onshore wind,
33 years for fixed offshore, and 28 years for floating
offshore. Because wind technology is still in its early
stages of development, it is unclear when existing
capacity will complete its technical life, nor what will
happen afterwards. However, it is likely that early wind
installations that complete their lifetimes will be repow-
ered with new wind turbines that reflect state-of-the-art
technology. This is already happening, with some existing
wind farms being repowered even before the end of their
technical lifetimes to take advantage of favourable
financial conditions.
Capacity dedicated to hydrogen production
Towards 2050, there will be a considerable growth of
off-grid wind capacity dedicated to green hydrogen
production through electrolysis. As specialized installa-
tions not connected to the grid, these installations can
be designed and economically optimized for the specific
task of hydrogen production and not much public
infrastructure is required, though some storage capacity
will be needed. By 2030, there will be 110 GW worldwide
of off-grid wind capacity, rising to 406 GW in 2040 and
finally 738 GW in 2050 (Figure 3.12). Onshore wind will
dominate off-grid capacity, making up 69% of the mix
worldwide in 2030, rising to 77% by 2050. Regionally,
Greater China will have the most off-grid capacity in 2050
— about 60% of world capacity — followed by Europe.
Towards 2050, there will be a considerable
growth of off-grid wind capacity dedicated
to green hydrogen production through
electrolysis.
96
DNV Energy Transition Outlook 2022
97
Renewable energy CHAPTER 3
3.4 NUCLEAR POWER
Nuclear power has historically benefitted from energy
security concerns in terms of providing reliable, carbon-
free baseload power at reasonable prices. With the
Fukushima accident in Japan in 2011, and Germany’s
subsequent decision to shut down its nuclear generation,
nuclear power has had a rough decade competing
against incumbent, fossil-based electricity generation
and the renewable energy newcomers. With the invigor-
ated focus on energy security as an effect of the Ukraine
war, many regions are again eyeing nuclear as a viable
option to provide power, albeit at high prices, but void
of fluctuations and dependency on other countries for
delivery of fuel such as natural gas.
Even considering those concerns, nuclear will find it
difficult to significantly change its future, for the same
reasons that previously hindered uptake. The absence of
long-term, viable solutions to nuclear waste manage-
ment, and the rising costs and construction times
stemming from increased safety concerns, will limit new
nuclear’s ability to compete in the future. However, the
future looks a bit more favourable for the refurbishment
and re-starting of nuclear plants that are currently
operating, halted, or earmarked for decommissioning.
Japan has a considerable capacity of mothballed nuclear
power, and there are signs that political and public
opinion is starting to shift amid greater awareness of the
need for the country to reduce dependency on expen-
sive imported LNG that creates geopolitical dependen-
cies not necessarily in its long-term interest.
Electricity generation
Our Outlook reflects the change in perspective, though
many of the same roadblocks to nuclear remain. Our
forecast shows nuclear staying quite stable at today’s
levels, growing from the late 2030s, followed by a long
plateau before a slight decline late in the forecast period,
see Figure 3.14. The eventual decline happens as many
old nuclear plants retire without any new additions and
are replaced by renewable power generation. Nuclear
power output peaks just above 3 PWh per year by 2037
then reduces to 2.9 PWh per year in 2050, 13% greater
than today. North America, Europe, Greater China, and
North East Eurasia are currently the top four nuclear
energy regions. Within a decade, Greater China’s output
will have grown to almost the same level as Europe and
North America. OECD Pacific and the Indian Subconti-
nent will see significant growth throughout the whole
forecast period, doubling and tripling their respective
outputs compared with today. South East Asia will add 50
TWh of nuclear by 2050, with such growth starting only in
the 2040s.
Regional variations
Several nations – such as Bangladesh, Belarus, Turkey,
and the UAE – are just starting to pivot towards nuclear.
However, the future of nuclear will be determined by what
happens to existing power stations. Half the world’s
installed nuclear capacity is over 30 years old, and many
reactors are approaching the end of their original design
lifetimes. Some countries, such as Spain and Germany,
are most likely decommissioning. However, the new
energy reality in Europe and elsewhere is one of
increased focus on energy security and high energy
will still provide 13% of total electricity supply, down from
16% in 2020. This loss of share is transferred to solar and
wind worldwide.
The mid-2020s will see expansion of hydropower capacity
in Greater China of about 35 GW per year, which will taper
off by 2030. This will be followed by capacity additions in
the 2030s and 2040s in the Indian Subcontinent, South
East Asia, and Sub-Saharan Africa.
Stored energy with pumped hydro will follow the increase
in hydropower generation. Yearly stored capacity will
more than double from 80 PWh in 2020 to 190 PWh in
2050, an additional 2% to hydropower plants' output.
Hydropower and climate change
Hydropower used to be seen as the most reliable source of
power generation. But recent droughts in China, Europe,
Latin America, and the US – with related reductions in
hydropower output – have shown that climate change
may challenge that belief. Climate change will accelerate
melting of mountain glaciers, induce greater rainfall
variations and more recurrent droughts. These effects
create additional uncertainty over future output.
Furthermore, hydropower usually has the dual purpose
of generating electricity and managing the water
resource for flood control and irrigation purposes.
While small hydropower schemes are generally low
impact, large dams can have regional effects. In some
regions where water is already a scare resource, climate
change effects might exacerbate conflict around its
control. The most iconic example is the Great Renaissance
dam in Ethiopia. This dam over the Blue Nile began
operating in 2022, and with a 5.2 GW capacity when
completed, it will eventually be the largest hydropower
plant in Africa. But downstream, Sudan and Egypt fear a
strong reduction of water flow, which would endanger a
fragile agriculture and water supply to an ever-growing
population, also raising risks of a military escalation.
The effect of these various parameters is hard to quantify
and is not directly accounted for in our forecast. However,
they might significantly influence the prospects for hydro-
power in the coming decades.
98
DNV Energy Transition Outlook 2022
99
Renewable energy CHAPTER 3
Bioenergy is currently the largest source of renewable
energy and one of the key options to supply energy
needs towards 2050, especially in sectors that are hard
to electrify. It is derived from many forms of biomass
such as organic waste and residues from agriculture and
livestock production, wood from forests, energy crops,
and aquatic biomass such as algae. Bioenergy applica-
tions are as diverse as its many forms. Solid fuels such
as wood or charcoal are used for buildings heating,
cooking, or in combined heat and power plants. Wood
chips are increasingly used in coal-fired power plants to
reduce emissions output. Gaseous forms of bioenergy,
such as biogas produced from waste, are used for
power production, as fuel and, if further upgraded,
as biomethane. Biomethane in particular is gaining
much attention as natural gas prices are soaring and
domestic energy security becomes an issue. Liquid fuels
produced from crops, algae, or genetically modified
organisms are viewed as promising options in hard-
to-abate transport subsectors such as aviation and
maritime.
Carbon neutral?
Combustion of biomass, including biofuels, is considered
carbon neutral, and thus no carbon emissions are
counted. This is in line with IPCC assumptions that carbon
in biomass is eventually absorbed from the atmosphere
by photosynthesis, assuming that the burned plants are
replaced with new plants. We note that while biofuels are
broadly considered renewable, the view that their use is
carbon neutral is contested by many scientists mainly
due to the timing of CO2
reabsorption by replacement
growth, which is much slower than the sudden release
of CO2
via combustion (Scientific American, 2018).
The sources of biomass used in the future will differ from
today, favouring biofuels derived from waste. Third and
fourth generation biofuels are likely to be subject to close
scrutiny before they are approved for use and labelled as
sustainable and carbon neutral. Between now and 2030,
while the next generation of biofuel infrastructure is
being developed, it is likely that biofuels produced from
unsustainable sources such as energy crops will be an
3.5 BIOENERGY
prices. This, coupled with the high cost of nuclear
decommissioning and the difficulty of replacing sudden
capacity retirements with low-carbon alternatives, have
led some governments to consider extending nuclear
plant lifetimes through upgrades and life-extension
measures. For example, Belgium extended its nuclear
decommissioning timetable from 2025 to 2035. France
and Sweden are advancing their nuclear shutdown plans,
but with increasing debate over re-invigorating nuclear
research and, potentially, building new plants. South
Korea's new president has vowed to reverse phase-out
plans, and Japan is working towards bringing some of its
reactors back online, subject to improved safety
demonstration.
Small modular reactor (SMR) technology has increasingly
been praised as the next-generation technology to take
over. However, evidence is so far lacking to support SMR’s
claim to solve some of the existing hurdles for nuclear,
such as high cost, safety, non-proliferation policy. SMRs
could eventually – beyond our forecast period – make an
important contribution to the decarbonization of hard-to-
abate sectors, including shipping and aviation, through
dedicated powering of production of low-carbon
hydrogen, ammonia, and e-fuels. In last year’s Technology
Progress Report (DNV, 2021a), we discuss both new
fission and fusion technology in greater depth, where we
believe those to be too far from maturity to make an
impact within our forecast period.
100
DNV Energy Transition Outlook 2022
101
Renewable energy CHAPTER 3
Biomethane is currently in vogue as a carbon-neutral fuel,
and even more so since Russia's invasion of Ukraine given
the inherent energy security of domestic biomethane.
For the different transport subsectors, biofuel-blend
mandates will gain momentum. Looking some years
ahead, demand will be amplified by the use of pure
biofuels in sustainable aviation fuels (SAFs) and for green
shipping. However, the big increase in propulsion fuels
will be in synthetic fuels and ammonia, with biofuels
being used mainly in the transition period. Bio-based
fuel demand will extend beyond transport to sectors
such as manufacturing and, to a lesser extent, buildings.
A decarbonized economy in 2050 will clearly have
multiple biofuel requirements — and by then, the emphasis
will fall on sustainable bioresources, potentially limiting
biofuel supply.
We forecast biomass use of around 76 EJ per year in
2050, 25% more than today's 57 EJ. To supply such an
enormous quantity of biomass, three main feedstock
classes will be prominent — dedicated energy crops,
waste and residue streams, and aquatic resources.
Estimates of the total available potential from these three
sources differ widely within the range 100–1,500 EJ per
year. However, applying sustainability constraints
narrows the most likely range to 200–500 EJ per year (EC,
2010 and IEA, 2007). More conservative assumptions
bring the potential down further to about 150 EJ per year
(WBA, 2016). This would still be sufficient to supply the
76 EJ per year biomass use that we forecast, but that does
not mean an absence of constraints everywhere. Biomass
used for energy purposes should not compromise food
production, must avoid additional carbon releases, and
should not harm biodiversity (ETC, 2021).
As we detail in Chapter 8, the ‘most likely’ future that we
forecast does not meet the Paris Agreement temperature
goal, which requires a net–zero-emissions global economy
by 2050. This has implications for biomass demand. We
foresee about 82 EJ of biomass in a net-zero compliant
energy system by 2050, which can still be satisfied by the
biomass available. However, biomass availability and
biomass access are two different things. Biomass sourcing
and further inclusion in future supply chains is a difficult
task and needs joint efforts from industry, government,
and the public.
Indian Subcontinent (+40%) will see a significant increase
in their bioenergy use, though from a low starting point
in Middle East and North Africa. More modest growth is
expected in North East Eurasia (+37%), OECD Pacific
(+25%), Latin America (+13%) and Sub-Saharan Africa
(+12%). Slower growth is anticipated in North America
(+7%), and slightly decreasing use in Europe.
Over the forecast period, Sub-Saharan Africa will
maintain its position as the largest user of biomass, with
a stable global share of 28%. As shown in Figure 3.17,
overall demand for biomass will increase, and the
composition of biomass used globally will also change
considerably from the traditional forms such as wood or
charcoal (used, for example, in cooking) to a greater
share of modern biofuels derived from waste (being
used, for example, in aviation and maritime). In some
regions, traditional biomass is currently the dominant
energy source in residential buildings. This direct use
will change but will remain a considerable energy
source for some regions.
Sensitivities
Our sensitivity analysis indicates that high carbon prices
will hinder biomass end use because biomass combustion
will be subject to carbon pricing. Doubling the carbon
price, however, will decrease biomass use by 3%. Similar
effects will result from lower prices for competitors of
biomass, such as natural gas. Higher natural gas prices,
push biomethane development in turn.
Is there enough biomass to supply demand
across many sectors?
important part of the biomass. However, ongoing
food-versus-fuel discussions will favour biomass that
could not otherwise be used to feed the world.
The time perspective of biomass emissions is important
and is a concern. In our forecast, potential additional
emissions due, for example, to deforestation to make
room for crops for liquid biofuels production are
accounted for under agriculture, forestry, and other
land-use (AFOLU) emissions. Emissions during transport
of biomass are accounted for under transport. Neverthe-
less, we still adhere to the overall view that biomass and
thus biofuels, is carbon neutral over time. Biomass-based
value chains can also be carbon negative — such as the
use of organic waste as feedstock for energy production
rather than being left to rot and thus producing methane.
Forecast
Global bioenergy demand supplied from biomass has
almost doubled since 1980. Figure 3.15 shows biomass
for energy use will keep growing until the early 2030s
and level off towards the end of our forecast period.
The transport, manufacturing and power sectors will be
the main contributors to the growth. The overall share of
biomass in primary energy supply grows marginally to
about 12% in 2050 compared with 10% today. As seen in
Figure 3.16, there will be significant growth in the use of
bioenergy in the transport sector, mainly as liquid biofuels,
with gaseous biofuels having a smaller share. With a
predicted doubling between 2020 and 2050, bioenergy
will become an important energy source used for decar-
bonization of transport, accounting for an 8% share of
transport energy use. The major driver for this growth will
be decarbonization policies implemented with measures
such as mandates and carbon pricing, as well as the limited
availability of alternatives such as electrified propulsion
technologies in aviation and maritime transport.
Today, the overwhelming part of bioenergy use in the
transport sector takes place in road transport (99.5%),
mainly in the form of blends with gasoline and diesel, with
a very small amount used in the form of gaseous energy
carriers like biomethane. This is going to change towards
2050. Aviation and maritime transport will increasingly
use biofuels to diversify their fuel mixes and foster
decarbonization.
By 2050, road transport will see a 60% reduction of its
current share of bioenergy demand due to ongoing
electrification and thus a lower demand for blended fossil
fuels. This is also supported by ongoing biomass-sourc-
ing competition with other transport sectors. Maritime
will by mid-century account for 23% of biofuel use in
transport. The majority (52%) will be used in aviation.
Bioenergy use in buildings will reduce by about a third by
2050, mainly due to diminished use of traditional biomass
in low-income regions to supply space heating and
cooking fuel. Even so, bioenergy will retain its leading
share in the mix for buildings, though a third of bioenergy
will be used in buildings by 2050 compared with 50% in
2020. Power stations will increase the amount of bioenergy
used by 50% between 2020 and 2050, raising bioenergy’s
share in the power energy mix to 21% by mid-century. In
2020, 17% of the world’s bioenergy was used in manufac-
turing, and this share will grow by 8% during the forecast
period to reach just above 25% in 2050.
Regional developments
As seen in Figure 3.17, the regional share of demand
will not change dramatically over the forecast period
for most regions. Middle East and North Africa (+70%),
Greater China (+40%), South East Asia (+45%), and the
102
DNV Energy Transition Outlook 2022
103
Renewable energy CHAPTER 3
Other renewable energy sources are likely to remain
marginal on a global scale between now and 2050. For
example, solar thermal and geothermal combined
provide less than 1% of world primary energy by mid-
century, and concentrating solar power (CSP) even less.
In this Outlook, ‘solar thermal’ refers to heat generated in
solar water heaters. Globally, primary energy supply from
solar thermal energy will start declining from today's 1.4
EJ in 2020 to reach 1.1 EJ in 2050. Most such energy heats
buildings, and Greater China will be responsible for most
of the decline as heating water from electricity takes over.
Section 1.3 discusses in more detail how buildings use
energy for heating water.
Though not modelled, CSP is another technology which
is not yet large-scale. This technology concentrates a
large area of sunlight onto a receiver, generating both
heat and electricity. While this improves the efficiency
of power generation, it adds additional manufacturing
complexity and cost. This complexity has hindered the
roll-out of CSP technology, and well publicized failures
such as at the Crescent Dunes facility in the US have
eroded faith in it. Two types of CSP plants exist, either
parabolic trough power plants or molten-salt tower/
central receiver power plants, with both technologies still
needing to mature. There are some up-and-coming CSP
plants in the works – such as the Redstone Thermal Power
Plant in South Africa and Noor Energy 1 in Dubai – and
LCOEs are starting to become low enough to be compet-
itive with other renewable technologies. However, we do
not see this technology reaching a large-scale buiild-out
during the forecast period.
Geothermal energy from the Earth’s crust originates from
hot springs or other low-temperature sources and has
many potential applications, ranging from power genera-
tion to driving heat pumps. Though geothermal energy
for electricity generation is limited to tectonically active
areas, it has high capacity factors and is a relatively
constant source of energy. As of 2020, geothermal
energy provided 3.5 EJ (0.6%) of the world’s primary
energy supply. Worldwide, geothermal energy is over-
whelmingly used by power stations, but there is a
significant demand for it in the buildings sector in China.
Although geothermal energy has the technological
potential to grow in some applications, high costs in
most of the world will limit its expansion.
South East Asia is currently the leading region for
geothermal energy, with more than a quarter of global
supply and use. By 2050, however, there will be signifi-
cant growth in Sub-Saharan Africa’s supply of geothermal
energy to put it on par with Greater China in second and
third place.
Potential future energy sources
As stated in the introduction, we base our forecast on
continued development of proven technologies, includ-
ing advances in these technologies. Such improvements,
like technological developments in solar PV and wind, are
already included in their respective sections.
Technologies that are not yet proven, and marginal
technologies that are not expected to scale, are not
included in our forecast. Ocean energy is one of them.
There are several types of ocean energy, including tidal
energy, wave energy, ocean thermal energy conversion
(OTEC) and marine current power. Of these four, the first
two are the most highly developed today, with a current
installed capacity of 10.6 MW tidal and 2.3 MW wave
power generation capacity. The LCOEs of these technol-
ogies, and the investment costs, are declining but remain
higher than for other forms of renewable energy. Other
barriers to their large-scale implementation are limited
suitable locations, often far from an existing grid, with
accordingly high grid-connection costs. There is also
concern about the environmental impact of these
structures, including noise, risk of collision with marine
animals, and changes to the flow and water quality.
Despite all that, plans have been made for new installa-
tions, the largest being the three-phase MeyGen project
in Scotland. Situated between the Scottish mainland and
3.6 OTHER RENEWABLES the Island of Stroma, the site has ideal depth, water flows,
and proximity to the mainland. Phase one comprising of
four 1.5 MW turbines has been operational since March
2018. Phase two is currently underway with a plan to install
80 MW of tidal stream capacity. In the future, it looks like
ocean energy technologies will be suited to niche markets
– for example small island developing states where it
would be most costly to import energy – or coupled to
another operation to provide it with power, such as oil and
gas platforms or aquaculture operations. In other cases,
ocean energy could be used directly. i.e. not converted to
electricity first, to avoid additional cost and componentry,
for example for wave-powered desalination.
Nuclear fusion is a similar case. For several decades,
nuclear-fusion technologies have been discussed as a
carbon-free source of energy. Several promising research
projects focusing on smaller fusion systems are currently
being piloted. Advances in computing power, materials
science, and manufacturing, together with the rising
availability of venture capital, have enabled recent
progress in fusion technology. Once the domain of
governmental research labs, private companies are now
bringing expertise in other areas, and stronger commer-
cial focus as they seek to realize the potential of this
technology (See details in our Technology Progress
Report 2021). Yet, no plant has produced useable energy
beyond that required to initiate and sustain a fusion
reaction. The availability of fuel – primarily deuterium
– is almost limitless, but there are large uncertainties
about if and when successful operation of nuclear fusion
will occur. Even with a breakthrough, there will still be a
significant delay before energy on a scale comparable to
other power sources will be provided; so, we confine our
forecast to traditional fission technologies.
During the period covered by this Outlook, one or more
of the emerging energy technologies may achieve a
breakthrough, such that they become cost competitive.
However, to have a significant impact on our forecast,
they would need to grow much faster than incumbent
renewable technologies. We do not see this happening
at scale and have therefore excluded emerging technolo-
gies from the forecast.
Geothermal energy in Iceland.
104
DNV Energy Transition Outlook 2022
105
Energy supply and fossil fuels CHAPTER 4
4
Highlights
By 2050, the fossil share of primary energy will dip
slightly below 50% from its current share of more than
80%. This is due to rapid electrification, decarbonization
and accelerating energy efficiencies.
Coal — has already peaked, and its use is expected to fall
almost two-thirds from current levels by 2050.
Oil — the route to an overall decline of 45% by 2050 from
today’s levels – influenced largely by the electrification
of transport – is not smooth. We predict a peak in 2025,
a little above today's demand, before demand
decreases slowly between 2025 and 2035, after which
the decline becomes relatively steep.
Natural gas peaks in 2036 and slowly tapers off to end
some 10% below today's levels. It surpasses oil as the
largest source of primary energy in the late 2040s. Gas
has staying power owing to its diversity of uses — half of
the demand for gas is as final energy in manufacturing,
transport and buildings, and the other half through
transformation for other final uses like electricity,
petrochemicals, and hydrogen production. By mid-
century, just 12% of gas will be carbon free, of which
hydrogen will supply roughly one quarter, with the
balance made up through CCS in power and industry,
and by biomethane. 4.1 Coal107
4.2 Oil109
4.3 Natural gas113
4.4 Summarizing energy supply119
ENERGY SUPPLY
AND
FOSSIL FUELS
106
DNV Energy Transition Outlook 2022
107
Energy supply and fossil fuels CHAPTER 4
Fossil fuels face several challenges from threats of
substitution in several energy system subsectors, to CCS
scale up pressure and capital markets rewarding
non-emitting energy sources with lower capital costs.
Over the coming decades, we will see a gradual phase-
down, first of coal, having the highest carbon footprint,
and thereafter oil and gas, which compete with each other
only to a limited degree. Despite the fact that renewable
sources are already competitive in most places with
fossil-fired electricity, it will take many years for low- and
zero-carbon energy sources to dislodge fossil fuels out
of the broader energy system. Figure 4.1 illustrates our
forecast for how the composition of the various fossil
energy sources, and the non-fossil share, will change in
the coming three decades.
4 ENERGY SUPPLY AND FOSSIL FUELS 4.1 COAL
Fossil fuel presently supplies more than 80% of global energy, and this has
been the case for decades. However, this share is set for dramatic change
as uptake of renewable energy sources is growing rapidly. The fossil slice
of the pie will shrink by around one percentage point per year, and we
forecast that by mid-century, its share of global energy supply will be just
below the 50% mark.
Today, 13% of the world’s oil, 10% of the natural gas,
and 1% of the coal is not used for energy purposes,
but as feedstock in plastics, petrochemicals, asphalt,
and similar products. This fossil fuel is not burned
and, unlike fossil fuel used for energy purposes, does
not cause direct emissions. Still, we chose to include
this non-energy fraction in our primary energy
overview, and it is also included in the fossil fuel share
in Figure 4.1. Were we to subtract non-energy use of
these sources, the present share of fossil fuel in the
energy mix would be 79%, not 81%.
Chapter 1.5 describes how demand for feedstock is
increasing and is expected to peak in the mid-2030s.
Use of fossil fuel as an energy carrier is reducing, and
therefore the share of fossil fuel (especially oil) not
being burned is increasing and will represent 24%
of global oil use in 2050.
If we subtract this fossil feedstock use from all fossil
fuel use, the share of fossil fuel in the energy mix will
be 46% in 2050, instead of 49%, and from 2047
onwards, more than half of all energy being used
will be non-fossil.
The fossil fuel not burned
Once an energy sector favourite, global demand for coal
grew rapidly from 4.7 Gt per year in 2000 to peak at 8 Gt
per year in 2014. But from that point onward, total
demand for coal has and will move in only one direction:
downwards. The economic and trade contraction
associated with the COVID-19 pandemic reduced coal
demand by 7% in 2020. Coal demand will rebound but
will never reach its previous peak, instead falling almost
two-thirds from its current level by 2050.
As a cheap and reliable source of power, coal has been
the preferred technology for electricity generation in
many countries. Power generation was thus the primary
driver for coal demand, accounting for nearly 63% of coal
consumption in 2020 (Figure 4.2). However, closure of old
power stations, particularly in Europe and North America,
and the cancellation of several projects in their pre-
construction phase, especially in Greater China, are
signs of a shift towards wind and solar power generation.
Coal is also used as a heat source in manufacturing, and as
a carbon source for iron-ore reduction in steel production.
For low-heat processes in the production of manufac-
tured goods, direct coal use will give way to electricity.
Moreover, since coal is a very problematic source of local
pollution, China, for example, will continue to switch from
coal to gas for industrial processes. In other regions, gas
boilers and electricity will ensure a steady phase-down of
coal for most industrial heat demand.
For higher-temperature processes (such as making
cement, iron and steel), the switch will be more difficult,
and coal will remain a favoured option despite its high
carbon emissions. Coal demand for high-heat processes
will increase slightly in the near term before falling rapidly
after 2030. Global coal demand in the iron and steel
subsector will decrease almost a fifth by 2050. Today’s
biggest coal consumer, Greater China, will see a halving
of coal use, mainly due to steel production declining by
even more (down 65%). In contrast, coal demand for iron
and steel in the Indian Subcontinent will double by 2050,
resulting in its demand for coal almost equalling Greater
China’s by mid-century.
Total coal use has already declined strongly in North
America and Europe, driven by shifts in the power sector.
Low gas prices have been at the forefront of the fall-off
in North American coal use, whereas renewables growth
is the main factor in Europe. We see a current upswing
of coal being used in Europe in response to Russia’s
invasion of Ukraine, and the associated gas shortages.
However, this is a short-term blip and will not change the
long-term decline in coal use in Europe. Coal use has
flattened in China recently, supported by policies to curb
air pollution in manufacturing and power supply. Over
the last decade to 2020 only the Indian Subcontinent
(45% growth) and South East Asia (90%) have shown
uninterrupted increases in coal usage. All regions will
show a long-term reduction in coal consumption, but not
necessarily in the short term (Figure 4.3 ). Prior to 2030,
coal use in the Indian Subcontinent and South East Asia
will grow. By mid-century, coal usage in OECD regions,
notably North America and Europe, will have declined
by 90% and 80%, respectively. Coal’s decline in coal-rich
OECD Pacific will also be substantial, at 75%.
108
DNV Energy Transition Outlook 2022
109
Energy supply and fossil fuels CHAPTER 4
In near-term power generation, coal will lose out to gas
and renewables in OECD countries, but expand in many
developing nations. After 2030, stricter emissions policies,
increasing competition from renewables, and a ramping-
up of storage and other sources of flexibility technologies
will make renewables more dispatchable and reduce the
competitive position of fossil fuels in general and coal in
particular. Consequently, capacity additions will gradually
fade away, retirements increase, and capacity utilization
will decrease. Our analysis confirms the coal death spiral
feedback-loop: as plant utilization declines, coal power
will become more expensive, thus further reducing its
competitive position, making coal power less affordable,
and thus its use declines yet further.
China and India have recently added capacity and more
coal-fired power stations are planned along with greater
coal use in manufacturing. This inertia will result in
Greater China and the Indian Subcontinent continuing to
retain their current combined share, 70%, of global coal
demand in 2030.
Almost all brown coal, and a significant share of hard coal,
is consumed within its region of production. Only four of
the 10 regions are net importers of coal, namely Europe,
Greater China, the Indian Subcontinent, and Middle East
and North Africa. China, the largest producer and
consumer of coal, is also the biggest importer. However,
the phasing out of coal-fired power plants in China, and
reduced use of coal in manufacturing, will progressively
reduce its demand for coal, though imports will remain
high until 2040 before declining significantly towards
2050 (Figure 4.4). Driven by India’s efforts to increase
self-sufficiency, the Indian Subcontinent will reduce its
share of imported coal. Australia, Indonesia, Russia, and
South Africa will continue to be major exporters, but each
with progressively lower export totals over our forecast
period.
In near-term power generation, coal will lose
out to gas and renewables in OECD countries,
but expand in many developing nations.
4.2 OIL
Over the past few decades, global oil demand has grown
steadily at about 1% per year, with a minor reversal
related to the 2008 financial crisis. In 2020, amid the
global COVID-19 pandemic, this steady growth came
to an abrupt halt. The main source of demand for oil
products is the transport sector, and global transport
(land, sea and air) plummeted during the pandemic.
Since then, transport in most subsectors and regions
has largely recovered to a 'new normal', though in some
countries, such as China, regional restrictions are still
in place.
Figure 4.5 shows historical and projected developments
in global oil demand by demand sector from 1990 to
2050. Driven by population- and economic growth, and
therefore by an ever-increasing demand for transport, oil
has been the world’s leading energy source ever since it
surpassed coal in the early 20th century. In 2020, demand
for oil was 75 million barrels per day (Mb/d), or 154 EJ.
Our modelling suggests that it could peak in 2025 at
about 86 Mb/d (176 EJ), 5% above today's level, before
going into long-term decline. Initially, demand will
decrease slowly between 2025 and 2035, after which the
decline becomes relatively steep, averaging -2.4% per
year over the period 2035–2050. This rate of decline is
much faster than the average growth of about 1% per
year that we have seen historically. In 2050, expected
global oil demand of 56 Mb/d (115 EJ) will be 32% lower
than today. This decline is driven to a large extent by
falling demand in the transport sector, where total
demand goes down by about 47% in the next 28 years.
Sectoral demand
The transport sector’s share of oil demand is currently at
an all-time high of some 67% but will soon start to reduce
as the pace of road transport electrification gathers
speed. Even so, the transport sector will continue to
dominate oil use, retaining a share of 54% in 2050, with
the road subsector taking the largest part, split equally
betweenpassengerandcommercialvehicles.Electrification
of the passenger segment will happen sooner, and its oil
demand will decline by 62% over the next three decades.
110
DNV Energy Transition Outlook 2022
111
Energy supply and fossil fuels CHAPTER 4
Oil use in the commercial road segment will hold up a
little longer. The global number of ICEVs will peak in 2028
at 1.4bn vehicles. Oil use in aviation, shipping, and rail
transport (termed ‘Other transport’ in Figure 4.5) will
initially grow for a few years but then start declining
rapidly from 2026 onwards, ending at three quarters of
today's demand (8 Mb/d) by 2050. By then, the fuel mix
will have shifted to some extent from fossil fuels towards
biofuel, green ammonia, e-kerosene and other low-car-
bon fuels.
Oil is also used as feedstock in the petrochemical
industries. This use does not entail any emissions and will
therefore be sustained in a lower-carbon future. With
declining oil use for various energy purposes, the share
of non-energy use in oil demand will go up from 13%
today to 24% In 2050. In absolute terms, oil demand for
non-energy use will increase from around 11 Mb/d today
to 14.2 Mb/d by 2040, and then start slowly declining to
13.3 Mb/d by 2050, due mainly to a decrease in plastics
production as a result of demand-side reduction and
substitution measures as well as higher rates of recycling
(see Chapter 1, Section 1.5).
The third largest sector in terms of oil use is manufacturing,
where demand will remain in the range of 5.5-6.3 Mb/d,
but its share of oil demand will rise from 7% to 10% by
2050, reflecting the relative decline in oil demand in other
sectors. Oil, or its products, are also used in buildings,
power, and ‘other’ sectors, as well as for producing the oil
itself. However, these uses are small (5% of total oil
demand) and remain so throughout our forecast period.
Regional oil demand
Peak oil will come at very different times across regions.
As with energy demand in general, global oil demand
will shift eastwards and southwards. Looking at regional
demand (Figure 4.6), North America and Europe had the
highest share for many decades, but Greater China
overtook Europe as second largest regional market in the
second half of the previous decade. North America and
China will continue to be the top two users of oil over the
next 15 years. However, both will be surpassed by Middle
East and North Africa in the 2040s, as rates of electrifica-
tion of the road transport subsector in the latter region
lag behind EV uptake in North America and Greater
China (see Chapter 1, Figures 1.6 and 1.7).
In 2050, Middle East and North Africa, Greater China,
and the Indian Subcontinent are expected to be the top
three regions in terms of oil demand, though several
regions will be very close to each other, therefore this
ranking is subject to uncertainty. The bottom three
regions are expected to be Sub-Saharan Africa, OECD
Pacific, and Europe, but demand will be rising in the first
and falling in the other two regions, which are more
mature in terms of economic development. Oil demand
in both Europe and OECD Pacific will be around 40% of
present levels by mid-century. Driven by electrification
of the road transport segment, North America will see
oil use drop to a third (34%) of its present level. In
Greater China, an increasing number of vehicles on its
roads will mean that oil use grows initially before
peaking in 2026, at 9% higher than today. Thereafter,
fast uptake of EVs will result in China’s oil use entering
rapid decline to 55% of what it is today by 2050. In
contrast, Indian Subcontinent's oil use will peak around
2044 and will still be two thirds higher in 2050 than
today. Sub-Saharan Africa’s oil use will not peak within
the forecast period and will more than double between
now and mid-century.
Production and trade
No other energy commodity is transported around the
globe to the same extent as oil, and the centres of global
oil production are generally not the main areas of
consumption. Middle East and North Africa is the largest
oil-producing region, and Figure 4.7 shows that its share
in global crude oil production will rise even further from
one third today to close to two thirds in 2050. The main
reason for this is its abundant reserves and lowest
per-barrel extraction costs. Absolute production in the
region will also be around 15% greater in mid-century
than today.
Reliance on one region producing well over half the
world’s oil could be considered a risk. However, security
of supply is generally improving as the share of energy
produced locally or regionally increases proportionally
with the growth of renewables, and oil’s role in the
geopolitical picture will diminish in the coming decades.
Our analysis distinguishes between offshore, onshore
conventional, and onshore unconventional oil production.
Globally, the distribution remains relatively stable over
112
DNV Energy Transition Outlook 2022
113
Energy supply and fossil fuels CHAPTER 4
the forecast period. The share of conventional onshore
increases from around 50% today to about 56% by 2050,
while the share of offshore production declines slightly
from around 33% to 29%. Over the same period, the
share of unconventional onshore production, around
18% today, initially rises slightly before declining to
around 15%. Naturally, there are large regional variations,
with conventional onshore dominating production in
Middle East and North East Eurasia, whereas in North
America the lead is now taken by unconventional
onshore. It should be added that uncertainty over where
oil will come from is high. In our ETO model, oil produc-
tion equals demand, and regions do not develop their oil
resources if cheaper oil can be supplied by other regions.
Although global oil production will always equal demand
over time, since storage is limited, regional distribution
might not follow the same disciplined pattern assumed
in our model.
Heading into a future in which oil demand levels off and
declines, the oil industry is entering unfamiliar territory,
with significant risks of volatile and lower oil prices for
producers. OPEC decisions on curbing oil production
to maintain a certain price level, or similar political
decisions, have not been included in our model. In our
forecast, new oil production capacity will be developed
through to 2050, but we foresee annual global capacity
additions peaking around year 2025 and thereafter
declining 70% (compared with today) over the next 30
years. As unconventional capacity has a shorter average
lifetime than conventional, both onshore and offshore,
regional distributions of capacity additions are not
directly comparable. Unconventional capacity additions
will be predominantly in North America. Middle East and
North Africa will dominate conventional capacity addi-
tions. The reduction in oil demand will make it less
attractive for the industry to expand production into
challenging environments, such as deep water, high
pressure, and/or remote locations such as the Arctic.
Sensitivities
The most decisive factor in the rate of decline in oil
demand is the speed with which EVs will take over from
ICEVs. Battery costs are the most important determinant
of EV competitiveness. Battery learning rates — how
quickly battery costs come down — are therefore of key
importance. If we model a halving of battery learning
rates over the next 30 years, we find oil demand in 2050
rises by 12% (or about 13 EJ). Conversely, if the battery
learning rate is raised 50%, we forecast that global oil
demand would decline beyond our base level by about
7% (or 7 EJ).
Over time, technology learning is more important for oil
demand than the level of EV subsidies. As oil demand
from the power sector is low, sensitivity to changes
therein, including those occurring with solar PV and wind,
is relatively low. Electricity price itself is a factor, and
halving/doubling electricity prices will result in oil
demand varying by around ±6% from our base case.
Finally, if we look at oil price itself, our analysis indicates
that, should the oil price halve, then demand for oil will
increase by some 17%, whereas doubling the price will
reduce demand by 10%. The numbers might well be
higher than these, as significant rebound effects that are
not included in the model — for example, on transport
services themselves — would occur in addition to changes
in the energy mix. In this sensitivity discussion, we have
considered changes in individual parameters separately.
However, combinations of changes could also happen
simultaneously.
For oil, we foresee annual global capacity
additions peaking around year 2025 and
thereafter declining 70% (compared with
today) over the next 30 years.
4.3 NATURAL GAS
Natural gas, the least carbon-intensive fossil fuel, will
surpass oil to become the world’s largest energy source
in the late 2040s. There will be new uses for natural gas,
particularly with increasing use in maritime transport, but
also as a source for low-carbon (blue) hydrogen (Figure
4.8). Slightly less than half of the demand for natural gas
will derive from final use — in buildings, manufacturing,
and transport. The other half will come from transfor
mation to other final uses — for example, electricity
generation, non-energy use as feedstock for petro-
chemicals and fertilizers, own use (demand from the oil
and gas and energy industries during production and
distribution), and for hydrogen production.
Demand
Demand for natural gas and biomethane (both hereafter
referred to as gas) is set to slowly increase between now
and 2036, then to decline towards 2050. In Europe, gas
consumption peaked last decade, and its decline will
continue — strongly influenced by the war in Ukraine and
its implications (see Chapter 1, The Russian invasion of
Ukraine) — reaching about a half of last year’s value in
2050. In OECD Pacific, gas consumption peaked last
decade and will continue its subsequent decline right
through to mid-century, when it will be half of today’s
level. In contrast, in Greater China, gas will peak in the
early 2030s. After a five-year respite to 2025, gas growth
in the Indian Subcontinent will continue, climbing to a
level in 2050 more than twice as high as in 2020.
Use of gas in power generation will decline from today`s
35% to 29% by 2050 but will still account for the greatest
sector share of gas use at that time. In absolute terms,
gas use in power generation will plateau in 2030 then
start to decrease from the 2040s as a result of growth in
renewables.
From a relatively low starting point, gas demand in the
transport sector will almost double by 2040, before
declining by almost a third to 2050 due to its increasing
displacement in its main application, maritime transport
by the rise of hydrogen and its derivatives such as
ammonia. Manufacturing’s appetite for gas in 2050 will
be about the same as today, while its share in demand for
114
DNV Energy Transition Outlook 2022
115
Energy supply and fossil fuels CHAPTER 4
gas increases from 16% to 19%. Similarly, demand for gas
from the buildings sector will be roughly the same as now
in 2050 — albeit after a slight decrease by 2030 — with a
continued share of 22%. The share of non-energy
applications (largely petrochemicals) in demand for gas
will remain stable at 10% as demand for products that use
gas as a feedstock remains at current levels and hydrogen
is increasingly used. Own use (demand from the oil and
gas and energy industries during production and
distribution) will grow over the next five years but will fall
to 10% of today’s level by 2050. Decreases in own use are
likely to arise from efficiency gains, from the electrifica-
tion of production facilities, and from less flaring. Some of
this use in the energy sector will be for liquefaction and
regasification of gas that is transported as liquefied
natural gas (LNG).
Regional developments
Among the regions, primary demand for natural gas will
double in the Indian Subcontinent by 2040. It will grow
10% in Greater China by 2030, then decline steeply to
return to 2016 levels by mid-century, though still account-
ing for 8% of world natural gas demand at that time
(Figure 4.9). Together, these two regions accounted for
15% of total natural gas demand in 2020. This will rise to
19% by 2035 and fall to 13% by 2050. Both regions are set
to see strong policy support for natural gas consumption
in the short term, with local pollution prevention as a main
driver. As each has limited natural gas resources, they will
togetheraccountfor67%ofnetnaturalgasimportsin2035
and 78% in 2050 (Figure 4.10). Greater China is one of the
main importers of natural gas, and imports will increase in
the coming decade, followed by a steep decline to 2050
as its consumption of natural gas reduces (Figure 4.11).
Europe's natural gas imports will soon begin a steady
decline to about a third of current volumes by 2050.
European policy is moving decisively to slash the region’s
dependency on imported Russian gas to almost zero.
North East Eurasia will remain a major gas exporter
during the forecast period, but its foreign markets will
change significantly. While it will see some increase in
liquefaction capacity, pipelines are likely to distribute
much of its gas exports, and there will be more focus on
supplying countries to the south and east of North East
Eurasia. The Indian Subcontinent will significantly
increase imports to satisfy a near doubling in its demand
for natural gas, requiring substantially greater LNG
regasification capacity in the region. Middle East and
North Africa will remain among the most important
suppliers of gas, replacing North East Eurasia as the
biggest natural gas exporter towards the end of our
forecast period.
South East Asia will see slight growth in natural gas
demand between 2023 and 2030, when it will peak
before slowly returning to 2028 levels by 2050. The
region will remain a net exporter, and its gross imports
will decline. Strong demand for natural gas in Middle East
and North Africa, North America, and North East Eurasia
will continue, collectively accounting for 56% of global
demand today and maintaining this share to 2050. Within
these big-user regions, gas demand from North America
will decline from representing a 25% global share in 2023
to 17% in 2050, as its power sector decarbonizes.
North East Eurasia will see much less decarbonization in
all of its demand sectors and its share in global demand
will edge up to about 16% by mid-century, 2% higher
than today. Significant demand growth will be seen in
the Middle East and North Africa. These two regions will
remain both the main producers and principal net export-
ers of natural gas. The consequences of Russia`s invasion of
Ukraine for North East Eurasia`s domestic gas demand and
exports are explained in more detail in Chapter 1.
Europe and OECD Pacific are decarbonizing faster than
other regions and, as their own natural gas resources
are limited, will both see declines in natural gas demand
between now and 2050. Latin America, however, will see
little change in its demand. Combined, these three
regions accounted for 23% of demand in 2020 and will
account for 14% by 2050. They will remain natural gas
importers throughout the forecast period. Sub-Saharan
Africa will see continued growth in gas use, albeit from a
low level, doubling its share in global gas demand to 2%
in 2050.
Declines in natural gas use occur for three primary
reasons. First, gas-fired power generation meets stiff
competition from carbon-free renewables. Second,
in sectors where it is feasible, direct gas use is hit by
electricity growth. In other sectors, low-carbon (blue)
hydrogen will be an option for replacing fossil fuels
for hard-to-abate applications in a world steadily more
eager to decarbonize, and with carbon prices imple-
mented worldwide. Third, biomethane – being organic
in origin and chemically identical to natural gas, but
accounted for as 'carbon-free' — will increasingly replace
fossil (i.e. natural) gas in all demand sectors.
116
DNV Energy Transition Outlook 2022
117
Energy supply and fossil fuels CHAPTER 4
Decarbonized gas
In 2050, 12% of gas will be carbon-free, using natural gas
but with CCS in industry, power generation and hydro-
gen production (7%); and growing production and use of
biomethane (5%) (Figure 4.11). Natural gas consumption
will decline 18% between 2020 and 2050. By mid-century,
biomethane production will see a more than 100-fold
increase from today`s levels, with more than 80% of the
production capacity in North America (30%), Europe
(20%), the Indian Subcontinent (17%) and Greater China
(15%). Global production capacity build-up accelerates
significantly in the 2030s and reaches 150 Gm3
in 2050.
In 2050, almost 50% of hydrogen will be produced from
fossil fuels, and 70% of that with associated carbon
capture technology. The majority of fossil-based hydrogen
is produced from natural gas. Carbon-free gas develop-
ments will be spearheaded in those regions with the most
ambitious transition policies, and consequently high
carbon prices – Europe, Greater China, North America,
and OECD Pacific.
Production and transport
In the coming decade, global natural gas production will
remain largely unchanged (4,520 Gm³ in 2020 and 4,660
Gm³ in 2030) before decreasing to 3,836 Gm³ in 2050
(Figure 4.12). Middle East and North Africa and North
East Eurasia will together account for more than half
of global output in 2050. North American natural gas
production will halve, reflecting a 50% reduction in
domestic demand. However, smaller levels of produc-
tion in the higher cost regions of Europe and OECD
Pacific will experience the most dramatic reduction,
falling by 76% and 57%, respectively, between 2020
and 2050.
Compared with our forecast for oil (Section 4.2), offshore
natural gas production will be more resilient than
offshore oil. This is partly due to a more pronounced
fall in oil demand, such that more-expensive offshore
capacity will lose its oil market share.
As demand for natural gas grows more strongly in
importing regions, LNG and pipeline transport will
increase even when global gas demand does not. Gas
transport is expensive and accounts for a significant
proportion of the cost of delivered energy. Piping is
cheaper than shipping for transport over shorter
distances and will expand as production sites and
consumption sites move further apart. Global capacity
for regasification grows 60% by 2050, while liquefaction
more than triples (Figure 4.13). The big producers are also
the big exporters, and North America — which is distant
from its natural gas customers — will see the largest
growth in liquefaction, accounting for 42% of global
capacity by 2050. Middle East and North Africa will
be second largest, representing about 15% of global
liquefaction capacity. By mid-century, almost half (43%)
of global regasification capacity will be in the Indian
Subcontinent and Greater China.
Is natural gas a bridge?
There is an ongoing debate as to whether natural gas is
a bridging or a destination fuel. In this context ‘bridge’
means a temporary or interim solution on the way to an
alternative energy source, while ‘destination’ means that
it is part of the longer-term final energy mix.
It is helpful to frame this discussion in the context of
emissions. For as long as net global emissions are above
zero, the global average temperature will continue to
increase; a situation which clearly cannot continue ad
infinitum. In theory, it is possible to continue with fossil
fuels while ensuring zero or negative emissions by deploy-
ing carbon capture and removal; but that cannot scale
infinitely. Moreover, we know that to reverse the growth in
emissions, we will need net negative emissions in the
future, allowing only the bare minimum of unabated
fossil-fuel combustion. Unabated natural gas is therefore
not a destination fuel and has a negligible place in a future
final energy mix.
Abated natural gas – natural gas with carbon capture and
storage (CCS) — has only marginal emissions and could in
theory continue for decades if not centuries, provided
there is sufficient space for CO2
sequestration. However,
sequestration space is limited and subject to strong
competition. From a climate-change mitigation perspec-
tive, there are stronger claimants for that space than
abated natural gas in the form of captured CO2
— for
example, from direct air capture, bioenergy with CCS, or
industry emissions from processes such as cement. Hence,
in the race for net negative emissions, abated natural gas
has only a very limited place in a future final energy mix.
With all of the above in mind, it is clear that natural gas is
not a destination fuel; but that does not in itself mean that
gas is a ‘bridge’.
New gas infrastructure built today creates the risk of
locking in investments that will make it hard to move on to
a zero-carbon solution in the future. The argument is then
that gas is a detour and that we should instead move
directly to zero-carbon alternatives.
Another way of looking at this could be that where gas is
used today, it should be seen as a bridge to a zero-carbon
solution in the future. However, sectors that are not using
natural gas today should avoid switching to gas, as they will
have to move on to another zero-carbon solution in a
decade or two. There are exceptions to this, e.g. in low-in-
come countries that need to use natural gas for cooking
and heating to avoid the burning of biomass that causes
excessive deaths from poor air quality, or in hard-to-abate
sectors like shipping where dual fuel engines can use
natural gas while waiting for the low-emission fuels to be
developed.
In summary, natural gas should not be seen as a destina-
tion fuel, and the notion of a bridging fuel should be used
with caution to avoid prolonging fossil-fuel use beyond
that which is absolutely necessary.
118
DNV Energy Transition Outlook 2022
119
Energy supply and fossil fuels CHAPTER 4
By any measure, the world, and Europe in particular, have
been experiencing extremely high gas prices which, at the
time of writing, are at all-time highs. LNG traded on the
spot market has followed suit, and gas prices across the
world are currently high, but not as high as in Europe.
As input to the ETO model generating results for the
forecast in this report, we have assumed a natural gas price
that remains high (late-Spring 2022 level) until the end of
2024, before gradually returning to normal levels in line
with the price before Summer 2021.
This price trajectory is highly uncertain; there is a distinct
possibility that gas prices will stay high much longer than
our base assumption. Therefore, we have performed two
model sensitivity runs for an even higher gas price (August
2022 level), maintaining this price for six and 12 years,
respectively. This means record high gas price levels in
Europe for six and 12 years, and almost record levels in
other regions for six and 12 years. These are extreme
variants, but nevertheless interesting to test in our model.
If gas prices stay high for six years, then the share of gas in
the global primary energy mix reduces from 23% now to
18% in 2030, and from 20% to 13% of Europe’s primary
energy mix.
If gas prices stay at record levels for 12 years, the 2040
energy mix is also dramatically changed; gas almost halves
from 15% to 8% in Europe and reduces from 22% to 16%
globally. The development of these shares by 2050 is
similar — in other words the gas share will be lower ‘forever’.
Among demand sectors, power generation will see the
most dramatic cut in gas consumption, which is under-
standable as this sector has most direct competition
among multiple energy sources and technology alterna-
tives. In manufacturing, the change is a little less, and less
again in the buildings sector, though even there, natural
gas use will reduce significantly when prices stay high.
Use of other energy carriers will naturally grow if gas prices
remain high, and in Europe, the biggest beneficiary will not
be coal, but wind. The picture is a little different globally,
with coal, oil, solar PV and wind all capturing roughly equal
parts of the share lost by natural gas.
The ETO model might not be able to capture all the
nuances of gas prices remaining high for many years, as
investor interests, public perception and additional
policies would disturb the more cost-based competition
we report on here. Still, the sensitivity results support the
intuitive view that a high gas price over many years will
damage the outlook for gas in the medium, long, and
very-long term.
We have assumed a natural gas price that
remains high (late-Spring 2022 level) until
the end of 2024, before gradually returning
to normal levels in line with the price before
Summer 2021.
What happens if gas prices stay high for long?
4.4 SUMMARIZING ENERGY SUPPLY
In this section, we summarize the primary supply of
energy from all energy sources, including fossil fuels.
Considerable losses occur in the global energy system.
Energy is mainly lost when it is converted from one form
to another — such as heat losses in a power plant convert-
ing coal to electricity. Losses also occur during transport
of energy, such as electrical power lost as friction in grids.
World primary energy consumption is therefore consid-
erably higher than final energy consumption, with
conversion losses alone exceeding 100 EJ per year.
Primary energy also includes the energy sector’s own use
of energy to extract the energy itself. For some energy
carriers this share is quite high, for example, around 12%
of the primary energy consumption for natural gas.
The historical and forecast world energy supply is shown
in Figure 4.14 and Table 4.1. A key result from our analysis,
as shown in the figure, is that global primary energy
supply will peak within the forecast period. This will occur
despite the expansion of the global population and
economy. The amount of energy services such as heating,
lighting, and transport will continue to increase with a
growing and more prosperous population. However,
energy-intensity improvement — a large share of it from
electrification, but also from many other areas — means
the energy services over time can be delivered with less
use of primary energy. This is explained in more detail
under Energy Intensity in Section 5.1.
Primary energy supply will peak in 2036 at 643 EJ per
year, a level 8% higher than today, then decline by around
3% by 2050. Primary energy had a marked decline during
the pandemic, and a return to pre-covid levels is only
likely to happen in 2023.
Although we will see peak primary energy supply in the
2030s, this will not necessarily last. One main reason why
energy consumption will decline to 2050, is the increased
energy efficiency associated with continuous energy-
efficiency improvements and a steady rise in the use of
renewable electricity. Once this transition is complete,
120
DNV Energy Transition Outlook 2022
121
Energy supply and fossil fuels CHAPTER 4
further efficiency improvements must come from other
sources. Sometime after 2050, primary energy supply
might well start to increase again.
The primary energy supply mix will change significantly
over the coming 30 years. As described in the introduc-
tion to this chapter, the fossil share will fall from 80%
today to just below 50% in mid-century.
The share taken by nuclear energy will be stable at 5%
over the entire period, while the renewable share will
triple from 15% today to 45% by the end of the forecast
period. Within renewables, the large increase will be
driven by solar and wind, which will see 18-fold and
12-fold increases in primary energy supply towards 2050,
respectively. Solar will reach 15% and wind 13% of the
global primary energy mix in 2050, with further growth
expected beyond mid-century. Bioenergy and hydro-
power will also grow, in both relative and absolute terms.
The primary energy supply mix will change
significantly over the coming 30 years. The
fossil share will fall from 80% today to just
below 50% in mid-century.
Alternative ways to count energy
There are several ways to calculate primary energy, each
producing a different energy mix because every method
assigns a different efficiency value to each energy source.
The differences are most pronounced when measuring
primary energy from non-combustibles, such as nuclear
and renewables. As the share of renewables rises, differ-
ences between the methodologies also increase.
For primary energy of non-combustible sources, one
view is that renewables are 100% efficient because the
input energy (e.g. solar irradiation) is neither captured
nor extracted, nor is it traded. Therefore, it is assumed
to be outside the boundary of the energy system. Other
analysts, however, assign a low conversion efficiency to
renewables because, for example, solar panels convert
only a small percentage of the solar energy that reaches
them.
These differences are apparent in the two most frequently
used methods of counting primary energy:
— The Physical Energy Content Method assumes that
the thermal energy generated from thermal fuels is
primary energy, while for non-thermal sources, such
as wind, solar PV, and hydropower, the electricity
generated is primary energy
— The Substitution Method computes the primary
energy content of non-combustible sources by
determining how much fossil fuel would be necessary
to generate the same amount of electricity. This
method then ‘substitutes’ the efficiency of an average,
hypothetical combustion power station for the
efficiency of non-combustible sources.
There are also variations of these two methods. The
Direct Equivalent Method – used, for example, by the
IPCC — resembles the Physical Energy Content Method,
whereas the Resource Content Method resembles the
Substitution Method.
In our Outlook, we use the Physical Energy Content
Method. This approach is in line with organizations such as
Eurostat, IEA, and OECD, and allows for easy comparison
with most other reference forecasts. Furthermore, the
conversion of individual energy sources is directly compa-
rable with the ‘tradeable energy’ metric, which is familiar to
energy producers, and has a clear economic value as the
energy that is produced is also sold. Put simply, whereas
a tonne of crude oil and a day’s electricity generation from
a solar PV panel are tradeable, a day of sunshine is not.
Detailed conversion factor methods of our counting
method, and more details of the alternative methods,
are provided in DNV (2018b).
The choice of energy-counting method significantly
affects energy forecasts. If the Substitution Method was
used instead, then peak energy supply would not be
reached during the forecast period. Had we used that
method, the argument that renewable energy and
electricity have much higher efficiencies than fossil-
energy sources would not hold; instead, we would have
focused on the much lower carbon intensity of those
energy sources.
There are several ways to calculate primary
energy, each producing a different energy
mix because every method assigns a different
efficiency value to each energy source.
TABLE 4.1
World primary energy supply by source
Units: EJ/yr
Source 2020 2030 2040 2050
Wind 6 20 44 79
Solar 5 21 57 95
Hydropower 15 21 27 29
Bioenergy 57 73 74 76
Geothermal 4 5 5 5
Nuclear 28 29 33 31
Natural gas 149 149 143 123
Oil 159 179 156 118
Coal 157 139 99 66
Total 579 635 638 623
2020
2050
Nuclear, 5%
Geothermal, 1%
Geothermal, 1%
Natural gas, 26%
Hydropower, 3%
Wind, 1%
Bioenergy, 10%
Solar, 1%
Oil, 27%
Coal, 27%
Nuclear, 5%
Natural gas, 20%
Hydropower, 5%
Wind, 13%
Solar, 15%
Bioenergy, 12%
Oil, 19%
Coal, 11%
Nuclear, 5%
Geothermal, 1%
Geothermal, 1%
Natural gas, 26%
Hydropower, 3%
Wind, 1%
Bioenergy, 10%
Solar, 1%
Oil, 27%
Coal, 27%
Nuclear, 5%
Natural gas, 20%
Hydropower, 5%
Wind, 13%
Solar, 15%
Bioenergy, 12%
Oil, 19%
Coal, 11%
122
DNV Energy Transition Outlook 2022
123
Energy supply and fossil fuels CHAPTER 4
COMPARISON OF ENERGY FLOWS: 2020 AND 2050
Direct
Coal
Oil
Natural
gas
Bioenergy
Geothermal
Nuclear
fuels
Solar
Wind
Hydropower
use
Grid-
connected
thermal
power
stations
Grid-
connected
non-thermal
power
stations
PRIMARY
ENERGY
DIRECT USE AND
TRANSFORMATIONS END USES
Road
Maritime
Aviation
Rail
Pipelines
Manufactured goods
Base materials
Iron and steel
Construction  mining
Cement
Petrochemicals
Feedstock
Space heating
Water heating
Cooking
Appliances  lighting
Space cooling
Transport
Manufacturing
Buildings
Other
FINAL ENERGY
Energy sector’s
own energy use
Hydropower Bioenergy
Hydrogen
Grid electricity
Direct heat
Methanol
Ammonia
Oil
Wind power Geothermal
Coal
Solar power Nuclear fuels
Natural gas
Direct
Coal
Oil
Natural
gas
Bioenergy
Geothermal
Nuclear
fuels
Solar
Solar
power
Wind
power
Hydropower
use
Biomethane production
Solar and wind
power stations
dedicated to
hydrogen production
Hydrogen production
Electricity storage
Grid-
connected
thermal
power
stations
Grid-
connected
non-thermal
power
stations
PRIMARY
ENERGY
DIRECT USE AND
TRANSFORMATIONS END USES
Road
Maritime
Aviation
Rail
Pipelines
Manufactured goods
Base materials
Iron and steel
Construction  mining
Cement
Petrochemicals
Feedstock
Space heating
Water heating
Cooking
Appliances  lighting
Space cooling
Transport
Manufacturing
Buildings
Other
FINAL ENERGY
Energy sector’s
own energy use
2020 2050
Direct
Coal
Oil
Natural
gas
Bioenergy
Geothermal
Nuclear
fuels
Solar
Wind
Hydropower
use
Grid-
connected
thermal
power
stations
Grid-
connected
non-thermal
power
stations
PRIMARY
ENERGY
DIRECT USE AND
TRANSFORMATIONS END USES
Road
Maritime
Aviation
Rail
Pipelines
Manufactured goods
Base materials
Iron and steel
Construction  mining
Cement
Petrochemicals
Feedstock
Space heating
Water heating
Cooking
Appliances  lighting
Space cooling
Transport
Manufacturing
Buildings
Other
FINAL ENERGY
Energy sector’s
own energy use
Hydropower Bioenergy
Hydrogen
Grid electricity
Direct heat
Methanol
Ammonia
Oil
Wind power Geothermal
Coal
Solar power Nuclear fuels
Natural gas
Direct
Coal
Oil
Natural
gas
Bioenergy
Geothermal
Nuclear
fuels
Solar
Wind
Hydropower
use
Grid-
connected
thermal
power
stations
Grid-
connected
non-thermal
power
stations
PRIMARY
ENERGY
DIRECT USE AND
TRANSFORMATIONS END USES
Road
Maritime
Aviation
Rail
Pipelines
Manufactured goods
Base materials
Iron and steel
Construction  mining
Cement
Petrochemicals
Feedstock
Space heating
Water heating
Cooking
Appliances  lighting
Space cooling
Transport
Manufacturing
Buildings
Other
FINAL ENERGY
Energy sector’s
own energy use
Hydropower Bioenergy
Hydrogen
Grid electricity
Direct heat
Methanol
Ammonia
Oil
Wind power Geothermal
Coal
Solar power Nuclear fuels
Natural gas
124
DNV Energy Transition Outlook 2022
125
Energy efficiency and finance CHAPTER 5
5
ENERGY EFFICIENCY
AND
FINANCE
Highlights
Accelerating efficiencies in the production and use of
energy are key to the transition and should be a top
priority for a faster energy transition. As this chapter
discusses, a more efficient energy system has important
financial implications. There are also important linkages
between energy efficiency and energy independence.
Energy intensity (i.e. unit of energy per dollar of GDP)
globally will be more than halved from 4.3 MJ/USD now
to 2.1 MJ/USD by 2050. There is scope to reduce energy
intensity even further, but that will require tighter
regulation and deeper industry cooperation.
Affordability: Expressed as a percentage of global GDP,
global energy expenditures (strictly defined) will fall
from 3.5% to 2% by 2050, implying a substantial green
prize inherent to the transition, and opening up possi­
bilities for faster decarbonization. This year, we analyse
energy expenditures at household level and find that
these will generally decline in OECD countries, but in
developing regions, e.g. the Indian Subcontinent, the
growth of new forms of demand (e.g. appliances and
space cooling) will see an increase in household energy
spend.
5.1 Energy intensity126
5.2 Sectoral energy efficiency129
5.3 Energy expenditures131
126
DNV Energy Transition Outlook 2022
127
Energy efficiency and finance CHAPTER 5
5.1 ENERGY INTENSITY
Energy efficiency can be measured in several ways. In the engineering
sense, the ratio of energy input to useful energy output is the key metric.
Economists are more likely to use the term ‘energy intensity’, which
compares energy use to the economic production output of an industry.
Primary energy intensity
Primary energy intensity is measured as primary energy
consumption per unit of GDP; the lower the number, the
less energy intensive the economy in question is. Primary
energy intensity, population growth, and GDP per capita
growth together shape how global energy use develops.
When the sum of these three parameters falls below zero,
primary energy use will start to decline, and the world will
start to use less energy, as illustrated in Figure 5.1.
This figure plots energy intensity, population growth, and
GDP per capita growth as annual average values within
five-year intervals between now and 2050. After 2035, the
reduction in energy intensity is stronger than the
combined growth of population and GDP per capita.
Hence, growth in global primary energy supply turns
negative and primary energy supply peaks in the
mid-2030s. In the final half-decade before mid-century
there is a small uptick in global energy use growth. This
is because, by then, nearly all electrical power will be
generated by renewables and much of the end use that
can be electrified will have been converted to electricity,
leaving fewer opportunities for efficiency gains. From
that point, however, it is likely that slower population
growth and efficiency gains through automation and AI
will, to some degree at least, offset rising energy use
associated with continued GDP growth.
Globally, energy intensity has been reducing by 1.7% per
year on average for the last two decades, with spikes and
troughs along the way. The COVID-19 pandemic intro-
duced a new short-term spike, with varying fluctuations
in both energy consumption and GDP.
Over our forecast period 2020 to 2050 — in which we
foresee a doubling (120%) of global GDP and an 8%
increase in primary energy consumption — energy intensity
will be more than halved from 4.3 MJ/USD to 2.1 MJ/USD.
Irrespective of the short-term impacts of the pandemic
and of the war in Ukraine, energy intensity will continue to
decline faster than in previous decades, dropping by 2.3%
per year on average over the next 30 years, as illustrated in
Figure 5.2. In the 2040s, the energy-intensity improvement
tapers off somewhat because, as noted above, there will
be fewer opportunities for further efficiency gains in
power generation and energy end use.
Economies dominated by the service sector (tertiary
sector) often manage to grow without directly increasing
regional energy use. (e.g. financial services or consulting).
However, if regional changes in energy intensity are
measured as the sum of changes in national energy
intensities, the result fails to capture inter-regional trade.
Manufacturing has to a large extent been outsourced
from Europe and North America to Asia over the last
decades. Therefore, we do not focus on regional ener-
gy-intensity forecasts in this section but review intensity
on a global basis, which indicates the overall gains in
efficiency.
Energy independence and energy efficiency
The record-high fossil fuel prices and electricity prices as
of 2022 in certain regions have positioned energy-effi-
ciency measures as being among the most important
tools to increase energy security as part of a path towards
energy independence — a high priority now for many
countries and regions. High prices for consumers and
industry automatically drive incentives for reducing
energy use and implementing efficiency measures.
In addition to price-driven energy-efficiency measures,
regions will most likely implement strategic efficiency
measures to further reduce wasteful energy practices.
These latter measures can free up energy resources that
could fuel more essential end uses, such as heating
homes, cooking, and manufacturing value add. This can
be attractive for geopolitical reasons, such as Europe
trying to limit dependency on Russian gas, or Japan
tackling high energy bills associated with its dependence
on imported gas.
128
DNV Energy Transition Outlook 2022
129
Energy efficiency and finance CHAPTER 5
Electrification and energy losses
Energy losses can be measured for each stage of the
energy system; in other words, during production,
energy transport, and end use. Converting the losses to
efficiencies are described below as sectoral efficiencies.
Energy losses, resulting from conversion processes (e.g.
burning coal to produce electricity) or energy transport
(e.g. heat losses from power lines) make energy output
smaller than the input. However, it is more relevant to look
at ‘useful energy’. Some of the heat generated by a power
plant, for example, can be used for district heating, while
venting it is considered wasted energy. The aim is to
avoid or minimize energy transformations that are either
unusable or not needed; for example, heat from an
industrial process that is vented directly to the atmos-
phere. The Sankey diagram at the end of Chapter 4 (page
122) illustrates energy losses to heat in the generation of
electricity. These will be substantially less in 2050 than
today because more electricity will come from renewable
energy generation with negligible heat losses.
The acceleration of electrification, especially from
renewables, is the main driver of energy-intensity
improvements in the future. More rapid electrification
leads to accelerated efficiencies throughout an energy
system. As the renewable share of electricity rises,
energy intensity benefits from smaller heat losses during
power generation. The typical thermal efficiency for
utility-scale electrical generators is some 30% to 40% for
coal and oil-fired plants, and up to 60% for combined-
cycle gas-fired plants. In comparison, solar PV and wind
generation are 100% efficient according to the widely
accepted Physical Energy Content Method of counting
energy. A discussion on calculating primary energy can
be found in Chapter 4.
Efficiency improvements in the energy system will slow
down in the 2040s when most of the electricity system
already is renewable, and losses are small.
Without any energy-efficiency improvements,
global energy demand would increase 73%
by 2050, in sharp contrast to the almost flat
development that we forecast.
UN Sustainable Goal #7 to double the rate of
improvement in energy intensity will not be met.
Sustainable Development Goal #7
focuses on Affordable energy and
clean energy for all. A sub-target is
to double the rate of improvement
in energy efficiency, which accord-
ing to our forecast will not be met.
Our forecast shows an improvement to 2.3%/yr from
2015 to 2030 which is much higher than the 1.6%
historical rate between 2000 to 2015, but not double
as targeted under SDG #7.
0,0%
-0,5%
-1,0%
-1,5%
-2,0%
-2,5%
-3,0%
-3,5%
2000-2015
annual energy
intensity
improvement
-1.6%/yr
-2.3%/yr
-3.2%/yr
2015 - 2030
annual energy
intensity
improvement (f)
SDG energy
intensity
target
5.2 SECTORAL ENERGY EFFICIENCY
The demand for energy services — for example, for
transporting passengers and goods, heating and cooling
buildings, or producing consumer goods — grows as a
function of population and economic activity. Technolog-
ical, process and efficiency improvements will typically
counter some of the growth in demand, sometimes even
leading to decline in energy demand despite growth in
energy services delivered.
Such improvements are the result of activity changes,
technology efficiency gains, and structural shifts.
— Activity changes: More people, more buildings to heat
and cool, and longer distances travelled all increase
the total amount of activities. Other activity changes,
like the impact of COVID-19 on business travel, reduce
activity levels and/or contribute to slower rates of
activity increase.
— Technology efficiency improvements: In the various
energy-demand sectors, several such improvements
continuously drive down energy use per service
delivered. Examples include more-effective engines or
improvedhullhydrodynamicsandvehicleaerodynamics.
— Structural shifts take three principal forms:
— Technology shifts: Occasionally, services are better
delivered by replacing one technology with
another. Examples are replacing a combustion
engine with an electric motor, or cooking with gas
or electricity instead of burning solid biomass.
These changes are often termed ‘efficiency
improvements’, which is correct in the sense that
they improve the efficiency of the process. However,
the underlying service itself does not change; the
improvement is due to the use of a new technology.
Structural shifts normally reduce energy use.
— Service shifts: Sometimes, there are structural
changes in the service delivered, such as bigger
cars. These shifts can be connected with rebound
effects — for example, setting a higher temperature
threshold in your house because heating is cheaper
or more effective. These shifts may counter technol-
ogy-led improvements and lead to higher energy
use; in other cases, they might reduce energy use.
— Regional shifts: When looking at global numbers,
we sometimes have structural changes from
regional shifts; for example, in the offshoring or
nearshoring of manufactured goods production.
Such structural changes might lead to both higher
and lower energy use.
In our overview (page 130, Figure 5.3), structural shifts
are grouped, as it is often impossible to separate one
effect from another.
Standards and policies
Efficiency improvements reduce energy use and/or costs.
The ‘cheaper and/or better’ mantra has always been the
main driver for technology innovation. But sometimes
policy interventions, in the form of efficiency and perfor-
mance standards (e.g. technical retrofits, building codes,
fuel-efficiency standards) play an important role, as
discussed in Chapter 6. We note that in countries with
mandatory efficiency policies, growth in energy use or
emissions is subdued. Policy frameworks help to direct
investment towards energy-efficiency initiatives that
otherwise tend to be overlooked by investors. There are
severalreasonswhysuchinitiativesareneglected,including
thedifficultyofcalculatingdirectreturnsandthepossibility
that benefits accrue to parties other than the investor.
The present technology and policy momentum is further
accelerated by the high energy costs and geopolitical
considerations of energy dependency — which further
leads to growth in efficiency improvements across all
sectors. We find that without any energy-efficiency
improvements, global energy demand would increase
73% by 2050, in sharp contrast to the almost flat develop-
ment that we forecast. This is illustrated for the main
demand sectors in Figure 5.3.
The potential to improve efficiency yet further is huge
and will be sought after for geopolitical reasons as well
as the need to achieve a faster energy transition that is
closer to the Paris Agreement ambitions. Chapter 8 —
Pathway to net zero emissions, describes our scenario
for howtolimitglobalwarmingto1.5°C.
130
DNV Energy Transition Outlook 2022
131
Energy efficiency and finance CHAPTER 5
Transport is dominated by road transport, with vehicle
kilometres almost doubling over the next 30 years (shown
as activity change), though aviation also grows 130% from
pre-pandemic levels and maritime transport 45%. In 2050,
EVs account for 90% of all passenger km and 74% of the cargo
km, and this structural change dramatically reduces energy
use. Efficiency improvements in remaining combustion
engines, aerodynamics in aviation, and vessel utilization also
contribute to the overall 6% energy reduction from pre-
pandemic levels and 8% increase from 2020.
Over the forecast period, the activity change for manufac-
turing includes a 70% increase in base materials, construc-
tion, and mining; a 68% rise manufactured goods
(measured in USD output); and a 11% reduction for steel and
iron (in tonnes of steel produced). Structural changes (e.g.
in regional shifts) give a reduction in energy use, while
efficiencies in all the manufacturing processes also
contribute to a total energy use growth of 20% for the
manufacturing sector over the coming three decades.
EJ/yr
106
+120.8
−56.5
114.8
−55.6
2020 2050
Activity
Chg.
Structr
Chg.
Eff.
Gain.
250
200
150
100
50
0
Transport
EJ/yr
2020 2050
Activity
Chg.
Structr
Chg.
Eff.
Gain.
250
200
150
100
50
0
120
+88.3
−30.2
−29.6
148.3
Buildings
EJ/yr
2020 2050
Activity
Chg.
Structr
Chg.
Eff.
Gain.
250
200
150
100
50
0
134.8
+55.5 −4.2 −24.6
161.4
Manufacturing
Activity-wise,totalbuildingsfloorareagrows64%inthe
forecastperiod,buttheincreaseinenergyservicesinbuildings
variesconsiderablyfromcooling,whichgrowsalmostsix-fold,
toheating,whichgrowsby10%.Moremodernheating
technologies(e.g.heatpumps)andupgradestowaterheating
andcooking(e.g.switchingfromtraditionalbiomasstogasor
electricity)invariousregionscontributetothestructural
improvements.Efficiencygainsarelargestincoolingand
lighting.However,overallbuildingssectorenergyusestill
grows24%overtheforecastperiod.
FIGURE 5.3
Sectoral energy efficiencies in transport, buildings and manufacturing
Demand side flexibility
For policymakers, we call special attention to the scale of
efficiency, and hence financial, gains that can be achieved
through demand-side flexibility across regional power
systems. Demand-side flexibility involves the percentage
of system demand that can be increased, reduced, or
moved over a specific, planned, time period and includes,
for example, electric heating and transport. In a recent,
commissioned report, DNV demonstrates how the
judicious use of demand-side flexibility tools can lead to
annual savings of hundreds of billions of dollars across
Europe if these mechanisms are fully deployed in the
coming decades (Smart Energy Europe and DNV, 2022).
The energy transition we forecast is not only affordable
but leads to considerable savings at a global level. Some
aspects of the transition, like the roll-out of renewables or
grid build-outs, will require very large upfront invest-
ment. This is why some consider the transition to be
‘unaffordable’. Our results suggest the opposite, with
energy costs remaining stable and energy expenditures
representing a declining share of global GDP.
This is a startling conclusion from the perspective of
policymakers — i.e. that far from coming at a green
premium, the energy transition in fact involves a substan-
tial green prize, paying dividends to society for genera-
tions to come — and is something that DNV has
emphasised consistently over the years in our annual
Energy Transition Outlooks.
This year, we call attention to the fact that our findings are
borne out by a study conducted by researchers at the
Oxford Martin School at Oxford University, and
published in the journal Joule under the title' Empirically
grounded technology forecasts and the energy transition'
(Way et al., 2022). The authors find that:
Compared to continuing with a fossil fuel-based system,
a rapid green energy transition will likely result in overall
net savings of many trillions of dollars — even without
accounting for climate damages or co-benefits of
climate policy.
Far from coming at a green premium,
the energy transition in fact involves a
substantial green prize.
Expenditure definition
Contrary to other modelling frameworks, such as the
IEA’s TIMES and the EU’s PRIMES, our approach does not
ensure the global optimality of solutions. However, in
many sectors — such as power production, upstream oil
and gas, and energy use in manufacturing — we use a
merit-order, cost-based algorithm. This has been estab-
lished on the basis of production costs in energy sectors
(power, oil, and gas), to drive the selection of energy
sources / production technologies / regions over each
other through time.
There are various definitions of ‘energy expenditure’,
and we have chosen to use a strict definition. We have
therefore included only fossil-fuel extraction, transport,
and refinement such as liquefaction, regasification,
refineries, and conversion to hydrogen and electricity.
Similarly, all costs in the power sector are incorporated
(includingpowergrids,storagecapacityandtheinstallation
and operation of renewable energy plants). However, we
have excluded investments in energy-efficiency measures,
as well as in downstream carbon-mitigation costs.
Nor do we incorporate costs related to end-use spending
(in manufacturing, transport and so on).
What actually constitutes a subsidy deserves a chapter in
its own right, and we have decided to adopt a simplified
approach. The modelled subsidies that we report in this
Outlook are seen as support that benefits consumers and
are not counted as energy expenditures. Likewise, fuel
taxes are not included.
Although the simulated decision making in our model
discounts expected future cash flows, in this chapter we
reportannualsectoraloutlaysintermsofCAPEXandOPEX.
5.3 ENERGY EXPENDITURES
132
DNV Energy Transition Outlook 2022
133
Energy efficiency and finance CHAPTER 5
World energy expenditure
We consider energy expenditures as the upstream costs
related to energy production and transport to the user
(see definition on previous page). Using this definition,
total world energy expenditure was USD 4.9trn in 2021
(our reference year for this section). We project world
energy expenditure to increase 26% to USD 6.2trn by
2050, due mainly to the rise in final energy demand. Note,
as we discuss at the end of this chapter, how this 26%
expenditure rise compares with the projected global
GDP increase of 120% over our forecast period.
The unit cost of energy will stay stable around 11-12 USD/
GJ over the forecast period, even if the world energy
expenditure by source shown in Figure 5.4 will be totally
reshuffled. In 2021, fossil fuels made up 71% of the total
world expenditure but we forecast that this share will
almost halve to 36% by 2050. In contrast, both grids and
non-fossil energy will almost triple their shares, which
means all three (including fossil) will have roughly equal
shares. Not only do the relative shares change, the
absolute USD values of expenditures under these three
categories also change. Between 2021 and 2050, fossil
expenditure will reduce 40% in USD terms, non-fossil will
triple, and grids will also almost triple.
Capital and operating expenditures
Figure 5.5 presents the breakdown of CAPEX and OPEX
for the categories: fossil, non-fossil, and grids. The
expenditures are presented as an average expenditure
over 10 years leading up to 2020, 2030, and so on.
As seen in Figure 5.4, there is a successive reduction in
fossil CAPEX, as the world shifts increasingly to non-fossil
energy. While CAPEX declines continuously, fossil OPEX
continues to increase in the 2020s and 2030s because of
continuing use of upstream infrastructure built leading up
to the 2020s. The increase in OPEX between 2020 and
2030 is due to the Ukraine war. Less expensive fossil fuel
from Russia and Ukraine sees a supply choke. This leads to
marginally more expensive fossil fuels being exploited to
cover the short supply, which also leads to higher OPEX.
We project a structural shift away from fossil CAPEX and
OPEX from the 2030s. The succeeding decades will see
less and less such CAPEX and OPEX. In contrast, non-
fossil and (connected with it) grids will see successive
increases in OPEX and CAPEX. Renewables are CAPEX-
heavy, and we project CAPEX almost twice as high as
OPEX, despite the uninterrupted decade-to-decade
increases in OPEX, as seen from Figure 5.5.
Non-fossil expenditures
In terms of the breakdown of non-fossil expenditure, we
foresee large growth in solar+storage and fixed offshore
wind, from relatively small levels in 2020. But, established
renewable technologies such as solar PV and onshore
wind continue to dominate in terms of absolute numbers
in our forecast (Figure 5.6).
We expect floating offshore wind to experience tremen-
dous growth in expenditures, but from a very small level
in 2020. On the other hand, solar PV and onshore wind
see a three-fold increase in expenditures from 2020
levels by 2050. Given that these technologies are
already established today, it is unsurprising that their
expenditure growth rates are not as high as for floating-
offshore wind.
Regional transitions in energy expenditures
The transition away from fossil fuels, and the related
general trend towards relocation of energy production
to a more regional level, will induce important transfers
in expenditures. Investments in fossil production will
increase in regions such as Middle East and North
Africa, at least in the short term.
Figure 5.7 shows the change in energy expenditures in
North America, Middle East and North Africa, and
Europe. These three Outlook regions are selected to
contrast how the transition is expected to unfold in
terms of expenditures in two fossil-fuel producing
regions (North America, Middle East and North Africa)
and one (Europe) with relatively less fossil-fuel produc-
tion and already ahead of the curve in the transition to
non-fossil energy.
Both North America and Middle East and North Africa
have lower CAPEX for fossil fuel in 2050 compared with
in 2021. That said, North America’s CAPEX starts
reducing after 2030, while Middle East and North
Africa’s transition away from fossil-fuel investments
happens a decade later. Even more significantly, OPEX
in Middle East and North Africa keeps increasing, thus
implying that the region will go on producing fossil fuels
and operating existing fossil-fuel infrastructure at
increasingly high levels from now until 2050 at least. In
contrast, North America’s OPEX starts declining after
2030, signalling the start of its gradual transition away
from operating fossil-fuel infrastructure.
134
DNV Energy Transition Outlook 2022
135
Energy efficiency and finance CHAPTER 5
Interestingly, in the short term, all regions have increasing
CAPEX for non-fossil energy. But in the 2040s, this CAPEX
stabilizes in Europe, indicating that almost all the non-fossil
investments for the region will have been made by
mid-century.
All regions presented see an increase in grid expendi-
ture. Given the electrification we forecast and increasing
peak power demand (see Chapter 2 on electricity and
grids), electricity networks needs investment in expan-
sion, security, congestion management and balancing.
A declining share of GDP
Despite massive investments in high capital-cost renewa-
bles and electricity networks, the share of global GDP
allocated to energy expenditures will fall steadily. Figure
5.8 shows this share declining from 3.4% in 2021 to 2.1%
by mid-century. This is a significant finding from our
forecast: by mid-century, energy will be both relatively
cheaper (as a percentage of GDP) and more affordable at
a societal level, given that the energy system itself will be
substantially more efficient.
The affordability and acceptability of the transition will
not be driven solely by energy cost, as discussed in the
'Affordable for whom?' sidebar. However, the declining
share of GDP, and stable energy costs, show that from this
standpoint a faster transition is possible, as discussed in
more detail in Chapter 8.
As explained in this chapter, the energy transition is
affordable from a global perspective. However, this
conclusion is usually not shared by consumers. Several
social movements such as the gilets jaunes ('Yellow
vests’) in France have shown that the acceptability of
the transition is not automatic. The first reason is that
expenditures are not market prices paid by the
consumer, which include margins, taxes and/or subsi-
dies. The gap is especially visible in the current context
of high energy prices, with energy producers making
exceptional profits while their production costs are not
increasing.
The second reason is that the transition also implies
important investments, both from industries (new
production plants) and individuals (buildings insulation,
electric cars, heat pumps). Although these investments
might be profitable over the long term, upfront costs
and lack of visibility on the future regulations and
economic situation can favour the status quo.
Figure 5.9 forecasts trends in household energy
expenditures in North America, Europe and the Indian
Subcontinent. This household energy expenditure
includes CAPEX for residential space heating and
cooling (such as cost of air-conditioners), water heating
(such as cost of heat pumps) and cooking (such as cost
of electric stoves) and OPEX, which is the energy costs
and energy taxes, of running all the household equip-
ment and passenger vehicles.
In the short term, households in Europe will see their
energy expenditure rising sharply until the energy
supply shocks are alleviated around 2025. By the late
2020s, household energy expenditures in Europe will be
around the same levels as in 2021, in nominal terms. The
subsequent decades will see stabilization of household
energy expenditure at levels 10% less on average than in
2021, and gradually declining to 30% less by mid-century.
North America follows a similar trajectory, without the
sustained price shock in the period 2022–2025. In both
Europe and North America, the benefits of investing in
cheap renewable electrification are felt by households
through generally cheaper energy.
Similarly, the Indian Subcontinent will see its household
energy expenditure going up in the short term owing to
price shocks, but gradually stabilizing at almost the
same level as 2021 around 2030. However, increasing
electrification, especially residential air-conditioners,
and higher household energy consumption, sees its
household energy expenditure gradually increasing to
30% above the 2021 level by mid-century. Note that
over this period, average GDP per capita increases by a
factor of more than three across the Indian Subcontinent.
Energy costs are also embedded in products and
services, but our results show that the energy transition
will at least have a positive impact on the visible part of
these costs, which is the direct energy expenditure paid
by households: direct household energy expenditure.
Affordable for whom?
FIGURE 5.9
136
DNV Energy Transition Outlook 2022
137
Energy efficiency and finance CHAPTER 5
In our Financing the Energy Transition report (DNV, 2021b),
we discussed in detail how governments, banks and
investors price risk for multi-decade energy projects
amid a changing energy order and an ever-more impor-
tant climate agenda.
To produce a forecast to 2050, DNV makes assumptions
about today’s cost of capital (CoC) per technology, and
about the speed and direction of capital reallocation up
to 2050. Are companies that reduce their emissions in line
with net zero rewarded by the capital markets with a
lower cost of capital? Are investors and governments in
oil-rich regions like the Middle East seeing increased risks
for financing new oil and gas projects in 2050? These
questions need defendable answers to set CoC across
the globe.
Cost of capital is one of the key cost drivers for capital-
intensive purposes – for example, new power generation
projects, investment in power grids and gas infrastruc-
ture, equipment in buildings, and infrastructure for
zero-emission vehicles. We use levelized cost to compare
competing technologies, where the ratio of lifetime costs
to lifetime generation (e.g. electricity or hydrogen
production) is discounted back to a common year using a
discount rate that reflects the cost of capital. With lower
discount rates, the break-even price that satisfies equity
and debt returns reduces. Hence, predicting the compet-
itiveness of, for example, competing power generation
technologies now and in the future requires accurate
CoC predictions. We therefore continue to focus on the
granularity of the CoC inputs.
Cost of capital inputs to the ETO
The CoC is largely decided by three variables:
1) The cost of debt; i.e. the combination of the risk-free
rate and the risk premium (or ‘margin’), together often
referred to as borrowing costs
2) The cost of equity; i.e. the equity return required by
investors
3) The ratio between 1) and 2) above; i.e. the ‘leverage’
The main driver for these variables is risk perception.
To give two examples: financing a greenfield coal-fired
power generation project today is less risky than financ-
ing such project in 2040. In contrast, financing green
hydrogen production will be perceived as riskier today
than in 2040, at which time the technology is likely to
have matured and been proven in both production and
end-use sectors. In addition, a mature market by then for
green hydrogen will result in lower risk, lower borrowing
costs, lower equity-return requirements from investors,
and higher leverage, all driving down the cost of capital.
These examples illustrate both the difficulty and dynamic
nature of setting assumptions on the cost of capital.
ETO cost of capital categories
We categorize our inputs under the following technology
headings and assumptions:
— Solar PV, hydropower, onshore wind and fixed-bottom
offshore wind. Cost of capital in the OECD regions and
Greater China for mature renewables will be stable
over the modelling period. For emerging markets, the
CoC for these technologies is expected to reduce due
to the economic development of these regions rather
than perceptions of technology risk.
— Blue and green hydrogen, floating offshore-wind,
small-scale nuclear. Cost of capital for these emerging
energy-transition technologies is higher today
because of their greater technology and market risks.
The CoC reduces only slightly before 2030, then falls
towards parity with mature renewables in 2050.
— Oil and gas upstream, midstream, and downstream,
including grey hydrogen and gas-fired power
generation. We expect only a slow upward trend in
CoC in most regions because of a perception of
increased risk associated with the lifetime of projects.
The CoC for new oil and gas projects in Middle East
and North Africa, and North East Eurasia — two regions
with large, low-cost oil and gas resources — will remain
stable through to 2050, with capital available from
government enterprises.
— Coal-fired power generation. Investors already
perceive coal as significantly higher risk than other
fossil fuels or renewable-energy projects, as
evidenced by a clear increase in loan spreads over the
past decade. We expect a rapid upward trend in CoC
due to reduced availability of capital, a trend that has
started in most regions and will reach the Indian
Subcontinent, South East Asia, and Sub-Saharan Africa
from 2030. Reduced capital availability is exemplified
by Chinese, South Korean, and Japanese commit-
ments to not build and finance new coal-fired power
projects abroad.
— Large-scale nuclear. We expect CoC to be low, stable,
and to reduce slightly over time, supported by expec-
tation that the market will move increasingly towards
becoming a low-risk one in which returns are regulated,
like currently observed in the UK, where policy moved
away from CfD towards a Regulated Asset Base.
Our forecast is mostly dependent on CoC levels varying
betweenthedifferenttechnologycategories.Thecurrently
observed increase in risk-free interest rates in regions such
as North America and Europe affect all technologies
equally, meaning the impact on our forecast is low.
Cost of capital is derived for all 10 of our Outlook regions
— today and through to 2050. Figure 5.10 shows the inputs
for Europe and the Indian Subcontinent. Other regions’
inputs are differentiated based on country risk premiums,
funding methods, and technology preferences.
How will cost of capital evolve?
FIGURE 5.10
138
DNV Energy Transition Outlook 2022
139
Policy and the energy transition CHAPTER 6
6
POLICY AND
THE ENERGY
TRANSITION
Highlights
6.1 The policy landscape
shaping the transition140
6.2 Drivers and barriers142
6.3 Key regional policy
developments146
6.4 The policy toolbox148
6.5 Policy factors in our Outlook154
In this chapter we explore the role of policy in the energy
transition and describe 12 policy considerations
directly factored into our Outlook.
The energy transition sits in a context of multiple geo­­
political uncertainties instigating a leap forward in
policies for achieving energy security and diversification,
in addition to preventing climate change and protecting
planetary boundary conditions.
We discuss a series of drivers of, and barriers to, the
energy transition. These create uncertainty over the
speed of transition; however, our interpretation is
that drivers continue to outweigh barriers, and that
stakeholders will not lose sight of long-term risks and
transition opportunities. We then feature key policy
developments from our forecast regions since last
year’s Outlook.
We outline our view on a policymaker’s ‘toolbox’
to advance the transition. Some nations are applying,
or are expected to apply, this toolbox fairly
comprehensively; others less so. This is followed by
a discussion of expected carbon price developments
across Outlook regions.
We conclude by describing the steps in our policy
analysis and approach to derive the policy factors
included and applied regionally across our forecast
period.
140
DNV Energy Transition Outlook 2022
141
Policy and the energy transition CHAPTER 6
6.1 THE POLICY LANDSCAPE SHAPING THE TRANSITION
This chapter explores the role of policy in the energy transition. We include
geopolitical developments, along with both policy drivers and barriers
that impact the nature and pace of the transition. We outline a policy
‘toolbox’ covering a range of policy choices that governments could make
to drive the energy transition.
This year’s Outlook is published at a time of multiple
uncertainties likely to impact energy developments,
including inflation, food insecurity and disrupted supply
chains. These were in train by the pandemic and have
been intensified by Russia’s invasion of Ukraine. The war
has sparked a rush for energy independence, both
geographically and in terms of energy sources used.
Against these short-term pressures, must be weighed the
continuing commitment to, and goal setting under, the
Paris Agreement . It is through this prism that the world
aspires for a mission-oriented energy transition to solve
planetary, economic, and human-development
challenges.
Our Outlook is set in a context where today's central
difficulty for policymakers is to manage short-term
energy supplies without making decisions or investing
in energy infrastructure that could undermine long-term
societal goals.
Energy systems in need of government intervention
Policymakers face a long list of urgent challenges —
providing energy access, reducing carbon emission
and air pollution, adapting to global warming impacts,
preserving the environment, securing energy supply,
tackling inflation and addressing the swelling food and
energy prices. The urgency of these issues means
governmentinterventionsinenergysystemsareobliga-
tory. Most of these challenges have market failure as a
contributory element; for example, the widespread
failure to price in externalities associated with fuel use.
Others are explained by geopolitical factors. However,
they all warrant policy action.
John Stuart Mill, the philosopher and political economist,
argued that “the only purpose for which power can be
rightfully exercised over any member of a civilized
community, against his will, is to prevent harm to others”.
Economist Robert H. Frank recapped the statement (NYT,
2021) explaining the need for government involvement in
the economy due to the failure of individual and collective
interests to coincide in addressing the greatest threats
facing society.
There are strong arguments for an active role for both
state and markets in energy systems. Whereas markets
may be good at optimizing scarce resources and doing
so at least cost, they need regulatory frameworks in which
to function and government policy that catalyses growth
areas, de-risks activities by creating a level playing field,
and provides direction towards desired societal goals
(e.g. Paris Agreement, UN 2030 Sustainable Development
Goals, Biodiversity Convention).
Mixed policy signals
Signals on the energy transition are presently mixed. On
the one hand, there is progress towards decarbonization,
albeit beneath the fog of unsustainably high emissions.
Policymakers are responding to the attractiveness of
renewables in terms of employment, longer-term
efficiencies, and energy security. Renewable build-out
is being advanced by governments in all regions. Front-
runner transition regions, such as Europe, are building a
nexus of climate and trade policies to sustain low-carbon
investment and employment with carbon-border
adjustment mechanisms (CBAM).
At the same time, regulation of fossil fuels has loosened
recently to increase oil and gas output and expand
infrastructure, despite the obvious climate-related risks
and the danger of perpetuating carbon lock-in with
renewed fossil-fuel dependencies. Hydrocarbon prod-
ucers are responding by fast-tracking new production
although demand for these resources will start to decline
within the next decade owing to sustainability pressures
and the technological transition. Overall, the risk that
these assets will become stranded, placing a drag on
economies in the medium-to-long term, has risen sharply.
Stakeholders align on advancing the transition
While policy analysis is challenging during a period of
upheaval, the advancement of renewable energy has been
resilient, showing record-breaking expansion. The huge,
untapped potential for renewables in emerging markets is
also receiving heightened attention. In today’s risk picture,
companies and government alike are increasingly hedging
decisions against high prices to protect inhabitants and
industry. Compelling project economics and compara-
tively brief development lead-times to bring renewable
plants on stream are helping to tilt policy support in favour
of renewables in the short term, with long-term energy
security as an additional motivation.
Given the cost of inaction in terms of economic and
human losses from chronic and acute climate impacts
along with degradation of nature (see for example Swiss
Re, 2021; Allianz, 2022; EU, 2022; NOAA, 2022), DNV
expects that investors, insurers, regulators, and policy-
makers alike, will not lose sight of long-term risks and will
support business models centred on transition opportu-
nities. We do not anticipate a reversal of climate commit-
ments due to the war in Ukraine; the short-term scramble
for hydrocarbons is overshadowed by a renewed focus
on energy security, and this strongly favours renewables.
The transition will also be invigorated by efforts to stop
downward-spiralling crises. Interconnected challenges
(e.g. biodiversity, climate, energy access) are expected
to be increasingly tackled together to leverage co-
benefits from the same investment. Thus, we expect a
deepening of regulatory efforts to propel energy-system
evolution with decarbonization and accountability/
responsibility along energy value chains.
Figure 6.1 presents a snapshot of the policy factors in the
analysis. These factors are described in more detail in
Section 6.5.
FIGURE 6.1
Policy factors included in our Outlook
1. Renewable
power support
7. Bans, phase-out
plans and mandates
2. Energy-storage 		
support
8. Carbon pricing
schemes
3. Zero-emission
transport
9. Taxation of fuel,
energy, carbon and
grid connections
4. Hydrogen
support
10. Air pollution
intervention
11. Plastic pollution
intervention
12. Methane
intervention
5. Carbon capture
and storage support
6. Standards for
energy efficiency
142
DNV Energy Transition Outlook 2022
143
Policy and the energy transition CHAPTER 6
6.2 DRIVERS AND BARRIERS
The aim of this section is to capture trends in terms of
those drivers triggering change and the opposing forces
in the form of barriers that seek to uphold status-quo
behaviour or otherwise hinder the transition. Technology
and energy transformations do not progress in a
perfectly linear fashion and the transition will not occur
without friction, or, as the Austrian economist Joseph
Schumpeter (1942) termed it, “creative destruction” when
technology or system innovation diverges from and
destabilizes the established way of doing things.
Nations are not in control of these trends but their
policymakers must manage the inherent tensions in order
to arrive at progressive policy choices. In isolation, the
drivers and barriers are challenging to connect to our
forecastbutacomprehensivearrayofpolicyconsiderations,
which cuts across these issues, is included in our analysis
(see Section 6.5). The sum of our insights on these trends,
is that drivers continue to outweigh barriers, however not
equally in all regions, and certainly not to the extent
required by the Paris Agreement.
DRIVERS DRIVERS
BARRIERS BARRIERS
Failure to progress collectively on global agreements
Despite unequivocal science and its compelling evidence
(e.g. glacial retreat, sea-level rise, extreme weather events,
species loss), political and business decision making is
generally not science-based, and actions are often ‘too little,
too late’, failing to drive the transition at the required rate.
Deglobalization and economic disintegration are inhibiting
collective action and blocking international flows of capital.
Disunited policy hinders progress on environmental
protection, weakens efforts towards energy transition, and
widens the gap between leading countries and followers.
Systemic change and response
There is a great deal of scientific evidence (IPCC 2021, IPBES
2019, Rockström and Gaffney, 2021) that overlapping and
mutually reinforcing crises are associated with the degradation
of ecosystems and climate change. Any effective response
must be at the level of systems, guiding energy, land, and
ocean management. Actions taken in line with the UN
Biodiversity Framework — the ‘Paris Agreement for Nature’
— will have a broad effect, including decarbonization of the
energy system, and will add to the considerable momentum
towards this goal generated at COP26 and the Glasgow
Climate Pact, which kept the 1.5°C target alive.
1.
Energy security returns to the fore
Russia’s invasion of Ukraine and use of energy as an economic
weapon, has spurred efforts to replace unreliable energy
commodity imports. There is a congruence of Covid-19
recovery, climate response, and energy-security strategies.
The best and most effective results are achieved through
diversification, domestic renewable-energy production and
low-carbon hydrogen for a clean and energy-secure future
with predictable consumer prices. The World Energy Pulse
(World Energy Council, 2022) expects the pace of energy
transitions to increase.
A pivot towards more fossil fuels?
Destabilized energy markets and soaring energy prices
make it difficult for governments to handle the energy
trilemma (security / equity / sustainability) while securing
short-term energy needs. Supply constraints, high fossil-fuel
prices, and windfall profits for producers are boosting
exploitation of hydrocarbons. Across the world, new fossil
infrastructures are planned to enable exit from dependence
on Russian energy. Unless these are designed to be transi-
tion ready (Bordoff et al., 2022), they will undermine the Paris
Agreement goals.
2.
Surge in net zero pledges
A net zero stocktake report (Net Zero Tracker, 2022) indicates
countries with net zero targets encompass 83% of global
emissions and 91% of GDP. The share of targets included in
domestic legislation/policy documents has risen substantially
(around 65% of total GHG coverage, compared with 10% in
2020). A UN high-level expert group on net zero commitments
(UN, 2022a) is developing clearer standards for non-state
entity pledges to speed up emission cuts. Climate clubs of
first-mover net zero countries will trigger transition efforts
world-wide given exposure to carbon-border tariffs.
Net zero disunity and hypocrisy
Net zero plans in low- to middle-income countries extend
beyond mid-century, but climate science indicates that
emission cuts must happen in a 2030/2050 timeframe.
Arguing for these timelines to accelerate is hypocritical
when high-income, net zero regions grapple for fuels, shield
consumers from energy price shocks, and/or ease policy
measures normally advocated as incentives to reduce
emissions. Non-fulfillment of the annual USD 100bn pledge
from developed to developing countries not only jeopard-
izes climate justice, but also delays economically viable
decarbonization projects.
3.
Renewables power on despite economic upheaval
Wind and solar PV are the least-cost electricity options, and
fossil energy price shocks make the economic case for
non-fossils more compelling. Hedging against price volatility
favours domestic renewable energy, despite increased
upfront costs. Decarbonization costs are increasingly part of
energy-investment decisions when calibrating alternatives,
and offtakers such as corporate tech giants are increasing
their spending on renewables (Nasdaq, 2022). Despite
supply-chain disruptions and inflation affecting all industries,
renewable-energy capacity continues to expand globally.
Annual renewable capacity additions broke new records in
2021, increasing by 6% to almost 295 GW (IEA, 2022b).
Reinvented globalization adds costs
Pandemic-related lockdowns, manufacturing delays, and
economic volatility have fuelled efforts to reshore industries
to ensure supply-chain reliability. Industrial policy and
transition investment also aim to build things ‘at home’ and
boost employment. Geopolitical risks have given rise to the
concept of ‘friend-shoring’ (WTO, 2022), i.e. trading with
political allies, with corresponding reinvention of supply
chains, and materials and components sourced from
partners rather than global markets. Reinvented globaliza-
tion prioritizes security over efficiency and lowest cost, likely
making the transition more costly.
4.
Insight
The momentum behind the Paris Agreement, with constantly improving measurements and ratcheting up of targets, will force
leading global businesses and most governments to become part of the solution, despite reluctance to embrace the logic that
economies cannot prosper in collapsing ecosystems.
Insight
Policymakers need far greater global co-ordination on net zero pledges, and these need to be made in the context of how
much decarbonization is viable and where. Consensus on these issues is likely to emerge, but will be messy, late and,
consequently, require enormous investment in carbon capture/removal and storage.
Insight
The pursuit of energy security, particularly in Europe, will accelerate the transition to renewable energy and hydrogen in the
medium term, trumping the short-term doubling-up of hydrocarbon production. However, only if Europe, and other sanc-
tion-imposing countries, persuade other countries to diversify their energy sources, will this affect the global demand for fossil
fuels and accelerate the green transition globally.
Insight
Deglobalization has gained momentum in the wake of supply-chain shocks and Russia’s invasion of Ukraine. However, the
world remains largely globalized and, although rising prices will add to the transition costs, renewables will continue to win out
as the least-cost, most energy-secure option.
144
DNV Energy Transition Outlook 2022
145
Policy and the energy transition CHAPTER 6
DRIVERS DRIVERS
BARRIERS BARRIERS
Inadequate investments and de-risking
There is a massive investment gap where financial flows are a
factor of three to six times lower than the levels needed by
2030 to limit warming to below 2°C (IPCC, 2022). Global
clean energy investments of approximately USD 4–5trn are
required annually by 2030 — more than three times the
current rate (IEA, 2021d) — and investments in early-stage
technologies are lacking (WEF, 2021). Policy incentives to
de-risk investments are unpredictable and short-dated.
Public intervention is patchy and does not send the right
investment signals. Carbon pricing is low/non-existent in
manyregions,fossil-fuelsubsidiesareprevalent,and Covid-19
recovery packages do not focus on decarbonization.
Targeted net zero innovation efforts
Cross-sectoral decarbonization pathways are dependent on a
plethora of known technologies from well-established to less
mature. Innovation efforts/investments prioritize structural
change and advancing the ‘readiness’ and uptake of technolo-
gies necessary for a net zero future. The Technology Executive
Committee (UNFCCC, 2021b) is highlighting best practices
from global RD collaborations. Policymakers are pushing
private-sector engagement, such as in the government-led
Glasgow Breakthroughs, the global Mission Innovation
initiative, and the public-private partnership First Movers
Coalition.
5.
Corporate sustainability in energy and value chains
Sustainability strategies accelerate the transition through
individual energy-company transformations (e.g. Schneider
Electric and Ørsted topping the Corporate Knights' index on
the most sustainable corporations) and companies’ carbon
ambitions in operations. Corporate renewable-power
purchase agreements (31.1 GW in 2021, 25.1 GW in 2020,
20.1 GW in 2019 per BNEF, 2022), along with accountability
for supply chain, scope 3 emissions (increasing from 93
companies in 2010 to 3,317 in 2021 in the public CDP dataset
per WRI, 2022a), are increasingly part of strategies to achieve
net zero commitments and secure financing.
The gulf between talk and action
There is a shortage of quantitative net-zero plans with
interim targets and immediate emissions reduction. Net
zero has become a shiny smokescreen for delaying action
(SP Global, 2021d). Carbon markets, used voluntarily by
companies to offset emissions, are ridden with dubious
credits that have little demonstrable effect in terms of
tangible and additional emissions reduction. Net-zero
claims and actions by fossil-fuel firms do not match the
reality of carbon-intensive business models and operations;
and their capital allocation is misaligned with climate
ambitions with hydrocarbon investment still consuming
80-90% of capital spending (ClientEarth, 2021).
6. Promising cross-sectoral synergies
The role of different energy carriers in energy system decar-
bonization pathways have become clearer in recent years.
Energy systems can transform with more physical links, and
with a key role for the electricity system in sector coupling
through power-to-x projects. Renewable electricity expansion
is a prerequisite for e.g. green ammonia and green hydrogen,
as is CCS deployment for low carbon (blue), both routes being
pillars in the transition. Hydrogen-based energy conversion
projects are pushing forward to underpin emission cuts in
hard-to-abate sectors (DNV, 2022a).
Unfit regulatory frameworks
Regulatory frameworks to scale technologies in production,
storage and end-uses are not yet in place. Sector coupling will
need interconnection between gas and electricity systems /
assets / operators. Common definitions and standards need
development, and regulation need harmonization, viewing
electricity and gas sectors cohesively (CERRE, 2021). Energy
taxes discourage fuel switching (to electricity, hydrogen) in
demand sectors and need reform. Electricity market design is
an insufficient driver of new renewable-capacity investment
(Wind Europe, 2022). CCS technology-readiness level is high,
but de-risking measures are inadequate or lacking, such as
carbon pricing.
8.
Insight
Convergence in disclosure requirements and metrics is tipping in favour of deeper ESG embedding in capital allocation,
pricing and value assessments underpinning decision-making processes. Thus, sustainability objectives are being put in
focus to accelerate the transition. GFANZ is an encouraging development, but its members’ commitments are voluntary
and uncertain in the absence of tougher disclosure obligations and binding legislation from policymakers.
Insight
In the frontrunner transition regions, ‘fit-for-purpose’ regulatory frameworks will be developed and feasible within a 2030
timeframe, but the transformation will require immense implementation abilities. Hence, this will pose a challenge to regions
with weaker governance structures and where incumbent actors in centralized energy subsectors exercise significant influence
on decision-making.
7. Investors propel the transition
A staggering amount (USD 130trn) from the COP26 Glasgow
Financial Alliance for Net Zero (GFANZ) coupled with an
investment boom in ESG issues (environmental, social and
governance), reported at USD 35trn in 2021 (GreenBiz, 2022),
is pushing the transition. Global scrutiny from regulators, (e.g.
the EUs Corporate Sustainability Reporting Directive) make
ESG reporting mandatory, and brings transparency to
sustainable investments. Standard setters (e.g. TCFD and
IFRS/ISSB) are consolidating requirements. With increasing
reporting obligations on ESG, companies and investors will
face growing liability from climate/nature-related disclosures
and breach of fiduciary duty (Allianz, 2022).
Greenwashing
Greenwashing — a marketing ploy conveying exaggerated
claims on the sustainability of products/companies — is
side-tracking investments towards net zero. The European
Securities and Markets Authority (ESMA, 2022) flagged
complexity, lack of transparency, and poor comparability
among ESG ratings/data providers. Until taxonomies and
disclosures are finalized (e.g. EUs Sustainable Finance
Disclosure Regulation (SFDR) and US Securities and
Exchange Commission’s (SEC) proposed carbon disclosure
rule), there will be uncertainty. Companies/investors are
unlikely to invest in the transition without clarity on eligibility
for “low-carbon” investments and material information on
climate and transition risks.
Insight
The shortfall in global investments and innovation are a clear hindrance to both the direction and pace of the transition, and
one of the principal reasons why DNV forecasts an energy transition that, while rapid, will manifestly fail to deliver on the Paris
Agreement targets.
Insight
Corporate renewable-power purchases are expected to continue growing. Reporting on Scope 3 emissions, on the other
hand, is a relatively new and growing trend, lending momentum to the transition. However, the extent of momentum depends
on better goal setting and measurement upstream and downstream (e.g. accreditation on science-based criteria, common/
standardizedcarbon-accountingmethodology,measuringcompliance/progress,andopeningupdatatothird-partyverification).
146
DNV Energy Transition Outlook 2022
147
Policy and the energy transition CHAPTER 6
6.3 KEY REGIONAL POLICY DEVELOPMENTS
Below are snapshots of recent key policy developments
in our forecast regions since last year's Outlook, capturing
the role of governments in steering and advancing the
transition. The map alongside shows each region’s share
of global energy-related CO2
emissions in 2019.
We highlight 2019 emissions because they reflect
pre-pandemic economies and emission levels in
the regions.
17%
10% 7% 30%
5%
5%
8%
8%
3%
6%
Greater China (CHN) 		
North America (NAM)
Europe (EUR)
Indian Subcontinent (IND)
30%
17%
10%
8%
Middle East and North Africa (MEA)
North East Eurasia (NEE)
OECD Pacific (OPA)
8%
7%
6%
South East Asia (SEA)
Latin America (LAM)
Sub-Saharan Africa (SSA)
5%
5%
3%
Each region’s share of global energy-related
CO2
emissions in 2019
17%
10% 7% 30%
5%
5%
8%
8%
3%
6%
Prime Minister Modi announced
India’s net zero emissions target
for 2070 at COP26.
Thegovernmentisnowconsidering
legislation for a uniform carbon-
trading scheme (April 2022).
Pakistan updated its NDC before
COP26 aiming to reduce emissions
by 50% by 2030 (15% uncondi-
tional, 35% conditional). All coal
projects are being stopped and
60% of power is to come from solar
by 2030. In addition, at least 30% of
all new vehicles sold in various
categories are to be electric.
Sri Lanka advanced its carbon-
neutrality target to 2050
(originally set for 2060). The 2021
NDC of Bangladesh outlines 40%
of power to come from
renewables by 2041.
Indian subcontinent
Brazil published rules to establish
the regulatory framework for its
offshore wind market (January
2022). The president issued a
decree announcing the creation of
a national carbon market to
reduce GHG emissions, but it
lacks detail (May 2022).
Chile’s Just Transition Strategy in
the energy sector was published
in December 2021. Its Climate
Change Framework Law,
enshrining a binding goal of net
zero emissions by 2050, was
published in June 2022 .
Mexico’s parliament voted down
the president-backed electricity
reform legislation for state control
of the power market (April 2022).
Venezuela’s government hosted
an energy talk with a US
delegation to discuss energy
security (March 2022).
Latin America
Ukraine was granted EU
candidate status in a positive
opinion issued by the European
Commission (June 2022). The
National Council for Recovery
from the War is developing a
Post-war Recovery and
Development Plan that aligns
with transformation to a green
economy and low-emission
development principles (July
2022).
Kazakhstan vowed to reach
carbon neutrality by 2060 and
aims to create the Central Asian
Climate Hub to address climate
change (November 2022).
Russia approved its strategy,
with a net zero ambition by 2060,
but does not specify its
achievements nor cuts to 2030
(October 2021).
North East Eurasia
In March 2022, the National Development and
Reform Commission and the National Energy
Administration released key documents to
guide decarbonization as follows:
An Action Plan for carbon dioxide peaking
before 2030, including strict control of new
coal-power projects, standards for newly
built units to reach the international
advanced level, and elimination of outdated
capacity in an orderly manner.
14th Five-Year Plan for Modern Energy
System, outlining plans for the proportion of
non-fossil energy consumption to reach 20%,
non-fossil power generation at 39%, and
electricity to account for 30% of final energy
consumption — all by 2025.
A Medium and Long-term Plan for the
Development of Hydrogen Energy Industry
2021-2035, aiming for 5% of final energy
consumption to be hydrogen energy by
2030.
Greater China
Japan and South Korea signed
the Global Methane Pledge of
30% methane cuts by 2030
(COP26). South Korea upped its
GHG emission-reduction target
to 40% below 2018 levels by 2030
(previous NDC at 24.4%), also
aiming for renewable generation
around 30%. Japan pledged up
to USD 10bn over five years to
assist Asia towards zero-carbon
emissions. South Korea’s new
president vowed to resume
nuclear power construction
(March 2022).
Australia’s new government
increased its GHG emissions
target to 43% below 2005 levels
by 2030, aiming for net zero by
2050 (June 2022).
New Zealand passed a law
introducing mandatory
climate-related reporting for the
financial sector (October 2021).
OECD Pacific
The United Arab Emirates announced its Net
Zero Strategic Initiative by 2050 and Saudi
Arabia a net zero target by 2060 (October 2021).
Saudi Arabia announced a USD 10.4bn fund to
provide clean cooking fuels and investments in
carbon-capture technology (October 2021).
Egypt was selected to host COP27. The
government’s 2050 National Strategy for
Climate Change estimates costs at USD 211bn
for mitigation and 113bn for adaptation (May
2022). Its target for 42% renewable power by
2035 was brought forward to 2030 (November
2021).
Turkey, the last G20 country to ratify the Paris
Agreement, announced a net zero goal by 2053
(October 2021).
Middle East and North Africa
Vietnam and Malaysia aim for net zero
emissions by 2050. Indonesia pledged to
achieve net zero emissions by 2060, and
Thailand by 2065 (COP26).
Malaysia will no longer build new coal plants.
Indonesia stated that between 2026-2030
there will be no additional coal-fired
capacity, except for those that have reached
financial close or are already under
construction (COP26). Japan announced a
stop to loans for construction of coal-fired
electricity plants in Indonesia (June 2022).
Vietnam’s amended law on electricity
outlines investment of USD 148bn in the
power system to 2030, allowing foreign
investments in grids (January 2022).
Indonesia’s CCS/utilization regulation is
expected by the end of 2022 (April 2022).
South East Asia
Nigeria passed its Climate Change Bill with a
net zero target by 2060 (November 2021).
Angola’s state-owned Sonangol signed a
declaration of intent to supply Germany with
green ammonia, starting in 2024 (June 2022).
South Africa’s cap on private power
providers was lifted to boost renewables
rollout and enable municipalities and large
industrial consumers to purchase electricity
directly from IPPs (July 2022).
The Just Energy Transition Partnership aims
to support South Africa’s transition away
from coal with the governments of UK,
France, Germany, US, and the EU promising
USD 8.5bn over 5 years through grants and
loans (COP26).
Sub-Saharan Africa
High EU ETS prices followed a strengthening
of emission-reduction targets, with EU
allowances ending the year (2021) at just over
EUR 80/tonne.
The REPowerEU Plan (March 2022) aims to
eliminate dependence on Russian fossil
imports, replacing two-thirds before the end
of the year. To fast forward the clean energy
transition, the Plan outlined additional
actions, building on the Fit-for-55 package of
proposals. These actions include, among
others, proposing to raise the 2030 target of
renewable share of energy use from the
current 40% to 45%.
The EU Parliament voted in favour of the
Commission’s proposal on certain transitional
nuclear and gas activities in the EU taxonomy
on sustainable investments (July 2022).
Europe
US President Joe Biden signed the Inflation
Reduction Act into law (August 2022) with an
unprecedented climate and clean energy
investment of USD 369bn over a 10-year period.
The US Supreme Court limited the scope of the
Environmental Protection Agency’s (EPA)
authority to regulate emissions and dictate
power plant shifts from one energy source to
another unless Congress has clearly authorized
the agency to act (June 2022).
The US administration announced that it will
invoke the Defense Production Act to expand
domestic clean-energy manufacturing (June
2022).
Canada published its 2030 Emissions
Reduction Plan (March 2022) for cuts of 40%
below 2005 levels, including CAD 9.1bn in new
investments. The government specified
Climate Action Incentive payments to deliver
carbon-pricing proceeds quarterly to
individuals/ jurisdictions where proceeds
originated (March 2022).
North America
148
DNV Energy Transition Outlook 2022
149
Policy and the energy transition CHAPTER 6
6.4 THE POLICY TOOLBOX Here, we outline and exemplify the policy categories
shaping the likely energy future to 2050. These fall into
five main categories recapped below. Of these, four are
(i) national strategies, (ii) technology-push, (iii) demand-
pull, and (iv) fiscal policies. A fifth, public and private
partnerships, obtains its main impetus from cooperation.
By combining such policy tools across sectors and supply
chains — effectively a ‘mission’ effort — governments can
shape energy sectors in favour of decarbonization.
National strategies are the foundation for fostering
energy-system transformation by setting roadmaps with
technology priorities, targets, and timelines as the first
step towards creating a stable planning horizon and
certainty for stakeholders. Examples include China, Chile
and the EU. From China we see steadfast planning behind
the Working Guidance on how to reach both 2030 and
2060 goals (NDRC, 2021). The Action Plan for carbon
dioxide peaking before 2030 (State Council, 2021)
launches China “1+N” policy framework with overarching
guiding principles for its emissions strategy (1) and
supplementary policy documents (N) for specific sectors
and goals (China Briefing, 2021). Chile has a comprehen-
sive National Green Hydrogen Strategy (Ministerio de
Energía, 2021) , which is part of a larger effort to combine
climate leadership and energy transition into legislation
(ICCT, 2022). All national strategies must incorporate
infrastructure developments, permit requirements and
designation of land or sea areas as being suitable for
renewables and related technologies/infrastructures; this
is seen with EU’s regional focus on ‘go-to-areas’ for faster
permitting processes capped at one year (EC, 2022).
Technology-push policies advance technologies along
the entrepreneurial and technology development cycle
from RD and piloting to scale-up. They influence
construction and operation of energy assets. Examples
include technology requirements on fuel economy,
emission limits, carbon intensity, and energy efficiency,
the latter being key to alleviation of energy poverty as
the cheapest energy is the energy not used. Others are:
taxonomy development, with a classification system for
eligible sustainability investments; RD and government
funding with investment support (grants, loans, tax
credits) to capital expenditures (CAPEX) that counterbal-
ance upfront costs (e.g. heat pumps during building
renovation or new-build projects, carbon capture and
storage (CCS), renewable hydrogen production and its
derivatives).
The US Inflation Reduction Act aims to promote domestic
clean-energy technology manufacturing and has govern-
ment spending at USD 369 over a 10-year period, such as
on rebates (USD 9bn) to homeowner’s energy-efficiency
investments; a CCS tax credit (USD 85/tCO2
increased
from previous USD 50); a tax credit rate of USD 3/kgH2
for
hydrogen produced with a carbon intensity below 0.45
kgCO2
e/kgH2
, and USD 30bn to renewable power plants,
batteries and advanced nuclear reactors. At the state
level, California’s latest budget proposal allocates USD
37bn in climate spending over six years (LA Times, 2022)
including a clean-energy loan programme to encourage
innovation (State of California, 2022). Production support
mechanisms to cut operational expenditures (OPEX) over
fixed timeframes can also help incentivise investment in
technology. There is rising focus on contracts for differ-
ence, a market-based mechanism offering OPEX support
through a guaranteed strike price to producers over
a fixed period. An example is Netherland’s SDE++
programme supporting the Rotterdam CCS project
Porthos (https://www.porthosco2.nl/en/) by contracting
the difference between the current emission trading
systems (ETS) price and the CO2
price needed to make
the project economically viable.
Demand-pull policies have an essential role in spurring
demand for renewable energy and low-carbon technolo-
gies. Governments act as market makers by promoting
deployment and/or switching from using unabated
fossil-fuel technologies. Through accelerated uptake,
existing solutions and viable technologies achieve a
decline in unit costs; this has a self-reinforcing effect
ensuring more build-out which, in turn, trigger further
cost reductions. Examples include: clean-energy consid-
erations in public procurement, biofuel-blending
mandates, renewable-electricity capacity quotas coupled
with competitive bidding or other quota-based or
quantity-based policies (e.g. binding targets with a fixed
amount/share of energy/fuels from renewables or
hydrogen) to create demand among end-use sectors.
Other demand-pull policies involve economic instruments
such as feed-in tariffs for renewable electricity producers,
TECHNOLOGY-PUSH
Technical requirements — e.g.
fuel, emissions, efficiencies
Taxonomy — eligible
sustainability investments
Funding — RD and
investment support
FISCAL POLICIES
National budgeting – aligned
with the SDGs or climate goals
Economic signals — e.g. carbon
pricing and tax reform in the
energy sector
PUBLIC/PRIVATE
PARTNERSHIPS
Including international
and national bodies and the
private sector — leveraging the
additional financial resources
and operating efficiencies
inherent to private businesses
DEMAND-PULL
Mandates — fuel blending
Capacity quotas — renewables
Economic instruments
— e.g. feed-in tariffs, contracts
for difference, subsidies)
Mandatory disclosure – e.g.
of low, zero-carbon use
NATIONAL
FRAMING
STRATEGIES
FIGURE6.2
Policy toolbox
Countries and regions will undergo unique energy
transitions given their different starting points regarding
available resources, variation in existing energy-sector
infrastructures, and the range of socio-political
circumstances. However, all policymakers have both a
shared technology-opportunity space and a policy
toolbox of known and proven measures that is available
for forming their energy-system (re)development
and transitions.
Decisive policy action with directed support measures
for energy savings, uptake of new energy carriers and
substituting high-carbon technologies and practices with
low-carbon alternatives can all catalyse structural shifts.
At the level of sectors or supply chains, comprising several
technologies at varying levels of commercial readiness, a
blend of policies — policy packages — can be used concur-
rently to create predictable framework conditions that
de-risk investments and provide a basis for business.
150
DNV Energy Transition Outlook 2022
151
Policy and the energy transition CHAPTER 6
tax reduction or subsidies for EV purchases and for
heating and cooling systems. In addition, mandatory
disclosures on climate and transition risks or proof of
environmental attributes through guarantees of origin
and transparent information, (e.g. the CertifHyTM
certification scheme on hydrogen), aim to trigger the
demand-side.
Decisive policy action with directed support
measures for energy savings, uptake of new
energy carriers and substituting high-carbon
technologies and practices with low-carbon
alternatives can catalyse structural shifts.
Fiscal policies can tilt the competitiveness of clean-energy
alternatives against their conventional, high-carbon
counterparts, thus influencing fuel-switching, replace-
ments, and new builds, alike. ‘Walking the talk’ by
executing climate/environmental pledges, include
revision of government funding to align public-sector
operations with sustainable development goals (SDG)
and climate objectives, both domestically and overseas.
Japan recently announced the withdrawal of international
finance to coal projects in Indonesia and Bangladesh
(Mongabay, 2022). Economy-wide economic signals,
such as pricing carbon and other negative externalities
and fossil-fuel subsidy phase-out are key to redirect funds
to transition ambitions, the latter also included in the
Glasgow Climate Pact. Review and reform of tax systems
and budgetary expenditures also form part of a holistic
policy package to transform energy systems. Energy
taxation reflecting carbon efficiency/pollutants, as
exemplified by the revision of the EU Energy Taxation
Directive, aims for alignment of taxation with environ-
mental performance and climate objectives. Tax reforms
are likely to unfold at an uneven pace with high-income
regions (with net-zero targets by 2050) being first movers.
Public/private partnerships unite policymakers and
commercial players to cooperate and coordinate
transition and decarbonization efforts. In the area of
progressing hydrogen, recent examples include: the
Partnership Agreement between the International
Renewable Energy Agency (IRENA) and the Hydrogen
Council; the IRENA and World Economic Forum (WEF)
Hydrogen Toolbox; and the World Business Council for
Sustainable Development (WBCSD) SMI hydrogen-
industry pledges initiative (H2Zero), also with proposed
policies (WBCSD, 2022). These collaborative initiatives
are instrumental in facilitating harmonization and
exchange of best practices. Most recently at the G7
meeting, a Hydrogen Action Pact (G7-HAP) was
announced to accelerate hydrogen development (G7
Germany, 2022) — not to duplicate other partnership
initiatives, but to stress their importance.
The policy categories are described separately here for
clarity. In reality and given the urgency of the transition, a
mix of these categories is commonly deployed, tailored
to suit the maturity of technologies. For further examples
and detail on what we term the “policy toolbox” of proven
policy measures, please also refer to the detailed account
provided in last year’s Outlook as well as DNV’s Hydrogen
forecast (DNV, 2022a).
How will carbon prices
develop?
Carbon pricing is crucial to accelerate mitigation and
de-risk low-carbon investment. The logic is simple: carbon
pricing assigns to polluters some or all of the costs that
they impose on society and hence forces climate and
emissions considerations into corporate balance sheets,
along with decision making on energy equipment and
systems. A country’s carbon pricing may be considered
an acid test of the sincerity of its climate pledge.
An effective carbon price — or clarity on when such a price
will be implemented — incentivizes use of clean energy and
deters use of unabated fossil fuels. By ‘effective’, we mean
not only properly pricing the damage caused by emis-
sions, but also pricing at a level that makes low-carbon
technologies/value chains economically viable.
To date, the introduction of pricing schemes has been
stubbornly slow and politically challenging to implement.
According to the World Bank’s status report (World Bank,
2022b), as of April 2022 there are 68 carbon-pricing
instruments worldwide, including taxes and cap-and-
trade systems/emissions trading systems (ETS). They
cover 23% of total GHG emissions (12 GtCO2
e), and four
new schemes have been implemented since the World
Bank’s 2021 status report. A conclusion, also this year,
is that carbon prices are rising but are generally too low.
The potential for carbon pricing remains largely
untapped. The High-Level Commission on Carbon Prices
(Carbon Pricing Leadership Coalition, 2017) indicated
that the carbon price needs to be in the USD 50–100/
tCO2
e range by 2030 in order to achieve the Paris target
of keeping global heating well below 2ºC. In our forecast,
the only region expected to be within that pricing range
is Europe.
Our forecast includes our best estimate of future carbon-
price levels, reflected as a cost for fossil fuels (see Section
6.5). We have considered exposure to carbon-border
tariffs/CBAM in the regions’ carbon-price trajectories.
Overall, adoption of carbon pricing schemes is expected
to expand and become more robust both in prices and
coverage given the increase in net zero commitments,
and with clear frontrunner regions.
152
DNV Energy Transition Outlook 2022
153
Policy and the energy transition CHAPTER 6
However, globally, pricing will be far below the necessary
levels suggested above. Europe, North America, OECD
Pacific, and Greater China are projected to reach carbon-
price levels in the range of USD 22–95/tCO2
by 2030 and
USD 70–135/tCO2
by 2050. Carbon pricing by mid-century
is projected to range between USD 20/tCO2
(North East
Eurasia) and USD 135/tCO2
(Europe).
The average regional carbon-price trajectories to 2050,
as shown in Figure 6.3, consider hybrid pricing (ETS and
carbon taxation). The trajectories are neither current nor
optimal policies, but are likely price levels given recent
policy developments. They reflect how we expect
national/regional trends to develop, considering annual
status reports from The World Bank and the International
Carbon Action Partnership (ICAP), as well as estimates
from carbon-pricing market forecasters.
Synopsis of trends and carbon-price drivers in
Outlook regions:
— Europe (EUR): Lead pioneer in carbon pricing with
both regional (EU ETS) and supplementary national
taxes. Established schemes are being tightened (e.g.
EU ETS cap continuous decline and inclusion of more
sectors, such as maritime (2026); separate ETS for road
transport/buildings (2026); and free allocation phase-
out (2027) for aviation). There is no indication that the
EU will relax its focus on decarbonization and the
Green Deal as these are closely linked to energy
security objectives, and the EU ETS is a main tool to
finance the transition costs and achieve net zero
ambitions. UK’s ETS scheme mirrors the scope of the
EU ETS and future linking may be expected. There is a
clear upward-pricing trend underpinned by efforts to
manage distributional impacts. The EU CBAM from
2026 aims to safeguard European competitiveness by
levelling the playing field between EU and non-EU
producers.
— Greater China (CHN) and the OECD Pacific (OPA):
Both regions trail Europe with a continuous rise and
with expected similar price trajectories, but starting
from lower levels. In CHN, China's national ETS is
expected to expand gradually in coverage to include
an additional seven high-emission industries during
the 14th five-year plan (2021-25). These come in
addition to the power sector, which emits over 4 Gt
CO2
each year (~40% of China’s CO2
emissions from
fuel combustion) and includes captive power genera-
tors of industrial plants (IEA-Tsinghua, 2021). In OPA,
carbon pricing is well established (Japan, South Korea,
New Zealand) and tightening/undergoing reform.
Pricing policy is likely to evolve in Australia to achieve
the more ambitious 2030 commitment (43% emission
reductions below 2005 levels, increasing from 26-28%
target under the previous government). Trade under
Article 6, clarified at COP26 on ‘international offsets’,
will likely lower OPA’s domestic carbon-price level
(Japan, South Korea). Net-zero ambitions in 2050 in all
OPA countries, and 2060 carbon neutrality in China,
will see carbon pricing as an important part of policy
mixes. Strong ambitions for clean-energy industry
development constitute a further carbon-price driver.
There are prospects for potential linkage between
CHN and OPA ETS schemes (Heggelund et al., 2021)
but this is currently undecided and unlikely before
mid-2030s.
— North America (NAM): Carbon prices are set to rise,
tracking other high-income regions, but at a lower
level. Carbon pricing is not central in the federal
climate change agenda of the US. However, state
schemes, such as cap-and-trade systems in California
and Oregon, and the Regional Greenhouse Gas
Initiative are being reformed/tightened (e.g. in
California to align with its 2045 carbon neutrality goal).
Washington state passed policy (2021) for a compre-
hensive cap-and-trade system, effective from 2023.
Canada has federal carbon-pricing policy to ensure
economy-wide ETS or tax schemes, requiring an
annual increase of CAD 15 (USD 12)/tCO2
e until
reaching CAD 170 (USD 136)/tCO2
e in 2030. Border
carbon adjustments (BCA) are considered in both the
US and Canada.
— Latin America (LAM) and South East Asia (SEA): Both
regions currently have low/limited carbon pricing and
are expected to have similar carbon-price trajectories
towards 2050. There are carbon taxes in LAM e.g.
Argentina, Chile, Columbia, Mexico, and Uruguay, with
the latter as an outlier (in terms of price level) with a
2022 tax rate at USD 137/tCO2
e. Chile’s government
recommends an increase to USD 35/tCO2
e by 2030.
Brazil is considering ETS implementation. In SEA,
several countries (Indonesia, Malaysia,Thailand,
Vietnam) are taking steps towards introducing or
expanding carbon-pricing schemes by the middle
of the decade and Singapore has a proposal for a
progressive increase of its carbon tax, reaching USD
37-59/tCO2
e by 2030. In both regions, key drivers of
carbon-pricing policy include: revenue to fund transi-
tion/emissions reduction; exposure to carbon-border
tariffs/CBAM affecting market access and export
activities, e.g. SEA as a major manufacturing hub;
and scope 3/supply-chain attention from investors
and multinational corporations reinventing their
supply chains for net zero.
— Indian Subcontinent (IND): Currently there is no
explicit carbon-pricing schemes in this region. India,
the region’s dominant economy, has announced its
intention for a national carbon-trading scheme
(Economic Times, 2022), and the state of Gujarat
intends to establish a cap-and-trade market. Pakistan
has carbon-pricing under consideration. The prime
drivers of carbon-price developments in the region
are: India’s net zero announcement (by 2070); domestic
revenue potential to support transition projects;
access to global transition/climate finance and inter-
national trade in climate mitigation (Article 6); and
exposure to carbon-border tariffs/CBAM, e.g. EU is
India’s 3rd-largest trading partner.
— Middle East and North Africa (MEA): Carbon pricing
is presently low/negative given subsidies to fossil
fuels/products, and slow adoption is expected, with
removal of subsidies as a first step. Carbon-pricing
potential has been explored in a World Bank partner-
ship for market readiness (e.g. Tunisia, Morocco, and
Jordan) also with support of carbon-market infra-
structure (GHG registry and MRV framework).
Carbon-price policy drivers in the regions are:
net zero announcements with 2050 time horizon;
carbon-border tariffs/CBAM exposure and price
signals to shift to low-carbon investment as part of
diversifying economies; and climate action as part
of hosting COP27 (Egypt) in 2022 and COP28 (United
Arab Emirates) in 2023.
— North East Eurasia (NEE): Carbon pricing is presently
low/negative given subsidies to fossil fuels/products,
and slow adoption is expected. The likely accession of
Ukraine to the EU would — over time — means alignment
of climate policy, including carbon pricing. Schemes
presently exist in Kazakhstan and Ukraine, with
emissions trading quotas and carbon tax, respectively,
currently at around USD 1/tCO2
e. Countries in NEE are
likely to adopt some form of carbon pricing to avoid
the EU CBAM on emissions embedded in CBAM
goods/exports. However, with Russia shifting its trade
pattern away from Europe, there is less pressure
towards adopting a carbon-pricing policy.
— Sub-Saharan Africa (SSA): Carbon pricing is low/
absent and slow adoption is expected. South Africa’s
government has announced a proposal to increase its
carbon-tax rate (currently under USD 10/tCO2
e) to USD
30/tCO2
e by 2030, and to USD 120/tCO2
e by 2050.
Carbon-price policy drivers include: access to global
climate finance; trade under Article 6 and exposure to
carbon-border tariffs/CBAM from mid-2030s. It may
be expected that revenues from carbon-border tariffs/
adjustment in high-income regions will also be used to
support climate action in low-income countries and/or
that these are granted preferential trade access and
initial exemptions (under the UNFCCC principle of
common but differentiated responsibilities). Willing-
ness to compete in green value-chains may spur
investment in some megaprojects – for example
green hydrogen or ammonia powered by dedicated
renewables.
154
DNV Energy Transition Outlook 2022
155
Policy and the energy transition CHAPTER 6
Factoring in pledges
and policies
Pledges on emission reductions are the first steps in the
direction of meaningful climate action. Where the latest
Emissions Gap Report (UNEP, 2021) from October 2021
suggested that country commitments and current
policies would lead to a temperature rise of 2.7o
C by
the end of the century, bolder pledges were submitted
ahead of, and during, the Conference of the Parties,
COP26 in Glasgow. Post-COP26 assessment suggested
that announced pledges and targets would lead to a
future global mean temperature rise of 2.1o
C if countries
fully implement their pledges to 2030 and beyond. An
“optimistic scenario”, where all the announced net-zero
commitments or targets under discussion are imple-
mented, would bring the estimated temperature rise
down to 1.8°C by 2100 (Climate Action Tracker, 2021a).
However, a main takeaway is that only lip service is being
paid to ‘net zero’, and the gaps between commitments
and action need to be closed. Much more credible
pathways are required for reducing global emissions
by 45% by year 2030 and achieving net zero by 2050.
The final agreement from COP26, the Glasgow Climate
Pact (UNFCCC, 2021a), asks all countries to “revisit and
strengthen” their targets and 2030 emission-reduction
plans by the end of 2022, instead of waiting for five years.
In our analysis, we monitor Paris Agreement-related
pledges closely, but we do not pre-set our Energy
Transition Outlook model to achieve them. Announce-
ments are initial steps in planning, but also precursors
of a possible future. Whether that future comes about
depends entirely on adequate policies, and most
countries have inadequate short-term policies, despite
the boldest pledges (Climate Action Tracker, 2021b).
What matters for DNV’s forecast is that policies are
both enacted and implemented. In other words, we
need pledges to be coupled with concrete sector-
transition pathways enabled by real policy and support
measures. It is these that will determine the future
curbing of emissions, as well as the direction, scope,
and pace of the transition.
The policy analysis informing our Outlook maps policy
documents for existing, enforceable policy/measures
and indications of planned, future policy develop-
ments, and assesses their likely impact. Model-specific
policy factors are thus derived on the basis of policy
mapping.
In our analysis, we monitor Paris Agreement-
related pledges closely, but we do not
pre-set our Energy Transition Outlook model
to achieve them.
6.5 POLICY FACTORS IN OUR OUTLOOK
Our forecast factors in policy measures that span the entire
policy toolbox (Section 6.4). 12 policy considerations
exert influence in the following three main areas:
a) Supporting technology development and activating
markets, thus closing the profitability gap for low-
carbon technologies competing with conventional
technologies;
b) Applying technology requirements or standards to
restrict the use of inefficient or polluting products/
technologies; or
c) Providing economic signals (e.g. a price incentive)
to reduce carbon-intensive behaviour.
Steps in the analysis
Our policy analysis looks at multiple policy arenas,
spanning global regulation (e.g. the Paris Agreement),
regional/national policy developments across the 10
world regions, and public/private partnership initiatives.
Guideposts for our policy mapping are to:
— ensure detailed coverage on the countries within each
of the 10 ETO world-regions that combined represent
80% of the total energy use of each region.
— assess national/regional policy documents for existing,
enforceable policy, and plans/announcements for
future policy developments.
— complement insights from policy documents with
credible sources of research and analysis produced
by leading organizations and experts worldwide.
In deriving an ETO model-specific policy factor, the
following steps are taken:
— regional willingness/ability to implement support/
subsidies is considered and differentiated
— country-level data are translated into expected policy
impacts, then weighted and aggregated to produce
regional figures for inclusion in our analysis.
Below, we detail policy factors in the analysis.
156
DNV Energy Transition Outlook 2022
157
Policy and the energy transition CHAPTER 6
— For the demand-side, a hydrogen-policy factor reflects CAPEX support to manu-
facturing and buildings but varies by region in terms of policy focus and percentage
level of CAPEX, according to government-funding programmes. The full subsidy
remains until 2030 and is then gradually halved to 2050.
— For road transport/vehicles, the speed of hydrogen uptake is determined by a
hydrogen-policy factor reflecting, among other parameters, FCEV CAPEX support
including refuelling infrastructure. Examples are incentives driven by municipality-
based CAPEX reduction policies for hydrogen-fuelled public buses.
— For shipping and aviation, fuel-mix shifts are driven by fuel-blending mandates and
carbon pricing.
— CCS in low-carbon hydrogen production is mainly driven by regional carbon prices.
The main trigger for CCS uptake will be where carbon prices are higher than the cost
of CCS. In addition, regional policies providing specific support for CCS are reflected
to enable the initial uptake and reduce costs. This policy support will be reduced when
carbon prices become high enough to sustain growth.
5. Carbon capture and storage support
— Historical CCS implementations, as reported by the Global CCS Institute (2021),
are fully incorporated, as well as their future project pipeline of plants and storage
to 2030. These projects receive investment and operational government support.
— Regional carbon prices determine the uptake of CCS in power, manufacturing, and
industrial processing.
— Regional policy support for CCS, beyond the carbon price, is integrated based on the
gap between regular CCS costs and carbon pricing to account for this gap and enable
initial CCS uptake. Policy support is reduced when the gap between carbon price and
CCS costs is closed.
6. Standards for energy efficiency
— Standards and regulation (existing and planned) for energy use and efficiency
improvements in buildings, transport, and industry sectors are incorporated.
— Buildings: Standards for insulation against heat loss, heat gain and energy use
for appliances and lighting are used as guides for setting the input assumptions.
However, the policy effects are not quantified explicitly.
— Vehicles: Efficiency and emissions standards per region are incorporated and trans-
lated into normalised test-cycle values (New European Driving Cycle, NEDC). An
adjustment factor per region is applied to derive real-world fuel consumption from
the theoretical NEDC values. The fuel-efficiency trajectories towards 2050 follow the
trends determined by these real-world-adjusted standards, corrected for EV uptake.
— Shipping: IMO 2050 carbon emissions fully implemented (IMO, 2018).
1. Renewable power support
— Renewable electricity build-out is advanced by governments in all regions, increasingly
throughmarket-ledapproachessuchascapacityquotasandcompetitivebidding/auctions.
— To reflect historical and expected future support for biomass, solar, and wind power, we
assume that those technologies receive a subsidy calculated as a fraction (which varies
per region) of the gap between the expected profitability of renewables (expected capture
price – levelized cost of energy) and the profitability of the most-profitable conventional
technology in the same region.
— Subsidies vary by technology and a region’s willingness/ability to implement support.
— The subsidy is removed as the profitability gap is closed.
— The subsidy stays at zero even if profitability of renewables become negative, as long as
the profitability of conventional generation is lower.
— Carbon pricing and increase in cost of capital reduce the attractiveness of fossil-based
generation.
2. Energy storage support (batteries)
— Existing and planned policy support is translated to an average support as a percentage
of battery unit costs for battery-storage technologies.
— Support levels increase with the share of variable renewables in regional electricity
generation, incentivizing investment in flexibility while reflecting regional differences in
willingness/ability to implement support.
3. Zero-emission transport
— We reflect an average regional EV support for both battery electric vehicles (BEVs) and
fuel-cell electric vehicles (FCEVs), based on existing support at the country level.
— We account for subsidies, tax exemptions, and reduced import duties, and translate this
into an average CAPEX support per region per vehicle type.
— We assume a slight initial growth and a decline in preferential treatment from the current
levels thereafter. The support is capped by the EV cost disadvantage.
— Country-level targets for public fast-charging ( 22kW) infrastructure roll-out have been
mapped to identify EV uptake barriers. As charging infrastructure expands over the next
decade, this is increasingly likely to be on market terms, and associated grid-infrastructure
build-out will follow without constraints.
4. Hydrogen support
— Support for the scaling of hydrogen infrastructure, and for the supply-side in terms of
hydrogen production, is estimated on the basis of total annual government funding
available for hydrogen RD and deployment (pilot projects, support for large-scale
infrastructure, and industry projects) and reflected as a percentage subsidy for the capital
cost of low-carbon hydrogen production routes. This also has spill-over effects for hydro-
gen demand in end-uses through reductions in hydrogen price.
Policy factors influencing our Outlook
158
DNV Energy Transition Outlook 2022
159
Policy and the energy transition CHAPTER 6
10. Air pollution intervention
— Policy interventions are reflected by an air-pollution cost proxy that transfers costs of
control measures to an operating cost per kWh, incorporated in power and manufac-
turing sectors.
— A regionally dependent ramp-up rate is used, going from 0 to 100% implementation
of the operating cost over a certain period, indicating that regulations will be gradually
enforced on more and more pollutants and plants.
11. Plastic pollution intervention
— Policy interventions on plastics, such as mandated recycling, taxes on unrecycled
plastic, trade restrictions, and extended producer responsibilities, are incorporated in
form of recycling rates and an effect of reduction and substitution on demand.
— The projected recycling rates (mechanical and chemical) and the effect of reduction
and substitution builds on the “Reshaping Plastics” report for Plastics Europe
(Systemiq, 2022), assuming that the most-likely future policy interventions correspond
to those in the Circularity scenario (a combination of the “Recycling” and “Reduction 
substitution” scenarios). Among the regions, EUR is expected to be a front-runner and
the other ETO regions are assumed to follow, but with delays ranging from 5 to 15 years.
12. Methane intervention
— Methane intervention and abatement, such as resulting from the Global Methane
Pledge (US and EU initiative in September 2021, promising at least 30% reduction from
2020 levels by 2030) are incorporated. Partial energy-sector reductions are achieved
as a result of carbon prices deployed against methane abatement technologies and
their marginal costs.
7. Bans, phase-out plans and mandates
— Bans on ICE cars are not incorporated in the forecast, but model results are
compared with announced bans.
— Phase-out plans on nuclear power are incorporated but with a few short-term
exceptions in Europe due to the Ukraine war. For coal-fired power generation, our
forecast references the phase-out plans. However, due to market economics and
reduced cost-competitiveness, shutdowns might happen earlier than phase-out
plans suggest.
— Regional biofuel-blend mandates currently in place are considered and we foresee
further strengthening of these in frontrunner regions such as EUR and NAM. Mandates
will likely be enhanced in the future to include other sustainable aviation fuels (SAFs).
— Region-specific pushes both from business and from individuals that are willing to
pay for sustainable aviation, will enable a gradual increase in uptake of non-cost
competitive aviation fuels such as hydrogen and SAFs.
8. Carbon pricing schemes
— Our region carbon-price trajectories to 2050 consider hybrid pricing (cap-and-trade
schemes and carbon taxation).
— Our carbon-price trajectories (Figure 6.3) are reflected as costs for fossil fuels in manu-
facturing and buildings; and in power, hydrogen, ammonia, and methanol production,
where progressive participation in the same regional and/or sectoral carbon-pricing
schemes is assumed. Some regions (EUR, NAM, OPA, CHN) are projected to reach
carbon-price levels in the range of USD 22–95/tCO2
by 2030 and USD 70–135/tCO2
by 2050. Across all 10 regions, carbon pricing by mid-century is projected to range
between USD 20/tCO2
(in NEE) and USD 135/tCO2
(in EUR).
9. Taxation of fuel, energy, carbon and grid connections
— Fossil fuels used in road transport are taxed at the consumer level, labelled as fuel or
carbon taxes.
— Effective fossil-carbon rates are incorporated in fuel prices for road transport, with
taxation highest in Europe.
— We assume that these taxes will increase in line with a region’s carbon-price regime,
rising at a quarter of the carbon-price growth rate.
— Energy tax rates incorporated for other demand sectors (buildings, manufacturing)
encourage switching from fossil fuels to electricity and hydrogen. Electricity taxation
declines in high-tax regions to enable electrification of end-use sectors. In order to
support hydrogen uptake, it is expected to be exempt from energy taxation through to
2035 in all regions. In regions prioritizing domestic use of hydrogen, the tax exemption
has a phase-out profile, with hydrogen increasingly facing tax levels similar to those
applied to the region’s future industrial electricity to assure a harmonized energy
taxation system.
— Taxes and grid tariffs for grid-connected electrolysers are assumed to be a 25%
surcharge over the wholesale electricity price.
160
DNV Energy Transition Outlook 2022
161
Emissions and climate implications CHAPTER 7
7
EMISSIONS
AND CLIMATE
IMPLICATIONS
Highlights
This chapter present a forecast of cumulative energy-
related emissions to 2050. Energy production and use
represents more than 70% of global greenhouse gas
emissions, of which most is CO2
.
We find that while energy-related emissions peaked in
2019, and fell by 7% during the pandemic, they have
now returned to near-record levels. By 2025, emissions
will have grown to 32.8 GtCO2
(a little below 2019 levels)
before declining gradually to 17.7 GtCO2
per year, 46%
less than in 2021.
To estimate the warming trajectory associated with these
levels, we also take into account likely developments in
agriculture and land-use emissions, and IPCC estimates
of other greenhouse gases (GHGs). We calculate
cumulative emissions to 2050 and assume a linear
reduction from then until GHG emissions reach zero in
2100. That enables us to estimate the likely warming
effect of the energy transition we forecast, which
indicates a warming of 2.2°C by 2100 — which holds
dire implications for climate-related damage.
In Chapter 8, we detail DNV’s view on how to close the
gap between the energy future we forecast and one that
will limit global warming to 1.5°C.
7.1 Emissions163
7.2 Climate implications169
162
DNV Energy Transition Outlook 2022
163
Emissions and climate implications CHAPTER 7
7 EMISSIONS AND CLIMATE IMPLICATIONS 7.1 EMISSIONS
The energy sector is responsible for more than 70% of annual greenhouse
gas (GHG) emissions associated with human activities. The combustion of
fossil fuels is the main contributor to emissions from the sector. Most of the
emission is carbon dioxide (CO2
), though methane (CH4
) is also an important
GHG when considering future climate implications.
Emissions from energy-related activities have grown
continuously since the Industrial Revolution and it is
estimated that 50% of energy-related emissions have
been added to the atmosphere in the last 50 years
(Buis, 2019). After staying virtually flat between 2014 and
2016, global annual energy-related CO2
emissions grew
to a peak of 33.6 GtCO2
in 2019.
The effects of COVID-19 resulted in energy-related CO2
emissions dropping by approximately 7% in 2020, a
reversal unprecedented in recent history. But as economic
activity picked up, so did energy use and emissions.
The pandemic has shifted the global emissions trajectory
slightly down because the global economy and energy
use need some years to regain momentum while decarbo-
nization continues. We still find 2019 to be the year of
peak emissions in our modelling. The impact of the
COVID-19 pandemic on cumulative global emissions is
very limited, however.
Russia’s invasion of Ukraine has further disrupted the
energy transition, with the net effect of a slight increase in
emissions in the coming years as countries shift focus
from decarbonization to securing the supply of energy,
which in many regions means increased coal use or
temporarily running oil-based electricity generation
(aided by the possibility of price-capped or discounted
Russian oil exports). Based on global energy demand,
annual energy-related CO2
emissions rose 5.5% during
2021 and will grow to 32.8 GtCO2
by 2025 before declining
gradually to 31.2 GtCO2
in 2030, almost the same level as
in the COVID-affected year 2020. By mid-century,
energy-related emissions are expected to be 17.7 GtCO2
per year, 46% less than in 2021 (Figure 7.1.).
Combustion emissions
Figure 7.1 shows coal as today’s main contributor (42%) of
energy-related CO2
emissions, followed by oil (30%) and
natural gas (26%). Emissions of CO2
from coal will see the
strongest decline (62%) between 2020 and 2050.
Emissions from oil will reduce by a third in that time,
whereas those from natural gas will remain at today’s
levels towards 2030 then drop to a quarter less than
today’s emissions by 2050.
In this chapter, we estimate the global energy-related
CO2
emissions until 2050 associated with the ETO
forecast. Adding these to the sum of other non-energy-
related CO2
emissions (e.g. industrial processes and
land-use) and energy emissions estimates beyond 2050,
allows us to derive the cumulative emissions that
decides the CO2
concentration, as well as derive the
associated global climate response in terms of global
average temperature increase.
We do not assess climate implications such as flooding,
drought, or forest fires beyond the future average
warming associated with the cumulative CO2
emissions of
our forecast.
We describe future CO2
emissions from energy, include a
likely development of agriculture and land-use emissions
(which contribute significantly to both CO2
emissions and
methane emissions); and we then assess climate impli-
cations. In addition, we comment on methane emissions
from the energy sector and its likely emissions due to
changes in the energy system.
164
DNV Energy Transition Outlook 2022
165
Emissions and climate implications CHAPTER 7
Sector emissions
Manufacturing is currently the largest sectoral contributor
to energy-related CO2
emissions; 11 Gt in 2020, 36% of all
energy-related emissions that year. The buildings sector
made up 26% (8 GtCO2
) of the total that year while
transport, the third main energy demand sector,
accounted for 24% (7.5 GtCO2
) and was the most severely
impacted by COVID-19.
In 2050, manufacturing will remain the biggest emitter
(34%), but with annual emissions reduced to 6 GtCO2
.
Transport’s share will increase to 30% by then, but in
absolute terms its emissions will reduce to 5.3 GtCO2
,
while the buildings sector’s emissions declines to 4
GtCO2
(22%) as seen in Figure 7.2. The dynamics behind
these emission reductions are summarized as follows:
— The manufacturing sector emissions will decline
steadily over the whole forecast period with electrifi-
cation, fuel-switching and carbon capture and storage
(CCS) in combination contributing to almost halving
emissions from manufacturing.
— The buildings sector will see a steady decline and
halving of its emissions, despite significant growth in
the number of commercial and residential buildings.
Continuous improvements in energy efficiency and
switching to cleaner sources of fuel for heating (e.g.
electricity combined with heat pumps) will be the main
reasons for these reductions.
— The transport sector saw a sharp decline in emissions
in 2020 due to the COVID-19 pandemic. In the longer
term, the main trend of electrifying road transport will
result in emissions declining 30% to 2050. This is not
just because EVs use energy more efficiently, but also
because electricity production from renewable sources
will increase, supplying ever-more emission-free
electricity to the transport sector. However, it is only by
the mid-2020s that transport emissions start to
decline. This is because even though the growing
number of EVs reduce emissions, the effect is initially
countered by transport growth and a lack of emission
reductions in shipping and aviation.
Regional emissions
Our 10 Outlook regions have different starting points
and very different emission trajectories over the forecast
period. Greater China, currently the largest emitter by far,
will reach peak emissions before 2030; its emissions will
then decline to mid-century, when they will be 71% less
than in 2020.
The Indian Subcontinent will continue to grow its
emissions, peaking by 2040 then declining 15% by 2050
to be 40% higher in mid-century than in 2020. Sub-
Saharan Africa will show an increase of 61% compared
with today. All other regions will reduce their emissions
Figure 7.3, led by Europe (-78%), OECD Pacific (-77%) and
North America (-68%). North East Eurasia will have the
highest emissions per capita at 7.5 tonnes in 2050,
followed by North America and Middle East and North
Africa at 3.5 t per person (see graphic on Energy, GDP
and population, page 172). We describe regional
emissions in more detail in Chapter 9.
Process-related emissions
In addition to CO2
emissions from combustion of fossil
fuels, there are significant emissions from industrial
processes that either consume fossil fuels as raw material
for feedstock (e.g. plastics and petrochemical products)
or through processes that produce CO2
through a
chemical reaction (e.g. cement and other industrial
processes).
These process-related emissions, together with estimates
of the subsequent capture of some of these process
emissions, are included in our analysis as part of the
manufacturing sector. In 2020, these emissions were an
estimated 3.7 GtCO2
, of which approximately 44% were
from calcination in the cement-production process. The
remainder of the emissions were 40% from ammonia
production, and small shares from coke ovens and the
production of lime or other chemicals.
We expect a slight rise in construction and industrial
growth, which largely drives process emissions, over the
next 15 years, and then a stabilization. However, while
output might stabilize at a higher level than today,
improvements in production and technical efficiencies,
combined with increasing shares of these emissions
being captured, mean that the resulting emissions level
will decline towards 2040, and fall even more quickly in
the decade to year 2050. In mid-century, process-related
industrial emissions will be 35% less than today.
Land-use emissions
CO2
emissions from AFOLU (agriculture, forestry, and
other land use) are not included in our forecast and
modelling but are at a similar level to Europe’s emissions.
They are substantial enough, then, to warrant inclusion of
land-use emissions in any calculation of global emissions.
Emissions from land-use have been growing slowly over
the last 20 years, historically averaging 5 GtCO2
per year,
but with large annual fluctuations. Most recent research
has adjusted land-use emission down slightly from the
historical average. Even incorporating last year’s forest
fires, the latest such estimate is that there was a decline to
3.2 GtCO2
per year in 2020 (Global Carbon Budget, 2021).
There is currently considerable uncertainty about
changes in future land use, as some countries with large
forest areas are losing them at double-digit percentage
rates compared with previous years, due to deforestation
and forest fires (Global Forest Watch, 2021). However, we
expect that climate and sustainability concerns will
eventually affect policy, creating pressure to control
land-use changes. Thus, our best estimate is that annual
CO2
emissions from land-use changes will slowly decline
towards 3 Gt in 2030, and then reduce linearly to 2 Gt in
2050, almost 40% less than today’s annual levels.
166
DNV Energy Transition Outlook 2022
167
Emissions and climate implications CHAPTER 7
Carbon capture and removal
CCS today is almost solely applied as part of enhanced oil
recovery, where there is a viable business case, capturing
a mere 26 MtCO2
per year. Going forward, we expect that
operators of large point sources in the power and
manufacturing sectors will increase the capture of carbon
from their processes and waste streams. Additionally, we
expect all carbon emissions from hydrogen production
as an energy carrier to be captured in the steam-methane
reforming (SMR) process; we also foresee capture of an
increasing share of emissions associated with hydrogen
production for the process industry. Some capture is also
expected when flaring occurs during natural gas
processing.
However, for all the existing and announced policy on
CCS, its uptake will be very limited in the near- to medium-
term, and effectively too late and too little in the longer
term. It is only in the 2040s, when carbon prices start to
approach the cost of CCS, that uptake accelerates and
deployment at scale begins. By 2050, we find emissions
captured by CCS to be 1.3 GtCO2
. Of these 0.3 GtCO2
will
be captured from SMR, 0.4 GtCO2
from process-related
emission from activities consuming fossil-fuels as feed-
stock, and the rest from point-source capture in power
and manufacturing (Figure 7.4). By 2050, the remaining
emissions for potential capture in power and manu-
facturing are in regions with low carbon prices, which to a
large extent explains why total carbon captured amounts
to only 6% of all CO2
emissions in 2050.
Direct air capture (DAC), which involves the direct capture
of CO2
from the atmosphere and then sequestering the
captured CO2
, is still an emerging technology. It shows
great promise for decarbonization after 2050 but will not
scale fast enough to make a meaningful difference to
emissions before then. It is nevertheless a much needed
niche and very meaningful at the scale of individual
companies. We note that any pathway to net zero by 2050
will have to accelerate DAC technology development and
uptake enormously (see Chapter 8).
Almost 60% of CCS capacity will be in Europe, Greater
China, and North America. Europe is the only region with
high enough carbon prices to make a viable business
case for CCS before 2040. The other regions will have
considerable fossil-fuel use and relatively moderate
carbon prices. CCS development is thus not happening
at sufficient speed or scale to make a significant impact in
reducing emissions enough to prevent future global
warming.
In September 2022, Climeworks and Carbfix announced
the development the world's first full-chain certification
methodology dedicated to CO2
removal via direct air
capture and underground mineralization storage.
This methodology has been validated by DNV.
(Image, courtesy Climeworks) Methane (CH4
) is a greenhouse gas which is the second
largest contributor, after CO2
, to global warming. The
concentration of CH4 in the atmosphere has more than
doubled since pre-industrial times. Approximately half
the CH4
emitted is anthropogenic. Most of these
emissions are associated with the agricultural sector
(40%), and approximately 35% from extraction and use
of the fossil fuels oil, natural gas, and coal (UNEP, 2021).
Methane has a shorter half-life (12.4 years) than carbon
dioxide. However, methane is a more potent GHG than
CO2
per tonne of GHG emitted; 29.8 times more potent
over the 100-year Global Warming Potential (GWP) time
horizon, and 82.5 times so in a 20-year GWP perspective
(IPCC, 2021). Total anthropogenic CH4 emissions in
2021 were estimated at 357 Mt (IEA, 2021c). When
converted to their CO2
equivalent value using 100-year
GWP, that amounts to 10.6 GtCO2
eq, which is a little less
than a third of the global CO2
emissions from the energy
sector. This is not an insignificant amount, especially
given that mitigating involuntary CH4
emissions is
fiscally expedient as it may be used as energy, thus
fractionally reducing the need for extraction.
Global Methane Pledge
One of the important commitments regarding curtailing
CH4
emissions is the Global Methane Pledge (GMP)
brought forward by the US and EU at COP26 in 2021
(Global Methane Pledge, 2021). At present it has around
120 participating countries, who account for 45% of total
anthropogenic CH4
emissions. The GMP aims to reduce
global CH4
emissions by 30% by 2030, compared with
2020 levels.
Despite its very good intentions, the Pledge has obvious
drawbacks. One is that some countries with large CH4
emissions, such as the Russian Federation, China,
Kazakhstan, and Venezuela, among others, are conspic-
uously absent from it. Second, while the GMP puts
forward a global target, it does not disaggregate the
easier-to-abate sectors from the total emissions; such
sectors include, among others, fossil-fuel extraction and
use, where abating CH4
emissions has a negative cost,
or a net monetary benefit.
The geopolitical climate after February 2022 is radically
different from when the GMP was unveiled. With the
Russian invasion of Ukraine, and the ensuing natural gas
supply shock, the focus has shifted firmly away from CH4
emissions accumulating from the fossil-fuel sector, to
mitigating energy-supply insecurity. To put it bluntly,
countries need oil and natural gas now, and do not care
how they get it. In fact, preliminary numbers suggest
that CH4
emissions from oil and gas extraction have
increased in 2022 compared with 2021 (Financial Times,
2022a), which our results also show.
Methane emissions from fossil fuels
168
DNV Energy Transition Outlook 2022
169
Emissions and climate implications CHAPTER 7
Methane emissions from fossil fuels
In our Outlook, we present the CH4
emissions from the
coalmining process, and from oil and natural gas
extraction, transmission, and distribution. Historical
data on CH4
emissions from all fossil fuels are obtained
from EDGAR, the Emissions Database for Global
Atmospheric Research (EC-JRC and PBL, 2021). The
resulting emissions are projected based on activity
levels of oil and natural gas production by field type
(conventional onshore, offshore, and unconventional),
and coal production. For oil and gas CH4
emissions, we
also separate the CH4
emission mechanisms, namely
vented, fugitive, and incomplete flaring.
Our projection indicates that the world will fail to meet
the Global Methane Pledge by 2030, at least in terms of
CH4
emissions from fossil fuels. The CH4
emissions from
fossil fuels are 108 Mt per year in 2030, only 7% less than
the 115 Mt in emitted in 2020 (Figure 7.5). We project
CH4
emissions of 88 Mt per year in 2040, 24% less than in
2020. By mid-century, CH4
emissions will be half of what
they were in 2020, primarily thanks to reduction in
demand for coal and oil.
In 2020, CH4
emissions from natural gas were 40% of the
total emissions, with coal and oil having approximately
equal shares of 30% (Figure 7.6). But we estimate these
shares will change gradually, with coal CH4
emissions
seeing a drastic reduction thanks to reduction of
demand. By mid-century, half of the methane emissions
from fossil fuels will be due to the extraction, transmission,
and distribution of natural gas, with oil contributing
30%, and coal 20%.
Why only CO2
and CH4
?
Other greenhouse gases, such as NOx, HFCs and CFCs,
are more potent climate gases (measured in GWP per
tonne of gas emitted) and more persistent than both
CO2
and CH4
. However, we do not consider these in our
analysis. There are two main reasons for this. First, the
energy sector is not a significant contributor to these
emissions. Second, the quantities of these GHGs are low
despite their high potency. Thus, these emissions could
potentially be much more easily reduced through
regulation and are not correlated to our energy systems
model.
Our forecast gives future levels on CO2
emissions per
year and enables us to determine the corresponding
climate response and its associated temperature
increase. We focus only on first-order effects and do not
include possible tipping points and feedback loops, such
as melting permafrost and peat fires, which would
accelerate global warming. Other climate implications,
including those directly associated with emissions (e.g.
acidification of the oceans), or indirect consequences
such as sea-level rise, are not dealt with in this Outlook
which concentrates on the energy transition and its
associated CO2
emissions.
CO2
concentration
The concentration of CO2
in the atmosphere is measured
as parts per million (ppm). Pre-industrial levels were
around 280 ppm (Global Carbon Project, 2020), and
emissions related to human activities, particularly
burning fossil fuels, have resulted in a significant increase.
The most recent reading, in June 2022, was a record level
of 417.42 ppm (NOAA GML, 2022). Over the last 60 years,
there has been an increase in the concentration of over
100 ppm, which is of the same magnitude as the entirety
of shifts observed over the previous 800,000 years
(IPCCa, 2021).
We forecast a continuation of CO2
emissions to the
atmosphere linked to human activities, albeit at a
decreasing rate. In contrast to methane, which on
average oxidizes after approximately 10 years (IPCC,
2001), it takes hundreds to thousands of years for CO2
to
disappear naturally from the atmosphere (Archer et al.,
2009). Thus, with the lengthy persistence of CO2
in the
atmosphere, the cumulative concentration of CO2
gives a
direct indication of long-term global warming.
As there is a causal link between concentration and
long-term temperature increase (IPCCa, 2021), it is
possible to calculate the expected temperature increase
based on the cumulative net global amount of CO2
in the
atmosphere. Similarly, limiting global warming to a given
level with a given probability, taking into account the
effect of other anthropogenic GHGs and pollution, gives
the maximum amount of cumulative net global anthropo-
genic CO2
emissions, often referred to as the global
carbon budget.
Carbon budget
The carbon budget includes several uncertainties. They
include the accuracy of data on historical emissions; the
accuracy of the estimated warming to date; the role of
other GHG emissions in current warming; Earth system
feedbacks; and, the delay between emissions having
reached net zero and the additional amount of warming
inherent in the system. The closer we get to the temper-
ature increase that we wish to avoid (e.g. increase above
1.5°C), the more these parameters contribute to
uncertainty.
Despite these uncertainties, the carbon budget has
proved to be a reasonable method to indicate potential
future warming levels based on different scenarios for
energy-related emissions.
For our temperature estimates, we have used the ‘likely’
(meaning 67% probability) carbon budgets from the IPCC
Sixth Assessment Report (IPCC, 2021). By selecting a 67%
chance to stay below the selected temperature thresh-
old, we have chosen to increase the certainty of limiting
warming to our selected respective temperature thres-
holds. IPCC concludes that to stay below 1.5°C, we have
to limit cumulative emissions from 2020 onwards to 400
GtCO2
, and to 1,150 GtCO2
to remain below 2.0°C.
The IPCC carbon budgets have taken account of emis-
sions from other GHGs. Methane emissions from fossil
fuels or changes in agricultural practices, including
fertilizer use or aerosol emissions, can have considerable
influence on the size of the carbon budget. We use the
IPCC scenarios in line with ‘very low’ and ‘low’ non-CO2
emissions estimates, that follow a similar path as our CO2
emission trajectory. If emissions from non-CO2
GHGs are
larger, then the carbon budget will be smaller and
associated temperature increase larger.
7.2 CLIMATE IMPLICATIONS
170
DNV Energy Transition Outlook 2022
171
Emissions and climate implications CHAPTER 7
Using the IPCC carbon budgets and the cumulative CO2
emissions from our forecast, we find that the 1.5°C
budget will be exhausted in 2029. The carbon budget
associated with the 2.0°C threshold will be exhausted in
2056, outside the forecast period. The CO2
emissions
from energy-related activities as well as industrial
process and land-use emissions will still be considerable
post-2050 and will continue many years thereafter. Thus
the question arises: ‘What temperature increase does our
forecast suggest?’
Temperature increase
Our forecast and associated CO2
emissions end in 2050.
Therefore, in order to use the overshoot of the carbon
budgets to evaluate a likely temperature increase, the
emissions for the latter part of this century must be
assessed. By 2050, the emissions trajectory shows a
relatively steep decline, with increasing amounts of CO2
captured by CCS. Beyond 2050, our analysis assumes we
will arrive at net-zero CO2
emissions before or at the end
of this century.
To estimate the CO2
emissions and global warming by the
end of the century, we extrapolate the development of
emissions and their capture towards 2100. Capture
occurs only within the sectors shown in Figure 7.4; so, for
sectors such as transport or buildings where there is zero
or marginal capture, we extrapolate a decline in line with
our forecast but ending at net zero by 2100. The
approach gives us estimated cumulative emissions of 370
GtCO2
between 2050 and 2100 (Figure 7.7). This estimate
does not include any large-scale negative-emissions
technologies that may be able to reduce the atmospheric
CO2
concentrations significantly. With the updated
climate response from IPCC AR6 (IPCC, 2021) using the
67% ‘likely’ overshoot of 300 GtCO2
compared with the
2.0°C budget suggests that the world will reach a level of
warming of 2.2°C above pre-industrial levels by 2100.
We find that 1.5°C budget will be exhausted
in 2029, and the 2.0°C budget in 2056
The UN Intergovernmental Panel on Climate Change
(IPCC) is now completing the sixth assessment cycle.
While preparing the Synthesis report to be published
late 2023 or early 2024 the following three reports have
been issued:
— Climate Change 2021 — The Physical science basis
— Climate change 2022 — Impact, adaptation and
vulnerability
— Climate change 2022 — Mitigation of climate change
We do not intend to summarize the reports here but are
intensely aware of the warning stemming from them. In
describing climate change, they use expressions such as
‘widespread and rapid’ and ‘unprecedented over many
centuries to many thousands of years’.
We acknowledge this work and use the IPCC report as
input for our analysis. While our Energy Transition
Outlook is an energy and not a climate forecast, the
IPCC reports set the scene, documenting in a more
comprehensive way than any other work has ever
achieved just why an energy transition is needed; what
factors create climate change; and the various ways in
which an energy transition — or lack thereof — will impact
regions and the planet in the coming decades and
centuries. It also outlines the risk and uncertainties in
the scientific work. As such, it creates a very solid
foundation for our assessment of emissions and climate
implications of the energy transition.
IPCC Sixth Assessment Reports on climate science
António Guterres
United Nations
Secretary-General
9 August 2021
Today's IPCC Working
Group 1 Report is a
code red for humanity.
172 173
Emissions and climate implications CHAPTER 7
DNV Energy Transition Outlook 2022
World
North
America
(NAM)
Latin
America
(LAM)
Europe
(EUR)
Sub-Saharan
Africa
(SSA)
Middle East
and North Africa
(MEA)
Energy-related CO2
emissions per person
(Tonnes per year)
North East
Eurasia
(NEE)
Greater China
(CHN)
Indian
Subcontinent
(IND)
South East
Asia
(SEA)
OECD
Pacific
(OPA)
2020 2050 2020 2050 2020 2050 2050 2050 2050 2050 2020 2050 2020 2050 2020 2050 2020 2050 2020 2050 2020 2050
13.6 3.7 2.2 1.7 5.4 1.2 0.8 0.8 5.0 3.5 7.4 5.8 6.8 2.2 1.4 1.5 2.3 1.9 9.4 2.3 4.0 1.9
Energy use
per person
(Gigajoules
per year)
266 167 49 60 121 97 24 23 90 96 140 132 105 94 170 122 75 67
25 43 44 65
GDP per person
(USD2017ppp/
person-yr)
59 300 78 300 14 800 30100 38 800 57 500 3 800 9 600 20 100 39 300 17 400 30 500 21 600 49 200 39 800 56900 17 300 31 700
6 500 21 200 12 900 32 300
GDP, ENERGY USE AND EMISSIONS
ACROSS OUR 10 OUTLOOK REGIONS
This illustration shows, for each region considered in this Outlook,
a comparison between per capita GDP, primary energy use and
energy-related CO2
emissions (2020 and forecast figures for 2050)
2020-2050 Overview
174
DNV Energy Transition Outlook 2022
175
Pathway to net zero emissions CHAPTER 8
PATHWAY
TO
NET
ZERO
EMISSIONS
8
PATHWAY TO
NET ZERO
EMISSIONS (PNZ)
Highlights
This chapter presents DNV’s Pathway to Net Zero
emissions, which we consider to be a technically and
economically feasible — but unavoidably challenging
scenario.
Unlike our ETO forecast (the main focus of this report),
which results in global warming of 2.2°C by 2100, our
Pathway to Net Zero emissions (PNZ) is a ‘back-cast’
estimation of what is needed to achieve a net-zero
energy system by 2050 with the aim of securing a
1.5°C warming future.
We detail here the size of the gap between our forecast
and the PNZ, and detail what needs to change in the
supply and demand sectors to achieve net zero. A key
principle is that not all sectors will be able to reach net
zero emission by 2050. Moreover, not all regions will be
able to do so — implying that some demand sectors
(e.g. transport) and regions (typically high-income
regions) must go below zero before 2050. Chapter 9
provides more detail on the net zero pathways for each
of our 10 world regions.
8.1 Pathway to net zero
emissions (PNZ)176
8.2 Net zero policies180
8.3 Net zero demand and supply182
8.4 Net zero expenditures192
8.5 CO2
and methane emissions194
8.6 Sectoral roadmaps198
176
DNV Energy Transition Outlook 2022
177
Pathway to net zero emissions CHAPTER 8
PATHWAY
TO
NET
ZERO
EMISSIONS
8.1 PATHWAY TO NET ZERO EMISSIONS (PNZ)
“The best way to predict the future is to create it” — Peter Drucker (2009).
This chapter describes what DNV believes to be a plausible, but challenging,
pathway to a net zero emissions (PNZ) by 2050.
This pathway differs markedly from DNV's 'best estimate'
forecast of the most likely energy future captured in the
rest of this year's Energy Transition Outlook (ETO). From
here on, we use ETO forecast to refer to the most likely
future, as a contrast to a PNZ future. Comparing our
forecast with a pathway to net zero allows us to place a
dimension on the scale of the change needed to achieve
an energy transition that secures a 1.5°C future.
In its contribution to the IPCC’s Sixth Assessment Report
(AR6) on climate change (IPCC, 2022), Working Group III
describes 230 pathways that align with a 1.5°C future.
Two things common to all these pathways are net zero
CO2
emissions around 2050, and the use of some sort
of carbon dioxide removal technology.
Accounting for greenhouse gases (GHGs)
Saying that achieving net zero CO2
emissions in 2050
will limit global warming to below 1.5°C is, of course,
a simplification. While CO2
represents 65% of GHG
emissions, what happens to other highly potent GHGs
such as methane will be important. The IPCC carbon
budgets and net zero considerations take account of
emissions of these. For instance, methane emissions from
fossil fuels or changes in agricultural practices, including
fertilizer use or aerosol emissions, have considerable
influence on what net zero CO2
will mean in practice.
We use the IPCC scenarios in line with ‘very low’ and ‘low’
non-CO2
GHG emissions estimates, corresponding well
with the very low CO2
emissions we project; hence the
approach is consistent.
Gross zero and net zero
While net zero emissions is a logical goal on a global
scale, it should be applied with care at regional and
sectoral scales. There is a big difference between net
zero and gross zero, and a global net zero future does not
mean all sectors and regions will meet the zero-emission
threshold. It is both implausible and unjust to expect a
gross zero result — i.e. that all sectors, regions, or countries
achieve this challenging goal at the same time. Each
region differs in its emissions status and its ability to
reduce emissions. Similarly, the ready availability of
abatement options varies considerably between various
demand sectors.
Accordingly, this report applies the net zero approach
only on a global scale, while allowing for a large differen-
tiation on a regional scale. Similarly, we apply the net zero
approach to the entirety of energy demand, not for
individual demand sectors, which will decarbonize at
different rates. Applying our ‘most likely’ future from the
ETO forecast allows us to see where regions and sectors
are going to be, compared with where they need to go.
A fair transition
While the concept of a ‘just transition’ is compelling, we
have not attempted to model a dramatic transfer of
wealth across world regions over the next 30 years. This
choice is partly because ‘energy provision and consump-
tion’ is a relatively small component of total economic
activity, and because such wealth transfer is not very
likely to happen any time soon. Therefore, in our PNZ,
we have applied the same population and GDP growth
assumptions — and consequently, the same GDP per
person in 2050 — as we use in our ETO forecast of the
‘most likely’ future. While this is inconsistent with the
notion of a just transition, a greater injustice would arise
from the expectation that all regions should move at the
same decarbonization pace regardless of their different
starting positions. We have therefore scaled the imple-
mentation of measures to achieve net zero relative to the
GDP of the region, as further described in our policy
section. Arguably, our approach thus balances the fair
and the plausible.
The size of the emissions gap
The ETO emissions forecast summarized in Chapter 7
predicts 22.2 GtCO2
of annual emission in 2050, showing
there is a big gap to be closed to reach net zero emissions
by then. Furthermore, as carbon emissions will overshoot
the carbon budget for 1.5°C, there will be a need for CO2
removal in the post-2050 era to stabilize warming at 1.5°C.
Global temperature increase is closely correlated with
atmospheric CO2
concentration, which is continuously
growing as annual emissions are larger than the capacity
of the land and oceans to sequester the CO2
emitted. At
the start of 2021, the carbon budget for reaching 1.5°C of
global warming was 360 Gt of carbon dioxide. Our ETO
forecast sees this budget being used up by 2029; hence,
all emissions thereafter will first have to go to zero, and
then below zero for 50 years to remove the overshoot of
300 GtCO2
by the end of the century, as illustrated in
Figure 8.1. This is an enormous task and a huge gap
compared with the emission levels we forecast in the ETO.
Closing the gap
So, how do we close this gap? Most of the CO2
emissions
need to be avoided through implementing low-emission
technologies in the energy system. There are technical
solutions that need massive deployment and scale up,
such as renewable energy, storage, grids, hydrogen, and
CCS. Other technologies must be scaled down, such as
coal, oil, gas, and combustion engines. These actions
alone will be insufficient, and there will also be a need to
deploy significant amounts of carbon removal technolo-
gies. These could be nature-based solutions such as
reducing deforestation and increasing sequestration in
biomass. They could also be technical deployments like
direct air capture (DAC). Cumulative removal of CO2
must
reach almost 7 GtCO2
in total by the end of the century to
remove the overshoot accumulated by 2050.
Policy that drives or pulls through development and
implementation of abatement and removal solutions is the
main lever for scaling them up. If we are to close the gap
and limit the global average temperature increase to
1.5°C, it will be through tightening energy, industrial, and
climate policies in all regions and sectors, and by applying
the entire policy toolbox. The net zero policy conside-
rations included in the PNZ are described in Section 8.2.
The emissions reduction potential of changing behaviour
is also worth consideration. Policy nudges behaviour, and
there is a fine balance in deciding whether such changes
should be encouraged or enforced. For example, we
have limited the increase in the number of air flights in our
modelling by making flying more expensive through
significant sustainable aviation fuel (SAF) uptake policies,
such as taxes and mandates.
178
DNV Energy Transition Outlook 2022
179
Pathway to net zero emissions CHAPTER 8
PATHWAY
TO
NET
ZERO
EMISSIONS
The ETO forecast describes the future that DNV considers
‘most-likely’. This is not a future in which CO2
emissions
reach net zero in 2050 — far from it. It is logical to question,
therefore, whether achieving a net zero future by 2050 is
at all realistic.
A ‘most likely’ future does not, of course, rule out other
possible futures. In our view, net zero CO2
emission by
2050 is still possible, but only barely and will need
urgent, concentrated, and simultaneous effort from all
regions and countries. This chapter outlines what we
believe to be a realistic, albeit very narrow, pathway to
net zero emissions. It includes detailed net zero road-
maps for each major demand sector. Regional net zero
pathways are included in Chapter 9.
Individually and collectively, the sectoral roadmaps are
all possible, though very challenging. They require not
only strong contributions from technology and finance,
but an extraordinary step-up in energy policies, and
sometimes behavioural changes. Moreover, these
changes need to be achieved simultaneously. Alterna-
tively, if some sectors or regions underperform in
relation to the roadmaps, other sectors or regions will
need to over-deliver on already-challenging roadmaps.
Achieving net zero by 2050 is realistic for some sectors,
some regions, and some countries; but that is not
enough when we need to achieve global net zero.
Assuming that some sectors and regions will not
achieve net zero by 2050, others will have to strengthen
their targets and achieve net zero before 2050 and net
negative emissions in 2050. Nations and sectors that
conceivably can move faster are going to have to do so.
Each of the roadmaps we set out here is challenging;
the chances of all being achieved are low. If by ‘realistic’,
we mean a convincing or better-than-even chance of
achieving something, then we would need to concede
that net zero by 2050 is unrealistic. It is, however,
possible; and given what is at stake, it is imperative to do
our outmost to achieve it.
It is also crucial to realize that every tenth of a degree of
global warming matters disproportionately, as even
relatively small additional increases in temperature give
additional long-term consequences and risk hitting
planetary tipping points. 1.6°C of global warming is
much better than 1.7°C, and 1.9°C much better than
2.0°C, and so on. Because impacts pile up extraordinarily
for levels of warming above 1.5°C, the rational response
is surely to expend extraordinary effort now and in the
coming years to avoid a very dangerous long-term
future.
DNV’s contribution lies precisely in not painting a
rose-tinted view that net zero is easy to achieve, and by
providing a reality orientation on exactly how difficult
the goal is. Is net zero probable? No — but it is still
possible.
Achieving net zero by 2050 is realistic for
some sectors, some regions, and some
countries; but that is not enough when we
need to achieve global net zero.
Is net zero realistic?
180
DNV Energy Transition Outlook 2022
PATHWAY
TO
NET
ZERO
EMISSIONS
8.2 NET ZERO POLICIES
World leaders of the 2020s will be remembered for either
overseeing the continued expansion of unabated
fossil-fuel use, or for successfully acting on science and
the already overwhelming evidence of devastating
climate damage.
UN Secretary General António Guterres’ message at the
UN General Assembly climate roundtable (UN, 2022b)
was clear: “The 1.5-degrees limit is on life support — and it
is fading fast. I particularly call on G20 leadership to end
our fossil-fuel addiction. No new coal. Phasing out existing
coal. Backing a renewables revolution. The fossil-fuel
industry is killing us, and leaders are out of step with their
people, who are crying out for urgent climate action.”
Leaders have acted to some extent. A recent global
stocktake suggests that net zero target setting and
coverage have proliferated, now encompassing 91% of
the global economy (Net Zero Tracker, 2022). But there is
questionable robustness in governance and concrete
plans to achieve targets, and lack of clarity on the extent
of inclusion of all GHGs and how much reliance is being
placed on futuristic offsets.
Bending the emissions curve will require immense
intensification of government involvement in energy
systems. Requirements, bans, and economic support are
inescapable to spur structural change and emission cuts
in time to achieve even existing targets. Enactment of
policies that ensure near-term implementation of decar-
bonization options, at massive scale and speed, will be
necessary, as well as a much greater level of cooperation
and funding across regions.
DNV's PNZ activates the policy toolbox of known and
proven measures (see Section 6.4) to trigger emission
reductions in energy demand and supply sectors. Our
pathway aims to bring continuing emissions as close as
possible to zero, and to then rely on carbon removal
technologies both for any remaining emissions and to
compensate for carbon budget overshoot emissions.
Solutions comprise several technologies at varying levels
of commercial readiness, and a blend of policies will
therefore be needed. The urgency to achieve net zero will
require synchronous acceleration of both technology
development and uptake.
The overarching principle guiding our policy measures to
achieve a net-zero outcome, is that high GDP regions
(Europe, North America, OECD Pacific, Greater China)
move at faster pace and greater depth to achieve the
Paris target, which aligns with the UNFCCC principle of
common but differentiated responsibilities and respective
capabilities in addressing global climate change.
These regional economies have strong decarbonization
goals, account for the bulk of emissions (historically and
presently above 60% of global emissions) and emit far
more than less affluent regions. They also possess the
wealth and competence for technology development
and to boost cost learning curve-based cost reductions
for key abatement technologies.
Here, we highlight the strengthened policy factors
forging our pathway to net zero, and regional details are
presented in Chapters 9.
World leaders of the 2020s will be
remembered for either overseeing the
continued expansion of unabated fossil-
fuel use, or for successfully acting on science
and the already overwhelming evidence of
devastating climate damage.
Buildings
— Bans target phase-out of fossil-based heating and limit
equipment choices for space/water/cooking
— Higher energy efficiency standards (new builds and
renovations) reduce heating/cooling demand
— Consumer-side fossil-fuel subsidies are removed, and higher
cost of capital hinders fossil-based heating
Transport
— Fuel economy emission standards tighten in all markets, and
taxes on gasoline/diesel increase
— Bans on new ICE vehicle sales in developed regions from
2030 (first-mover countries and stepwise regional
implementation), followed by most low-income regions
in the 2040s
— Zero-emission vehicle incentives promote EV adoption and
support charging infrastructure
— Shipping and aviation fuel-mix shifts driven by fuel-blend
mandates and carbon pricing
Manufacturing
— Carbon pricing drives CCS uptake
— Cost-of-capital increases drive down attractiveness of
fossil-based equipment
— CAPEX support for electrification and for hydrogen usage/
supply-chain shifts in iron and steelmaking
— Energy intensity improvements driven by regionally
differentiated taxation on fuels
— Energy taxation encourages fuel shifts to electricity and
hydrogen usage
— Requirements increase material efficiency (e.g. in cement
production/use) and recycling rates (e.g. plastics,
scrap steel)
Power generation
— Cost of capital increases reduce the attractiveness of
fossil-based generation
— A mix of mandates and carbon pricing end unabated
gas-fired generation in all regions
— Bans enable oil and coal-fired generation phase-out in all
regions by 2045
— All regions support renewable build-out, including for
storage capacity coupled with renewables
CCS  Direct air capture
— Higher carbon prices accelerate deployment
— Mandates require CCS in natural gas-fired power generation
— Ramp-up of CCS and direct air capture (DAC) capacity is
enabled by policies supporting CAPEX reduction and
value-chain/infrastructure development
Hydrogen support
— Policy measures stimulate hydrogen demand; e.g. blend
mandates in aviation and maritime, and energy taxation
boosting fuel shifts in manufacturing and in other hard-to-
abate sectors
— Policy measures stimulate hydrogen supply, such as CAPEX
support for low-carbon production routes, dedicated
renewables-based electrolysis, and subsidies to grid-
powered, renewables-based electrolysis
Energy efficiency
— Targets and legislation accelerate the pace of energy-
efficiency improvements; e.g. tightened standards for
equipment and appliances, building codes, requirements
renovation/retrofits, and energy-intensity improvements in
buildings
— Incentives to replenish equipment bases; e.g. from fossil to
electricity-based technologies, or switching to alternative
combustion-based fuel
— Tax cuts, access to cheap financing, and direct subsidies for
energy-efficient technologies
— RD support for new technologies
— Public spending for build-out of support infrastructure; e.g.
EV chargers, hydrogen, and district heating networks
Carbon pricing
— High GDP regions accustomed to energy fees, will be
frontrunners (EUR, NAM, OPA slightly above CHN) reaching
price levels of 100–150 USD/tCO2
by 2030. By 2050, regional
trajectories range between 50–250 USD/tCO2
— Carbon-border adjustment mechanisms drive convergence
among leading regions, and pull all regions’ carbon-price
trajectories upwards
Government funding  Cost of capital
— Most region governments will redirect funding towards
emissions reduction and clean energy, both domestic and
overseas. Examples of the latter are Chinese, South Korean,
and Japanese commitments to not build/finance new
coal-fired power projects abroad, and G7 countries ending
support without co-located CCS
— Revision of government funding parallels a finance sector
shift to align investment practices with net zero; increasingly
limited pools of capital will be available for fossil-fuel
projects and with higher cost of capital, coal-fired facilities
will face the highest discount rates
Pathway to net zero emissions CHAPTER 8
181
PATHWAY
TO
NET
ZERO
EMISSIONS
182
DNV Energy Transition Outlook 2022 Pathway to net zero emissions CHAPTER 8
PATHWAY
TO
NET
ZERO
EMISSIONS
8.3 NET ZERO DEMAND AND SUPPLY
2020 2025 2030 2035 2040 2045 2050 2100
0
10
20
-10
40
30
50
Pathway to net zero emissions
Units: GtCO2
/yr
Natural gas use peaks
Battery pack cost  $100/kWh
No new oil  gas field
development
(OECD regions)
Europe energy
emissions reduce 67%
compared to 1990
N. America
manufacturing
reaches net zero
Solar PV eclipses wind
as the largest primary
energy source
6.9 GtCO2
per year negative emissions
via CCS and DAC and removal by land
use changes (reforestation etc.)
N. America and
Europe reach net
zero with DAC
CCS peaks at
5.2 GtCO2
EVs outnumber ICEVs
(passenger)
No new oil  gas field
development
(Rest of world)
China: emissions
50% of 2019
Europe: 50% new
vehicle sales EV
EVs outnumber
ICEVs (commercial)
on the road
New ICE passenger
vehicle sales banned
China, Europe, N. America
Solar PV becomes
biggest source of
electricity globally
Coal-fired power
stations banned
Hydrogen = 10%
energy demand, and
growing
Decoupling of economic activity and energy use must
intensify under the pathway to net zero (PNZ).
The population and the GDP in the various regions are
the same in the PNZ as in the ETO forecast, described in
Appendix A2 and A3 in the report. It would have been
possible to define a PNZ with another GDP, but we have
chosen not to do any changes.
Final energy demand in the PNZ, as illustrated in Figure
8.2 is 399 EJ in 2050, 9% less than today. Final energy
demand plateaus until 2035, thereafter declining.
Buildings and manufacturing both see flat energy
demand, while transport sector energy demand reduces
by a third by 2050. A more detailed description of PNZ
energy demand is given in Section 8.6.
Primary energy supply (Figure 8.3) in a PNZ future, slowly
reduces to around 95% of the present level to 2050. The
energy mix will change dramatically: fossil use reducing
from a 79% share today to 23% in 2050, implying a fossil
share decline of 2% per year.
In 2050, fossil-fuel use in PNZ has less than half the share
predicted in our ETO forecast. Still, a mid-century share
of 23% is considerable, and will be accompanied by
carbon capture for all major point-emission sources to
reach net zero emissions.
Fundamental to the PNZ is a massive ramping up of
variable renewable energy, with solar (31%) and wind
(20%) together constituting more than half the energy
mix, and strong growth also seen for biomass and
hydropower. Nuclear energy remains around current
levels to mid-century.
184
DNV Energy Transition Outlook 2022
185
Pathway to net zero emissions CHAPTER 8
PATHWAY
TO
NET
ZERO
EMISSIONS
8.3.1 Natural Gas
In the PNZ future, global gas demand will decline from
150 EJ today to 117 EJ by 2030 and 53 EJ by mid-century
— a 75% reduction. The power sector will remain the
primary consumer of gas, contributing 56 EJ to total
demand today, 46 EJ in 2030, and 15 EJ by 2050. Never-
theless, natural gas’ share in power generation will
decline from 35% today to 24% by 2050. Increasing
electrification of residential and commercial heating and
cooking will see the buildings sector’s share of gas
demand decline from 21% now to 8% (fifth position
among sectors) by 2050. As is the case with oil, non-energy
use of gas as a feedstock will climb, from a 9% share now
(fifth among demand sectors) to 16% (second) in 2050,
since feedstock use is a low source of emissions.
The energy sector’s own use of gas will decline slowly
from 20 EJ today to 11 EJ by 2050, while manufacturing
sector energy demand halves to 13 EJ by mid-century.
North America is currently the world’s leading producer
of natural gas, responsible for more than a quarter of
global production. It will concede this position to Middle
East and North Africa, due to their less-stringent climate
ambitions and lower extraction costs. By 2050, Middle
East and North Africa will dominate the natural gas
market, supplying close to half (47%) of global demand.
North East Eurasia will follow the fuel’s decline in use,
continuing to supply on average 22% of global gas over
the next three decades.
In the PNZ, the declining gas demand can be supplied
almost without new fields, and capacity additions are
therefore halted within this decade, before 2024 in OECD
regions, and from 2026–2028 elsewhere.
8.3.2 Oil
After the 2021/2022 rebound from the COVID-19
pandemic, global oil demand in the PNZ will grow from
around 159 EJ in 2022 to 161 EJ in 2024, before rapidly
declining 73% from that peak to reach 43 EJ in 2050. The
lion’s share of this remaining demand will be split almost
equally between the non-energy sector (45%), where oil
will continue to be used for producing petrochemicals
and plastics with no major associated emissions, and the
transport sector (43%). Within transport, the remaining
demand will be concentrated in the road sector in
lower-income regions (77% of total) and in the hard-to-
electrify aviation sector (22% of total). Nevertheless,
overall transport demand will fall 83% from 107 EJ in 2022
to 18 EJ in 2050. Non-energy demand will decline only
slightly, from 22 EJ to 20 EJ, resulting in its share in total
demand rising by over three times from 14% today to 45%
in 2050. A 9% share of oil demand by 2050 will be in
manufacturing, within subsectors such as construction,
mining, and cement.
The top three regions with the highest oil demand shares
in 2050 will be Middle East and North Africa (21%), the
Indian Subcontinent (20%), and Latin America (15%),
which together account for two thirds of global demand.
Middle East and North Africa is the largest oil-producing
region today, with a 37% share of total production. This
share will rise dramatically over the next three decades as
other major oil-producing regions (North America, North
East Eurasia, and Latin America, in order of importance)
see their production rapidly declining. By 2050, Middle
East and North Africa, where extraction and production
costs are lowest, is expected to completely dominate oil
production, with a 72% share.
8.3.3 Coal
Owing to its high emissions intensity, coal is the first
target of decarbonization policies. Global demand in the
PNZ will plummet 23% to 2030, and by 80% from current
levels by 2050. Representing 92 EJ and almost two thirds
of coal demand in 2020, the power sector will see a 11%
decrease in demand by 2030, 50% by 2040, and 100% by
2050 under a complete global phase-out on using coal in
electricity production.
While coal use in power generation has alternatives that
are competitive today and will increasingly be so in the
future, there are other sectors that are costly to abate. For
high-heat processes, coal's phase-out will therefore be
slow. Coal use will decrease by 20% to 2030 and 50% to
2050 compared with 2020 levels, for both industrial heat
and iron ore reduction. A strong decline of 84% over the
2020–2050 period will be observed for base materials. The
Indian Subcontinent and Greater China will see coal use
continue to rise for more than a decade to represent 70%
of global use in mid-century manufacturing.
In the PNZ, 1.4 billion tonnes of coal will still have to be
extracted in 2050, exclusively as hard coal almost solely
used in industry. The biggest regional producers —
mostly meeting domestic demand — will at that time be
Greater China (47% of global production), the Indian
Subcontinent (30%), Sub-Saharan Africa (10%) and North
East Eurasia (9%).
186
DNV Energy Transition Outlook 2022
187
Pathway to net zero emissions CHAPTER 8
PATHWAY
TO
NET
ZERO
EMISSIONS
8.3.4 Solar PV
In the PNZ by 2050, solar will account for 45% of all
grid-connected electricity to achieve net zero; a big leap
compared with the technology’s small ( 3%) share in
power generation in 2020. From 0.8 PWh per year in
2020, solar electricity grows seven-fold by 2030, 22-fold
by 2040, and 40-fold by 2050 (reaching 35 PWh per year).
Of the 35 PWh in 2050, comprehensive installations
combining solar PV with storage will have a 26% share,
with the rest being solar PV power plants on rooftops,
utility-scale installations, and other solutions where
storage is not co-located with the PV panels. In 2032,
solar PV will overtake gas-fired electricity to become the
largest source of electricity globally, a position it will hold
to 2050.
As shown in Figure 8.7, Greater China had the largest
share (30%) of solar PV electricity among regions in 2020,
but this reduces to 20% in 2050. The Indian Subcontinent’s
share grows from 7% in 2020 to match Greater China’s in
2050. From 2022 to 2030, South East Asia and Middle
East and North Africa will see the greatest regional
growth (27%) in solar PV electricity generation, albeit
starting from relatively low levels. In the decade to 2040,
Sub-Saharan Africa and the Indian Subcontinent will
catch up to Greater China, with respect to solar PV’s share
in each region’s electricity generation mix. The 2040s will
see slower growth of solar PV electricity generation in all
regions except both Sub-Saharan Africa and North East
Eurasia.
There will be a small amount (0.5 PWh per year) of off-grid
production, mainly in Sub-Saharan Africa and the Indian
Subcontinent, supplying electricity to rural districts for
lighting, mobile charging, and other smaller end uses.
As we describe in Chapter 9, such off-grid installations,
though marginal in energy terms, are extremely valuable
in a sustainable development perspective.
It is a massive task to grow solar PV at the speed envi-
sioned in the PNZ. Installed capacity is set to grow from
613 GW to 24 TW, 39-fold growth. Of this 24 TW, 15 TW
will be solar PV, with the rest being solar + storage.
Greater China dominates capacity additions in years up
to 2030, while the Indian subcontinent dwarfs Greater
China from 2030 until 2050 (Figure 8.8). Nevertheless,
Greater China has the largest grid-connected solar PV
capacity in the world by 2050.
By 2050, 5 TW of off-grid solar PV capacity dedicated to
hydrogen electrolysis will be installed in addition to all
the grid-connected solar capacity. Of these dedicated
solar PV capacities installed, one third will be in Greater
China, and a quarter will be in North America.
8.3.5 Wind
In the PNZ, electricity from wind will have to grow from
6% of the electricity generation in 2020 to 13% in 2030,
20% in 2040, and 29% in 2050. We consider three
categories of wind power plants: onshore wind, fixed
offshore wind, and floating offshore wind. Of these,
onshore wind power grows nine-fold from 2020 to 2050.
In comparison, fixed offshore, which starts from a much
lower base, increases its share in the electricity generation
mix from 0.41% in 2020 to 9% by 2050. Of the three,
floating offshore wind is the least mature and has the
lowest share in electricity generation (2.4%) in 2050.
Globally, by 2050, the power system capacity both
on-grid and off-grid will consist of 5.6 TW of onshore
wind, 2.9 TW of fixed offshore wind and 595 GW of
floating offshore wind.
The Greater China region is the world’s biggest generator
of wind power today and will remain so through to 2050,
when its share of installed grid-connected wind power
generating capacity will be 39% (Figure 8.9). Europe and
North America are second and third in 2050, respectively.
Capacity addition in these three leading regions trigger
steeper cost reductions for wind power, which also drives
significant wind generation development in other
regions including some not yet invested in wind power.
These other regions include South East Asia and OECD
Pacific. North East Eurasia will be an outlier, adding very
little wind-powered electricity generation.
A considerable amount of new wind power capacity will
need to be installed every year (Figure 8.10) to generate
these levels of power. On average, 122 GW per year of
new capacity becomes operational between 2020 and
2030, 197 GW between 2030 and 2040, and 388 GW
between 2040 and 2050 in the PNZ.
As illustrated in Figure 8.10, from 2020 to 2030, for every
GW of fixed offshore wind power, 3 GW of onshore wind
power plants are built on average. However, competition
for suitable land will increasingly impact onshore wind
costs, while offshore wind costs will decline rapidly. Thus,
regions such as North America and Greater China will
188
DNV Energy Transition Outlook 2022
189
Pathway to net zero emissions CHAPTER 8
PATHWAY
TO
NET
ZERO
EMISSIONS
start investing more in offshore wind power plants. From
2035 onwards, for every GW of fixed offshore wind power
plant, only 2 GW of onshore wind power plants are built
worldwide. After 2040, 38% of new power installations
will be offshore wind power plants. Such a massive
development in fixed offshore wind translates to higher
investments in new electricity grid lines, not least
undersea cables.
In addition to the grid-connected wind capacity
described above, about 2.3 TW of wind capacity will be
built for dedicated hydrogen production as off-grid
capacity between now and 2050. The majority of this
off-grid capacity will be in China, followed by Europe and
North America.
8.3.6 Other renewable
energy and nuclear
In the PNZ, bioenergy will have to assume increasingly
greaterimportance,giventhattherearenoeasyalternatives
for thermal power plants, which are crucial for regions
such as North East Eurasia and, in the medium term, in
the transport sector. Bioenergy in annual primary energy
supply increases from 57 EJ in 2020 to 81 EJ by 2050.
Hydropower also doubles between 2020 and 2050,
reaching 33 EJ in mid-century, driven by significant
growth in Greater China, Indian Subcontinent, and
Sub-Saharan Africa. We find that with our PNZ, the role of
nuclear stays at current levels. Large cost decreases for
solar and wind cause nuclear to play an ever-smaller role
amid growing electricity production. We see dramatic
nuclear power cost increases, both in construction,
build-out, and planning and waste disposal in Europe,
North America, and OECD Pacific. At the same time,
nuclear power plants are far from being a reliable energy
source as often claimed, with utilization rates lower than
50% in summer 2022 in several jurisdictions. Maintenance
issues, climate-induced lack of cooling water, and
supply-chain disruption are just some examples impacting
this development.
Bioenergy undergoes a sectoral shift to 2050 (Figure
8.12). In 2020, buildings was the largest demand sector
for bioenergy (51%). Due to electrification and hydrogen
use in buildings, this share drops to 27% by 2050.
In contrast, we see heat-only power plants and manu-
facturing increase their bioenergy use. In North America,
for example, 34% of bioenergy demand in 2050 is in the
manufacturing sector, at which time 38% of such demand
in North East Eurasia is from heat-only and power plants.
The absolute demand for bioenergy in the transport
sector will grow from 3.8 EJ in 2020 to 5.8 EJ in 2050.
This is in stark contrast to our forecast where the demand
doubles to 8 EJ by 2050: to achieve net zero, more
bioenergy needs to be used in hard-to-abate sectors like
aviation, manufacturing, and heat-only plants. Such use
in point-emission installations also make bioenergy with
carbon capture and storage (BECCS) possible, enabling
net negative sites. Bioenergy will be less important in
decarbonizing transport, where electrification is a better
solution to achieve net zero in road transport, and for
making ammonia and e-fuels to maritime transport.
8.3.7 Electricity
Grid-connected electricity supply grows to 78 PWh/yr in
2050. This is a three-fold increase from 2020, firmly
establishing electrification as a key pillar for reaching net
zero. This is 26% higher than our ETO forecast.
Phase-out of coal starts in some jurisdictions before
2030, with increased demand provided chiefly by solar
and wind (Figure 8.13). Solar electricity sees a 40-fold
increase from 2020 to 2050, while wind electricity
increases 14-fold over the same period. Solar and wind
would account for 74% of the electricity by 2050, which is
6% higher than our ETO forecast. In total, non-fossil
sources (renewables and nuclear) account for 90% of the
generation, with the remaining electricity being provided
by gas-fired power plants. This shows that despite the net
zero emission constraints, natural gas has staying power
in the electricity sector, providing 5% of power in 2050.
By then, almost as many gas-fired power plants run
instead on hydrogen, with a maximum volumetric
blending ratio of 80%.
Global electricity demand, including off-grid rural
demand and dedicated renewables demand for H2
electrolysis, will be 91 PWh per year in 2050, three times
what it was in 2020 (Figure 8.14). Moreover, the PNZ
electricity demand is 44% higher than the projected —
’most likely’ — demand.
The largest increase is in demand for power for electrolysis
to produce hydrogen. From very low levels in 2020,
electrolysis demand for power supplied through the grid
190
DNV Energy Transition Outlook 2022
191
Pathway to net zero emissions CHAPTER 8
PATHWAY
TO
NET
ZERO
EMISSIONS
or from dedicated off-grid renewables will be 28%
(25 PWh per year) of total demand in 2050.
The transport sector sees the next highest growth in
demand (27-fold) for electricity, where electrification of
vehicles is an important lever, especially in road transport.
Transport’s share in electricity demand grows from 2% in
2020 to 11% by 2050.
The off-grid rural solar capacity in the world is 236 GW in
2050, chiefly installed in Sub-Saharan Africa and the
Indian Subcontinent. Off-grid dedicated renewable
capacity for electrolysis grows from very small levels in
2020 to 7.2 TW by 2050, four times higher than what we
projected as most likely in previous chapters. Of this
dedicated renewable capacity, one third will be split
equally among offshore and onshore wind; and two
thirds will be solar-based electrolysis.
8.3.8 Hydrogen
Hydrogen is an integral part of net zero strategies being
developed by many countries and is urgently needed for
the decarbonization of hard-to-abate sectors. Our PNZ
accordingly, has hydrogen satisfying a far higher share of
final energy demand (14%) than in our ETO forecast (5%)
by 2050.
Figure 8.15 shows that one third of global hydrogen and
synthetic-fuel demand by 2050 is used for industrial
heating. By 2050, 23 EJ/yr of energy demand in manu-
facturing will be supplied by hydrogen, which represents
an 18% share of energy carriers used in manufacturing.
Road transportation will account for 18% of global
hydrogen demand, almost exclusively through long-haul
heavy road transport. By 2050, hydrogen will account for
16% of road transport’s energy demand, despite signifi-
cant subsidies assumed in our PNZ. This relatively small
share is the result of the competitiveness of battery-
electric propulsion in all segments of road transport.
The story is different in maritime transport, which will
account for 15% of global hydrogen demand by mid-
century. The absence of a significant battery-electric
option for most parts of maritime transport leaves
synthetic fuels, biofuels, ammonia, and hydrogen as
viable options for decarbonization leading to hydrogen
and its derivatives supplying 75% of the maritime fuel
mix by 2050 in our PNZ. Global aviation will also see a
significant share (40%) of hydrogen and its derivatives in
its fuel mix, accounting for 12% of global hydrogen
demand. As with maritime, a lack of battery-electric
alternatives leads to a higher share of hydrogen in any
conceivable net zero pathway.
Only 8% of global hydrogen demand will go to the
buildings sector. Strong electrification of buildings'
end uses such as space heating, water heating and
space cooling lowers the need for other fuels for
decarbonization.
Figure 8.16 shows the breakdown of global hydrogen
production by source, both for energy and non-energy
purposes. The share of non-carbon free hydrogen will be
less than 5% by 2050. By mid-century, the highest share
of hydrogen production will come from dedicated
off-grid capacities (46%), led by offshore wind, whilst
grid-based electrolysis will be responsible for 34% of the
hydrogen production by then. 15% will be supplied from
natural gas with CCS.
Global hydrogen production needs to significantly scale.
Electrolysis capacity for dedicated off-grid hydrogen
production will need to be 0.4 TW in 2030, 1.9 TW in
2040, and 3.8 TW by 2050, led by Greater China and
Europe. Grid-based electrolysis will need to follow this
capacity ramp-up with capacity at almost 2 TW by 2050.
Here, the development is led by North America and
Europe.
Total hydrogen production in 2050 at 525 Mt/year under
our PNZ compares with 280 Mt/year forecast by our ETO.
Hydrogen is an integral part of net zero
strategies being developed by many
countries and is urgently needed for the
decarbonization of hard-to-abate sectors.
192
DNV Energy Transition Outlook 2022
193
Pathway to net zero emissions CHAPTER 8
PATHWAY
TO
NET
ZERO
EMISSIONS
The PNZ is affordable in the sense that it represents a lower
share of global GDP than the present energy system.
(Figure 8.17). The challenge, however, is that overall costs
for our PNZ are higher than those associated with the ‘most
likely’ future in our ETO forecast. Those higher costs may
be used as an excuse for inaction. Yet a net zero future is
entirely affordable: in a world where GDP nearly doubles,
energy expenditures will reduce, implying that energy’s
share of global GDP can decline from 3.5% to 2.5%.
Diverting the energy expenditure
Many commentators assume that the transition to a net
zero future comes with an unassailable mountain of costs.
AsdetailedinChapter5,whatweconsiderasexpenditures
are the supplier-side costs of energy production and
transport. We monitor expenditures and not costs. The
difference is that capital costs are not amortized but are
carried when they are paid. This means that we over-
estimate costs in the PNZ compared with our ETO
forecast, as the former is more capital intensive
(Figure 8.17).
Figure 8.18 shows the breakdown of the differences
between our modelled futures. Fossil expenditures
will drop, driven by an 80% decline for upstream oil and
gas through to 2050. A global ban on new oil and gas
exploration and development by 2028 means that, after
that year, expenditures relate to the operation of the
remaining production fields.
The overall picture for power generation, which drives
non-fossil expenditures, is that costs shift from operating
expenses, dominated by the cost of fossil fuels, to capital
expenditures in renewable power and related installations.
Indeed, almost no fossil fuel-fired power investments will
be made from 2030, and the remaining costs will be for
operating and maintaining those that are still running until
their phase-out in the 2040s. The decline in fossil fuel-
related investment contrasts with higher expenditures in
low-carbon power generation. The increase in PNZ
electricity demand will lead to a near quadrupling of non-
fossil power expenditures to 2050, and total investments
of some USD 58trn over the next 30 years.
8.4 NET ZERO EXPENDITURES The rise is particularly important for solar PV and wind
power, as discussed more fully in Section 8.3. Together,
they will represent a little more than a third of global
energy expenditures in 2050, an almost eight-fold increase
compared with 2021.
The doublingof electricity production anddecentralization
of power generation,coupledwith a large amount of new
VRES capacity,necessarily leads to stronginvestment in
grids,totallingsome USD48trn over the next 30 years.Grid
expenditures will more than triple between 2021 and2050.
The cost of carbon capture
Not included in the modelled expenditures shown in
Figure 8.18 are the costs related to CCS and direct air
capture (DAC). CCS is unavoidable for process emissions
and abates the last remaining fossil-fuel combustion
emission. In the PNZ, it will account for an annual spend
reaching USD 23bn in 2030 and USD 273bn in 2050. DAC
is less efficient than CCS and even though CCS will capture
3.7 more CO2
, DAC will account for a higher annual spend,
reaching USD 751bn in 2050. Together CCS and DAC
spending will represent 0.3% of global GDP in 2050.
An unequal regional transition
Phasing-out fossil fuels and replacing them with non-fossil
alternatives on a short timescale will also mean that there
will beshiftsinregionalexpenditures.Fossil-fuelproducing
regions are currently energy exporters and will see their
expenditures dropping compared with those in our ETO
forecast (-50% for North East Eurasia, for example). Other
regions installing large renewables capacity will see their
expenditures increasing (+100% for Europe).
A related issue is the distribution of the higher costs. As
shown in Figure 8.19, the impact on household energy
expenditures will depend on the region. Front-runner
regions in the energy transition (e.g. Europe and OECD
Pacific) will actually see a decrease in such expenditures
compared with in our ‘most likely’ future. This is because
they are already seeing and will increasingly benefit, even
before 2040, from the global acceleration in cost-learning
curves for low and zero-carbon technologies. The faster
declining costs will give an additional boost to these
front-running regions in our PNZ. However, other regions,
often low-income, will see upfront costs remain higher
until after the modelled period. Even if the difference
between the two futures declines with time, the transition
period will be economically and politically sensitive,
highlighting that wealth transfer from high- to low-income
regions is an integral part of the presented pathway.
194
DNV Energy Transition Outlook 2022
195
Pathway to net zero emissions CHAPTER 8
PATHWAY
TO
NET
ZERO
EMISSIONS
In addition to energy- and process-based emissions
there are significant CO2
emissions from agriculture,
forestry and other land use (AFOLU). The historical levels
of these emissions have recently been amended (Global
Carbon Project, 2022) to 3.2 Gt today. To reach net zero
and limit a large overshoot of the carbon budget, these
emissions need to decline quickly. By 2050 emissions
from AFOLU need to remove 1.1 Gt of CO2
to balance out
remaining emissions from remaining energy and process
emissions. A net zero future requires a reversal of today's
land use practices, in other words, deforestation is halted
and significant effort is put into restoration, reforestation
and regrowth of biomass. The PNZ sees an increase in
annual capture of 1.1 Gt, growing post-2050 to remove up
to 3 Gt annually by 2100.
The cumulative CO2
emissions from energy, processes,
and land use overshoot the 1.5°C carbon budget by 300
GtCO2
by 2050. Therefore, land use, as well as other
negative emissions technologies (e.g. direct air capture),
must contribute well beyond 2050 and continue to
remove CO2
from the atmosphere to ensure stabilization
at 1.5°C. By 2050, the remaining annual emissions from
energy and industrial processes after DAC are 1.1 GtCO2
;
this means that land-use emissions must decrease from
today’s level, reach negative -1.1 GtCO2
in 2050, and then,
together with other CO2
reduction measures, continue to
remove CO2
emissions for the remaining part of the
century. Assuming a continued scaling up of DAC, as well
as further improvements in land use after 2050, the PNZ
requires total negative emissions of -6.9 GtCO2
/yr from
2080, and then continue towards 2100. Cumulatively
from 2050, this amounts to -300 GtCO2
, eliminating the
1.5°C carbon overshoot by 2100.
Methane emissions
Methane (CH4
) emissions from fossil-fuels, i.e. coal, oil,
and natural gas, reduces to 23 Mt/yr by 2050, a reduction
to one fifth of the 2020 levels in the PNZ. Figure 8.22
presents the CH4
emissions from fossil-fuels for both the
ETO and PNZ. Compared with those in the ETO forecast,
the CH4
emissions in PNZ are 57% lower in 2050.
In our PNZ, in 2023, CH4
emissions are marginally higher
than the ETO forecast. This is because of the transition
away from coal to natural gas in this year, brought on by
phase-out policy measures for coal in the demand
sectors reducing the production of coal while increasing
production levels in natural gas, as well as higher carbon
prices in all regions in the PNZ, when compared to the
ETO forecast.
CO2
emissions
The pathway to net zero emissions is produced as a back
cast so that global CO2
emissions in 2050 reach net zero
from 2020 emissions of 38 Gt CO2
. This number includes
CO2
from the energy system as well as process-related
emissions, such as during production of cement, and the
effects of land-use changes. Our ETO forecast projects
22.2 Gt CO2
emissions in 2050, which needs to be
reduced through interventions and policy measures,
such as those described in Section 8.2 on net zero
policies.
As illustrated in Figure 8.20, the sector with the largest
emissions in the PNZ future by 2050 is the transport
sector, even though the sector reduces almost 80% of its
emissions, from 7.4 Gt today to 1.6 Gt in 2050. The
transport sector uses most of the world’s unabated oil
since carbon capture is challenging. Continued use of
fossil-fuelled vehicles in road transport in the low-income
regions, and in aviation, make up the bigger share of the
remaining 2050 transport emissions.
Today, electricity generation is the sector with the largest
emissions, but is quickly transforming in the PNZ to
reduce emissions through increased renewable and CCS
on remaining emissions. By 2050 the remaining power
plants will need CCS and many of them run on bioenergy
and thus our pathway expects -750 Mn t CO2
to be
captured through BECCS technology.
Today, 42% of energy-related emissions come from coal,
30% from oil, 26% from gas, and 2% from non-renewable
bioenergy. By 2050, the pathway has 63% from oil, 26%
from gas, 10% from coal, and a net removal from bio-
energy sources. The development of emissions is well
correlated with future energy use from fossil-fuel carriers,
but CCS also plays a decisive role. Coal and oil use falls
rapidly in our PNZ, while gas has a more moderate
decline. Capture rates are higher for coal and gas, where
much of the CO2
is emitted at large point sources
compared with oil, with its typically small point sources.
The PNZ sees coal emissions reducing by 98%, gas
emissions by 92% and oil emissions by 82% to mid-
century (Figure 8.21).
8.5 CO2
AND METHANE EMISSIONS
196
DNV Energy Transition Outlook 2022
197
Pathway to net zero emissions CHAPTER 8
PATHWAY
TO
NET
ZERO
EMISSIONS
While natural gas has a lower carbon intensity than coal,
natural gas has a much higher CH4
emission intensity than
coal. For example, the highest CH4
emission intensity for
coal is in North East Eurasia and it is about 7.5 kilotonnes
(0.0075 million tonnes) of CH4
per million tonne of coal
produced in 2020. On the other hand, the average CH4
emission intensity of natural gas production in 2020 was
20 kilotonnes per million tonne of natural gas produced,
or 2.5 times the CH4
emission intensity of coal production.
Nevertheless, the before-mentioned increase in the PNZ
is temporary, and from 2024 there is a drastic reduction of
CH4
emissions from fossil-fuels, brought on by phasing
out coal, and to a lesser degree natural gas from the
energy system.
The abatement in CH4
emissions in our PNZ is the result of
three effects, namely the carbon prices, the reduction in
activitylevels(productionoffossilfuels),and theinteraction
between the two. The carbon price of CH4
is calculated as
a unit of CH4
being converted to its CH4
equivalent using
100-year Global Warming Potential (GWP) time horizon.
Thus calculated CH4
equivalent carbon prices for CH4
are
compared against the marginal cost of CH4
abatement.
The CH4
abatement measures in the oil and gas sector
included are: upstream and downstream leak detection
and repair, blowdown capture and use of recovered gas
with vapour recovery units, replacing pressurized gas
pumps and controllers with electric air systems, and
finally capping unused oil and gas wells, among others.
The CH4
abatement measures in coal mining include
pre-mining degasification, air methane oxidation with
improved ventilation and flooding abandoned mines
(IEA, 2021c).
Outside the energy system and land-use
Among GHG emissions caused by human activity, 75%
stem from the energy system (WRI, 2022b). For the 25%
of emissions that do not originate from the energy
system, 15% comes from AFOLU and most of the rest
from waste and industrial processes. The energy system
is the main focus of our pathway to net zero, and, as
explained in the previous section, we have also detailed
CO2
emissions from the AFOLU sector to obtain a
more-complete net zero scenario, including all major CO2
emissions.
Non-CO2
GHG emissions outside the energy system are
indirectly accounted for in our PNZ. It is well established
that representative pathways to 1.5°C are close to net
zero CO2
emissions in 2050 (IPCC, 2021).
However, the total sum of GHGs ultimately determines
the global average temperature increase, and thus leads
to some logical implications:
— A more aggressive reduction of GHGs in other sectors,
would provide slightly more leeway in the energy
sector, and still enable reaching 1.5°C.
— If less action on reducing emissions in the other
sectors, achieving 1.5°C will require cutting emissions
even faster and more severely in the energy sector.
It is beyond the scope of this report to describe how CH4
and N2
O agricultural emissions or emissions from waste
and landfill should be reduced; for example, through a
shift in dietary choices. Nevertheless, we assume a
reduction in these non-CO2
emissions in line with IPCC
representative pathways for 1.5°C. It is, however, clear
that reaching 1.5°C is extremely difficult, and to reach this
goal all sectors, both within and outside the energy
system, need to act together and with urgency.
Methane molecules
198
DNV Energy Transition Outlook 2022
199
Pathway to net zero emissions CHAPTER 8
PATHWAY
TO
NET
ZERO
EMISSIONS
PNZ — Policy levers
— Fossil-fuelled vehicles will be subject to much stricter
fuel economy standards than currently implemented
to reduce their fuel use to a minimum.
— North East Eurasia and Latin America, both have high
shares of natural gas-driven vehicles today and their
pro-gas policies will continue.
— Additional taxes on gasoline and diesel will accelerate
the uptake of BEVs. Taxation levels increase by
between +75% (Sub-Saharan Africa) and +200%
(North East Eurasia and Middle East and North Africa)
compared with current levels.
— New sales of fossil-fuelled vehicles will eventually be
banned in all regions except Sub-Saharan Africa.
OECD regions and Greater China will impose a phased
ban on fossil-fuelled passenger vehicles from 2030
onwards, with other regions following. The sales
prohibition will be extended to commercial vehicles
just a few years after passenger ICE vehicle sales are
stopped. But we foresee no ‘cash-for-clunkers'
programme.
— The purchase of EVs will be further supported by
governments and manufacturers with direct and
indirect purchase-price reductions in the next few
years, supported by quotas for EV shares in manu-
facturers’ fleets.
Investments
EV sales are already subsidized in many regions. Reduced
toll roads and parking fees are also frequently used to
incentivize EV uptake, and other financial and user
incentives will intensify in a net zero scenario. These
support measures come with significant fiscal costs. In
contrast, fossil-fuel subsidies — used in many regions —
will decline, relieving governmental budgets.
From its peak in 2025, PNZ energy demand
from global road transport declines 45%
by 2050.
8.6.1 Road transport
From its peak in 2025, PNZ energy demand from global
road transport declines 45% by 2050. We assume no
change in transport modality and so the number of
vehicles is not reduced compared with our ETO forecast's
‘most likely’ future, and thus grows from 2.2bn today to
3.6bn in 2050. However, the strong decline in fuel use in
PNZ results from a new fuel mix — compared with the
‘most likely’ future, oil use falls 66%, while use of both
electricity (+27%) and hydrogen (+50%) grows.
Technologies
The basic technologies used to achieve this pathway
already exist. For passenger vehicles, the main tool to
reduce emissions is replacement of ICEs by BEVs. Once
manufactured, EVs are about three times more efficient
than ICEs. Moreover, EVs become progressively less
emissions-intensive with ever-more renewables in the
power mix. New EV models are proliferating, driving
further improvements in vehicle performance measures
such as range. This applies also to commercial EVs.
Average charging speed will benefit from improved
lithium-ion battery configurations and solid-state
batteries, needed for heavy commercial vehicles with
battery sizes exceeding 400 kWh. At the same time, the
availability and average charging speed of charging
stations will follow the development of battery charging
speed.
Fuel-cell electric vehicle (FCEV) technology is likely to
prevail only in long-haul trucking, whereas the advantages
of electric propulsion will edge out both fossil fuel and
hydrogen in passenger vehicles as well as in short- to
medium-haul trucking.
Some fossil fuel-propelled road transport will remain.
However, conditions for ICE manufacturers are likely to
be very tough: ever tighter fuel economy standards will
require very large investments in engine efficiency
improvements concurrent with ICE sales declining.
8.6 SECTORAL ROADMAPS
200
DNV Energy Transition Outlook 2022
201
Pathway to net zero emissions CHAPTER 8
PATHWAY
TO
NET
ZERO
EMISSIONS
income regions from around 2040. As for most synthetic
fuels, the efficiencies in the entire production process are
low, but lack of alternatives still make the developments
likely.
PNZ — Policy levers
— Increasing fees and taxes, and more costly fuels, make
airfares expensive, and effective in limiting growth in
the number of flights. Flying can be perceived as a
luxury and restricting the number of flights per person
is a possible auxiliary policy.
— Mandates on fuel targets and blend-in drive decar-
bonization of the fuel mix. In the foreseeable future,
oil-based aviation fuel will remain cheaper than
alternative fuels and technologies, including
biomass-derived or electricity-based sustainable
aviation fuels, pure hydrogen, or batteries. Conse-
quently, fuel blending mandates will be the main
policy tool enforcing uptake of low-carbon fuels in a
PNZ future, and we have applied the following
scale-up, depending on region and length of flight.
— North America and Europe: gradual scale-up to
15% SAF blended into aviation kerosene in 2030,
40% in 2040, and 75% in 2050
— OECD Pacific and Greater China: scale-up of SAF
blend-in, at about 75% of the level in North America
and Europe
— Latin America, North East Eurasia, Middle East and
North Africa, South East Asia, Indian Subcontinent:
scale-up of SAF blend-in, at about 50% of the level
in North America and Europe
— Sub-Saharan Africa: scale-up of SAF blend-in, at
about 25% of the level in North America and Europe
— Flights between leading and lagging regions will
follow the leading region’s uptake
— Technology mandates for electric short-haul flights
are likely and have been applied up to 80% for short-
haul flights by 2050 in leading regions.
— Energy-efficiency improvements, in addition to fuel
blending mandates and taxation, are expected to
continue, but more as a factor of cost reduction than
policy, as elaborated below.
Investments
In our ETO forecast we already included a quite significant
SAF share. This comes with additional costs; and we
believe the aviation subsector can finance this through
higher airfares, enabled by a willingness to pay for
sustainable solutions like SAF, both by companies and
individuals that want to reduce carbon footprints. In PNZ,
the further enforcement of fuel blending mandates
comes with additional costs. However, more expensive
flights, potentially paired with behavioural measures
discouraging unnecessary air travel, will reduce the
number of flights. The absolute investment for society in
aviation is therefore lower rather than higher in this PNZ
compared with in the ETO forecast.
8.6.2 Aviation
In our PNZ, global aviation will see modest growth
compared with our ETO forecast, with the number of
passenger flights increasing globally from 4.6bn in 2019
to 7.7bn in 2050. Due to the introduction of decarbonized
fuels, emissions from the subsector decline 68% between
pre-covid 2019 numbers and 2050, when they will be 340
MtCO2
per year.
Technologies
Aviation is a hard-to-abate sector with opportunities for
electrification limited to short-haul flights, representing
only a small fraction of aviation fuel use. Decarbonization
therefore needs to focus on the decarbonization of the
fuel itself. Efficiency, as measured in energy use per
passenger-km, will continue to improve due to better
engine technology, improved aircraft design, larger
planes, and better flightpath logistics. Annual efficiency
improvements will, however, decrease from 1.9% per year
today to 1.2% in 2050. Deployment of electric aircraft is
likely to start before 2030 for very small, short-haul
planes, and in the 2030s for slightly larger short-haul
planes in leading regions. Batteries have very low energy
density, and only hybrid-electric solutions are relevant for
medium- and long-haul. Since only a minor part of
aviation fuel is consumed on short-haul flights, electricity
will represent only 3% of the aviation fuel mix in 2050.
The aviation industry has started to direct extensive
research into hydrogen as a future aviation fuel, with early
indications pointing to hydrogen being most promising
for medium-haul aircraft. There are technology, cost, and
regulatory challenges aplenty, and realistically, we will
see hydrogen-powered airplanes starting at small scale
around 2040 in a first few regions, with limited wider
uptake before mid-century.
Sustainable aviation fuel (SAF) can replace the existing
kerosene with relatively little adjustment of fuel tanks and
engines (depending on blending ratio). In the short and
medium term, SAF is likely to consist mainly of biofuels
produced from feedstocks such as used cooking oil,
municipal solid waste, grassy crops and algae, and
through conversion technologies such as hydroprocessed
esters and fatty acids synthetic paraffinic kerosene
(HEFA-SPK), Fischer–Tropsch, pyrolysis, and alcohol to jet.
In the longer term, other SAF solutions will be developed,
and liquid synthetic fuel originating from hydrogen is
likely to represent more than half of the SAF in the high-
202
DNV Energy Transition Outlook 2022
203
Pathway to net zero emissions CHAPTER 8
PATHWAY
TO
NET
ZERO
EMISSIONS
8.6.3 Maritime
Technologies
Currently, the world fleet is mostly powered by diesel
engines running on marine fuel oils. Decarbonizing
shipping by 2050 will require higher energy efficiency
and improved logistics. It will also need a different fuel
mix including new fuels derived from low-carbon
sources, irrespective of energy-efficiency improvements
that are implemented. There has been an increase in the
uptake of alternative fuel technologies in ships. One
sixteenth (6%) of ships on order in May 2019 were
designed to be able to run on alternative fuels, a share
that had risen to nearly 12% in June 2021. Except for the
electrification underway in the short-haul and ferry
segment, the alternative fuels are currently still mainly
fossil-based, dominated by liquefied natural gas (LNG).
All ships will probably not transition to the same fuel in
the longer term. Our PNZ has a diverse future energy mix
comprising both fossil and low-carbon fuels, where fossil
fuels are gradually phased out. The fuel mix includes
fossil marine fuel oils; LNG and liquefied petroleum gas
(LPG); electro-based hydrogen, ammonia, and LPG;
bio- and electro-based methanol, LNG, and marine
gasoil (MGO); and last but definitely not least, biofuels in
various blends or as single fuel. Key onboard technologies
for using hydrogen and ammonia will be available in four
to eight years, while other technologies are already
available. While in a PNZ future we expect that the
combustion engine will continue to be the dominant
energy converter in the fleet, future integration of marine
fuel cells in power systems has potential to provide
greater efficiency and thereby lower fuel consumption.
The technical applicability and commercial viability of
alternative fuels will vary greatly for different ship types
and trades. Deep-sea vessels have fewer options
compared with the short-sea segment. For the latter, the
shorter distances and highly variable power demands
often make electric or hybrid-electric power and propul-
sion systems more efficient than traditional mechanical
drives. For the deep-sea segment, most of the energy
consumption relates to propulsion at steady speed over
longdistances,whichfavoursenergy-efficientmechanical,
direct- or geared-driven, two-stroke combustion
engines. The ships require fuel that is globally available,
and the fuel energy-density is important to maximize the
space available for the transport of cargo over long
distances. The future fuel and technology shifts in a PNZ
future must go together with greater energy efficiency of
ships, requiring intensified uptake of both technical and
operational energy-efficiency measures. Abatement
measures such as wind powering, air lubrication systems,
and various hull and machinery measures, are now
emerging. The drive for decarbonization in global
industrial value chains will also drive logistics optimization
including measures such as increased fleet utilization and
speed reductions – facilitated by digitalization.
PNZ — Policy levers
Three fundamental key drivers will push decarbonization
in shipping in the coming decade:
— Regulations and policies
— Access to investors and capital
— Cargo owner and consumer expectations
A clear and long-term predictable regulatory framework
for emissionreductions willbe the key driver for technology
development and investments in deployment of
carbon-neutral fuels and solutions. Initial policies need to
focus on lowering critical barriers. These include technical
maturity and feasibility of onboard technology, including
safety and rules, as well as barriers related to
market demand. In light of fuel-switching ambitions, it is
vital to ensure that demand for low- and zero-carbon
fuels can be met, which is also partially influenced by
governmental strategies and policies. Organizational
barriers such as managerial practices, legal constraints,
and lack of information, will also form substantial obsta-
cles to implementation of carbon-neutral fuels. When the
main technical and organizational barriers are removed,
the solutions need to be implemented in the fleet,
leading to large-scale uptake of carbon-neutral fuels.
This requires massive investment, especially in infra-
structure related to production and distribution of
carbon-neutral fuels and onboard engine and fuel
systems.
Enforceable regulations will play an important role in
mandating the uptake and creating incentives for
investing in production and infrastructure. This could, for
example, be through technical or operational require-
ments on GHG emissions, or a carbon price ensuring a
level playing field for ships that run on more expensive
carbon-neutral fuels.
Investments
For the PNZ, we estimate that the total onboard investment
cost for the period up to 2050 will be in the range USD
200–450bn, depending on whether the future fuels can
be used on existing fuel systems and machinery. In
addition, the energy transition in shipping will require
major investment in infrastructure and production
capacity for supply of carbon-neutral fuels. The onshore
investment costs and the higher cost of producing
zero-carbon or carbon-neutral fuels will lead to significant
higher fuel costs for ships.
204
DNV Energy Transition Outlook 2022
205
Pathway to net zero emissions CHAPTER 8
PATHWAY
TO
NET
ZERO
EMISSIONS
8.6.4 Buildings heating
The building space and water heating subsector can
electrify, but it is challenging. By 2050 in the net zero
future, the annual total CO2
emissions from buildings
heating is 0.2 Gt (Figure 8.30). In our PNZ, we see an
emissions reduction of 95% between 2020 and 2050
in buildings heating, and energy use 23% lower in mid-
century, compared with our ETO forecast. Such a drastic
reduction in energy use is only possible through the dual
catalysation of energy efficiency and electrification to
drive decarbonization.
Electricity’s share in buildings heating is 36% in 2050 in
our PNZ, and 21% in the ETO forecast's 'most likely' future
(Figure 8.29). Additionally, hydrogen in the form of both
direct use and blended with natural gas, has a share of
26% in final energy demand for buildings heating in 2050
in PNZ.
North America, Europe, and OECD Pacific all achieve
negative emissions in buildings heating by 2049, due to
their electricity sectors achieving negative emissions
due to BECCS. These power sector emissions are then
allocated to buildings heating based on its share in
electricity demand. North East Eurasia will have the
highest emissions (83 MtCO2
) from buildings heating
in 2050. That is 45% of total emissions from the entire
buildings sector in mid-century, due to the presence of
direct natural gas boilers and natural gas-generated
direct heat.
Technologies
The technologies for achieving net zero emissions in
buildings heating already exist. It is the rates at which
such technologies are taken up in the various world
regions that make all the difference in terms of emissions
reduction. Examples include:
Electrification of buildings heating with both conven-
tional electric heaters and heat pumps. Technological
leapfrogging to electric heating in regions such as
Sub-Saharan Africa and Indian Subcontinent, where
electricity rather than coal, oil, or natural gas replaces
conventional biomass use. This is possible due to faster
technology transfer to these regions from OECD regions.
Hydrogen is used directly and blended with natural gas
for buildings heating in Europe, North America and the
OECD Pacific, in tandem with electrification.
Energy-efficiency improvements such as innovative
building materials and thermal envelopes reduce the
specific heating demand. This is not just technology
dependent; uptake of these options can be nudged by
lower specific heating demand requirements through
policy, such as regulations on maximum possible specific
heating demand in multifamily housing buildings in
Europe.
PNZ — Policy levers
The policies in our PNZ consist of three broad categories:
mandates,costofcapital,andenergy-efficiency standards.
The policy adjustments listed below should not be
considered in isolation, but rather in tandem with the
available technologies:
Regulation prohibiting fossil-based heating with a partial
ban, translating to a limited and regionally differentiated
percentage of new buildings allowed to use fossil fuels:
— In North America, Europe, Greater China and OECD
Pacific, fossil-fuel heating is constrained to 50% of new
buildings in 2050; elsewhere, only 75% may be heated
this way.
— The lifetime of fossil-fuel heating equipment is halved
from 15 years to 7.5 years, also enabling faster phase-
out of fossil-fuel equipment and hence phase-in of
electrification of buildings heating. Such a halving also
has the effect of increasing the levelized cost of heat
provided by fossil-fuel equipment. Coupled with
leapfrogging (mentioned in the previous Technologies
subsection), this has the effect of low-income regions
such as Sub-Saharan Africa and the Indian Subcontinent
effectivelyelectrifyingbuildingsheatingtoalargeextent.
Higher cost of capital for fossil-fuel boilers in commercial
buildings:
— Investors in commercial building projects will find it
hard to secure funding for buildings heated with fossil
fuels. Oil and natural gas boilers have a cost of capital
of 17%, except in Middle East and North Africa and
North East Eurasia, where it is 11%. Coal-fired boilers
have a cost of capital of 20% in 2050. In contrast, cost
of capital of electric and renewables equipment
decreases from 7% in 2022 to 6% in 2025 and thereafter.
Higher energy-efficiency standards for existing and new
buildings leading to lower specific heating demand:
— The specific space heating demand of buildings in
North America, Europe, and OECD Pacific reduces
0.8% per year on average from 2020, or by 1% per year
in Greater China. The rest of the world sees a reduction
of 1.2% per year on average. Additionally, fossil-fuel
subsidies for buildings heating in Middle East and North
Africa and OECD Pacific are removed from 2022.
Investments
The pathway to achieve net zero emissions in buildings
heating requires enormous private and public investment
in the manufacturing value chain for heating equipment.
Joint ventures between private entities from OECD
regions and public entities in low-income regions are
needed, especially given the massive amount of new
floor space expected in the coming decades due to the
restructuring of the economy in these regions. Indirectly,
electrification of buildings heating will also lead to
investment in strengthening electric grid infrastructure,
including in countries that currently do not have reliable
grid connections.
206
DNV Energy Transition Outlook 2022
207
Pathway to net zero emissions CHAPTER 8
PATHWAY
TO
NET
ZERO
EMISSIONS
8.6.5 Iron and steel
In our PNZ, global steel production is expected to start
declining within this decade thanks to material efficiency
and recycling measures. By 2050, the vast majority of
steel will be produced in electric arc furnaces. As a result
of these and other measures, the PNZ sees an emissions
reduction of 94% and a slight increase in energy
consumption of 2% between 2021 and 2050 in iron and
steel production.
Due to the high use of coal, the CO2
intensity of iron and
steel production is currently significant, with each tonne
of crude steel produced resulting in 1.4 tCO2
of direct
emissions, or 2.0 tCO2
if indirect electricity and heat
emissions are included. Iron and steel accounted for 23%
of emissions from manufacturing energy use in 2021.
Around 40% of energy demand in iron and steelmaking
comes from the reduction of iron ore, a process currently
relying predominantly on coal used in blast furnaces.
Major barriers to lowering emissions include the high
share of coal in the sector’s energy inputs; the long
lifetime of incumbent assets; and the typically low
margins in a mature, competitive, and commoditized
market. Furthermore, many technologies that are
essential in a net zero pathway – such as rail infrastructure,
wind turbines, and CCS equipment – require large
amounts of steel.
As a result of material efficiency and recycling measures,
steel demand and production are expected to start to
gradually decrease within this decade in our PNZ.
Technologies
The technologies required for decarbonizing iron and
steel production are already available. These mainly
include the already widely used scrap-based electric arc
furnace (EAF) for steel production, and the promising
direct reduction method. The latter involves the solid-state
reduction of iron oxide into iron, where pre-heated iron
ore is converted into direct reduced iron (DRI) with
hydrogen acting as the reducing agent and energy
source. The DRI can then be fed directly into an EAF to
produce steel.
Low-carbon direct reduction can be either hydrogen-
based or natural gas-based with CCS. These two similar
technologies are currently either not economically viable
due to the high costs and/or low availability of feedstock
(e.g. in the case of green hydrogen-based DRI). The direct
reduction can also be designed to operate with methane,
hydrogen, or a mixture of these gases as the reducing
agent. Therefore, blending of hydrogen into natural gas
is seen as a transition strategy before there is technological
readiness for pure hydrogen use.
In summary, the technical solutions needed to decarbo-
nize iron and steel exist. The main barriers to be overcome
in our PNZ are economic (competing with existing
fossil-based basic oxygen furnace technology) and
policy-related.
PNZ — Policy levers
— Carbon pricing is the most important policy for the
commercialization and scaling up of low-carbon iron
and steel production. Sufficiently high pricing of
carbon emissions, internalizing the cost of negative
externalities, is needed for low-carbon technologies to
make sense commercially.
— Recycling policy enables a faster transition to steel
production via EAF. In our PNZ, by 2050, all steel
production in the OECD and 90% of production in
other regions is assumed to be via EAF, and the steel
recycling rate climbs to 95% globally.
— Incentives for fuel shifts and CCS. The DRI-EAF
technology relies on natural gas or hydrogen for direct
reduction of iron, and fuel switching to hydrogen will
benefit from 5% to 25% lower hydrogen prices. These
price reductions result from energy taxation and
significantly faster expansion of global hydrogen
production capacity also, supported by higher
hydrogen uptake in other demand sectors. Further-
more, successful decarbonization of natural gas-based
DRI will be dependent on support for the scaling up of
CCS technologies.
— Substantial regionalized capital expenditure support
of between 35% to 50% is required in the PNZ for
hydrogen and electricity use in iron ore reduction,
aimed at minimizing the use of coal.
— Further PNZ assumptions towards reducing emissions
include a gradual decrease in the steel intensity of new
buildings(20%lowerby2050)andafasterimprovement
(1.2% per year compared with 1% per year in the ETO
forecast) of energy intensity in steel production itself.
The decarbonization routes outlined above are
consistent with those outlined by the Energy Transitions
Commission (ETC, 2020) and the International Energy
Agency (IEA, 2020).
Investments
The added value of the global steel industry is around
USD 500bn (World Steel, 2019). Low-carbon steel
production is around 10–50% more expensive than the
fossil-based counterparts, with uncertain future CAPEX
and OPEX costs and future energy costs highly sensitive
to the cost of natural gas and electricity (IEA, 2020).
Assuming that the cost difference of innovative techno-
logies would be at the lower end (10%) by 2050, this
would translate to an additional annual cost of around
USD 35bn for the global steel industry.
Currently, sustainability certification initiatives such as
Responsible Steel, and industry associations that make
public commitments to procure 100% net zero steel by
2050, are paving the way towards steel decarbonization
in pioneering countries. In the PNZ, we envision invest-
ment in infrastructure for sustainable steel and for EAF
capacities to ramp up faster beyond the OECD regions in
which they currently exist. Similarly, to achieve high
recycling rates, the infrastructure for collection and
processing will need to be embedded in low-income
regions.
208
DNV Energy Transition Outlook 2022
209
Pathway to net zero emissions CHAPTER 8
PATHWAY
TO
NET
ZERO
EMISSIONS
8.6.6 Cement
Although controversial and energy-intensive, cement’s
unique properties make it unlikely to be replaced in the
coming decades, even in our pathway to net zero. Massive
deployment of CCS and a new material composition will
be required in a PNZ future to decrease the annual CO2
emissions from 2.6 Gt today to 0.4 Gt in 2050.
Technologies
Reaching 4.1 billion tonnes in 2019, cement production
accounted for around 7% of global CO2
emissions. While
production will only decrease by 13% from 2020 to 2050,
emission intensity will need to decrease 10% by 2030 and
83% by 2050 in our PNZ. Clinker, the main component of
cement, is the most energy-intensive and carbon-emitting
component of cement production, for two reasons:
— Combustion-related emissions from energy use (1.0
GtCO2
in 2020), where the high-heat process around
1500°C in clinker production predominantly relies on
high carbon-emitting fossil fuels such as coal and pet
coke and has limited electrification potential.
— Process-related emissions (1.6 GtCO2
in 2020), where
the use of carbonated minerals (mostly limestone) as a
raw material releases CO2
as part of the production
process.
Our PNZ sees three main decarbonization routes:
CCS is the main and most effective abatement solution,
because of unavoidable process emissions, and will
capture 76% of direct emissions by 2050. Technology
remains in an early phase of deployment, with only a
handful of projects being announced for the moment. A
serious ramp-up will be necessary to unleash the snow-
ball effect of technology cost learning to achieve its full
potential.
Fuel switching is challenging given compatibility limi-
tations with the dry kiln. Coal will remain the main heat
source for clinker production, though hydrogen will have
an important role. Hydrogen will cover 12% of PNZ
energy demand, being used mainly in Europe, Middle
East and Northern Africa, and OECD Pacific. Waste
co-processing (plastics, tyres, etc.) will also continue to
grow, as it diverts waste from landfill or incineration, and
is a source of income for the industry.
Improvements in energy intensity of cement will be
made through lowering the clinker-to-cement ratio and
the use of alternative materials for clinker or cement,
which simultaneously impact process emissions intensity,
reducing it by a seventh (14%) to 0.60 in 2050.
Minor gains are expected from reusing concrete
because, unlike other raw materials, there is currently no
viable technology to perform cradle-to-cradle recycling
for cement. Although a lot has already been achieved by
phasing-out older technologies, such as wet kilns, a
further 10% gain in energy-efficiency is assumed in the
PNZ. Current cement installations are quite young,
especially in developing regions, and have a long
lifespan: most of 2050 production will be performed in
plants that already exist, and where retrofitting will be the
favourable abatement option.
A future potential abatement solution is the impact of
recarbonation. This is a natural process in which finely
ground concrete partly reabsorbs the atmospheric CO2
released during production. It could significantly reduce
the overall process emissions, but the potential requires
further study and has not been assessed in the PNZ.
PNZ — Policy levers
Decarbonization of cement with high reliance on CCS will
not be cost-competitive without policy measures nudging
emissions reduction and implementation of solutions.
— Carbon pricing is the strongest policy mechanisms in
our PNZ. The effect is observable today in the Europe
region, where carbon prices are high enough to
increase the share of alternative fuels. To prevent
traditionally local cement production from moving to
low-cost regions,we expect that carbon price disparities
will be handled through implementing carbon-border
adjustment mechanisms that reduce the risk of carbon
leakage. This is specifically relevant for cement, being
a low value-added product generating 6.9 kgCO2
/USD
revenue, far above steel’s 1.4 kgCO2
/USD (McKinsey,
2020).
— Increased taxation on fossil fuels triggers fuel switching
away from coal and boosts the use of less energy-
intensive cement.
— Regulation and government promotion supports new
and alternative materials, enforces public procurement
for low-carbon cement, and eases regulation on cement
composition for different use. The superior qualities of
concrete make the construction sector reluctant to
transition away from the current composition of cement,
hence the need for active promotion from governments
to reduce the carbon footprint of cement.
Overall, PNZ cement production is expected to decrease
25% by 2050 compared with in our ETO forecast, due to
the combined effect of policies and decarbonization
costs that are passed on to the consumers and make
cement less competitive.
Two regions, Greater China and the Indian Subcontinent,
will be the focus of decarbonization efforts, because
together they account for more than half of cement
production over the 2020–2050 period. In low-income
regions, policies will walk a fine line between climate
objectives and a need for housing and infrastructure for
fast-growing populations, highlighting the urgency with
which global climate financing for abatement options
needs to be deployed.
Investments
Given the predominantly upfront capital costs of carbon
capture, CO2
abatement for cement holds potentially
significant economic impact for a sector in which margins
have historically been tight. Moreover, cement plants are
usually located near quarries, scattered across the
landscape, and may require considerable investment for
connection to future CO2
infrastructure and transport
networks. As an example, the Energy Transitions
Commission estimates that decarbonizing cement would
double its unit cost (ETC, 2020), which illustrates the
coming revolution in this manufacturing subsector.
210
DNV Energy Transition Outlook 2022
211
Pathway to net zero emissions CHAPTER 8
PATHWAY
TO
NET
ZERO
EMISSIONS
8.6.7 Petrochemicals
Making chemicals and petrochemicals, which also relies
on fossil fuels as feedstock, will remain a key driver of oil
and gas demand. However, phasing out coal together
with deployment of carbon capture, utilization and
storage (CCUS) will lead to a 86% reduction in the sector’s
energy and process CO2
emissions by 2050 in our
pathway to net zero.
Technologies
The industry makes many of the chemical building blocks
for products widely used in our everyday lives: plastic
packaging, fertilizers, pharmaceuticals, tyres, and so on.
This diversity implies that a broad range of solutions are
needed. However, certain key decarbonization options
will reduce the direct and indirect emissions of this
manufacturing subsector.
One such option is fuel-switching from coal to natural gas
for coal-based methanol and ammonia production,
mostly in Greater China. This both increases energy
efficiency and reduces emissions intensity. Hydrogen is
generated during the reforming process and is an
essential part of the reaction. The PNZ sees a partial fuel
shift to hydrogen. However, CO2
is either recombined
directly (methanol) or later (to produce urea from
ammonia) in the value chain, and chemical plants must in
that case find other sources of carbon. This hinders the
competitiveness of non-fossil hydrogen pathways and
explains the remaining share of natural gas. These various
measures lead to a 30% decrease in process emission
intensity by 2050 in the PNZ.
Primary building blocks for plastics, or monomers, will
continue to be primarily sourced from oil and gas, as
processes and current plants are tailored and optimized
for these fuels. Energy-efficiency gains of 25% on heat
intensity will, however, be achieved through the global
uptake of catalytic processes like naphtha catalytic
cracking. Gains through electrification will be limited,
due to high-temperature processes and to the dual use of
fossil fuels as a feedstock and energy source.
PNZ energy demand and thus emissions for plastics
production will decrease as recycled plastics will cover
28% of plastics demand by 2050. Eco-design of
consumer products, with an increased focus on product
recyclability will have to follow. This also includes a
decrease in plastic waste in the manufacturing process.
Mechanical recycling has limitations, and most improve-
ments for non-recyclable polymers can be achieved
through waste-to-energy (including co-processing) and
waste-to-fuel technologies for better use of the embed-
ded energy. About 2.1 EJ of waste-derived oil will be
produced by 2050 in the PNZ, representing 5% of global
oil primary energy demand.
CCUS will abate the remaining emissions. For some
processes, such as ammonia production from natural
gas, carbon capture has a clear benefit because of the
further need for CO2
, often in the same plant. Carbon
capture is also cost-effective in that case because of the
pure CO2
output, and several industrial plants already
have the technology in place, explaining the rapid future
ramp-up.
PNZ — Policy levers
Policies in our PNZ will target the chemical and petro-
chemical sector broadly, both on its direct and indirect
emissions.
— Carbon pricing encourages fuel-switching and the
retrofitting of CCUS for existing plants, especially for
hydrogen production from natural gas.
— Policy intervention on plastics includes mandated
recycling, with a generalization of extended producer
responsibility, and taxes on unrecycled plastics, in
combination with increasing recycling rates. Indeed,
for plastics, around half of the carbon is embedded
into the material itself, and not accounted for in the
direct emissions of the sector; therefore, the disposal
phase has a strong impact on the final carbon footprint.
— Landfill bans for plastics, accompanied by regulations
on product design for higher recyclability, will also
avoid long-term GHG emissions and promote use of
non-recyclable plastics as a source for alternative fuels.
Reduction and substitution of the demand via measures
like banning substitutable single-use plastics will also
impact global emissions.
— Support to decarbonized hydrogen, an essential
chemical for making ammonia. Emissions from
producing this key building block of nitrogen fertilizers
are currently around 500 MtCO2
per year and must be
addressed while also ensuring the security of food
supply. This will thus remain one of the main concerns
for governments.
— Stringent regulation of local nitrate pollution, and
interventions on food waste, reduce ammonia deriva-
tives demand. Although ammonia production is
decarbonized, final use of its derivatives, and their
subsequent decomposition in soil, are sources of CO2
and nitrous oxide emissions.
Investments
Energy-efficiency investments on new plants (process,
fuel shifts from coal to natural gas) could in fact lead to
cost savings (IEA, 2018), though initial capital expenditures
could be high. The most important upfront capital costs
will be the installation or retrofit of carbon capture, or for
water electrolysis in the case of hydrogen production.
This could lead to cost increases between 15% and 111%
for ammonia (Material Economics, 2019) and 50% for
ethylene (ETC, 2020).
212
DNV Energy Transition Outlook 2022
213
Pathway to net zero emissions CHAPTER 8
PATHWAY
TO
NET
ZERO
EMISSIONS
8.6.8 Power
There are two very good reasons why decarbonizing the
power sector early and aggressively is crucial for reaching
net zero. First, because the sector is responsible for one
third of energy-related emissions. Second, because
having access to low-carbon electricity is the only way to
decarbonize sectors such as heating or transport through
electrification. By taking early action on reducing power
sector emissions, policymakers will signal to markets and
consumers that they will be part of the solution by
switching to electricity.
As the cost of solar and wind continue to decline, most
new investments in the power sector already target green
alternatives that have little or no support in most regions.
However, focusing new investment exclusively on
low-carbon power will not decarbonize the electricity mix
quickly enough. A PNZ future also requires investment for
decarbonizing existing power generation capacity.
The power sector reaches net zero in 2046 in our PNZ;
annual CO2
emissions reduce from 12.6 Gt in 2020 to –
0.6 Gt in 2050. Electricity generation becomes coal-free
in 2047 as a result of early retirements of coal-fired power
plants. All gas-fired power stations are either equipped
with CCS and/or use a hydrogen blend as fuel (Figure
8.37). Biomass-fired power stations coupled with CCS
provide net negative emissions. Overall, electricity’s
share in final energy demand in PNZ increases from 20%
in 2020 to 48% in 2050, whereas our ETO forecasts 36%
for this by mid-century.
North East Eurasia remains the largest regional contributor
to power sector emissions in 2050, and is by then the only
region without net negative power sector emissions
(Figure 8.38). In PNZ, the emission-intensity of the global
power system reduces from a little more than 400 gCO2
/
kWh in 2020 to 200 gCO2
/kWh in the early 2030s, and
less than 100 gCO2
/kWh in the late 2030s. Europe, Latin
America, North America and OECD Pacific maintain a
low emission-intensity relative to the rest of the world
until 2050.
Technologies
All technologies considered in the power sector of our
PNZ exist, and renewable electricity generation techno-
logies are already proven at scale.
Carbon capture and removal − CCS is critical to eliminate
emissions from the remaining fossil-fuel (mostly natural
gas) power plants, especially combined-heat-and-power
(CHP) and heat-only power stations that generate heat for
district heating systems. The only renewable alternatives
to heat generation are hydrogen, biomass, and waste.
Therefore, a combination of fuel transition and CCS will
be needed to decarbonize heat supply (see Section 8.6.9
for further information on CCS).
Flexibility and digital infrastructure to ensure security of
power supply — The possibility that a very large share of
variable renewable energy sources (VRES) in a power
system could cause grid instability is a frequently heard
concern today. A combination of digital grid infrastructure
solutions, battery storage, and backup dispatchable
capacity can help ensure frequency stability, even at
100% VRES penetration. In balancing hourly and daily
fluctuations,pumpedhydro,batterystorage,dispatchable
generation, demand-side response and interconnections
will be the key flexibility providers. Low-CAPEX natural
gas combined-cycle power stations will play a critical
role in providing backup capacity to power systems in
extreme cases where high demand meets low wind and
solar generation. For continued investment in VRES, it is
essential that flexibility is built-in and that there is
sufficient dispatchable power (IRENA, 2019a,b).
Power-to-hydrogen will play a vital role in utilizing excess
renewable electricity and avoiding long intervals with
zero prices.
Extension of lifetime of nuclear power plants — Despite
its high cost and waste issues, nuclear power still
provides carbon-free electricity and has a role in our
PNZ. Despite new, small modular reactors possibly
offering lower costs and shorter lead times for nuclear
development projects, large-scale nuclear power will
struggle to compete with low-cost solar and wind. One
sensible policy for nuclear in a net zero pathway is to
delay decommissioning of existing nuclear plants and
allow them to run more flexibly by refurbishing key
components, despite the additional cost associated with
such refurbishments (IAEA, 2020). Given this, in our PNZ,
the lifetime of new nuclear power plants is increased
from 75 years to 100 years.
PNZ — Policy levers
The policies to achieve a PNZ in the power sector consist
of influencing the cost of capital for power sector
investment; subsidies and other support; mandates; and
bans. These policies should be considered in conjunction
with the technologies highlighted above.
Cost of capital — In our PNZ, which also involves a revision
of government funding, it will be increasingly difficult for
project developers to raise equity financing for fossil-fuel
power plants, or for that matter to access advantageously
priced debt financing. This is reflected as higher cost of
capital for investment for fossil-fuel power plants,
differentiated by fossil-fuel type and region. In contrast,
renewable power investments have reduced cost of
capital, from 7% in 2022 to 6% in 2025 and thereafter.
— Oil and natural gas power plants have a cost of capital
of 11% in Middle East and North Africa and North East
Eurasia, and 17% elsewhere.
— Coal power plants will have a cost of capital of 20%
without any regional differentiation.
Investment support for storage capacity — Increased
subsidies are given to investment for storage capacities
that are coupled to VRES.
Reduced lifetimes of fossil power plants — In our PNZ,
new fossil-fuel capacity additions from 2022 have
reduced lifetimes mandated by policy. This affects all
three types of fossil-fuel power plant, whose lifetimes are
reduced from 40 years to 25 years. From 2045 on,
residual oil-fired and coal-fired power generation
capacity is forcibly retired in all regions.
Support and market design to ensure continued invest-
ment in renewable power — With high shares of solar and
wind in power systems, electricity prices will become
increasingly volatile, with extended periods of very low
or negative pricing if electricity markets continue to
operate like today. New market designs or financial
support mechanisms to keep capture prices above costs
will help to sustain continued power investments.
214
DNV Energy Transition Outlook 2022
215
Pathway to net zero emissions CHAPTER 8
Investments
The world’s transmission and distribution network
capacity in PNZ increases by 320% between 2020 and
2050. In our ETO forecast of the 'most likely' future, the
increase is 180% over the same period. In line with the
required investment, world power grid expenditure rises
from about 0.5% of world GDP in 2020 to 1% in 2050.
Higher investment in grids will be necessary to support a
near-100% VRES power system in a net zero future. These
investments will expand networks in regions with low
electricity penetration. They will also significantly
strengthen grids in higher-income regions. This will:
enable consumers to use electricity for applications such
as EV charging and heating; allow new connections to
solar and wind sites; and create new interconnections
within and between continents to bring flexibility
through cross-border power trading.
8.6.9 Hydrogen
A large amount of hydrogen (525 Mt/year by 2050) from
both renewables and from fossil fuels combined with
carbon capture and storage (CCS) supports a net zero
energy system in 2050. It is applied strategically to
decarbonize hard-to-abate sectors such as aviation,
long-haul trucking, iron and steel production, and high
heat processes.
Technologies
Alkaline electrolysers are more mature than polymer
electrolyte membrane (PEM) electrolysers and thus
dominate the market at present, but PEM`s advantage in
operating more flexibly will increase its share substantially.
To prevent possible future fluctuations of electricity
prices, investors will gravitate towards dedicated off-grid
renewable generation for hydrogen production. But
grid-based hydrogen production will exploit these
fluctuations and make use of cheap electricity available
for long hours, avoiding curtailment of solar and wind.
Alongside electrolysis-based hydrogen production, our
PNZ sees a continuation of hydrogen produced from
CCS-treated natural gas via steam methane reforming,
but its share of a much larger hydrogen-for-energy
ecosystem will reduce (Figure 8.39).
An inter-regional trade of hydrogen does not develop
significantly in our ETO forecast but given the sheer scale
of hydrogen demand in our PNZ, there would be a
substantial inter-regional trade via ships and pipelines, in
combination with hydrogen transformed to larger
molecules. Depending on the end use, we will see
hydrogen blended with natural gas in existing grids
(e.g. for buildings gas supply) or dedicated hydrogen
pipelines (e.g. in transport).
To conclude, the basic technologies to realize global
hydrogen trade exist today. Ongoing RD effort will
need to aim at, inter alia, improving PEM fuel cells and
electrolysers as well as storage and transport options
through improved tank design and metal hydrides.
PNZ — Policy levers
To channel hydrogen use to where it is best suited, the
PNZ sees sectoral hydrogen support and incentives to
create hydrogen demand:
— Energy taxation — Hydrogen consumption in manu-
facturing will see energy taxation favouring hydrogen
to boost e.g. carbon neutral steel or zero emission
process heat.
— Mandates on fuel-mix shifts and emission trajectories
in aviation and maritime transport will create a signifi-
cant demand market for hydrogen.
— Requirements — Refineries will be required to increase
their hydrogen share for energy provision.
On the production side,explicit CAPEX reducingmeasures
are needed to boost cost learning curve-based cost
reductions for hydrogen.
— CAPEX support to integrated renewable electricity
and electrolyser projects, and subsidies to grid-
powered, renewables-based electrolysis. Both
support mechanisms will be strongest in OECD
regions and lower in low-income regions.
— Steel production will be backed by support to shift to a
hydrogen supply chain.
Investments
In our PNZ, accumulated investment in grid-based
electrolysis to provide hydrogen for energy purposes will
amount to about USD 1,700bn by 2050 and an additional
USD 1,350bn for dedicated hydrogen pipelines. With
actions starting soon, this would mean an average global
annual investment of about USD 60bn per year for
grid-based electrolysis and less than USD 50bn per year
for dedicated hydrogen pipelines. Further investments
will need to be made for dedicated hydrogen production
in combination with renewable power plants as well as for
the build-outoftheassociatedinfrastructureforintegration
into hydrogen supply chains.
Hydrogen production as energy carrier by production type
FIGURE 3.17
Units: PJ/yr
Natural gas with CCS
Electricity
54,000
3,600
60
2020 2030 2050
FIGURE 8.39
PATHWAY
TO
NET
ZERO
EMISSIONS
216
DNV Energy Transition Outlook 2022
217
Pathway to net zero emissions CHAPTER 8
PATHWAY
TO
NET
ZERO
EMISSIONS
8.6.10 Carbon capture
and storage (CCS) and
direct air capture (DAC)
In our PNZ, deployment of CCS grows rapidly from a
mere 34 MtCO2
per year captured today to nearly 460
MtCO2
in 2030, peaking around 6.4 GtCO2
in 2047, then
slowly declining to some 5.8 GtCO2
in 2050, along with
emissions reductions in all sectors (Figure 8.40). That
said, CCS captures just 0.1% of total CO2
emissions today,
and only 1.7% in 2030. It then ramps up to capture 21.8%
by 2040 and 90.7% in 2050 (Figure 8.41), leaving less than
10% of CO2
emissions uncaptured in mid-century.
Reaching net zero will be virtually impossible without
CCS to capture emissions that are technically difficult or
economically unfeasible to eliminate. Technology per se
is not an inhibitor; CCS facilities have operated for several
decades in areas such as natural gas processing and
fertilizer production, where high-concentration CO2
can
be captured at relatively low cost. In these applications,
the captured CO2
is often used in enhanced oil recovery
or for producing value-added products. For example,
CO2
produced as a by-product in ammonia production is
often used in downstream industrial processes to make
products such as glues and resins. This is referred to as
carbon capture and utilization (CCU).
Cost is the main inhibitor of wider CCS deployment.
Industries weigh the still prohibitive cost of CCS against
relatively inexpensive — in some regions non-existent —
carbon prices. For industrial processes emitting
high-concentration CO2
streams — e.g. in natural gas
processing — CCS currently costs USD 25–40 per tonne of
carbon dioxide. For processes with lower-concentration
CO2
emissions — e.g. power generation and cement
production — the capture cost today is USD 65–150
per tonne.
Today, there are 27 or so commercial CCS facilities
operating worldwide (and 135 in the pipeline), concen-
trated in North America, Europe, China and OECD Pacific
(GCCSI, 2021). Their combined capture capacity is
nowhere near the level required to move towards net
zero emissions. However, there is growing realization that
a rapid ramp-up of CCS is required within the current
decade to unleash technology cost-learning dynamics
associated with cumulative increases in installed capacity.
Without such a ramp-up, achieving net zero emissions by
mid-century will be impossible (See Figure 8.41).
In our PNZ, carbon capture by CCS begins to grow
exponentially in the 2030s, rising rapidly from less than
0.5 GtCO2
per year in 2030 to a peak around 6.4 GtCO2
in
2047. It then eases to around 5.8 GtCO2
in 2050 in line
with a decline in the amount of global emissions to
capture. The main drivers of CCS uptake are the need to
reduce emissions from the manufacturing and power
sectors. By 2050, the annual capture rates for these
purposes are 2.1 GtCO2
from manufacturing heating,
1.5 GtCO2
from processing, and 1.8 GtCO2
from power
generation — adding up to 91% of emissions captured.
On average, in the PNZ, just over 90% of all emissions in
various sectors are captured via CCS (Figure 8.38). In
PNZ, capture ratios in 2050 vary widely from about half of
industrial heat emissions (where CO2
is lower-concen-
tration and CCS more costly) to 100% of emissions from
the refinery sector with its history of existing CCS appli-
cations. Efficiency is the limiter for reaching a 100%
capture rate; the closer a CCS system gets to 100%
capture, the harder and more expensive it becomes to
capture additional carbon dioxide.
Infrastructure
Infrastructure to transport and store CO2
safely and
reliably is essential for CCS expansion worldwide. CCS
facilities can either be standalone ‘point-to-point’
projects or ‘hub and cluster’ networks that bring together
multiple CO2
emitters and/or storage locations using
shared transportation infrastructure. Establishing such
CCS hubs will help accelerate deployment by reducing
costs. At least four CCS hubs are currently operational
and 20 more in advanced development stage globally —
including in Australia, China, Europe, and the US — with
many of them linked to low-carbon (blue) hydrogen
production (GCCSI, 2021). IEA’s analysis of CO2
emissions
from power and industrial facilities in China, Europe and
the US finds that 70% of the emissions are within 100 km
of potential storage (IEA, 2021b). But shorter distances
can reduce costs further and decrease infrastructure
development times.
Direct Air Capture
Direct air capture (DAC) technologies play an important
role in the transition to net zero. DAC technologies
extract CO2
directly from the atmosphere for permanent
storage, or for uses such as carbonating beverages,
stimulating plant growth in greenhouses, or producing
synthetic hydrocarbon fuels. DAC is a carbon-removal
strategy, while CCS is a mitigation strategy (Batres et al.,
2021). An advantage of DAC is the potential for flexibility
in siting, reducing the need for CO2
transport. DAC
facilities can also be co-located with CCS facilities, such
as CCS-equipped power or industrial plants, to facilitate
access to existing CO2
transport infrastructure, and
enabling these facilities to reach net zero or even negative
emissions. DAC plants are already operating on a small
scale, but their costs are currently prohibitively high,
requiring significant levels of support. There are currently
19 DAC facilities in operation around the world, with a
total annual capture capacity of up to 0.01 MtCO2
(IEA,
2021a). In Iceland, Swiss start-up Climeworks AG is
building what will then be the world’s largest DAC facility,
with a capture capacity of 36,000 tCO2
per year. The
company says its vision is to ‘increase permanent removal
capacity to a megaton scale by 2030 and a gigaton scale
by 2050’.
DAC is currently too expensive and energy-intensive to
present a viable business case, and is only possible given
significant public or government support. For example,
Climeworks AG has investors but is also appealing to the
218
DNV Energy Transition Outlook 2022
219
Pathway to net zero emissions CHAPTER 8
PATHWAY
TO
NET
ZERO
EMISSIONS
public to offset carbon footprints via donations towards
supporting DAC technology development. Our PNZ
sees DAC to be needed on top of CCS because of the
unavoidable emissions that will remain in 2050, particu-
larly from lower-income regions. Government support
and subsidies can make DAC competitive as a carbon
offset method over time by progressing the industry’s
cost-learning curves. By sponsoring DAC, higher-income
regions can enable net zero by mid-century even if
lower-income regions have still not reached net zero
nationally. Given the much larger share of higher-in-
come regions in historical emissions, it can be argued
that this is only fair from a climate justice perspective
(Batres et al., 2021).
When net zero emissions are reached in our PNZ, 2.4
GtCO2
of energy and process emissions still remain,
notably in the transport sector. We expect that around
1.6 Gt of these lingering emissions would be captured
via DAC technologies and stored (Figure 8.42). Remov-
ing this amount of CO2
from the atmosphere via DAC
could require up to 4,200 TWh of electricity, equivalent
to 5% of total electricity generation in 2050 under
the PNZ.
PNZ — Policy levers
Cost is the key barrier to CCS uptake and its fitting or
retrofitting to power or industrial plants will happen,
initially at least, only with government-driven deployment
policies. In our analysis, we see regional carbon-price
trajectories as the key determinant of CCS, in combination
with other measures such as infrastructure and investment
support (incentives per tCO2
captured), and mandates.
We expect government support to be particularly driven
by high GDP regions (Europe, Greater China, North
America, and OECD Pacific). Our PNZ assumes faster
ramp-up rates and a higher maximum CO2
capture rate
for CCS compared with our ETO forecast.
In summary, the following are the additional policy
assumptions for our PNZ which affect CCS and DAC
uptake:
— Higher carbon prices incentivizing deployment.
— Mandates requiring CCS in natural gas-fired and
biomass-fired power generation.
— CAPEX/OPEX support and policies promoting
value-chain and infrastructure development enable
ramp-up of CCS and DAC capacity.
Investments
In line with the growth in CCS, associated CAPEX and
OPEX are expected to grow to a peak of just below USD
330bn per year by 2047, and then to decline slowly to a
little less than USD 300bn per year by 2050, thanks to
lower emission levels. DAC technology is expected to
take off around a decade later than CCS, during the late
2030s, with expenditures growing exponentially to reach
USD 860bn per year globally in 2050. This indicates that
by mid-century, DAC’s unit CO2
capture cost is still more
than 10 times higher than that of conventional CCS. This is
consequence of atmospheric concentrations of CO2
being far lower than from industrial facilities, and there-
fore costlier to capture. Because DAC technology is still in
its infancy, it will require higher levels of government
support. To reach the required PNZ level by 2050,
government support of nearly USD 40bn on a cumulative
basis by 2050 is assumed across the Europe, Greater
China, North America, and OECD Pacific regions.
Climeworks Orca direct air capture plant in Iceland. Image courtesy Climeworks.
220
DNV Energy Transition Outlook 2022
221
Regional transitions CHAPTER 9
9
Highlights
The energy transition unfolds differently in each of the
10 world regions included in our forecast. Its speed and
scale are influenced by a number of factors, such as:
geographical and resource issues; legacy technology-
and energy systems; stages of economic development;
and government policy.
Thus, every region has a unique starting point and a
different transition trajectory — from OECD countries
targeting post-industrial prosperity, to emerging and
fast-growing economies, to regions entering an era of
development.
Our ETO model generates insights and captures this
granularity, and, in the following sections, the forecast
transition for each of the 10 Outlook regions is
presented, including:
— Regional characteristics and the current position
— Pointers to the future
— The regional transition results explained, also covering
the emissions profile and forecast
— A net zero pathway for each region, emphasizing key
policy levers, the emissions reduction and main
energy shifts.
REGIONAL
TRANSITIONS
9.1 North America  124
9.2 Latin America  136
9.3 Europe  146
9.4 Sub-Saharan Africa 260
9.5 Middle East and North Africa 274
9.6 North East Eurasia  284
9.7 Greater China 292
9.8 Indian Subcontinent  304
9.9 South East Asia 314
9.10 OECD Pacific 324
9.11 Comparison regional
energy transitions  332
222
DNV Energy Transition Outlook 2022
223
Regional transitions CHAPTER 9
KEY
Share of fossil
primary energy
sources 2050
Share of non-fossil
primary energy
sources 2050
NORTH AMERICA
Natural gas dominates
manufacturing energy mix
through to 2050, while
buildings shift to electricity for
70% of demand. Electricity
meets 40% of final energy
demand by 2050
Electricity generation will not
be carbon-free in 2035 – 34%
still coming from hydrocarbons
Emissions decline 67% to
2050 but transport becomes
the largest emitter
LATIN AMERICA
Fossil fuels will have a 47%
share of final energy demand,
dominated by oil (31%)
Solar PV and wind power
grow to account for 82% of
power generation in 2050
25 Mt/yr of hydrogen and
derivatives are exported by
2050, building on the lowest
levelized cost for solar-
powered hydrogen production
MIDDLE EAST
AND NORTH AFRICA
Electricity’s share of final
energy demand more than
doubles to 38% in 2050
Wind and solar provide
69% of electricity, solar
contributing almost 50%
and a quarter of this in solar
+ storage plants
Annual hydrogen production
grows 10-fold from less
than 1 Mt in 2030 to nearly
10 Mt in 2050
INDIAN SUBCONTINENT
By 2050, 53% of primary
energy will come from fossil
fuels, coal having a 22% share
Demand for electricity grows
10-fold with electricity meeting
33% of final energy demand in
2050
Solar and wind will have 67% of
power generation combined,
adding 3.4 TW capacity
between 2030 and 2050
GREATER CHINA
Electricity's share of energy
demand doubles to 47% in
2050, the highest of all
regions with 90% from
renewable energy sources
The share of coal in power
generation (current 62%)
reduces to 4% in 2050
CO2
emissions peak before
2030 and carbon intensity
(tCO2
per unit GDP) reduces
66% to 2030
SOUTH EAST ASIA
Greatest exporter of coal at 400
Mt in 2020, and the coal sector
is entrenched in region
economies
Electricity doubles its share in
final energy demand to 36% by
2050
Solar PV and solar + storage
plants rise from the late 2030s
to account for 74% of electricity
in 2050
OECD PACIFIC
By 2030, all capacity additions
in power generation are from
renewable energy or nuclear
72% of grid-connected
electricity is based on
renewable energy sources in
2050
Hydrogen and its derivatives
are 8% of final energy
demand by 2050, the second
highest share after Europe
NORTH EAST EURASIA
Little change in energy
demand and mix, majority still
met by natural gas in 2050
Economies’ dependence on
fossil extraction continues, but
is eventually reduced by
energy transition elsewhere
Russia's invasion of Ukraine will
reduce the region's gas and
coal production and lower oil
export revenue
EUROPE
Final energy demand
decreases by 21% to 2050
from energy-efficiency gains
and electrification
Electricity meets 43% of
demand in 2050 from an
almost decarbonized power
mix with wind accounting for
half of generation
Hydrogen and derivatives
meet  9% of final energy
demand by 2050, the highest
of all regions
SUB-SAHARAN AFRICA
Energy demand increases by 90%
from the population almost doubling,
and also driven by manufacturing
Off-grid solar PV meets 45% of
energy demand from appliances
and lighting by mid-century
Fossil-fuelled power will provide 20%
of on-grid generation by 2050 with
hydropower and other renewables
accounting for 79%
WE ANALYSE 10 GLOBAL REGIONS
224
DNV Energy Transition Outlook 2022
225
Regional transitions CHAPTER 9
The Canadian and US energy mixes are fossil fuel domi-
nated but both governments have net zero GHG targets
for 2050. Intermediate goals for 2030 are 50-52% of 2005
levels (US) and 40-45% (Canada). A just transition is high
on NAM's policy agenda to deal with transition impacts.
Transition plans have progressed with Canada’s 2030
Emissions Reduction Plan: Canada’s Next Steps for Clean
Air and a Strong Economy (Government of Canada, 2022)
and the US Inflation Reduction Act (2022), coming on the
back of last year’s Infrastructure Investment  Jobs Act,
which create the policy runways to spur action paths to
net zero.
Both federal governments are pursuing cooperative
transition efforts, such as through the Mission Innovation,
the Net-Zero Producers Forum, the Global Methane
Pledge, and the Climate Club of the G7.
High gasoline prices and energy security concerns in the
wake of Russia’s invasion of Ukraine have augmented
focus on the transition to EVs, but also triggered calls to
increase the regions' oil output, suggesting a stasis in
decarbonization focus, at least short term. For LNG
exports to Europe, capacity is a limiting factor, and
expansion of infrastructure weighs against medium/
long-term goals of reducing fossil fuels. Some view clean
hydrogen supply chains as possibly a better opportunity.
Offshore wind has seen a swell of interest with major
developers, private equity, and oil and gas majors
securing lease areas on the US Atlantic coast. US wind
andsolarforthefirsttimeexceednuclearpowerproduction
(Electrek, 2022). However, its solar industry has been
disrupted (ACP, 2022), by customs enforcement of the
Uyghur Forced Labor Prevention Act and the possibility
of retroactive duties from the Commerce Department
Anti-Circumvention investigation of Chinese solar-module
makers, that has also inflated prices in the corporate
power purchase agreement (PPA) market.
− The Inflation Reduction Act brings more stability to
transition policy, in contrast to executive orders that
risk future revocation. There are questions concerning
the ability of the IRA to truly scale down fossil sources/
emissions given its reliance on incentives and
clean-energy spending, as opposed to carbon pricing.
− The region’s manufacturing agenda will see regulation
aiming to kickstart capabilities /production /employ-
ment in renewable and low-carbon technologies.
Examples include President Biden’s executive orders
(SolarReviews, 2022), and the Infrastructure Investment
 Jobs Act providing USD 8bn for the US Department
of Energy to invest in regional hydrogen hubs, accele-
rating uptake in end-use sectors.
− Canada’s Clean Fuel Regulations provide the oil and
gas sector, the largest source of GHG emissions, with
incentives to produce low-carbon-intensity fuels,
helping to sustain the competitiveness of fuel
producers in the expanding global clean-fuels market.
Its transport sector will see EV uptake pushed by a
policy package of mandates, infrastructure (CAD
900mn) funding and CAD 1.5bn in purchase
incentives.
− Canadian 2022 budget earmarked CAD 2.6bn in new
spending over the next five years on CCS, and then
CAD 1.5bn annually until 2030 to spur CCUS projects
permanently storing GHGs. The tax-credit scheme
aims for emissions reduction of 15 million tonnes per
year by 2030 and will cover 50 and 60% of CCUS and
DAC expenses, respectively, as well as 37.5% for
storage, transportation and use.
− Governmental policy push will be complemented by
growing corporate net-zero commitments, with
corresponding expansion of corporate PPAs.
A deepening ESG investment trend, presently manifest
in oversubscribed sustainability and green energy-
focused funds, will also be underscored by mandatory
climate disclosures in both Canada and the US.
Characteristics and current position Pointers to the future
9.1 NORTH AMERICA (NAM)
This region consists of Canada
and the United States
Population (MN) GDP/person (USD)
GDP* (USD TRN)
Energy-related emissions/person (T)
Energy-related emissions (GT)
2020
2050
Energy use/person (GJ)
Energy use (EJ)
368 59 000
21.8
13.6
5
266
98
436 78 000
34.1
3.7
1.6
167
73
*All GDP Figures in the report are based on 2011 purchasing power parity and in 2017 international USD
226
DNV Energy Transition Outlook 2022
227
Regional transitions CHAPTER 9
On August 16, 2022, President Biden signed into law the
Inflation Reduction Act (IRA). A slimmed down and
reworked version of the Build Back Better plan, it aims to
curb inflation by reducing the deficit through changes to
the tax code, lowering prescription drug prices, and
investments in domestic energy production, specifically
clean energy production, which will lower costs and
reduce emissions.
This is by far the most expansive energy bill passed by
Congress, and it has been met with enthusiasm from
those working in the renewables industry in the US. It
provides a host of incentives, funding, and investments in
renewable energy, on all levels — from consumers to
producers and manufacturers of renewable technology
— all adding up to 369 billion USD in spending on domestic
energy and climate change. Through the many provisions
in this bill,the US aims to reduce greenhouse gas emissions
by 40% by 2030, a step in the right direction towards
meeting Biden’s Paris Agreement targets and reducing
GHG emissions to zero by 2050. Some of the highlights
which are pertinent to the future of renewable energy and
emissions reduction in the United States include:
— Tax credit of up to USD 7,500 for the purchase of new
clean vehicles manufactured in the US with US made
parts, and a new credit of USD 4,000 for used EVs for
households with a maximum income of USD 150,000
a year.
— USD 10bn in investment tax credits to build manu-
facturing facilities that make EVs and renewable
energy technologies.
— USD 9bn in rebates for individuals buying and
retrofitting homes with energy-efficient and electric
appliances.
— USD 30bn for solar panels, wind turbines, batteries,
geothermal plants, and advanced nuclear reactors,
including tax credits over 10 years.
— CCS tax credit of USD 85 per metric ton, up from USD 50
— Methane penalty: USD 900 per metric ton of methane
emissions that exceed federal limits in 2024, rising to
USD 1,500 per metric ton in 2026
— USD 20bn to cut emissions in the agriculture sector
— USD 27bn for ‘green bank’ to support clean energy
projects particularly in disadvantaged communities.
— USD 60bn to support low-income communities and
communities of colour, includes grants for zero-
emissions technology and vehicles, highway pollution
mitigation, bus depots and other infrastructure
located near disadvantaged communities
The bill simultaneously supports the deployment of low
carbon energy technologies while also promoting an
increase in domestic manufacturing, which in turn will
create domestic jobs. Some of these energy tax incentives
are retroactive, while many others go on for ten years,
starting as early as 2023. Reactions to the bill have been
largely positive, with the legislation being called
groundbreaking, and seen as a major climate and energy
achievement, with expectations that it will produce long
lasting change. Critics generally acknowledge that the
IRA is a step forward but stress that it does not go far
and fast enough in tackling the climate crisis.
The Inflation Reduction Act
Energy transition:
doldrums or winds of
change?
The energy transition is moving forward in North America
more slowly than it could. Oil and gas have always been
cheap and abundant in this region and there is a deep-
seated reluctance to change its fossil fuel advantage,
though this is starting to shift. Renewables have become
the most economically competitive power sources, and
the recent passage of the Inflation Reduction Act (IRA),
described overleaf, makes large investments in renewable
energy with the duration of the support lasting into the
2030s. However, getting the IRA through the legislature
was tortuous; it is a much slimmed down version of the
Build Back Better Bill, which contained more climate
legislation, and it is obvious that the transition is not
advancing without question in a polarized political
climate. Recent steps backwards for the transition include
the anti-dumping investigations targeting Chinese solar
cells/modules, and limits placed by the Supreme Court on
the powers of the Environmental Protection Agency (EPA).
It remains to be seen whether the push for energy
security and producing more energy domestically,
following Russia’s invasion of Ukraine, helps or hinders
the transition.
In Canada, the transition has been driven by federal
policies. Most of its electricity has long been produced
renewably through hydropower, and the government has
committed to an emissions reduction plan, setting goals
for 2030 and 2050. However, there is still political resist-
ance to stepping away from fossil fuels, especially in
oil-producing provinces Alberta and Saskatchewan, and
in areas where energy resources are scarcer, such as in
the north of Canada.
In 2050, North America will have about 5% of the world’s
population and the highest GDP per person of our 10
regions; 78,000 USD per year. Though its share of world
GDP declines from 16% today to 11% in 2050, mainly due
to faster GDP growth in China and India, North America
9.1 NORTH AMERICA
228
DNV Energy Transition Outlook 2022
229
Regional transitions CHAPTER 9
will still be the third-largest contributor to world GDP.
As a highly economically developed region, it has many
advantages that could enable it to lead the energy
transition — for example, energy resources and space,
technological prowess, financial capital, and fewer demo-
graphicchallengesthanlow-incomeregions.Experiencing
more extreme weather events every year, North America
is not immune to the effects of climate change. However,
while we forecast a comprehensive energy transition in
the US, given its history of ‘pushme-pullyou’ climate
politics, it lags Europe in setting the lead on the transition.
Energy demand
North America’s final energy demand (Figure 9.1.1) has
been relatively flat for two decades and will decline 17.7%
by 2050, most notably in transport, the sector with the
largest energy demand, for which the decrease will be
43% between 2020 and 2050. This decline is due to the
phase-outofICEs,causingoiluseinthissectortoplummet,
and the use of the more efficient electric vehicles which
will replace them. Energy use in manufacturing remains
relatively stable through the forecast period. It grows
only slightly by 2050 despite an initial decline and
subsequent rise in the share of the secondary sector in
GDP, pointing to significant efficiency gains in this sector.
Here the energy carriers remain relatively stable, with
natural gas as the largest. However, there is a slight
increase in electricity use, making up 10% more of the
mix in 2050 than in 2020, and the emergence of hydrogen
to make up 7% of the mix in mid-century. In buildings,
natural gas use declines significantly, with electricity
growing to dominate energy demand and make up 70%
of the mix in 2050. Improved energy efficiency through
electrification and heat pumps also counteracts the
increase in residential and commercial space — up 25%
and 51% respectively — causing energy use in buildings to
remain relatively stable.
The share of electricity in the overall final energy demand
will continue to rise (Figure 9.1.2), almost doubling from
21% in 2020 to 40% in 2050. Oil use will decline steeply,
down 64% by 2050 to represent 18% of final energy
demand, but even with the continued decline in coal use,
this will not be fast enough for the region’s net-zero
ambitions. Natural gas remains in second place (27%) in
mid-century, due to its low cost and policy factors. Other
sources of energy will remain minor, with coal, hydrogen,
and bioenergy combined comprising only 12% of the
2050 final energy mix — outcompeted by the cheaper
renewables and natural gas.
Steps forward:
Renewables and capacity additions to the grid
Renewables are making inroads in many US states, now
supported by the federal provisions set out in the IRA (see
IRA p.227). The extent varies between states, partly due to
them having their own policies and incentives, and is also
influenced by cities and companies. Market forces are
also at play with underlying renewable energy technolo-
gies costs in decline and therefore the expansion of
renewables is to some extent isolated from political
swings. On a federal level, the recent passing of the
Inflation Reduction Act authorizes 369bn USD in spending
on domestic energy and climate change. President Biden
also recently issued an Executive Order to spur domestic
clean energy manufacturing as part of the ambition to
leverage industrial and employment benefits from the
clean energy expansion. This order includes invoking the
Defense ProductionAct to accelerate domesticproduction
of clean energy technologies including solar panel parts,
building insulation, heat pumps, transformers and other
equipment for making and using clean electricity-gener-
ated fuels. The US Federal Government has also imposed
a two-year freeze on potential anti-dumping/anti-circum-
vention duties on imports of solar panels from South East
Asia (Cambodia, Malaysia, Thailand and Vietnam) to allow
US manufacturing time to ramp up their domestic
production of such products. The US also aims to have 30
GW of offshore wind by 2030, and up to 110 GW by 2050.
Canada’s 2030 Emissions Reduction Plan pledges 90%
emission-free electricity by 2030. The Canadian govern-
ment recently announced the ambitious World Energy
GH2 project — a 1.5 GW-capacity electrolyser powered
by 3GW of offshore wind — which is slated to produce
green hydrogen by 2024.
Our Outlook shows the result of support for renewable
power policies in the capacity additions to the grid from
renewable sources. More than 72% of gross capacity
additions in North American power stations currently are
represented by renewable electricity — 37% solar, 35%
wind — with only 27% coming from fossil fueled power
stations (see Figure 9.1.3). Fossil fueled power additions
will further decline, and by 2050 nearly all capacity
additions in the region will be in renewable energy power
stations — 32% from solar PV, 30% from onshore wind,
17% from solar + storage and 15% from offshore wind.
The levelized cost per kWh of these renewables will also
decline by mid-century to 2.5 US cents (US¢) for solar PV,
2.6 US¢ for onshore wind, 2.9 US¢ for fixed offshore wind,
and 3.8 US¢ for floating offshore wind. Regarding the US
North America grid-connected capacity additions becoming operational by year
FIGURE 9.1.3
2020 2030
2050
Gas-fired,
26%
Solar PV, 37%
Onshore wind,
35%
52 GW
Hydropower,
6%
Offshore wind,
7%
Solar PV,
46%
Solar+storage,
6%
46 GW
Onshore
wind, 33%
Solar+storage,17%
Solar PV,
32%
97 GW
Onshore
wind, 30%
Offshore wind,15%
Onshore wind
Hydropower
Solar PV
Solar +
storage
Gas-fired
Other
Offshore wind
230
DNV Energy Transition Outlook 2022
231
Regional transitions CHAPTER 9
goal in offshore wind (30 GW/2030, 110 GW/2050), our
Outlook shows this to be an achievable goal — by 2030
North America will have 29 GW of installed capacity for
fixed offshore wind and 2 GW of installed capacity for
floating. In 2050, fixed offshore wind capacity will rise to
148 GW, with floating at 31 GW.
We foresee growth of 62% between 2020 and 2050 in the
amount of on-grid electricity generation, indicating not
only a massive build-out of power stations, but also of the
grid in North America. Most of this future generation will
come from renewables, indicating not just a build-out of
the grid but also a massive change in the type of infra-
structure being built, as historically electricity generation
in this region has come from coal, natural gas, and some
nuclear and hydropower. Onshore wind will generate the
most (32%) electric power in 2050, followed by solar PV
(27%). Solar + storage and offshore wind (fixed and
floating) will also generate 5% and 9% of the electricity
mix in 2050. To enable this generation, installed capacity
will amount to 2,800 GW in 2050, with solar leading at
45%, followed by wind at 30%.
This build out of the grid bodes well for the future adoption
of EVs,which is also beingdriven currently by high gasoline
prices in the post-pandemic economic rebound and
because of sanctions on Russian energy exports after the
invasion of Ukraine. Their sales will grow in North America,
with EVs comprising 50% of new vehicle sales by 2033, and
97% of new vehicle sales in 2050 (Figure 9.1.4). The 2030
forecast of 37% trails the US’s goal for EVs to comprise half
of all new vehicle sales by 2030, and Canada’s goal of 60%.
These sales numbers mean that by 2050, 74% of vehicles
on the road in North America will be EVs, overtaking the
number of ICE vehicles on the road in 2044. Cars will
continue to be large and have long ranges, with North
America having the largest battery size at 117 kWh (10%
larger than second place OECD Pacific) and an average
range of 844 km, the highest of all regions (Figure 9.1.5).
The shift to EVs will reflect a strong build-out of the power
grid, which is again aided by the strong growth of grid
electricity. By 2050, passenger vehicles in North America
will have over 23,000 GWh of combined battery storage
capacity, offering considerable potential for vehicle-to-
grid services.
Holding back: Oil and natural gas
The large amount of support for the fossil fuel industry in
North America is currently hindering the transition. The
recent ruling of the US Supreme Court that the EPA does
not have the authority to regulate GHG emissions unless
Congress has clearly authorized the Agency to act
complicates the government’s ability to regulate emissions
from coal plants and oil refineries and there have been
delays in closing US coal plants. In addition, with Russian
oil imports currently banned, the US is looking to the
previously sanctioned Venezuela to fill the gap in oil
supply. In a bid to bring down high gasoline prices, the
Biden administration has drawn down from the US
Strategic Petroleum Reserve and urged US refineries to
ramp up production to ease fuel costs. How long these
measures will last is uncertain. It is possible that they are
more likely to be bumps in the road to an energy transition
rather than a change in direction. Governments will also
need to address the loss of jobs in the oil and gas sectors
if they do not want the transition to electricity to become
unpopular among people and communities affected by
such losses.
232
DNV Energy Transition Outlook 2022
233
Regional transitions CHAPTER 9
What is not a bump in the road however is that North
America will still be heavily reliant on natural gas in 2050
(Figure 9.1.6), with renewables comprising only 34% of
primary energy consumption. In terms of world primary
energysupply,NorthAmericacomesinsecond,consuming
17% of the world’s natural gas in 2050, behind the Middle
East and North Africa. Compared with a similarly devel-
oped region like Europe, which will have one of the
lowest levels of natural gas consumption in 2050, North
America is on a very different path. The main reasons for
natural gas’s dominance in this region is its affordability;
modest carbon pricing allow natural gas to remain cheap
and it does not start to be outcompeted price wise by
renewables until the 2030s. Higher carbon prices in some
states and Canada does not change this general picture.
In the wake of the war in Ukraine, LNG exports to Europe
will grow to make up for energy shortfalls resulting from
Russia stopping its gas exports to Europe. While natural
gas use in buildings will decline, the manufacturing
sector will remain dependent on its use, maintaining
share of between 47% and 38% until 2050. Manufacturing
is one of those hard-to-abate sectors, and the best way
forward in greening it is through CCS and hydrogen. In
2050, North America will capture 27 MtCO2
of manufactur-
ing’s emissions of 412 MtCO2
emissions, and hydrogen will
increase its share to 7% of manufacturing’s energy
demand. Natural gas will overtake oil as the largest
primary energy source within the next few years, following
a marked decrease in oil use, especially in the transport
sector, where the share of oil decreases from 90% in 2020
to 46% by 2050.
In President Biden’s climate agenda, one of the key goals
is for the US to have carbon-free electricity by 2035 and it
is a goal American policy makers look towards. Canada
already has over 80% of its power from non-emitting
sources, and aims to transition the remaining generation
to clean sources by 2030. These are ambitious goals and
our Outlook forecasts that they will not be achieved; the
aforementioned ruling by the US Supreme Court on the
power of the EPA supports our projections. While the
amount of electricity generated by fossil fuels will
certainly decline (Figure 9.1.7), 34% of generation in 2035
will still come from such sources, natural gas (31%) and
coal (3%). Entirely carbon-free electricity will not even
materialize by 2050; while coal will have decreased to less
than 1% of generation, 8% of electricity will still be
generated from natural gas. There will, however, be no
new power capacity additions from coal in the forecast
period (last investments were in 2016), and natural gas
power sector additions will remain minimal after 2026.
Emissions
We project the average carbon-price level to rise to USD
25/tCO2
in 2030 and 70/tCO2
by 2050 (see Section 6.4).
The Canadian government is directing a Pan-Canadian
approach and steadily increasing the economy-wide
carbon price. In the US, there is no federal policy and
pricing will be dominated by development in US state
cap-and-trade schemes.
Emissions in North America will decline 68% by 2050,
driven mostly by renewables uptake in the power sector
and a fall-off in oil use (Figure 9.1.8). By end use, buildings’
emissions especially decrease 76%, leaving transport as
the largest emitter at 0.64 GtCO2
in 2050.
By 2050, North America will capture 205 MtCO2
per year,
which is in the same range mid-century as Europe, and up
from 42 MtCO2
in 2030. Most of this capture will be in the
production of gas-based hydrogen at 66 MtCO2
in 2050,
followed by process industries and then the power
sector. Manufacturing’s 27 MtCO2
annual capture rate in
mid-century will be especially important, as it is the
sector which uses the most energy from fossil fuels.
North America's emission level of 3.7 tCO2
per person in
2050 will be around one quarter of the present level, but
will still be the second highest of all the regions, behind
North East Eurasia.
In the context of global climate policy, country pledges in
nationally determined contributions (NDCs) under the
Paris Agreement indicate that North America, viewed as
a region, is targeting total reductions of 36.1% in energy-
related emissions by 2030. Note that we calculate the
North America target compared with 1990 to have a
common reference point for all regions. The average
target is lower than stated NDC pledges, as 1990 emis-
sions were less than in 2005. We estimate emissions will
reduce by 19% by 2030 compared with 1990, meaning
the region target will not be easily achieved. By 2050, our
estimates indicate that the region will have reduced its
energy-related emissions by 67% compared with 2020
and will still be emitting 1.6 GtCO2
per year in 2050 in
contrast to the region’s net-zero pledges.
235
234
Regional transitions CHAPTER 9
DNV Energy Transition Outlook 2022
PNZ – North America
The pathway to net zero (PNZ) for North America sees
energy-related CO2
emissions reduce from 5 Gt in 2020
to net zero by 2043 and -0.92 Gt by 2050 (Figure 9.1.9),
with a rapid reduction in natural gas and oil, supplanted
by electricity and hydrogen, in the energy system
(Figure 9.1.10). In 2050, direct air capture will capture
0,838 GT CO2
emissions. Even in the PNZ, transport-sector
emissions are the hardest to abate in North America,
though they will reduce by over 95% from 2020 to 2050.
Both buildings and manufacturing CO2
emissions will
fall by over 100% towards 2050.
Because of the region's outsize role in the world economy,
it will absolutely have to go below zero well before 2050
for the world as a whole to achieve the ambitions of the
Paris Agreement.
Given the character of climate politics, particularly in the
US, that below zero obligation is likely to be a bitter pill
for the region to swallow. At the moment, only the State
of California is explicitly targeting net zero by 2045, with
as yet no firm commitment on how far below zero the
State is setting its sights.
Because of the region's outsize role in the
world economy, it will absolutely have to go
below zero well before 2050 for the world
as a whole to achieve the ambitions of the
Paris Agreement.
PNZ – Policy levers
Economy-wide economic signals — The rise in average
region carbon prices, to USD 100/tCO2
in 2030 and USD
250/tCO2
in 2050, is reflected as costs for fossil fuels.
Transport − The decrease in transport emissions is
achieved by a two-pronged strategy for electrification of
road transport: through subsidies for electricity for EVs
and banning sales of fossil-fuel vehicles from 2030 for
passenger vehicles and from 2040 for commercial
vehicles.
Buildings − Three policy levers contribute to buildings
emissions decreases: better energy efficiency standards
for new commercial and residential buildings’ specific
energy use, partial banning of fossil-fuel equipment in
buildings, and accelerated phase-out of fossil-fuel
equipment by halving lifetimes of new equipment.
Manufacturing − The PNZ reduction in manufacturing
emissions is achieved by investment support to electrifi-
cation of heat supply in the manufacturing sector,
starting from 2022, of the investment cost of industrial
electric heat boilers and heat pumps. Similarly, support of
electric and hydrogen capacity investments in the steel
production are given from 2022.
Energy supply − CO2
emissions from energy supply are
reduced by bans on fossil fuel power plants from 2040.
Similarly, a 20% cost of capital for coal power plants from
2025, and a 17% cost of capital for oil and gas power
plants also eliminate these power plants from the
electricity grid.
236
DNV Energy Transition Outlook 2022
237
Regional transitions CHAPTER 9
Latin America is well positioned for the energy transition
with mineral wealth, low-carbon fuels, renewable
electricity, and carbon offsets, exemplified by Chile’s
northern Atacama Desert holding the world’s largest
reserves of copper and lithium; by Uruguay proving the
feasibility of renewables integration (95%) in electricity
systems; and by Brazil’s long-established production of
biofuels and rapidly growing wind and solar.
With its wind, biomass, geothermal, hydro, and solar
resources, the region’s carbon intensity is among the
lowest of all regions. Hydropower has great potential
(approx. 60% of power generation in Brazil), but gene-
ration is challenged by climate variability increasing.
The region has seen impressive growth in renewable
generation, mainly relying on market-led approaches
with government tenders and competitive bidding, and
with record-low prices undercutting fossil-fuelled power.
While an attractive destination for investment, there are
regulatory risks.
Several countries aspire to become green hydrogen
export hubs. Chile’s National Green Hydrogen Strategy
(2020) and Colombia’s Hydrogen Roadmap (2021) are the
most concrete to date. Brazil, Mexico, and Venezuela lead
regional oil and gas production, and the region holds
world-class unconventional resources. Several of the
region’s nations produce mostly heavy crude with high
sulphur content (Venezuela, Ecuador, Mexico, Colombia),
but initiatives to reduce the carbon intensity are starting
to gain traction.
The region’s 6 biggest economies — Argentina, Brazil,
Colombia, Chile, Mexico and Peru — account for about
85% of regional GHG emissions, and among global
emitters, Mexico ranks # 11 and Brazil # 16 in the world
(Climate Policy Watcher, 2022).
Reducing unabated fossil-fuel use in industry, greening
road transport, and improving energy efficiency are key
transition challenges.
− Uruguay is targeting carbon neutrality as early as 2030.
There are 2050 targets in Argentina, Chile, and
Colombia, Costa Rica, Panama, and for Brazil in 2060.
Chile’s Climate Change Framework Law (2022) sets a
binding target in law.
− Argentina targets 20% of power from non-hydro
renewables in 2025 (up from 9% in 2020) and 35% in
2030, with a dominant role for onshore wind. Reducing
natural gas imports (LNG) will motivate further invest-
ment in the Vaca Muerta shale formation and related
infrastructure.
− Brazil aims to maintain hydropower, boost solar and
wind output, and almost double oil and gas production
by 2030. Hydrogen will become part of its energy mix
(National Energy Plan 2050) coupled to offshore wind
ambitions. Further development of regulatory frame-
works will be key. A carbon credit market is planned
– while incipient, it evidences the country’s ambition.
− Chile aims for a 70% renewable power mix by 2030.
Its hydrogen strategy sets high ambitions: 5 GW of
electrolysis capacity under development by 2025,
and 25 GW with committed funding by 2030. Mining,
Chile’s largest industry, sees decarbonization potential
through green hydrogen.
− Colombia aims for 1-3 GW electrolysis capacity and 50
kt/yr blue hydrogen by 2030. Transition efforts focus
on EV rollout and new renewable electricity capacity
(4 GW by 2030) along with infrastructure development
e.g. in the La Guarija region. A fossil-fuel phase-down
will be supported by carbon credit revenue from
avoided emissions.
− Mexico’s Electricity Law 2021, favouring its state-owned
utility CFE, was voted down; but political risks continue
to hinder renewable energy investments. Government
focus on increasing oil and gas production, refining
capacity and fuel oil production for CFE´s generation
plants is bucking global decarbonization trends.
Characteristics and current position Pointers to the future
9.2 LATIN AMERICA (LAM)
This region stretches from Mexico to the
southern tip of South America, including
the Caribbean island nations
Population (MN) GDP/person (USD)
GDP* (USD TRN)
Energy-related emissions/person (T)
Energy-related emissions (GT)
2020
2050
Energy use/person (GJ)
Energy use (EJ)
660 14 700
9.8
2.2
1.5
49
32
759 30 100
22.8
1.7
1.3
60
45
*All GDP Figures in the report are based on 2011 purchasing power parity and in 2017 international USD
238
DNV Energy Transition Outlook 2022
239
Regional transitions CHAPTER 9
Energy transition:
a bright future for
renewable gases
domestically and abroad
Latin America’s final energy demand reflects only
marginal improvement in standards of living during the
last decade. It is only after 2025 that standards of living
will rise again. The more than doubling of final energy
demand in the region between 2020 and 2050 will be
met by a significant growth of electricity (Figure 9.2.1).
Coal and nuclear fuels will remain insignificant energy
sources. Renewables, led by biomass and hydropower,
will be overtaken by strong solar PV and wind growth,
supplying 53% of primary energy by 2050. Despite the
significant growth in electricity generation, almost
doubling from 18% in 2020 to 32% in 2050, final energy
demand will still see a 47% fossil energy share by
mid-century. The 47% is dominated by oil (31%) and
natural gas (15%), with coal of minor importance.
Energy demand
Looking more closely at Latin America’s energy demand
sectors, we see that transport energy demand will reflect
both population growth and a higher income per capita,
with a greater use of vehicles; however, increasing
electrification will counteract the vehicle fleet expansion,
so energy use will only lift marginally. Thus, transport
energy demand will peak in the early 2040s, then
decrease slightly to 2050. Energy demand in manu-
facturing will grow modestly (37% to 2050), also due to
efficiency gains and greater use of electricity. Rising
living standards and a growing population will see
heating and cooling services spreading to new segments,
resulting in a 67% increase in buildings' energy use
(Figure 9.2.2). This growth is predominantly going to be
powered by electricity.
9.2 LATIN AMERICA
240
DNV Energy Transition Outlook 2022
241
Regional transitions CHAPTER 9
Renewables
Today, Latin America has already one of the highest
shares of renewable power generation among the
regions, with hydropower, the largest such source,
supplying 46% of total power production. However, by
2050, hydropower will have lost its present ranking, with
its 20% share in mid-century surpassed by both wind
(32%) and solar (38%). While in 2020, 56% of electricity
generation was through renewables dominated by
hydropower, 42% was through fossil fuels, with a major
share from natural gas-fired plants. Wind was responsible
for about 6% and solar provided less than 2% of electricity
generation.
We forecast that solar power will grow significantly in the
coming decades, providing almost 15% of power genera-
tion in 2030, and almost 40% by 2050 (Figure 9.2.3). Wind
power will increase at a similar pace, with a share of 25%
by 2030 and 42% by 2050, it is going to provide a
substantial proportion of Latin America’s future electricity
needs along with solar. At the end of our forecast period,
fossil fuel-based electricity production in the region will
have reduced to 7% of the total.
Given the near-perfect conditions for solar power in the
Atacama and Chihuahua deserts in Latin America,
countries such as Chile, Argentina and, in part, Brazil are
investing in solar power to decarbonize energy and other
sectors. Wind is strong in Brazil, the country being third
for wind installations in 2021 in terms of installed capacity,
indicating the huge potential in this part of Latin America
for wind power to support the region’s decarbonization
pathway.
Hydrogen
Mindful of the region’s energy transition being mainly
driven by strong electrification through solar and wind
power growth, Latin American countries are also heavily
investing in renewable hydrogen. Today, Latin America
needs about 5% of the world’s hydrogen output for its
manufacturing sector, but produces only about 2% of the
global figure, almost entirely from unabated fossil fuels.
This will change significantly in the next three decades.
Electricity will drive decarbonization of sectors fit for
electrification. However, with abundant renewable
resources, hydrogen is seen as an opportunity for Latin
America to become an exporter of hydrogen to Europe,
North America, and Asia; and, to a lesser extent, a
producer of hydrogen for domestic decarbonization.
Latin American countries are developing plans and
starting investment to scale up production and prepare
for export of low-carbon hydrogen from solar and wind
power. Electricity from solar and wind, together with
hydrogen as low-carbon fuel, are seen as Latin America’s
transition pathway away from oil and gas while also
offering significant export potential. However, significant
uptake of hydrogen production is only envisaged to start
in the next decade, as costs will need to continue their
decline, and governments need time to establish the
many frameworks enabling hydrogen production, export
and potential domestic use.
From the late 2020s, hydrogen produced by electrolysis
powered by dedicated renewables will start dominating
hydrogen production. In 2040, almost 31% of the total
hydrogen produced will be green hydrogen, and 46% in
2050. Thanks to high capacity factors, Latin America will
have the lowest levelized cost for solar-powered hydrogen
production. In fact, the region’s solar-based hydrogen is
cheaper than most of its competitors, such as wind-based
hydrogen (Figure 9.2.4). From 2040 on, solar-based
hydrogen production will be competitive with natural
gas-based hydrogen production at around 2 USD/kg.
The same applies to grid-based hydrogen production.
Wind-based hydrogen production will remain slightly
costlier then solar based on average in Latin America.
However, at promising wind sites, the levelized cost of
hydrogen might be even lower than for solar-based
hydrogen.
Given the low levelized cost of hydrogen production and
the vast potential for solar power exploitation and
promising wind resources, Latin America will become a
major hydrogen exporter. We forecast that about 25 MtH2
of hydrogen and its derivatives will be exported from
Latin America by 2050. A substantial majority will be
exported as ammonia and for energy purposes (75%).
Almost half of this will be shipped to North America
supporting regional hydrogen ambitions of increased
use there. The remainder will go to Asia and Europe.
To realize these projections, the region must properly
plan the challenging part of this undertaking: hydrogen
transport. And it appears that it will do so, including
pipelines for intraregional distribution of hydrogen, and
export terminals for hydrogen conversion to ammonia.
Latin America’s strong natural gas pipeline network will
be repurposed for hydrogen to support the ambitions.
Biofuels
Those export plans will also be supported by a lower
uptake of hydrogen domestically as Latin America not
only holds the potential to supply other regions with
green hydrogen from solar and wind, it also has great
potential to further displace imported fuels with biofuels
like bioethanol, biodiesel and biogas/biomethane.
Brazil`s sugarcane ethanol programme, launched in 1975,
Argentina’s soya biodiesel, and Colombian palm oil
biodiesel are prime examples of the region’s success in
providing renewable alternatives to fossil fuels. Today,
only Venezuela has no biofuel mandate in Latin America,
partially due to its domestic oil production. Latin American
countries are promoting biofuel use through strong
mandates with high blend rates of ethanol and biodiesel.
The region’s share in upgrading its biogas to biomethane,
which has a better overall supply-chain footprint, is very
high. Currently, about 30% of Latin Americas biogas
production is further refined to biomethane (IEA, 2020).
By 2050, the region will produce about 8 Gm3
of
242
DNV Energy Transition Outlook 2022
243
Regional transitions CHAPTER 9
biomethane and thus replace 2.5% of its total domestic
methane demand.
As a result of those ambitions and the associated energy
transition going forward in Latin America, use of oil for
energy, the region’s largest such source today, will
decline by a quarter. In addition, growth in the use of
natural gas for energy will stall soon and will not overtake
oil as the largest primary energy source within the
forecast period (Figure 9.2.5). Biomass, in the form of
liquid biofuels in transport, as a gaseous energy carrier
substituting natural gas, and as solid biomass in the
buildings sector, will increase in importance towards
2050 and support Latin America’s energy transition.
Latin America has great potential to displace
imported fuels with solar, wind, and biofuels
like bioethanol, biodiesel and biogas/
biomethane.
Emissions
The region’s average carbon-price level is projected to
increase to USD 25/tCO2
in 2030, and USD 50/tCO2
by
2050. There are carbon-pricing schemes, such as taxation
in Argentina, Chile, Colombia, and Mexico. Pricing is
presently low but additional pricing instruments are
under consideration, such as in Brazil (see section 6.4).
Higher pricing could also come to avoid carbon-border
adjustment mechanisms from large trading partners —
e.g. China and Europe, both of which have carbon pricing
in place and are seen as possible trade partners for,
among other products, low-carbon hydrogen.
Latin America’s energy-related CO2
emissions peaked
around 2015. They will decline further through the 2020s,
stabilize in the 2030s, then fall to 14% less than today in
2050 (Figure 9.2.6). The decline will occur in all main
demand sectors, driven by efficiency gains, a changing
energy mix, and to a smaller extent by carbon capture.
Today and in the future, oil contributes most to emissions,
and is mainly used in Latin America’s transport sector.
The natural-gas dominated manufacturing and buildings
sectors together contribute another third to Latin
Americas emissions in 2050. By then, CCS will reduce
CO2
emissions by 51 Mt in mid-century, equivalent to
around 3% of the region’s emissions by then.
In the context of global climate policy, country NDC
pledges indicate an increase in the regional target of
limiting increases in emissions to about 88% by 2030,
relative to 1990. Our Outlook shows energy-related
emissions rising 56% over the same 40-year period. This
suggests that the regional target will be achieved by a
good margin, indicating a low level of ambition.
Note that there are uncertainties in comparing targets
and forecasts. Some countries are unclear about whether
targets in NDCs also include non-energy related CO2
emissions. Especially in Latin America, there is a large
difference between targets including and excluding
LULUCF (Land Use, Land-Use Change and Forestry) due
to the influence of rainforest on the total emissions.
By 2050, the region is expected to reduce energy-related
emissions by 11% compared with levels in 2020, and will
be emitting 1.3 GtCO2
per year at that time. Latin America's
1.9 tCO2
per person emissions level in 2050 is comparable
to those in India and South East Asia, and is 15% lower
than the region's current level. Also note that some Latin
Americancountries,includingBrazil,Argentina, Colombia,
and Chile, have indicated — or have already adopted
— carbon-neutrality targets by 2050 or 2060. However,
these targets often take into account the land and
forestry sector, which means CO2
uptake from rainforest
areas are included.
245
244
Regional transitions CHAPTER 9
DNV Energy Transition Outlook 2022
Economy-wide economic signals — the rise in average
region carbon prices to USD 50/tCO2
in 2030 and USD
100/tCO2
in 2050 – are reflected as costs for fossil fuels.
Transport — A steep reduction in Latin America’s road
transport emissions is partly achieved by completely
banning the sale of ICE passenger vehicles in 2044, with
restrictions on the sale of ICE commercial vehicles
beginning in 2043. Simultaneously, electricity for vehicle
propulsion is subsidized by 10% of its average price from
2022, thus incentivizing investments in EVs.
Buildings − A partial ban of new fossil-fuel equipment for
buildings, along with a subsidy of 10% of the electricity
price for buildings, drives emissions reductions in this
sector. Additionally, 17% higher capital costs for oil and
natural gas-fuelled equipment of commercial buildings,
and 20% more for coal-burning equipment, also deters
investment and locking-in of these technologies, while
reducing emissions.
Manufacturing − Electricity and hydrogen as energy
carriers are subsidized by 10% compared with their
average price, and biomass by 30%. Similarly, the
capacity cost of electric heaters (including heat pumps)
is reduced by 4% from 2022.
Energy supply − The increasing cost of capital for coal,
oil, and natural gas power plants, among other policy
levers, leads to elimination of CO2
emissions from the
power sector by 2050. A gradual reduction in the cost of
capital of non-fossil power plants catalyses investment in
renewable power plants. More importantly, support for
investing in power storage capacity also rises, which
encourages investment in VRES. Investing in oil and gas
capacity additions in the region is banned from 2028.
PNZ – Policy levers
PNZ – Latin America
The pathway to net zero (PNZ) for Latin America sees CO2
emissions reducing from 1.5 Gt in 2020 to 0.3 Gt in 2050
(Figure 9.2.7). By 2050, final energy demand increases
30% compared with a 50% growth in the ETO. By then,
the manufacturing sector will have moved into negative
emission territory by using biomass and CCS. Latin
America will capture about 370 MtCO2
in 2050. This
compares with the 70 MtCO2
we forecast in our ‘most
likely’ future (ETO forecast) for Latin America in 2050,
clearly showing how CCS can boost emissions reduction.
Transport will remain the sector with the highest net
emissions, and road transport in particular despite the
high share of biofuels in Latin America. Oil use in Latin
America’s transport sector reduces from 85% now to
32% in the coming three decades. The gap is filled by
electricity, providing 44% of 2050 energy demand in
transport, and pure hydrogen (3%) and e-fuels (5%).
Electricity’s share in final energy demand increases from
19% in 2020 to 50% in 2050; hydrogen’s share rises from
almost zero to 5% by then. Half of the primary energy is
supplied by solar and wind in mid-century (Figure 9.2.8).
Hydrogen export is accelerating in our PNZ as well.
Export volumes to North America and Europe are
doubling compared with our ETO-forecast.
The PNZ sees Latin America producing 50% more
hydrogen than in our ETO forecast. There is no more
unabated hydrogen production from fossil fuels, but a
significant increase in dedicated renewable-based
hydrogen.
Half of the primary energy is supplied by
solar and wind in mid-century.
246
DNV Energy Transition Outlook 2022
247
Regional transitions CHAPTER 9
Policymakers in Europe are struggling to stay united and
balance the needs of the energy transition with the
supply and energy price crises arising from Russia’s
invasion of Ukraine. Energy systems resilience is a
significant concern given reliance on Russian oil and gas,
while other commodities needed for the energy transition,
such as primary and rare earth metals, are also dependent
on international supply chains.
The European Commission’s REPowerEU Plan outlines a
host of initiatives aimed at ending the dependence on
imported Russian fossil fuels by 2027. It builds on the full
implementation of the Fit-for-55 proposals, and proposes
going further, with higher renewable energy and energy-
efficiency targets. The Commission’s analysis indicates
that REPowerEU entails additional investment of EUR 210
billion between now and 2027.
The EU’s emergency gas rationing plan had Member
States agreeing to a best-efforts reduction of 15% in
natural gas demand by end of March 2023, compared
with average consumption over the previous five years.
This target is intertwined with the objective to fill EU gas
storage to 80% of capacity before 1 November 2022,
which has been achieved.
Near-term energy security imperatives are leading
several European policymakers to revisit energy policies
related to the phase-out of nuclear and coal-fired power.
For nuclear power, life-time extensions are being mooted
to plug energy deficits, while ramping up coal power
generation to keep lights on over the winter is on the
table.
Rising fuel and electricity costs across Europe are leading
to increased subsidies for both industrial and domestic
consumers. This requirement is likely to feature as a key
element of the European energy transition moving
forward to ensure it can be conducted in a just manner
across society.
− The Ukraine conflict will trigger measures to increase
energy efficiency and plans to increase the share of
renewables, hydrogen and nuclear in the energy mix.
This will result in an accelerated decarbonization
trajectory overall.
− The EU is developing new hydrocarbon and base/rare
metal alliances with suppliers in the US, Middle East,
Africa, and South America. Gas imports by pipeline
and as LNG will make up the bulk of the shortfall in
Russian gas, e.g. the EU aiming for about 50bcm of
additional US LNG until at least 2030 (compared with
22bcm in 2021).
− To help displace Russian gas, the Commission has set
2030 targets of 10 Mt/yr of domestic renewable
hydrogen production and 10 Mt/yr of renewable
hydrogen imports. The Commission plans to support
the development of three major hydrogen import
corridors (via the Mediterranean, the North Sea area,
and eventually with Ukraine).
− REPowerEU proposes to raise the collective EU
Renewables Directive 2030 target for the share of
renewable energy to 45%, up from the previous 40%.
To speed up deployment, the region will establish
dedicated ‘go-to' areas for renewables with shortened
and simplified permitting processes in areas with
lower environmental and social risks.
− The EU Solar Energy Strategy targets over 320 GW of
solar PV capacity by 2025 and almost 600 GW by 2030.
The EU aims for 50% of its electricity from wind by
2050, expanding onshore wind from 173 GW today to
1,000 GW; and its Offshore Energy Strategy targets 60
GW wind by 2030 and 300 GW by 2050. More variable
renewables will require significant grid reinforcement
and energy storage solutions such as batteries,
power-to-x and hydrogen.
Characteristics and current position Pointers to the future
9.3 EUROPE (EUR)
This region comprises all European countries,
including the Baltics, but excluding Russia, all the
other former Soviet Union Republics, and Turkey
Population (MN) GDP/person (USD)
GDP* (USD TRN)
Energy-related emissions/person (T)
Energy-related emissions (GT)
2020
2050
Energy use/person (GJ)
Energy use (EJ)
541 38 800
21.5
5.4
2.9
121
66
538 57 500
31.5
1.2
0.6
97
52
*All GDP Figures in the report are based on 2011 purchasing power parity and in 2017 international USD
248
DNV Energy Transition Outlook 2022
249
Regional transitions CHAPTER 9
Energy transition:
a frontrunner striving for
energy independence
Europe was the home of the Industrial Revolution which
led to the extensive use of fossil fuels. Although the
region accounted for only 11% of global energy use and
9% of global CO2
emission in 2020, its share of total
accumulated emissions since 1750 has been estimated at
around 23% (Global Carbon Project, 2022). Europe is and
will be at the forefront of the energy transition. The region
is aware of its historical responsibility for climate change
and has decided to act accordingly to contain the impact
of climate change. The transition is also driven by the
need and will for more energy independence, an issue
that has recently intensified with the impacts of the war in
Ukraine, but has long been a key driver of energy-
efficiency targets.
The transformation will be mainly driven by resolute
policies from the EU. Russia’s invasion of Ukraine creates
short-term uncertainty for the transition but will likely
lead to a faster transition in Europe. In the coming
decades the European energy system will undergo an
energy transformation more profound than that of any
other region, affecting every sector of the region’s
economies and the daily life of every citizen.
Primary energy use
Figure 9.3.1 shows the evolution of primary energy
consumption in Europe. Its energy transition is already
incontrovertibly underway; in the three last decades, the
fossil-fuel share in primary energy consumption declined
from92%to70%,mainlyduetoreducedcoalconsumption.
We forecast that the three next decades will bring even
greater transformation, and fossil fuels will represent only
28% of the primary energy mix by 2050.
The progressive phase-out of fossil fuels, mainly due to
massive electrification and renewables uptake will lead to
a significant decrease of primary energy consumption,
from 66 EJ in 2020 to 52 EJ in 2050.
As the Ukraine war has highlighted, Europe is far from
being an energy independent region. As shown in Figure
9.3.2, neither regional natural gas nor oil production,
mostly in Norway and the UK, cover European needs. In
2020, Europe was 68% dependent on oil and 61% on
natural gas, corresponding to 39% of its primary energy
consumption. This situation is expected to remain similar
in the near-term future. It should be noted that the
Ukraine war has strongly impacted our forecast for
natural gas consumption in Europe. It is now 170 Gm3
in
2050, versus 310 Gm3
in our last year’s edition, reflecting
our analysis that the war will have an accelerating effect
on the energy transition in Europe (see Chapter 1). The
strong decrease in demand will mean that total imports
will decrease by 61% for oil and 64% for natural gas from
2020 to 2050.
Coal consumption is supplied more by local production,
Europe producing the equivalent of 80% of its needs
(2010-2020 average). But there is variation in the qualities
of coal from different sources, and the EU has a noticeable
import dependency for hard coal used in iron and steel
production; 57.4% of this was imported in 2020, more
than half of it coming from Russia (Eurostat, 2022).
As a result of fossil fuel imports, Europe's energy trade
balance has been and is very negative, as shown in Figure
9.3.3, especially when Norway is excluded. But as Europe
progressively relocates energy production and
decreases its dependence on fossil fuels, the total cost of
fossil-fuel imports will eventually decline and remain
stable from the late 2030s. The positive effect on the
energy-trade balance reduction will be dampened by
imports of hardware like solar panels or lithium batteries
(not quantified here) from other regions, such as China,
which has invested 10 times more than Europe over the
last decade in new solar PV equipment supply capacity
(IEA, 2022c) and is the source of 75% of EU solar PV
imports (Eurostat, 2022). However, the value of imports of
solar PV equipment was only EUR 8 bn in 2020, far less
than the EUR 200 bn for fossil fuels, and future policies
are expected to mitigate the import bill by supporting
relocation of production in Europe.
9.3 EUROPE
250
DNV Energy Transition Outlook 2022
251
Regional transitions CHAPTER 9
Final energy demand
Final energy demand in Europe will change profoundly in
the next three decades, as illustrated in Figure 9.3.4.
Population in Europe will remain stable, around 540
million inhabitants, and GDP per capita will increase by
37%. In contrast, final energy demand will decrease by
21%, influenced by energy-efficiency gains and rapid
electrification. Fossil-fuel use will be increasingly
confined to a few sectors. Oil demand will decrease from
19 EJ in 2020 to 8 EJ in 2050 and will mainly come from
non-energy use in the petrochemical industry (40%) and
transport (37%). In the meantime, demand for natural gas
will decrease from 12 EJ to 5 EJ, with a strong remaining
demand for space and water heating (64%) and manu-
facturing (15%) to a lesser extent.
Electrification
Electrification is key to decarbonization, energy inde-
pendence and energy efficiency. European electricity
demand will almost double from 3.1 PWh in 2020 to 5.8
PWh in 2050. Road transport electrification will have one
of the most visible effects on everyday life. With strong
policies, like the EU ban on new ICE passenger vehicle
sales by 2035, the battery-electric vehicle share in the
total fleet is expected to increase from 1% in 2020 to 20%
in 2030 and 96% in 2050. Some countries like Norway will
transition even faster in this regard, with EVs reaching a
42% share there in 2030. Use of electricity for commercial
vehicles is more challenging, and almost non-existent
today, but their share will reach 11% by 2030 and 74% in
2050. Road transport will account for an increase of 900
TWh in annual electricity demand in the next three
decades, equivalent to a third of today’s total electricity
demand in Europe.
The remaining increase in electricity demand is shown in
Figure 9.3.5. In the coming decade, most of this growth
will come from the traditional end-uses (buildings, road
transport and manufacturing). Hydrogen production from
on-grid electricity will pick up in the late 2030s and
represent the second biggest increase in electricity
demand after 2030.
The generation of electricity from renewable sources will
be the key enabler of both electrification and decarboni-
zation, and with acceleration policy, such as set by the
REPowerEU, 2030 renewable generation capacities are
envisioned at 1,236 GW compared with 1,067 GW under
the Fit-for-55 proposal. We forecast a lower total of 1000
GW of renewable capacity by 2030 for the whole region,
corresponding to a 370 GW additional capacity
compared to 2020 level, with similar increases around
170 GW for solar PV and wind. Managing this increase will
be a challenge from both the power generation and grid
perspectives. Although common regional guidelines and
financing regulation like the EU green taxonomy and
carbon pricing are in place to achieve decarbonization
objectives, different national strategies will be imple-
mented, depending on natural resource potential, local
incentives, and industrial policies.
The Iberian Peninsula has for example an ambition to use
its solar and wind potential to become a renewable hub
for Europe, with increased electricity connection to the
rest of the continent. Northern Europe will invest more in
wind power due to local potential and having less
potential for solar. The North Sea is a prime location for
offshore wind, and investments will continue to flow into
the region, both for fixed and floating wind turbines.
Nuclear energy, though controversial, will remain strong
in historical users like France, the UK and Eastern European
countries, but is unlikely to develop at large scale in new
countries.
As a result, the power mix shown in Figure 9.3.6 is diverse,
but will be almost decarbonized by 2050. However, we
forecast wind power to be the most important renewable
power source by mid-century, representing almost half
(48%) of total electricity generation in 2050, indicating
that Europe almost achieves its target. This is the largest
share of all regions, clearly above global average (31%).
Europe has one of the most interconnected power
networks, but grid build-out will also continue to accom-
modate this growth and keep on balancing the grid.
Total power line length with double by 2050, and inter-
connection withneighbouring regionswillgrowfourfold,
enabling both grid balancing and reliable power supply.
Climate change will affect energy demand for space
cooling and heating in buildings in Europe, and ironically
help the region in decreasing its reliance on oil and
natural gas in the sector. Milder winters will mean less
need for heating, and stricter insulation standards will
further reduce the demand. As shown in Figure 9.3.7,
space cooling is powered by electricity only, while space
heating was traditionally fossil dominated. As detailed in
Chapter 1, space heating is now also electrifying. Uptake
of heat pumps, further incentivized by RePowerEU, and
their increasing efficiency will be major factors in reducing
energy demand from space heating. On the other hand,
heatwaves as in the summer of 2022, and a more general-
ized rise in temperatures, will drive a doubling in demand
for space cooling between now and 2050. Thus, overall,
252
DNV Energy Transition Outlook 2022
253
Regional transitions CHAPTER 9
demand for fossil energy will decline from 8.3 EJ in 2020
to 4.5 EJ in mid-century, and electricity will rapidly
overtake natural gas as the main source of energy,
representing 55% of the buildings sector's energy
demand in 2050 versus 34% today.
Decarbonizing industry
In the manufacturing sector, Europe will also be the main
laboratory for the necessary decarbonization in heavy
industries like iron and steel, cement, and petrochemi-
cals. These hard-to-abate industries need reinventing to
achieve the deep reduction in CO2
emissions that we
forecast for the sector — from 663 MtCO2
in 2020 to 60
MtCO2
in 2050. The region will deploy a range of measures
to support and enforce this transition. Main drivers of the
transition will be the EU-ETS, phase-out of free allowances,
and supplementary carbon fees in region countries.
Carbon pricing will be the key economic instrument to
incentivise emissions reduction, however, it will be
coupled with support from the EU innovation fund to
cover EU-producer's decarbonization costs. European
industry is subject to global competition, which means
that policies must be carefully designed to avoid a
decrease of competitiveness and job losses. We assume
the implementation of an efficient carbon-border
adjustment mechanism (CBAM), which is currently in
advanced negotiations in the EU, to avoid carbon leakage.
Decarbonization is already a challenge for manufacturing
inEurope,whichiswalkingafinelinetoremaincompetitive.
The current high energy prices due to the war in Ukraine is
a hard blow to the sector, which today covers 32% of its
energy demand with natural gas and 31% with electricity.
In our current assumptions, the war will have a minimal
impact on the sector’s total output. But long-term effects
of high energy prices are still hard to foresee, and the
duration of this period will be decisive for whether the
downturn is short or will inflict more permanent damage.
Fossil fuels will be replaced where possible, typically
when low and medium heat requirements allow for the
use of competitive heat pumps. The manufactured goods
subsector, 45% reliant on fossil fuels in 2020, is well-suited
for this transition. Fossil fuels will be less than 4% of the
subsector’s fuel mix in Europe by 2040 compared with
36% in the rest of the world.
Other subsectors have different constraints, and even
though most European industrial sites are ageing, the
retrofitting of existing fossil-fuel based installations is
often preferred. For instance, cement kilns operate at
1450°C, and have traditionally relied on coal and petcoke.
But over the past decades, the European cement industry
has progressively replaced them with alternative fuels,
namely plastic waste and discarded tyres. Cement plants
get paid as any regular waste energy recovery plant for
that service, usually between 0 and 100€/ton. The share of
alternative fuels in the energy mix for cement making was
31% in 2019 (GCCA, 2022) and will continue to increase as
they usually represent a substantial source of revenue for
cement producers. With the additional burden of
unavoidable process emissions, the European cement
industry will mainly turn to carbon capture and storage
(CCS) for decarbonization.
Manufacturing will drive the deployment of carbon
capture, which will also be adopted for powering
production of ammonia, iron and steel. The EU Innovation
Fund finances up to 60% of the additional investment and
operational costs of large-scale carbon capture projects,
focusing on Projects of Common Interest (PCIs) and
supporting chains to benefit several industrial installations
— for example, the Northern Lights and Porthos projects in
Norway and the Netherlands, respectively. Several EU
and non-EU countries (e.g. Denmark, Germany, the
Netherlands, the UK) have carbon capture policies to help
achieve net-zero ambitions. The Longship project in
Norway, the most advanced large-scale commercial
capture project, will start operating in 2025. Captured
emissions from a cement plant and a waste incinerator in
Norway, and from a fertilizer plant in the Netherlands, will
be stored under the Norwegian continental shelf. Dozens
of other projects are ongoing in Europe, and as shown in
Figure 9.3.8, carbon capture in manufacturing will quickly
grow to 60 MtCO2
per year in 2030, covering 3% of the
sector’s energy-related and process emissions. Continued
growth thereafter will see nearly 200 MtCO2
per year
being captured in 2050.
Hydrogen, a future major energy carrier
Compared with in other regions, Europe’s manufacturing
sector will also favour using hydrogen for energy. 6.1 Mt of
hydrogen will supply 11% of its energy by 2050 versus 6%
in the rest of the world. Hydrogen will be used as a
decarbonized heat source both in pure form and mixed
with natural gas, and in iron and steel production. Making
iron and steel is today heavily reliant on coal as a reducing
agent. The subsector’s share of coal demand in Europe
will grow from 22% in 2020 to 36% in 2050. However, total
coal demand for steel production will decrease by two
thirds due to increased use of electric arc furnaces and the
uptake of decarbonized hydrogen as a substitute for
reducing iron ore. This method, referred to as direct
reduced iron (DRI), will represent a large share of the new
investment in European steelmaking. The first commercial-
scale production by Hybrit in Sweden in 2021 will rapidly
be followed by larger-scale projects. Arcelor has for
instance announced the replacement by 2027 of its
traditional blast furnaces by DRI in Dunkerque, France.
The plant will produce 2.5 million tonnes of so-called
‘green steel’ per year. As a result, hydrogen will cover 20%
of Europe’s steel industry energy demand by 2050,
double the equivalent share in the rest of the world.
Hydrogen will not only be used as an energy carrier in
manufacturing. It will be used in similar quantities in
buildings for heating space and water, growing to 0.6 Mt
in 2030 and 6.3 Mt in 2050. Indeed, most countries in
Europe have an extensive natural gas distribution network
that can be retrofitted to accommodate hydrogen
transport. Hydrogen will initially be blended with natural
gas for maximum compatibility, and hydrogen’s use in
pure form in buildings will develop from 2030. From the
late 2030s, demand for hydrogen for road transport will
also pick up to decarbonize long-distance trucking and
represents 3.6 Mt in 2050.
Some countries in the region (e.g. Germany) are expected
to develop into large-scale importers of hydrogen, with
others becoming exporters or transit hubs. Several
countries in the region have their own strategies and
targets for installed hydrogen production capacity by
2030 to support the EU goals: for example, Denmark
(4–6 GW), France (6.5 GW), Italy (5 GW), Germany (5 GW),
and Spain (4 GW). Targets are supported by government
CAPEX funding as well as measures to stimulate offtake,
such as evolving Carbon Contracts for Difference.
However,theregionisforecasttofallshortofEUambitions,
which has a strategy for at least 40 GW electrolyser
capacity installed by 2030 (6 GW by 2024), 10 Mt of
domestic renewable hydrogen production, and 10 Mt of
renewable imports by 2030 in REPowerEU. As represented
in Figure 9.3.9, total production of pure hydrogen as an
energy carrier will reach 3.5 Mt in 2030 and 23 Mt in 2050.
254
DNV Energy Transition Outlook 2022
255
Regional transitions CHAPTER 9
An additional 1 Mt will be imported yearly by pipeline by
2050, mostly (90%) from Middle East and North Africa.
DedicatedinstallationsusingsolarPVorwind willdominate
initially in the production of decarbonized hydrogen.
Over the forecasting period, wind will account for around
60% of the dedicated production from renewables and
solar for 40%. As for power generation, the choice will
depend on national specificities. From 2040, new added
capacity will be mainly grid-connected electrolysis. By
that time, the European power mix will be dominated by
non-fossil sources. Bigger variations in electricity prices,
with periods with low and even negative prices due to
high renewables power generation, will make grid-
connected electrolysis a viable alternative. As for
hydrogen produced from steam methane reforming
(SMR) of natural gas with carbon capture, although it will
be an attractive option in the early phase of hydrogen
uptake because of the maturity of the technology, this
technology will struggle to be cost-competitive in Europe.
Hydrogen derivatives (ammonia, methanol and e-fuels)
will also be produced to serve as energy carriers in the
maritime and aviation subsectors. Ammonia production
currently relies on SMR, and and SMR with CCS is likely to
account for 84% of the production in 2050.
A last stronghold for fossil fuels
The only sector where demand for fossil fuels will remain
strong in the coming decades is non-energy, referring to
the use of fossil fuels as feedstock for plastics, chemicals,
fertilizers, and so on. It will increase to from 4.1 EJ in 2020
to 4.8 EJ in 2030, plateau in the 2030s and then slowly
decrease to 3.7EJ in 2050. This sector will be especially
important for oil, representing 35% of European oil
demand in 2050, versus 13% in 2020.
Plastics production has represented the biggest increase
in non-energy demand over the last decades. With 79 Mt
of plastics demand in 2020, plastics production represents
the largest share of energy demand in the sector. And
despite strong reduction and substitution of demand,
production will continue to increase to 93 Mt per year in
2030, before returning to 2020 levels in 2050. Used
plastics represent an important source for recycled
plastics or fuels. Recycling schemes are well-developed,
supported by the EU Waste Framework Directive which
provides guidance and sets objectives to improve waste
management. But cradle-to-cradle recycling is still
limited and 8 Mt of secondary plastics were produced in
2020, covering only 10% of plastics demand. The recycling
sector is however booming, boosted by high oil and gas
prices as well as the implementation of increasingly
extended producer responsibility schemes and their
corresponding improvements in collecting and sorting.
Europe will maintain its leading role in plastics-to-plastics
recycling, mainly mechanical recycling, and output of
secondary plastics will progressively reach 27 Mt per year
in 2050. Chemical recycling via pyrolysis or similar
technologies is able to provide a solution for a wider
range of waste plastic feedstock, including waste of lower
quality, while delivering high quality (e.g. food grade)
output. The industry is, however, still in its teething stages
and will have to innovate to ensure cleaner sources for the
thermal energy required as well as with the safe handling
and valorization of hazardous chemicals. Nevertheless,
we conservatively estimate that, by 2050, chemical
recycling will produce 200 PJ of petrochemicals that
could replace fossil fuel-based virgin resin or be put to
other uses.
256
DNV Energy Transition Outlook 2022
257
Regional transitions CHAPTER 9
In Chapter 1, we described how Russia’s invasion of
Ukraine is impacting the energy transition. In addition to
Ukraine and Russia itself, Europe is by far the region most
affected, economically and politically.
At the outset of the war, Europe’s energy system was
highly dependent on imports of energy from Russia, the
largest exporter to the EU of natural gas, oil, and coal.
Halting and finding alternatives to these imports is both a
top EU and wider European priority. But the task is
fraught with difficulties. Replacing Russian natural gas is
the greatest challenge, as there is currently insufficient
infrastructure (such as LNG terminals) to replace piped
Russian gas with supply from other countries. DNV
(2022b) gives an overview of how the gas is likely to be
replaced, and the impact this will have on the energy
transition in Europe.
Before and independent of the war, EU decarbonization
targets — 55% less emissions by 2030, and net-zero in
2050 (e.g. see summary in DNV, 2021a, p 184) — had
already set out the EU priorities and actions.
The war catapulted energy security to the top of the EU’s
energy priorities, but without sustainability and afforda-
bility being downgraded in importance. Energy security
and sustainability often pull in the same direction.
However, the EU is willing to make short-term sacrifices
on sustainability — such as firing up more coal plants — to
reduce and end dependence on Russian gas.
The main EU policy response is the REPowerEU Plan to
rapidly reduce dependence on Russian fossil fuels and
fast-forward the green transition. The main focus is on
“energy savings, diversification of energy supplies, and
accelerated roll-out of renewable energy to replace fossil
fuels in homes, industry and power generation”. This
includes a faster and larger build-out of solar PV and
wind, increased production of biomethane, massive
installation of heat pumps, policies to nudge demand-
reducing behavioural changes, construction of new LNG
import terminals, and domestic production and import of
hydrogen.
Our analysis (DNV, 2022b) is that this plan will succeed to
a relatively large degree, and RePowerEU is an important
part of the policies we have factored into our assessment
of the energy transition in Europe. The war in Ukraine
looks set to be a protracted struggle, but sanctions on
Russia will last much longer still. Although the eventual
outcome of the war is unknown, one certainty is that
Europe will become much more energy independent and
will do so by decarbonizing more rapidly.
Energy security and Europe’s energy policy response to
Russia’s war on Ukraine
Emissions
Our projection for the regional average carbon-price
level is USD 95/tCO2
in 2030 and USD 135/tCO2
by 2050.
Europe has established carbon pricing nationally and
regionally, with clear upward pricing trends, and the EU
ETS is a main tool to finance the transition cost (see
Section 6.4).
EU and UK NDC pledges target 55% and 68% reductions,
respectively, in CO2
emissions by 2030 relative to 1990.
Our forecast does not include country-specific, non-
energy-related CO2
emissions, and Europe is larger than
the EU. With that caveat, we see Europe’s energy-related
emissions down 48% by 2030 relative to 1990, more than
the EU’s initial Paris Agreement pledge of 40%, but
certainly less than 55%. We forecast that Europe will have
reduced its energy-related emissions by 79% between
2020 and 2050, at which point it will be emitting 0.6
GtCO2
per year, therefore falling short of net-zero
pledges prevalent among region countries.
Figure 9.3.11 shows transport and manufacturing reducing
emissions the quickest. In manufacturing, this is mainly
due to declining use of coal and gas, as the role of
cheaper green electricity increases. Emissions from oil
will be the largest, and represent a constant yearly share
of around half of CO2
emissions in the next three
decades. Emissions from coal use will decline rapidly,
almost disappearing as coal use will dwindle. Those from
oil will gradually decline by 2050 to about a quarter of
today’s level, primarily because of lower oil use.
Overall energy-related emissions in 2050 are 646 MtCO2
after CCS has captured and stored 179 MtCO2
, which
captures 22% of Europe’s energy-related emissions in
2050. CCS — though limited in Europe — is still capturing
the largest such share among all regions. CCS will not be
a big enough industry to counter carbon emissions, even
with a 135 USD/t carbon price. In relative CO2
emissions,
Europe’s 1.2 tCO2
/person is well below world average.
-
259
258
Regional transitions CHAPTER 9
DNV Energy Transition Outlook 2022
Economy-wide economic signals − The rise in average
region carbon prices, to USD 150/tCO2
in 2030 and USD
250/tCO2
in 2050, is reflected as costs for fossil fuels.
Transport − The sale of ICE vehicles in both passenger
and commercial segments is banned from 2035, and
Europe together with OECD Pacific have the most
stringent policy measures in road transport, in tandem
with subsidized electricity prices for EV propulsion.
Buildings − The reductions in CO2
are achieved because
of a mandated partial ban of 50% on fossil-fuel equipment
in buildings by 2050. The lifetime of new fossil-fuel
equipment halves (from 15 to 7.5 years), which also
enables a faster phase-out of fossil fuel. Commercial
buildings face higher cost of capital if they have fossil-fuel
equipment.
Manufacturing − Electricity and hydrogen both have
CAPEX investment support of 50% for iron ore reduction,
along with a mandated, 100% share of EAF in steel
production in 2050. Electricity-based heating is incenti-
vized by a subsidy of 10% of the electricity price, while a
tax of 25% is added on top of fossil-fuel price, assisting
the transition to biomass.
Energy supply − New oil and gas exploration and
development are banned from 2024. Grid electricity is
subsidized when used for hydrogen production, in
addition to CAPEX support of 25% for dedicated
renewables-based electrolysis.
PNZ – Europe
Our pathway to net zero (PNZ) sees Europe's CO2
emissions dropping from 2.9 Gt in 2020 to -0.1 Gt by 2050
(Figure 9.3.12), and to -0.4 Gt with direct air capture
(DAC). Europe achieves its net zero ambition in 2043.
Europe backs up pledges with real policy, translating into
the highest carbon-price level among regions, and
enabling CCS to have a faster ramp up rate to capture 376
MtCO2
in 2050, contrasted with 269 MtCO2
in the ETO
forecast.
Final energy demand decreases by 35% compared with
21% in the ETO forecast (Figure 9.3.13). Emissions from
buildings and manufacturing are negative from early
2040s, while some transport emissions remain also in
2050 (0.03 GtCO2
/yr).
Electricity and hydrogen meet 73% of final energy
demand by 2050, with region hydrogen demand at 122
MtH2
/yr contrasted with 37 MtH2
/yr in the ETO. The
power system has a 4.1 PW capacity in 2050, generating
9.8 PWh, with wind and solar PV accounting for almost
three-quarters of the production, compared with 2.5 PW
and 6.2 PWh in the ETO forecast.
By 2050, oil use for transport purposes has an 8% share,
compared with 29% in the ‘most likely’ future; and fossil-
fuel use continues as industrial feedstock (non-energy
sector). However, while Europe is projected to rely on fossil
fuels for 35% of its energy needs in the ETO forecast, its net
zero pathway sees the share declining to 7%.
Electricity and hydrogen meet 73% of final
energy demand by 2050.
PNZ – Policy levers
260
DNV Energy Transition Outlook 2022
261
Regional transitions CHAPTER 9
South Africa is the region’s largest coal producer. Nigeria
and Angola are among the world’s 20 largest oil producers,
and Nigeria is a top 10 LNG exporter. With major natural
gas reserves, East Africa (Tanzania, Mozambique) is
preparing for LNG projects with significant export
potential. Recent giant offshore gas discoveries have
been made in West Africa (Mauritania, Senegal) and in
the southwest (Angola, Namibia).
Ghana, Kenya and Rwanda are on track for full electricity
access by 2030. But the region as whole remains the least
electrified; two thirds of the population cook in inefficient
and polluting ways. Lack of energy infrastructure, and
power outages / load shedding, are major socio-
economic constraints.
The region has been made more vulnerable by inflationary
pressures, high energy and commodity prices distressing
food security, and climate change impacts. COVID-19 has
reduced foreign finance flows into non-hydro renewable
investments (IRENA and AfDB, 2022).
The region has rich, untapped wind, hydro, geothermal
and solar resources. Yet its share of global renewable
energy investment has been less than 2% between 2000
and 2020. IRENA (2019) estimates that average annual
investment in renewables must expand from some
USD 5 bn in recent years to USD 70 bn until 2030 for a
clean energy transformation to take place.
With the region’s infrastructure gap, rising public sector
debt, and state utilities’ poor financial performance, new
energy players play an increasingly important role.
Chinese-funded projects account for 60% of the region’s
hydropower investments (Ayele et al., 2021). The off-grid
sector had all-time high investment in 2021 (GOGLA,
2021). Independent power projects (IPPs) — privately
operated/financed power projects — are the fastest
growing energy sector investment structure (African
Business, 2022).
− Decarbonization will gain momentum in line with the
African Development Bank’s (AfDB) 2030 vision to
power and 'light up' Africa and the African Union's
Agenda 2063, but the pace of change is likely to lag
ambitions.
− Resource holders in the region remain committed to
natural gas, but funding flows from official development
assistance and development finance institutions are
likely to prioritize clean energy and energy efficiency,
suggesting that IPPs will shift towards renewables.
− The AfDB’s public-private partnerships (PPPs) strategic
framework and Development Fund will contribute to
private sector investment in the scale up of transport
and energy solutions, helping to close the infrastructure
financing gap.
− For new utility-scale power generation, the regulatory
environment offering long-term investment certainty
for IPPs will improve, exemplified by South Africa’s
Renewable Energy Independent Power Producer
Procurement Programme, doubling capacity (from
2600 MW to 5200 MW in Bid Window Six).
− The African Group of Negotiators on Climate Change
seek a just green transition via increases in grant
funding, concessional loans (without commercial
interest rates), and retraining and re-skilling of affected
communities and workers to benefit from transition-
related value chains. The Just Energy Transition
Partnership, with USD 8.5bn in funding from the EU,
France, Germany, the UK, and the US towards South
Africa’s transition from coal, will be a test case for
high-income countries delivering on funding pledges.
− Some countries will see green hydrogen production,
particularly for exports. Examples include Mauritania’s
10 GW Project Nour by 2030; Angola’s hydropower-
based renewable ammonia production; South Africa
targeting a 4% global market share by 2050 with 15
GW electrolysis capacity installed (2030–2040). The
region will rely on funding from international partner-
shipsandofftakeagreementstoadvancedevelopments.
Characteristics and current position Pointers to the future
9.4 SUB-SAHARAN AFRICA (SSA)
This region consists of all African countries
except Morocco, Algeria, Tunisia, Libya and
Egypt, which are included in the Middle
East and North Africa region
*All GDP Figures in the report are based on 2011 purchasing power parity and in 2017 international USD
Population (BN) GDP/person (USD)
GDP* (USD TRN)
Energy-related emissions/person (T)
Energy-related emissions (GT)
2020
2050
Energy use/person (GJ)
Energy use (EJ)
1.13 3 800
4.3
0.8
0.9
24
27
1.96 9 600
18.9
0.7
1.5
23
46
262
DNV Energy Transition Outlook 2022
263
Regional transitions CHAPTER 9
9.4 SUB-SAHARAN AFRICA
Energy transition:
from broad progress
to leapfrogging
Sub-Saharan Africa is home to approximately 15% of the
world’s population but presently accounts for about 5%
of global final energy consumption.
The region is not on track to bring affordable, reliable,
sustainable modern energy to all by the end of the
decade (Goal #7 of the UN’s 2030 Agenda for Sustainable
Development).Relianceonexpensiveoil-basedgeneration
makes the cost of electricity generation two to three
times higher than the global average (AfDB, 2017), and
energy shortages, an impediment to businesses and
people, are assessed to cost some 2-4% of GDP annually.
The International Renewable Energy Agency recently
summarized common objectives of the region’s energy
transition as follows: reaching economic diversification;
the creation of decent jobs; environmental stewardship
and climate resilience; and universal access to affordable,
reliable, sustainable, and modern energy (IRENA, 2022).
Renewable energy technologies offer promising least-
cost generation opportunities for achieving these
objectives. In some cases, so-called technology leap-
frogging may be possible. Affordable and reliable energy
is indispensable for a region with the largest youth
demographic in the world. With a population approaching
two billion people by the end of the forecast period, Sub-
Saharan Africa will have a large, young and tech-savvy
consumer and labour base, but the transition will be
long-haul and will play to individual country strengths
and diversity in resources.
Developments in energy demand sectors
The population will almost double while the region’s
economy quadruples over the forecast period. By 2050,
21% of the global population will be in Sub-Saharan
Africa and the region’s energy demand growth is
projected to increase by 90% from today’s level (Figure
9.4.1), while still representing only 8% of global energy
demand in mid-century.
Buildings
With a growing population, buildings will remain the
biggest source of final energy demand. They presently
constitute 68% of demand, and we foresee this declining
to account for 49% in 2050. Much of the buildings stock
existing by the end of the forecast period has yet to be
built, and we project the floor area of residential and
commercial buildings to expand by 131% and 261%,
respectively.
Energy demand in the sector will be driven by a combi-
nation of more residential/commercial space, a more
prosperous population, and improved standards of living/
comfort (e.g. air conditioning). Greater energy efficiency
will partially counteract this as the technologies meeting
the expanding energy needs will change so that energy
use of buildings increases by only 37%. Energy from mostly
inefficient traditional biomass, supplying 92% of energy
for use in buildings today, will decline to around 70% by
mid-century. Electric power (on-grid electricity and off-
grid solar PV) will expand to account for 17% of the energy
for buildings, as shown in Figure 9.4.2. An expansion in
off-grid solar PV solutions will fuel growth in the use of
appliances and lighting, accounting for 24% of this
segment's demand in 2030 and 45% by mid-century.
Manufacturing
The level of activity in the region’s manufacturing sector
is presently small with low levels of industrialization and
dominated by extractive industries and export of raw
materials with little further value added. The region is the
most commodity-dependent region in the world
(UNCTAD, 2021) and in 2019, Africa’s manufacturing
value added (MVA) per capita of about USD 207 was
about 12% of the global average (IRENA, 2022).
Expanding the manufacturing sector is essential for
diversifying economies, employment, and for reducing
vulnerability to swings in commodity prices and unbal-
anced trade. Primary goods (agricultural products,
minerals, metals, fossil fuels) dominate the region's
exports while manufactured goods make up the bulk of
Sub-Saharan Africa's imports. China and East Asia have
been capturing rising shares of the import content. China
has expanded economic relations to become the region’s
largest trade partner, accounting for 20% of total trade
value (IMF, 2019). 70% of region exports to China are
commodities while 20% of region imports are from China
in monetary terms, dominated by consumer goods
imports (45%). The Chinese government has built strong
ties with the region through foreign direct investment
264
DNV Energy Transition Outlook 2022
265
Regional transitions CHAPTER 9
and infrastructure projects. The Chinese Loans to Africa
(CLA) database catalogues Chinese lending with signed
loan commitments worth USD 160 bn with African
governments and state-owned enterprises between
2000 and 2020 (Boston University, 2022).
Manufacturing will grow strongly and its energy demand
will double from its present 12% share of energy end use
to reach 24% by 2050. Among the main demand sectors,
we project rises of 285% for manufacturing, 142% for
transport, and 37% for buildings. The increasing role of
the region’s manufacturing is illustrated by its share in
global manufactured output (measured in tonnes) more
than doubling from 3% in 2020 to 7% in 2050.
The manufactured goods subsector will experience a
227% growth in energy demand over the forecast period,
underpinned by electricity’s share in the energy-demand
mix growing to reach 25% in 2050, ahead of natural gas
(11%) and hydrogen (10%) combined in mid-century. Coal’s
share declines from 16% to 6%, as shown in Figure 9.4.3.
Strong growth in manufactured goods does not equate
to ‘carbonization’. Our findings support pay-off from
value-adding initiatives and blueprints — such as the
manufacturing-based industrialization central to the
African Union’s Agenda 2063 — and national strategies
like Kenya’s Vision 2030, Ghana’s Industrial Policy,
Emerging Senegal Plan, and Tanzania’s Sustainable
Industrial Development Policy. Our forecast is consistent
with a boost to policy efforts to strengthen intra-African
trade and economic cooperation. The African Continental
Free Trade Area (AfCFTA) agreement (signed 2018 and
operational July 2019) created a free trade area including
54 of the 55 African Union nations. Free access to
commodities, goods and services across the continent
will benefit manufacturing of goods in particular, by
nations removing tariffs for 90% of goods.
Transport
Transport energy demand presently accounts for 16% of
energy end-use and is 99% reliant on oil. In road transport,
the number of vehicles will increase almost three-fold
over the forecast period. Internal combustion engine
passenger vehicles (ICEVs) still account for more than
90% of sales of new vehicles in 2040, and though the
sales share declines to 26% in 2050, the fleet is still 68% oil
dependent then. Energy demand for transport purposes
will increase by 221%. Specifically, oil use in road transport
will increase by 127% because of the three-fold growth in
vehicle numbers. Road transport will remain dominated
by oil use with an 87% share of the subsector’s energy
mix, and electricity accounting for just 12%. While there
are some initiatives in electric mobility, there is a lack of
supporting policies, and the region’s electricity deficit
also hinders electrification of road transport.
Overall, our forecast for energy demand (Figure 9.4.4) in
Sub-SaharanAfricaindicatessomepositivetrends:asteady
use of biomass hides its declining share in the energy mix
(reducing from 66% to 40%), and a more than 300% rise in
electricity use to 2050 as its share increases from 7% to
15%. However, use of coal and especially oil expands,
both retaining much higher shares than natural gas, with
oil’s persistence reflecting a lack of gas infrastructure.
Energy use expanding — but no coal renaissance
Sub-Saharan Africa has the largest share of renewable
sources in its primary energy consumption (63%) of any
region, with heavy reliance on (mostly traditional)
biomass (60%) as seen in Figure 9.4.5. Over the forecast
period, coal consumption will increase slightly but oil use
is set to more than double (117%). The share of solar and
wind expands but will combined still only account for 9%
of primary energy consumption in 2050.
Hydrocarbons
There is a longstanding presence of international oil and
gas companies with Sub-Saharan Africa countries relying
on these players in the development of hydrocarbon
resources. The lived experience of the region’s oil-
producing countries tells a story where oil wealth has not
been successfully converted into diversified economies;
in both Angola and Nigeria, the region’s largest economy,
earnings from petroleum production make up 50% of
government revenue.
The region now has 5% of global oil production. By 2050,
this share will dip to 2%, underlining the need for diversi-
fication of revenue streams. The share of global natural
gas production will increase from less than 2% today to
4% mid-century. However, in the absence of significant
domestic natural gas demand growth, exports will
determine the commercial viability of developments in
Sub-Saharan Africa. Over the forecast period, the
region’s gas production will double, predominantly for
exports, which will take almost as much gas as is
consumed in the region (Figure 9.4.6).
266
DNV Energy Transition Outlook 2022
267
Regional transitions CHAPTER 9
Power generation — a leapfrog opportunity
While accounting for 15% of world population, the Sub-
Saharan Africa region today has less than 2% of global
installed electricity capacity. Some countries, for instance
France (136 GW), had more installed electricity capacity
than the entire Sub-Saharan region (132 GW) in 2020.
South Africa alone is home to 58 GW generation capacity
from all sources, with coal-fired capacity holding by far
the largest share in the national power mix (86% of all
Africa’s coal-fired generation capacity is found in South
Africa).
An important issue is whether Sub-Saharan economies
can close the electricity access gap without going
through the high-carbon phase that industrialized
regions have experienced. In other words, can and will
the region leapfrog straight onto a greener pathway with
low-carbon energy technologies?
Drivers of such a shift would primarily come from global
flows of capital seeking decarbonization, both from
public (multilateral development agencies and donor
government investments) and private investors.
Renewable energy targets are generally lacking in terms
of uptake requirements in demand sectors such as
transport. There are, however, targets focusing on the
power sector that aim for renewable power shares
around 30% to 40% by 2030, commonly supported by
feed-in tariffs. South Africa is a frontrunner in its auction
programme (tenders and competitive bidding) and
recently removed the cap on private power generation to
galvanize funding and a faster deployment of renewables
to provide relief from its failing and over-indebted
coal-fired power generation capacity.
Reflecting these important policy initiatives, but also
improving the competitiveness of variable renewable
energy sources (VRES), their share in the region’s on-grid
power mix will most likely be 9% in 2030, as reflected in
Figure 9.4.7. Green hydrogen production is still in its
infancy in Sub-Saharan Africa and will be supported by
bilateral government funding and offtake agreements.
Germany has taken a leading role in this regard, creating
links with the region, such as providing EUR 12.5mn to
promote production in South Africa, forming a green
hydrogen partnership with Namibia, and developing the
H2Atlas-Africa project with Sub-Saharan partner nations.
As seen in Figure 9.4.7 only a small share ofrenewable
electricityisforecasttogotogreenhydrogen production.
There will be trade to Europe, but at a very low level, given
competition and build-up of infrastructure, i.e. electro-
lyser capacity, in other regions also aiming to become
green hydrogen production hubs (see Section 9.2 on
Latin America).
A dramatic shift is predicted for the region’s power
systems. South Africa will be decommissioning coal-
fired plants and both coal and oil-fired generation are
set to decline across the entire region. Today, 65% of
on-grid generation is fossil-fired, hydropower accounts
for 27%, and other renewables have minor shares. Over
the forecast period, this picture will flip. By 2050,
fossil-fuelled power will make up 20% of on-grid
generation, in which coal-fired plants will account for
9%, overtaken by natural gas accounting for 10%, and
oil-fired generation representing 1%. Hydropower will
account for 46% and other renewables will have 33% of
the on-grid power mix, with solar PV and solar+storage
combined accounting for 24%.
The changing on-grid electricity mix is summarized in
Figure 9.4.8. It provides evidence of leapfrogging in the
electricity sector: Growth in renewables will push power
system expansion. Coal’s share of capacity declines
from 36% to 4%, while solar PV grows from 5% to 47%.
As electricity production capacity grows sixfold in this
period, half the coal power capacity from 2020 is still
there in 2050, as it only reduces from 48 TW to 30 TW,
and coal-fired generation declines only 24% to 161 TWh
per year. Thus, leapfrogging happens, but it does not
result in the full decarbonization of electricity systems.
Utility-scale grid-connected non-hydro renewables
(like solar PV and wind) will especially scale from the late
2030s onwards, but prior to the utility-scale expansion,
there will be significant off-grid capacity additions, as
shown in Figure 9.4.9 and discussed in the next section
on off-grids and microgrids.
Can and will the region leapfrog straight
onto a greener pathway with low-carbon
energy technologies?
Sub-Saharan Africa installed grid-connected power capacity in 2020 and 2050
FIGURE 9.4.8
Fossil, 64%
Fossil, 11%
Hydropower,
25%
Hydropower,
31%
Solar, 5%
Solar, 47%
2020
132
GW
548
GW
2050
Wind, 3%
Wind, 9%
Other, 3%
Other, 1%
268
DNV Energy Transition Outlook 2022
269
Regional transitions CHAPTER 9
Only two of our Outlook regions, India and Sub-Saharan
Africa, will display significant household electricity
shares enabled by off-grid solutions. In advanced
economies, transmission and distribution network grids
provide access to power stations that are typically large
and centralized. But such infrastructure is costly and
has usually represented up to half of the electricity bill.
For users with very limited use of electricity — e.g. LED
lightning, small refrigerators, and charging small
appliances – grid systems would represent an outsize
fraction of electricity cost, which is why many urban
areas in poorer parts of the world remain unconnected.
Photovoltaic (PV) electricity production can however
be made cost effective via very small power-production
units. Costing only a few dollars, such systems allow
for mobile phone recharging; slightly more expensive
systems (up to 500 W) can power household refrigerators
and freezers when combined with batteries.
Our analysis sees such off-grid installations competing
increasingly favourably with small, fossil-fuelled off-grid
power generators as demand for small appliances
increases with improving living standards. In Sub-Saharan
Africa, off-grid solutions will increase their share of
electricity production from 1% today to a plateau of
13% in 2042 until the end of the forecast period.
Microgrids are grids that also benefit from the modularity
of small-scale PV and batteries. Typically connecting
a few (up to a couple of hundred) electricity users and
producers, such solutions afford the advantage of a grid
(when some users have low demand, others have high)
without the high grid costs. In principle, microgrids can
be self-contained, i.e. not connected to other microgrids
or to larger grids with central power stations. In practice,
our previous analysis shows that microgrids will typically
be connected to higher level grids. We see (DNV, 2019)
such gridded microgrids representing 19% of PV power
production globally in 2050, but only 8% in Sub-Saharan
Africa. In contrast, off-grid PV is hardly visible (much less
than 1%) on a global basis, but off-grid PV solutions will
represent more than 80% of total PV installed capacity in
Sub-Saharan Africa when its share peaks in 2037. Note,
however, that in this region too, the global trend towards
utility-scale PV installation dominance will be visible,
just less so than globally (40% in SSA vs 52% globally)
in 2050.
In energy terms, off-grid solutions can be classified as
marginal, which is also the case in Sub-Saharan Africa.
When plateauing in 2042, the energy share of off-grid
solutions will be about 2%, as electricity represents only
15% of the region’s energy use then (with more than half
of energy still supplied by very inefficient biomass use).
However, from an SDG #7 perspective (access to
affordable, reliable, sustainable and modern energy for
all), the miniscule energy amounts represented by
off-grid solutions have an outsize effect in reducing the
region’s current population lacking electricity access
from 57% today to 4% in 2050, as seen in Figure 9.4.10.
‘Modern’ energy implies actions like replacing kerosene
lamps with LED bulbs. Such clean energy will also
reduce health hazards, as will electric heating replacing
open-fire indoor food preparation. The importance of
this improvement in global terms cannot be overstated,
as the region’s population increasing from 1.1bn to almost
2bn is the main reason why the world’s headcount rises
from 7.8bn to 9.3bn in 2050. Even though the fraction of
the region’s population that lives without modern
comforts will decline significantly, modern cooking
facilities will be unavailable for two thirds of the region’s
population in 2030, and one third in 2050. This implies
that a target in SDG #7 for 2030 (full access to modern
cooking) will not even be reached 20 years later, as is
seen in Figure 9.4.11.
Modern cooking facilities will be unavailable
for two thirds of the population in 2030, and
one third in 2050.
Off-grid, microgrids and energy access
FIGURE 9.4.9
Sub-Saharan Africa solar PV capacity
FIGURE 9.4.10 FIGURE 9.4.11
270
DNV Energy Transition Outlook 2022
271
Regional transitions CHAPTER 9
Emissions
Sub-Saharan Africa is already facing devastating climate
change impacts, such as drought, delayed rainfall
season, or flooding due to excessive rains impacting crop
production. The region’s contribution to GHGs historically
has been negligible, less than 3% of the world’s energy-
related CO2
emissions. Excluding South Africa and
Nigeria, the region’s countries are among the lowest
emitters in the world.
Our projection for the regional average carbon-price level
is USD 5/tCO2
in 2030 and 25/tCO2
by 2050. We expect
slow adoption and limited explicit carbon pricing instru-
ments in the region due to the predominant development
focus, where future schemes will be motivated by access
to climate finance and to avoid carbon-border adjustment
mechanisms (see section 6.4).
The region’s energy-related CO2
emissions will rise 61% by
2050 amidst a quadrupling of the economy, as emissions
decouple from GDP. Still, emissions growth willcomefrom
alldemandsectors,withthehighestgrowth originating
fromtransport(103%)asshowninFigure9.4.12.
Emissions from coal are the largest today, accounting for
about 40% of energy-related emissions, followed by oil
(33%). These carriers will swap places over the forecast
period in terms of contribution to the region’s emissions
footprint. As mentioned above, oil consumption expands,
particularly in road transport, while coal consumption,
and hence emissions, lingers in extractive manufacturing,
and CCS uptake will be negligible at 40 MtCO2
per year,
about 3% of total CO2
emissions.
However, despite population growth and rising standards
of living, Sub-Saharan Africa’s 0.7 tCO2
per person
emissions in 2050 are 12% lower than today; in contrast,
in the North America region 3.8 tCO2
per person will be
emitted in mid-century.
In the context of global climate policy, Sub-Saharan
African country pledges in NDCs suggest the regional
target is for emissions to grow no more than 67% by 2030
relative to 1990. These are unconditional targets, and
some countries expect further reductions provided there
is international support. Our Outlook indicates energy-
related emissions rise 107% over that period, suggesting
that the ambitions are not met. Looking ahead to 2050,
very few Sub-Saharan African countries have adopted
targets to reduce CO2
emissions. Our Outlook estimates
emissions a little under 1.5 GtCO2
per year in mid-century,
61% greater than in 2020.
One of 13 coal-fired power plants in South Africa owned and operated by the country’s highly indebted utility, Eskom. A rapid, large-scale
renewable energy build-out is vital in South Africa to replace the ageing and poorly maintained fleet of coal plants. A lack of generation capacity
caused by persistent breakdowns has led to thousands of hours of load shedding in 2022 alone, causing significant hardship and damaging an
already-challenged economy.
273
272
Regional transitions CHAPTER 9
DNV Energy Transition Outlook 2022
PNZ– Sub-Saharan Africa
Our pathway to net zero (PNZ) sees Sub-Saharan Africa's
energy-related CO2
emissions fall by 41% from 2020 to
2050, but still be significant at 0.53 Gt, the highest among
regions. As shown in Figure 9.4.14, all sectoral emissions
will decline by a similar fraction. Sub-Saharan Africa is
far from ‘net zero’ in our global pathway by 2050 and
illustrates precisely why wealthier regions will have to go
below zero before then. In our ETO forecast, the region
has the highest increase (61%) in carbon emissions from
2020 to 2050, and the highest percentage growth in
energy demand — a consequence of the steepest popu-
lation growth among the regions that starts with a low
energy intensity, and is set to develop and provide more
energy services to its energy-deprived population.
Final energy demand in a net zero future will increase by
50% to 2050. In buildings, the use of traditional biomass
declines, but still constitutes 41% of the region’s final
energy, and a full 75% of buildings’ energy use in 2050.
Manufacturing is the sector where energy use increases
the most — almost triples to over 7 EJ mid-century. And
while the region lags others in vehicle electrification, by
2048 electricity use would surpass oil in road transport.
By mid-century, over 80% of the vehicle fleet is electrified
in a net zero future. This is both a consequence of strong
grid growth, but also a cause of grid expansion.
On the supply-side, coal use doubles to 2050 (Figure
9.4.13). However, all power and hydrogen production
processes with carbon emissions see full CCS coverage.
Electricity use will increase, almost quintupling its share
of final energy demand to 33%, playing an increasing role
in all sectors. Hydrogen as an energy carrier will emerge
to account for a 4% energy share. The electricity mix will
have expanded shares for solar and wind, with coal being
forced out in 2045. The region’s energy rich waterways
will undergo damnation to a greater extent than any other
region, with hydropower providing 37% in 2050 —
a slightly higher share than solar PV.
Economy-wide economic signals − The rise in average
region carbon prices, to USD 15/tCO2
in 2030 and USD
50/tCO2
in 2050, is reflected as costs for fossil fuels.
Transport − Taxation levels on gasoline and diesel
increase (+75%), however transport policies adopted in
SSA are the least stringent, with no bans on the sale of ICE
vehicles. Charging infrastructure for electrification of
road transport will take longer time to come into
existence.
Buildings − CO2
emissions reduction is achieved through
partial bans (25%) on fossil fuel equipment in buildings by
2050. The lifetime of new fossil-fuel equipment halves
(from 15-7.5 years), and traditional biomass equipment
similarly has only half the previous lifetime; in combina-
tion enabling faster electrification. Commercial buildings
face a higher cost of capital for fossil-fuel equipment.
Manufacturing − The cost of capital for oil and gas
equipment increases from 8% in 2022 to 17%, and for
coal equipment increases to 20%. This considerably
reduces the attractiveness of fossil-fuel equipment,
enabling the faster phase-out.
Energy supply − New oil and gas capacity additions are
banned from 2028. Grid electricity is subsidized when
used for hydrogen production, in addition to the capacity
investment support of 10% for dedicated renewables for
hydrogen production.
PNZ – Policy levers
Sub-Saharan Africa is far from ‘net zero’ in
our global pathway by 2050 and illustrates
precisely why wealthier regions will have to
go below zero before then.
274
DNV Energy Transition Outlook 2022
275
Regional transitions CHAPTER 9
A diverse region, economically and politically, with vast
petroleum resources, the largest being in the Kingdom
of Saudi Arabia (KSA), Iran, Iraq, United Arab Emirates
(UAE), and Kuwait. There is ample solar radiation year-
round, and desert winds and open spaces are available
for renewables projects.
Middle East and North Africa is the cornerstone of and
the global trade in oil and gas. The OPEC members in the
region are trying to maintain a delicate balance between
production and prices in the wake of the pandemic and
the uncertainty caused by Russia’s invasion of Ukraine.
In producing countries, hydrocarbon revenues face
pressures from global decarbonization ambitions and
the unpredictability of returns. However, recent significant
increases in natural gas/LNG price and demand, especially
from Europe, have region producers positioning them-
selves to fill the supply gap. Oil and gas investment
projects are being sanctioned to maintain/increase
production capacity for exports (e.g. Qatar KSA, UAE).
MEA countries are taking serious steps to realize their
vast renewables potential to meet growing domestic
electricity demand, including that from desalination, and
to diversify energy sources as an economic growth
strategy. Egypt, KSA, Morocco and UAE have some of the
region’s largest renewable energy programmes, and
Turkey has made solid progress in securing supply
through renewables expansion.
State funding and state-owned companies (e.g. in oil and
petrochemicals) are involved in hydrogen projects with
hydrogen production building on existing fossil-fuel
capacities; large natural gas resources available for
conversion; excellent conditions for low-cost renewables;
and nuclear-powered electrolysis as in KSA and UAE.
Morocco, Oman and the UAE have published their
hydrogen strategies, and Algeria, Egypt, KSA and Turkey
are developing theirs.
For EV deployment, policy frameworks are incipient in
UAE and KSA.
− Renewables will expand in power generation. Both KSA
and UAE target 40-50% of their energy from renewables
in 2030. Morocco aims for 52% renewable power by
2030, Egypt 42% by 2035, and Turkey’s 50% target by
2023 is likely raised as 66% was already achieved in
2020. More of the region’s countries are adopting public
tenders/auctions to promote renewables.
− Rising electricity demand will place focus in the medium
term on energy efficiency and demand-side manage-
ment measures. A regional power trade will gain more
rationale, as will battery utility-scale storage.
− The region is expected to exploit its lowest per-barrel
extraction costs with continued investment in upstream
oil and gas production and liquefaction capacity.
Maintaining oil-supply shares to maximize government
revenue will be in focus and succeeding.
− Hydrogen ambitions play off the region’s cost advan-
tage in renewable electricity, as well as through CCUS.
The UAE and KSA governments pursue joint funding
in hydrogen industrial partnerships. Morocco expects
cumulative hydrogen investments of USD 8bn by 2030
and USD 75bn by 2050. Oman targets USD 34bn in
renewable-hydrogen investments by 2040. Egypt is
emerging as an export hub for LNG, electricity, and
green ammonia. UAE and KSA also target domestic
use in industry and road transport.
− UAE has a net zero ambition in 2050, Turkey by 2053,
KSA by 2060. With two consecutive COP events (COP27
Egypt, COP28 UAE), decarbonization and energy
transition focus is prevalent. There will be heightened
value-chain attention to lower emissions/carbon
intensity of oil and gas production (e.g. through large-
scale electrification such as started in UAE) given
increased carbon footprint quantification emerging
in targeted export markets, and in anticipation of
carbon-border adjustments.
Characteristics and current position Pointers to the future
9.5 MIDDLE EAST AND NORTH AFRICA (MEA)
This region stretches from Morocco to
Iran, including Turkey and the Arabian
Peninsula
Population (MN) GDP/person (USD)
GDP* (USD TRN)
Energy-related emissions/person (T)
Energy-related emissions (GT)
2020
2050
Energy use/person (GJ)
Energy use (EJ)
542 19 900
10.9
5
2.7
90
49
720 39 200
28.3
3.5
2.5
96
69
*All GDP Figures in the report are based on 2011 purchasing power parity and in 2017 international USD
276
DNV Energy Transition Outlook 2022
277
Regional transitions CHAPTER 9
9.5 MIDDLE EAST AND NORTH AFRICA
Energy transition:
from hydrocarbon to
hydrogen?
As one of the most fossil fuel-rich regions of the world, the
Middle East and North Africa has not been at the forefront
of the energy transition so far. Things are starting to
change, however, with global zero-carbon targets pushing
the region’s countries towards developing their own
carbon-neutrality targets and low-carbon fuel strategies.
Egypt, for example, is very much in focus, with COP27 set
to be hosted in Sharm-el-Sheikh. The country is aiming to
provide the lowest-emissions natural gas and is emerging
as an exporter of low-carbon LNG, electric power and
green ammonia to Europe and beyond. Other countries in
the Gulf region, such as Saudi Arabia, the UAE and Oman,
have issued ambitious hydrogen strategies, and are set to
exploit abundant access to solar and wind power, natural
gas reserves for blue hydrogen, sea water, and established
energy infrastructure and trading partnerships (Dubai
Future Foundation, 2022).
Figure 9.5.1 shows developments in primary energy
consumption for the Middle East and North Africa region.
Primary energy consumption is expected to grow by 42%
over the next three decades, from 49 EJ in 2020 to 69 EJ
in 2050. Most of this growth happens up to 2040, with
primary energy levelling off between 2040 and 2050 as a
result of the global shift towards renewables. In this
transition, the decline in natural gas and, especially, oil
supply from the region is expected to be as steep as the
concurrent rise in solar and wind, leading to total energy
supply staying stable around 69 EJ from 2040 to 2050. In
terms of shares, that of fossil fuels in primary energy is
expected to fall from the current 97% to 71% by mid-
century, with solar and wind taking 18% and 6% of the
share of total, respectively. Therefore, by 2050, this oil
and gas-rich region will still rely predominantly on fossil
fuels to provide its energy, with natural gas and oil
holding strong 47% and 21% shares, 9 and 15 percentage
points lower than today, respectively. The overall picture
can be described as oil giving way to solar to a significant
degree, natural gas persisting as a ‘transition’ fuel in the
region, and wind being fairly slow to take off despite the
region’s vast areas of flat barren land ideal for potential
wind turbine farms.
Electricity
Figure 9.5.2 visualizes trends in on-grid electricity
generation by power station type for the region. In this
picture, the transition is much starker than for overall
primary energy. Here, we see a tremendous 3.6-fold
increase in electricity generation in the region over the
next 30 years, from roughly 1,900 TWh to 6,800 TWh.
Virtually all of this growth (94% of the total 4,900 TWh to
be precise) will be from renewable sources. Albeit absent
from the mix today, wind and solar will together provide
69% of the region’s electricity by 2050, with solar alone
contributing nearly 50%. Just over a quarter of this solar
electricity generation is expected to be in solar + storage
power stations, a technology that is expected to start
taking off only in the 2040s. The vast majority of wind
power will be onshore in our forecast, with fixed offshore
wind farms constituting only a fifth of total wind generating
capacity, and floating offshore expected to remain
negligible in our forecast period.
Final energy demand
Figure 9.5.3 depicts the growth in total energy demand
broken down by demand sector from 1990 to 2050. Total
energy demand goes up by 64% over the next three
decades, from 33 EJ in 2020 to 54 EJ in 2050. After the
COVID-related dip in energy demand in 2020 and a brief
period of faster-than-normal recovery, demand is
expected to fall back along its previous almost linear
growth trajectory around 2025, eventually slowing down
to a plateau around 54 EJ in the second half of the 2040s.
This plateauing is mainly due to the transport sector, with
demand from road transport expected to peak around
2040 with the uptake of the much more efficient electric
road transport starting in the 2030s and really taking off
only in the 2040s. In the Middle East and North Africa
region, electricity is going to reach 10% of the energy
carrier mix in road transport only in 2041, 11 years after
the same threshold is reached in the frontrunner region,
Greater China. Middle East and North Africa is moving
forward with implementing policies and regulations
around EV charging infrastructure. The UAE’s capital Abu
Dhabi has recently published its regulatory policy for EV
charging infrastructure towards its target of carbon
neutrality by 2050. Saudi Arabia is moving to build its first
EV assembly plant (licensed by US-based EV maker Lucid
Motors), likely to be the first of three planned factories
(Lucid Motors, 2022), to produce EVs for domestic sales
278
DNV Energy Transition Outlook 2022
279
Regional transitions CHAPTER 9
and regional exports. Although currently there is a very
tepid take up in the region, things are starting to happen.
The fastest growing demand sector is buildings, with
space cooling being the fastest growing subsector
(Figure 9.5.4). Out of the total 21 EJ growth in total energy
demand in all sectors, 5 EJ (24%) originates from a surge
in demand for space cooling, which grows nearly tenfold
from 0.6 EJ to 5.7 EJ. This is despite a 30% improvement
in average cooling equipment efficiency, meaning that
useful energy demand for space cooling is expected to
grow even more rapidly. This spectacular rise in demand
for space cooling is due in part to the warming climate,
leading to a 30% rise in the number of cooling degree
days by 2050. The other drivers for space cooling are a
doubling of GDP per capita in the region, and a more
than doubling of building floor area reflecting population
growth and a rising standard of living.
A key question is which energy carriers are going to meet
the 54 EJ of energy demand in the region by 2050, and
how the carrier mix will be different from today. Figure
9.5.5 depicts developments in energy demand by carrier
in the Middle East and North Africa. The most salient
trend observed in this graphic is the almost exponential
riseinelectricenergy,alongwithaconcurrentdeclineinoil.
From 2020 to 2050, the share of oil drops from 37% to
22% while electricity’s share rises from 17% to 38%,
replacing natural gas as the primary energy carrier in the
region. The demand for natural gas, while increasing
from 14 EJ to 17 EJ, drops in share from 42% to 32%. This
is somewhat similar to the overall picture of primary
energy consumption seen earlier (Figure 9.5.1). Small but
still visible is the sliver of demand responded to by
hydrogen, which claims a modest share of around 2.3%
by 2050. In the next section, we take a closer look at this
burgeoning energy carrier in the region.
The rise of hydrogen
Figure 9.5.6 shows the take-off in hydrogen production in
the Middle East and North Africa starting in the 2030s.
Hydrogen production for energy purposes will grow
tenfold in two decades, from less than 1 Mt in 2030 to
nearly 10 Mt in 2050. In the beginning, this will consist
almost solely of blue hydrogen produced via methane
reforming of natural gas with CCS. Blue hydrogen will
remain dominant throughout the forecast period.
Gradually though, green hydrogen produced in electro-
lysis plants using dedicated solar electricity, and yellow
hydrogen, produced via electrolysis using electricity
from the grid, are expected to take off in the 2040s. They
will constitute 14% (green) and 25% (yellow) of total
hydrogen production by 2050. This split among various
hydrogen production routes is a direct result of develop-
ments in the levelized cost of hydrogen production,
which is demonstrated in Figure 9.5.7 for selected
production routes. It can be seen that, thanks to low
prices for locally extracted natural gas, blue hydrogen
remains as the most economically viable route through-
out the forecast period. However, with the rapid growth
in solar electricity generation (shown previously in
Figure 9.5.2) and the associated reduction in costs thanks
to cost-learning curves, dedicated solar and grid-
connected electrolysis become competitive production
routes during the 2040s.
Recent market and policy developments in the region
indicate a clear push for green and blue hydrogen and
derivatives like ammonia and e-methanol. The prerequi-
sites of high-yield renewable resources and large areas of
unused flat land for renewables and electrolysis plants
needed for green hydrogen, and cheap natural gas
resources for blue hydrogen, are all abundantly available
in the region. As electricity and natural gas are cheap,
local demand for expensive green hydrogen is expected
to be relatively low, at least in the near term. Considering
the potential for cost-effective production of low-carbon
hydrogen and derivatives alongside the region’s ideal
position at the nexus of growth markets across the East
and the West, Middle East and North African countries
are set to become key global suppliers in the emerging
global hydrogen market. By 2050, around 1.5 Mt/yr of
hydrogen is expected to be transported via pipeline and
seaborne trade (mainly pipeline), mainly to Europe and
the Indian Subcontinent, as well as around 12 Mt of
ammonia (for both energy and feedstock use) via shipping
to various other regions. The Middle East and North
Africaisexpectedtobethesoleexporterofpurehydrogen
to Europe, responding to a small share of demand in the
latter region.
Therefore, it comes as no surprise to see that export is the
core focus of national hydrogen strategies announced so
far by Algeria, Egypt, Oman, Saudi Arabia, and the UAE.
In particular, the UAE is targeting a 25% share in the
global low-carbon hydrogen market by 2030 (SP
Global, 2021c) while Saudi Arabia has stated intentions of
becoming a leading global supplier of hydrogen (Reuters,
2022). Oman is also competing to become a regional
player in green hydrogen/ammonia; reflected by its
national strategy which highlights incremental targets of
dedicated renewables capacity deployment: 1 GW by
2025, 10 GW by 2030, and 30 GW by 2040 (Sundar, 2021).
The race between different countries to become the
main low-carbon hydrogen hub in the region is pushing
governments to accelerate and increase efforts in
establishing regulatory frameworks to support these
ambitions. However, the UAE is currently considered to
be the only country that has reached an advanced stage
of development in its regulatory framework, and clearer
direction is expected before the end of the year
(ADGMO, 2022). As requirements for green hydrogen
differ from one region to another, Middle East and North
African countries are also actively exploring private and
public certification schemes that would allow them to
satisfy the requirements of importing countries.
International partnerships and foreign direct investment
are complementary pillars in the achievement of export
targets set out in these strategies. Several international
agreements have already been established across the
hydrogen supply chain, primarily between Gulf
280
DNV Energy Transition Outlook 2022
281
Regional transitions CHAPTER 9
Cooperation Council (GCC) countries (e.g. UAE, Saudi
Arabia, and Oman) and nations in Europe and Asia —
particularly those that anticipate imports bridging the
gap between future domestic production and demand
(e.g. Germany, the Netherlands, Japan, and South Korea,
to name a few). Concurrently, collaboration between
state-linked energy companies (e.g. ADNOC, Masdar,
ACWA Power, Aramco, and OQ) and major multinational
industrial players (e.g. Siemens, Air Products, Interconti-
nental Energy) continues to be seen in flagship low-car-
bon hydrogen projects, like the NEOM Helios Green
Fuels project in Saudi Arabia (Nereim, 2022), Green
Energy Oman (SP Global, 2021b), and the TA’ZIZ Blue
Ammonia project in the UAE (ADNOC, 2021). Other
places in North Africa are signing agreements for
multi-gigawatt renewable developments for the green
hydrogen industry, such as plans by Masdar and Hassan
Allam Utilities for developing 4 GW of electrolyser
capacity in Egypt by 2030, corresponding to an output of
480 ktH2
per year (Masdar, 2022).
While these projects are primarily export-oriented, some
countries in the region have established national hydrogen
alliances (e.g. the Abu Dhabi Hydrogen Alliance in the
UAE and Hy-Fly in Oman) that are also concerned with
promoting domestic use of hydrogen in industry, utilities,
and road, air, and maritime transport. The UAE in particular
sees opportunities to leverage its status as an inter-
national shipping and aviation hub through the 2 GW
green hydrogen to ammonia project at KIZAD, Abu
Dhabi, which targets the ship bunker fuels market (TAQA,
2021a) and the green hydrogen demonstrator plant at
Masdar City which will explore the production of sustain-
able aviation fuels (SP Global, 2021a). Interest is also
visible in the use of hydrogen in green steel production
through collaborations announced between TAQA and
Emirates Steel in the UAE (TAQA, 2021b) and between
Hydrogen Rise and Jindal Shadeed Iron  Steel in Oman
(Hydrogen Rise, 2022).
Potential Iran nuclear deal and world energy markets
Since early 2021, Iran has been in negotiation with P5+1
(permanent members of the UN Security Council plus
Germany) to revive the 2015 Nuclear Deal, which has
been inactive since former US President Donald Trump
withdrew from it in 2018. The two sides seem to be
inching closer to an agreement. At the time of writing, the
Biden-Harris Administration in the US is considering Iran’s
latest offer to resume its compliance with the 2015 deal.
Although progress has been made in these negotiations
and a revival of the 2015 deal appears to be not unlikely,
the US has cautioned that gaps still remain between
Washington and Tehran over the latest draft agreement
(Financial Times, 2022b).
Iran has some of the largest oil and gas reserves in the
world. Its oil represents up to 25% of the Middle East’s
and 12% of the world’s proven reserves. Similarly, Iran’s
gas reserves are second only to Russia’s, and account for
17% of global reserves. A revival of the 2015 deal could
lift sanctions against Iranian oil and gas exports, and let
the market be flooded by the millions of stored barrels of
oil and billions of cubic metres of natural gas waiting to
be shipped. Due to sanctions, Iran’s stored oil in floating
facilities reached more than 100mn barrels in February
2022 from 30mn in December 2021 (Bloomberg, 2022a).
Iranian officials say they have capacity to increase oil
production from 2.4mn barrels per day now to 3.8Mb/d
as soon as sanctions are lifted, and 5.7Mb/d in the long
term (Gulf Int’l Forum, 2022). Similarly, the country plans
to expand its gas production capacity by 130mn cubic
metres per day and extend gas export to Turkey.
All this means that if oil and gas sanctions against Iran are
lifted as a result of a new deal being struck between Iran
and world powers, the energy market will face a significant
spike in oil and gas supply, putting downward pressure
on energy prices. In the short term, this could temper
unusually high energy prices brought about by the
Russian invasion of Ukraine. In the longer term, however,
the impact is more difficult to anticipate. Since the energy
transition is by and large a demand-driven one,
supported by policies such as carbon pricing and
fossil-fuel bans, it is likely that a new Iran nuclear deal
would have little impact on the transition at a global scale.
On a more regional scale, however, it is conceivable that
more abundant supply of oil and gas as a result of such a
deal would delay the transition towards low-carbon fuels
in the Middle East and North Africa, shrinking the share of
solar and wind in primary energy consumption in the
region, which is currently forecast to be 25% by 2050.
Emissions
Our projection for the regional average carbon-price
level is USD 10/tCO2
in 2030 and 30/tCO2
by 2050.
Carbonpricingis presently low or negative givenfossil-fuel
subsidies and slow adoption is expected (see Section 6.4).
In the context of global climate policy, country pledges in
nationally determined contributions (NDCs) indicate that
Middle East and North America, viewed as a region, has a
regional target for emissions to increase by no more than
258% by 2030 relative to 1990. Our Outlook suggests
that energy-related emissions will be limited to a 239%
increase by then, demonstrating that emission-target
ambitions could be higher. There are however some
uncertainties in the comparisons of targets and forecasts,
as some countries are unclear about whether the targets
reported in NDCs also include non-energy related CO2
emissions. Most Middle Eastern emission targets are
given in relation to a business-as-usual trajectory.
By 2050, emissions in the Middle East and North Africa
region are expected to have declined by 5% compared
with 2020. Emissions will equal to energy-related
emissions of 2.5 GtCO2
per year. Emissions are expected
to keep rising until the mid-2030s, when they peak at
around 3.3 GtCO2
, approximately 18% above today’s
level, then slowly decline to 2.5 GtCO2
by 2050, a level
last seen around 2012 (Figure 9.5.8).
Recent (2021) announcements have a 2050-time horizon.
The UAE led the way among the region’s petrostates in
announcing a strategic initiative committing to achieve
net-zero GHG emissions by 2050. Israel aims to cut GHG
emissions by 85% in 2050 relative to 2015. Turkey, the last
G20 country to ratify the Paris Agreement (October
2021), also announced a net-zero goal by 2053. Saudi
Arabia has a target to reach net-zero by 2060.
Regional transitions CHAPTER 9
DNV Energy Transition Outlook 2022
283
282
PNZ – Middle East
and North Africa
In the pathway to net zero (PNZ), CO2
emissions decline
from 2.7 Gt in 2020 to 0.5 Gt in 2050 (Figure 9.5.9). The
pathway sees the region transitioning away from using its
vast domestic oil and gas resources without emissions
abatement but will continue to use some of these
resources with CCS. The region is also expected to depart
from keeping fuel prices low, especially in the transport
sector, partly because of an increasing carbon price, but
also in response to mounting pressure to abate, given high
emissions in the past.
Intransport,CO2
emissionsfallby57%from2020to2050.
ThiscontrastswiththemostlikelyETOforecastofan
increaseof11%overthecorrespondingperiod.Inbuildings,
CO2
emissionsfallfromabout0.9GtCO2
in2020downto
almostzeroby2050whereasinourETOtheequivalent
reductionwasonly7%. Inthemanufacturingsector,CO2
emissionsfallfrom0.7GtCO2
in2020to0.1GtCO2
by2050.
On the supply-side, CO2
emissions from the power sector
reduce from 1 GtCO2
in 2020 to -0.1 GtCO2
(thanks to
biomethane-fired power generation with CCS) by 2050.
This occurs while the share of electricity in final energy
demand simultaneously grows from 17% in 2020 to 52%
by 2050. Hydrogen’s share grows from nearly zero to 7%
by 2050. Nevertheless, considerable natural gas remains
in the system, especially in manufacturing. While some
grey hydrogen remains for use as feedstock in a net zero
future, hydrogen as an energy carrier in a net zero future
is renewables-based produced from electrolysis or low-
carbon via methane reforming with CCS.
The pathway sees the region transitioning
away from using its vast domestic oil and
gas resources without emissions abatement.
PNZ – Policy levers
Economy-wide economic signals − The rise in average
region carbon prices, to USD 30/tCO2
in 2030 and USD
100/tCO2
in 2050, is reflected as costs for fossil fuels.
Transport − We assume a ban on the sale of new ICE
vehicles from 2045 for passenger vehicles and 2050 for
commercial vehicles. Concurrently, the tax on oil price for
transport rises by 200% over the period to 2050, albeit
from a low base.
Buildings − All oil and natural gas subsidies for buildings
are eliminated from 2022. Simultaneously, a partial ban of
25% on all new fossil-fuel equipment in buildings is
implemented by 2050. The lifetime of new fossil-fuel
equipment halves (from 15 to 7.5 years), signifying faster
retirement of such equipment and enabling electrification.
Manufacturing − The cost of capital of oil and gas
equipment increases from 8% in 2022 to 11% in 2050, and
to 20% for coal equipment. Simultaneously, an investment
support of 4% is given to electric heat production, which
considerably reduces the attractiveness of fossil-fuel
equipment and enables faster phase-out.
In cement production, it is assumed that specific heat
demand for clinker production declines twice as fast as in
our ETO forecast (0.4%/yr improvement in energy
efficiency instead of 0.2%/yr); and similarly, the clinker to
cement ratio declines by 0.6%/yr instead of 0.3%/yr in the
ETO forecast. The cement intensity of construction is
assumed to be 25% lower than ETO by 2050.
In virgin plastics production, it is assumed that the
region will catch up twice as fast with Europe (the
front-runner region) in terms of recycling rates and
reduction in demand via efficiency and substitution
by plastic alternatives.
Energy supply − New greenfield oil and gas capacity
additions are banned from 2028. Concurrently, grid
electricity is subsidized when used for hydrogen
production, in addition to the capacity investment
support of 10% for dedicated renewables for hydrogen
production.
284
DNV Energy Transition Outlook 2022
285
Regional transitions CHAPTER 9
North-East Eurasia produced 23% of the world’s natural
gas and 15% of its crude oil in 2021. Coal is also abundant.
The region’s dependence on hydrocarbon export
revenues is strong.
In this region, Russia is dominant in size, population, and
economic output. It is the world’s second-largest
producer of hydrocarbons (17% of global gas and second
only to Saudi Arabia in oil exports). Although Russia is
currently finding buyers for its oil, its war on Ukraine
raises considerable risks for the economic future of the
region.
Europe (EU) and East Asian economies have been the
main markets for North-East Eurasia's hydrocarbon
resources. Energy relations are now changing, with
European countries planning to phase-out energy
imports from Russia. Japan is also committed to reducing
its energy reliance on Russia.
The region is at risk of falling behind in technology
needed for decarbonization. Its reliance on fossil energy
is both a cause and a consequence of the region’s
transition laggard status. For Russia, this risk is magnified
by the effect of sanctions and withdrawal of international
capital. Central Asian states are latecomers to the energy
transition with renewables starting to be prioritized only
since the late 2010s (CADGAT, 2022)
All the region’s countries have high energy intensity of
GDP and thus significant potential for energy-efficiency
measures across all sectors.
There are signs of growing energy transition efforts — for
example, Azerbaijan’s agreement with Abu Dhabi
developer Masdar on offshore wind and green hydrogen
(Recharge, 2022); Uzbekistan joining the Methane Pledge
and aiming for 30 GW new low-carbon power by 2030;
Kazakhstan approving its green taxonomy (EICON, 2021);
and Ukraine’s readiness to contribute to the European
Green Deal (Holovo, 2021).
Characteristics and current position Pointers to the future
9.6 NORTH EAST EURASIA (NEE)
This region consists of Russia, Mongolia,
North Korea, and all the former Soviet
Union states — including Ukraine,
except the Baltics
− The Eastern Partnershipwill extendthe EU’s cooperation
in the region, supported by a seven-year EUR 17bn (USD
20.1bn) investment package (Council EU, 2021). The
Energy Strategy 2030 of the Central Asia Regional
Economic Cooperation (CAREC) aims for efficiency and
clean energy deployment backed by development
partners (e.g. Asian Development Bank, European Bank
of Reconstruction and Development).
− Ukraine was granted EU candidate status by the
European Commission, and its reconstruction plan will
emphasize low-emission development. Even before
Russia invaded, Ukraine’s draft 2030 strategy targeted
10 GW renewable hydrogen capacity, 7.5 GW for
exports to the EU.
− Kazakhstan pledges carbon neutrality by 2060 but
low-cost coal abundance suggests coal power domi-
nance until 2040. Its emissions trading scheme, with
prices averaging USD 1/tCO2
e is insufficient to drive
decarbonization, but a draft government decree
suggests a rise to USD 50.8/tCO2
e before 2030
(Conventus Law, 2022).
− Russia will turn to Eastern markets to maintain energy
export revenues. However, insufficient infrastructure
for natural gas exports, and the time and massive
investment needed for new pipelines and terminals
will cause North East Eurasia gas production to
decline.
− High energy prices are benefitting Russia short term,
but sanctions will impact trade, foreign direct invest-
ment, flows of knowledge, and lead to a flight of skilled
professionals from Russia. No further concretization of
Russia’s net-zero target for 2060 is expected beyond
the present focus on hydropower, nuclear, and negative
emissions from land-use changes and forestry.
− With demand likely peaking in Western and Eastern
markets due to decarbonization, the Central Asian oil
and gas resources risk becoming stranded assets, only
partially offset by the extraction of critical materials for
clean energy technologies (Vakulchuk et al., 2021).
Population (MN) GDP/person (USD)
GDP* (USD TRN)
Energy-related emissions/person (T)
Energy-related emissions (GT)
2020
2050
Energy use/person (GJ)
Energy use (EJ)
318 17 400
5.6
7.4
2.4
140
45
315 30 500
9.6
5.8
1.8
132
42
*All GDP Figures in the report are based on 2011 purchasing power parity and in 2017 international USD
286
DNV Energy Transition Outlook 2022
287
Regional transitions CHAPTER 9
9.6 NORTH EAST EURASIA
Energy transition:
Ukraine invasion will see
Russia produce less gas,
but only marginally less
oil and coal
As the saying goes: 'Where you stand depends on where
you sit'. Our previous Outlooks have underlined that
exporters of fossil fuels will invariably be the laggards of
the energy transition. This applies to North-East Eurasia’s
nations, which are generally autocratic, have unem-
powered electorates, and are not willing to invest in
fundamental change.
In our forecast, the region’s energy system retains today’s
characteristics through to mid-century. Demand remains
at current levels, with a similar sectoral split and little
change in the mix of energy carriers. Fossil energy
remains at current levels, though electricity creeps up at
the expense primarily of coal as buildings owners' and
users take advantage of electricity’s added convenience.
We see the same picture through the primary energy
lens. Natural gas continues to dominate. On the
non-combustion side, solar and wind will grow strongly in
relative terms, but provide only respectively 4% and 3%
of primary energy in 2050.
Electrification
The 59% increase in electricity production to 2050 will
mostly benefit renewables, but gas will still provide one
third of power in 2050. Low domestic gas prices, also
benefitting from lost export opportunities as a result of
the Ukraine war and continued sanctions even after the
war eventually ends, make coal less competitive, and it
disappears from power production in 2040. By mid-
century, hydropower output will have increased 164% to
generate a quarter of the region’s electricity. Growing
from virtually nothing today, solar and wind power will
together generate just as much as hydropower in 2050.
Hydrocarbons
The region’s exports and energy production future hinge
on the future of its oil, gas and coal exports. More than
one third of the fossil energy production is exported to
other regions — 43% of the coal, 39% of the oil, and 26% of
the gas. Gas exports mainly take place through pipelines
to Europe. Russia halted these exports indefinitely in
autumn 2022; Europe is determined to pivot away from
Russian gas, and thus imports are assumed to be
replaced by other suppliers going forward. Other
countries in the region will, however, continue some
exports but not in sufficient quantities to influence a 50%
reduction in the region’s global gas exports over the next
30 months (totalling 153 Gm3
in 2024). By 2050 it will have
declined further to 128 Gm3
.
In the longer term, Russia is likely to be more interested in
selling its gas to the highest bidder, and this will not be
Europe. An increased build-up of transport infrastructure
— pipelines to the east and LNG terminals in the north —
will only partially replace current piping to Europe, and so
the region’s gas exports will decline. Domestic demand
will not take up the slack. Regional gas production
peaked in 2021 at 1,046 Gm3
. Production will fall 28% to
752 Gm3
in 2027 while global gas production is increasing
by 1%. This trend is already evident in North East Eurasia.
Gazprom’s gas exports to China increased by 61% in the
first seven months of 2022, but the company’s total gas
exports still declined by 35%, resulting in its total gas
production falling 12% over the same period for that
regional company.
The North-East Eurasian nations are
generally autocratic, and are not willing to
invest in fundamental change.
Oil and coal exports are much easier to redirect than
natural gas, as they can be transported on keel more
readily. Though much oil transport is through pipelines,
trains and trucks can also be used cost effectively over
land without the need to convert to or from solid form
(IEA, 2022a). However, enabling long distance transport
from the region requires significant infrastructure.
Overseas it requires ships and the complication here is
that western shipowners are subject to sanction rulings
288
DNV Energy Transition Outlook 2022
289
Regional transitions CHAPTER 9
against Russia. Moreover, insurers are typically required
to follow sanctions against Russia, and given the dominant
role of western insurers, even non-western ships will find
it hard to operate in this trade. When seaborne oil and
coal exports from the region continue, this can be
explained by non-western insurers increasing their
underwriting market share, or ships travelling without
insurance. The region’s crude oil production decreases
12% between 2021 to 2027, while the world witnesses a
global increase of 6%. Oil from Russia will be sold at a
heavy discount to Brent prices. Coal production will
reduce by 16% over the same period, faster than the
global 7% decline.
Emissions
Our projection for the regional average carbon-price
level is USD 6/tCO2
in 2030 and USD 20/tCO2
by 2050.
Slow adoption and low carbon-price levels are expected
(see Section 6.4).
Energy-related emissions will fall by 30% to mid-century,
by a similar fraction in all main demand sectors as shown
in figure 9.6.6 (buildings by 26%, transport 20% and
manufacturing 18%). The region’s total emissions will be
1.8 Gt CO2
in 2050, affording the highest emissions per
person of any region.
While other regions both experience a strong electrifi-
cation, and a greening of electricity, neither is true for this
region. Electricity does grow compared to other energy
carriers, but only from 13% to 18% of total energy
demand. This helps little as gas use in power production
increases by 25%, even though coal use in that sector
disappears in 2040 — largely replaced by non-emitting
renewables. The low carbon prices hinder the uptake of
CCS, and so less than 1% of manufacturing or power
sector emissions are captured in 2050.
In the context of global climate policy, our interpretation
of country NDC pledges in the region is that the region
targets reducing energy-related emissions 26% in 2030,
relative to 1990. As energy-related CO2
emissions are
forecast to be down 30%, the region as a whole reaches
its climate goals before that target date. However, as the
Soviet Union collapsed in 1991, emission statistics are
problematic: Statistics indicate emissions falling a full
40% 1990 to 1997. Though industrial production fell by
half in the same period, emissions reduction statistics
may well overstate the extent of the decline. But emissions
rising from 1997 to 2020 appears robust. The 30%
emissions reduction is the weakest of any industrialized
region.
Because North East Eurasia sees the lowest reduction in
emissions of any industrialized region, reaching net zero
goals, as Russia has claimed for 2060, and Kazakhstan
and Ukraine having carbon-neutrality goals for 2060,
have a very low probability of being achieved.
Russia is likely to be more interested in
selling its gas to the highest bidder, and this
will not be Europe. An increased build-up
of transport infrastructure will only partially
replace current piping to Europe, and so the
region’s gas exports will decline.
291
Regional transitions CHAPTER 9
290
DNV Energy Transition Outlook 2022
PNZ – North East Eurasia
Our pathway to net zero (PNZ) in North East Eurasia sees
CO2
emissions declining from 2.3 Gt in 2021 to 0.4 Gt in
2050.Final energy demand will fall by 20% to 2030 and by
29% to 2050 as seen in Figure 9.6.7. Of the main demand
sectors, transport energy demand will fall by a full 42%,
reflecting the sector’s electrification and consequent
energy efficiency improvements. Consequently, CO2
transport emissions are reduced by 65% from 2020 to
2050. This contrasts with the ETO forecast of the 'most
likely' future, where a reduction of 2% was seen for the
corresponding period. In 2050, oil use in the sector will
have declined more than three quarters from current
levels, and electricity account for more than half of
vehicles’ energy use. CO2
emissions in the manufacturing
sector reduce from 0.9 Gt in 2019 to 50 Mt by 2050. CO2
emissions in buildings decline from 0.7 Gt in 2020 to 0.1
Gt by 2050; in the ETO forecast the emissions were 0.9 Gt.
In energy supply CO2
emissions decline from 1.1 Gt in
2020 to 0.1 Gt by 2050.
Theenergymixwillbecomegreener.Electricityuse
increases, more than doubling in share to 29% by
mid-century to play an increasing role in all sectors.
Moreover, new energy fuels, notably hydrogen, will
emerge to claim a 5% energy share by mid-century. The
main loser in this dynamic towards a net zero future will
be methane as seen in Figure 9.6.7.
Both coal and gas use will mostly be subject to CCS by
mid-century. Except in post-combustion power facilities
where CCS use will cover less than 10% of emissions,
fossil fuels and processes will be subject to almost 100%
capture rates. The electricity PNZ mix will similarly be
greening. From the current position where gas and coal
dominate power production (about 40% and 20% share
respectively), the mid-century’s mix will see a similar
dominance of solar and wind power, after coal is forced
out from 2045. Gas generation will almost equal today’s
in absolute terms in 2050, yet because generation more
than doubles, gas will represent less than 15% of genera-
tion in 2050. By then, hydropower has seen its generation
more than tripling from today’s level, to become bigger
than that of gas.
Energy-related CO2
emissions will fall by 84% from 2020
to 2050,but still be significant at 0.4 Gt then.Manufacturing
emissions will decline strongly, as they are subject to
CCS, while the use of gas in buildings, thoughdeclining,
will still be present in 2050 andof course cannot be subject
toCCS.Buildings'emissionswillbe36%andmanufacturing
emissions 30%ofthe mid-century total.
CO2
price — The rise in average regional carbon prices to
USD 30/tCO2
in 2030 and USD 100/tCO2
is reflected as
higher prices for fossil fuels.
Transport − Despite its vast domestic hydrocarbon
resources, and lower fuel prices, the sale of new ICE
vehicles is banned from 2045 for passenger vehicles and
2050 for commercial vehicles. Concurrently, the tax on oil
price for transport is 200% in 2050, albeit from a low base.
Buildings − A partial ban of 25% on all fossil-fuel
equipment in buildings is implemented by 2050, and the
lifetime of new fossil-fuel equipment is halved (from 15
to 7.5 years). These two policy levers contribute to the
reduction in emissions by enabling faster phase-out of
fossil fuel infrastructure. Similarly, through biomass
coupled with CCS, NEE also achieves negative emissions
from direct heat for its buildings.
Manufacturing − The cost of capital of oil and gas
equipment in the manufacturing sector increases from
8% in 2022 to 11% in 2050, and the cost of capital of coal
equipment increases to 20%. Simultaneously, investment
support of 4% is given to electric heat production. This
considerably reduces the attractiveness of fossil-fuel
equipment, enabling the faster phase-out.
Energy supply — New oil and gas exploration and
development are banned in 2028. In addition, electricity
is subsidized for hydrogen production, as capacity
investment support of 10% is given for dedicated renew-
able hydrogen production. This occurs simultaneously
with growth in the share of electricity in final energy,
rising from 13% in 2020 to 18% in 2050 (Figure 9.6.8).
Fossil fuel power capacity are scrapped at age 25, before
their normal – 40-year technical lifetimes, thus enabling a
faster uptake of VRES in power generation.
PNZ – Policy levers
New energy fuels, notably hydrogen, will
emerge to claim a 5% energy share by
mid-century.
292
DNV Energy Transition Outlook 2022
293
Regional transitions CHAPTER 9
China’s Action Plan for CO2
peaking before 2030 aims to
increase non-fossil energy consumption from around
17.3% of the mix now to 20% by 2025 and 25% by 2030.
Other goals are to decrease carbon-emission intensity
(tCO2
per unit GDP) by more than 65% from its level in
2005; for renewables to be generating at least 35% of
power compared with about 29.8% now; to achieve peak
carbon by 2030; and to prepare for carbon neutrality by
2060 (NEA, 2022).
China is the largest investor in renewable energy. By
2021, its wind capacity was 328 GW, and solar PV 306
GW. The total installed capacity of offshore wind power
has reached 26 GW, ranking first in the world. The rapid
growth of distributed PV led to it becoming, for the first
time, more than half (55%) of China’s new solar PV capacity
(NEA, 2022)
In 2021, China overtook Japan as the largest importer of
LNG (IHS Markit, 2022), and new LNG terminals, natural
gas pipelines and storage build-out are accelerating
coal-to-gas switching.
A significant wave of new infrastructure development is
expected in China to boost domestic economic resilience
to global market dynamics. It features new-generation
infrastructure such as new energy, charging networks,
UHV networks, smart cities, and IT-related investments.
Sales of new EVs numbered around 3.2mn in China in
2021, 50% of the world total (Canalys, 2022).
China’s carbon-emissions trading scheme (ETS)
successfully completed its first performance period in
2021, with an average trading price less than USD 7/
tCO2
. Following the power sector, covering around 40%
of GHG emissions, the scheme will expand to the other
seven high-emission industries, along with the potential
re-launch of Chinese Certified Emission Reduction
(CCER), within the 14th Five-Year Plan Period (2021–2025).
Characteristics and current position Pointers to the future
9.7 GREATER CHINA (CHN)
This region consists of Mainland China,
Hong Kong, Macau, and Taiwan
− China’s decarbonization journey is a careful balancing
act. In the short term to ensure energy supplies, China
will maintain its oil production and slightly increase
coal and natural gas output. But it will strive to limit coal
consumption, promote cleaner ways of using it , halt the
export of coal-fired power-generation technology and
equipment,andphase down coal use in the longer term.
− Provincial subsidies will continue, after national
subsidies end, to promote renewables development
towards the target of combined wind/solar capacity
above 1.2 TW by 2030 (NEA, 2021).
− China targets 10% of final energy consumption from
hydrogen by 2050 (5% by 2030). By 2035, China aims
for comprehensive hydrogen energy industry formation
(NDRC  NEA, 2021)
− CCS adoption on a large scale is expected after 2030
when a rising carbon price makes it economic. Nuclear
power will continue to be developed steadily, with the
operating installed capacity planned to rise from 53
GW in 2021 to 70 GW by 2025 (14th FYP, 2021).
− In shipbuilding, various decarbonization pathways and
abatement technologies are under early development,
including onboard CCS and alternative ship fuels — e.g.
ammonia, battery, hydrogen, and LNG.
− ‘Made in China 2025’, promoting innovation in core
sectors, will trigger industry electrification and
upgrades in processing technology. The use of green
power, energy efficiency and low-carbon technologies
such as heat pumps, with the aid of digitalization, will
reduce energy intensity in transportation, manu-
facturing, and buildings.
− Strengthening green technology cooperation and
investment will be the focus of China and other
countries to jointly build clean-energy-related
international infrastructure under the Belt and Road
initiative. International cooperation on carbon trading
markets and carbon-border adjustment mechanisms
is also key for China’s climate change mitigation
ambitions.
Population (BN) GDP/person (USD)
GDP* (USD TRN)
Energy-related emissions/person (T)
Energy-related emissions (GT)
2020
2050
Energy use/person (GJ)
Energy use (EJ)
1.45 21 600
31.3
6.8
9.9
105
152
1.33 49 300
65.3
2.1
2.9
93
124
*All GDP Figures in the report are based on 2011 purchasing power parity and in 2017 international USD
294
DNV Energy Transition Outlook 2022
295
Regional transitions CHAPTER 9
9.7 GREATER CHINA
Energy transition:
a delicate balancing act
The population boom in China from 1950 to 2000 has
been followed by an economic boom that is slowing but
continuing. China today has 19% of world population and
23% of global GDP. Energy use, closely correlated with
both population and economic growth, has soared —
China now accounts for 26% of global primary energy use.
It is more like a continent than a country, and comparisons
like China being the world’s biggest producer or consumer
of something are therefore of less relevance than when
making many other country-vs-country comparisons.
What is important is that China is responsible for 28% of
global energy-related CO2
emissions; so, developments
there are crucial to whether the world will meet its
emissions and climate targets.
The central government of China is very strong and sets a
direction that the country is largely following. The
stability of the government also makes for more uniform
developments than in many countries where there are
constant changes of leadership, and the region is hence
more predictable from a forecasting perspective. Still,
even Chinese long-term planning has limitations; one
good example is the current demographic shift that looks
to be resulting in a much faster population and workforce
reduction than foreseen in Chinese government plans.
China’s primary energy demand has nearly tripled over
the last two decades, as illustrated in Figure 9.7.1. The
strong increase first and foremost came from coal, its
59%shareofprimaryenergyuseinChinaalsorepresenting
57% of global coal use. Since 2013, China’s energy use
has also started to diversify into almost all other energy
sources, with strong growth currently in natural gas,
hydropower, nuclear, solar PV and wind, and relatively
stable use of coal and oil forecast through the coming
decade.
The forecast energy supply and demand trends in the
coming decades are closely linked to the demographic
and economic developments of the region, and are also
strongly influenced by government energy and environ-
mental policy.
China’s population will most likely peak in 2021 or 2022
(Business Standard, 2022a), and is expected to be about
120mn less in 2050 than today. The reduction in workforce
is even greater, and this influences productivity and
economic growth. With a smaller workforce, salaries are
likely to grow more than in neighbouring countries. Even
with increased automation, a significant share of China’s
manufacturing will move to countries with cheaper
production. A strong domestic market and a focus on
‘Made in China’ protecting domestic manufacturers may
counter some of these trends.
Average annual economic growth has been more than
8% for 30 years. We expect it to slow significantly, with an
average growth of 2.3% for the next 30 years due to
population reduction and demographic shifts, and to
China becoming a more mature economy, with less
productivity gains in industry. Over time, its long-term
economic growth rate will more closely resemble that of
other medium and high-income countries. The expected
GDP per person of USD 49,000 in 2050 is less than 20%
behind forecast levels for Europe and OECD Pacific.
Energy demand
The demographic shift and economic growth influences
not only manufacturing, but also transport and buildings.
Passenger vehicle density will grow significantly, probably
peaking in the late 2030s about 90% greater than today.
However, a high level of urbanization and extensive
build-out of public transport will mean vehicle density
remains lower than in OECD countries. In the 2040s, a
reduction in population alongside greater automation
and car sharing will reduce vehicle numbers. Aviation is
likely to triple through to 2050 as an increasing number of
Chinese become middle class, including many pensioners
that would like to travel.
The urbanization rate in China is growing rapidly; today,
almost two thirds of the Chinese population live in cities.
Most of them also live in new high-rise buildings, a
situation very different from urbanization in North
America, for example. Small family sizes and an increased
standard of living will by 2050 see building stock in China
grow34%forresidentialbuildingsand190%forcommercial
buildings. Strong focus on energy efficiency will limit
growth in buildings’ energy use, which is relatively stable
from 2030 onwards. While energy needs for heating,
water heating, and cooking will be relatively stable,
energy needs for cooling increase more than sixfold over
the next 20 years, and by 2050 represent one third of
Chinese buildings’ energy use.
Overall final energy use will grow 12% from today to peak
in 2032 at 122 EJ, and will then decline 19% by 2050, as
shown in Figure 9.7.2. A rapid demographic shift aids this
reduction, which is otherwise mainly driven by the rate of
energy-efficiency gains being greater than that of
economic growth. By 2050, manufacturing will still be the
largest sector of energy demand with a 43% share in the
total, down from 51% today, while buildings’ share will
grow from 19% to 24%. Transport’s share will initially grow
from16%to19%by2026,andthendeclineaselectrification
of road transport scales from the late 2020s.
While the energy consumption is to a large extent
influenced by demographics and economics, Chinese
policy is the most important factor influencing the energy
mix. Technology and cost development also play a major
role in the transition from a fossil to a renewable energy
system, but energy and climate policy are interwoven in
every change. Energy and climate policies are also linked
296
DNV Energy Transition Outlook 2022
297
Regional transitions CHAPTER 9
to all other priorities of the government, including
economic growth, geopolitics and national security,
national and social stability, and energy security.
As China uses more than half of the world’s coal, and
emits 28% of energy-related CO2
, there is pressure from
other countries for its emissions to reduce faster.
From the Chinese authorities’ point of view, the balance
of these priorities, however, must find its way among all
the other priorities in the country, and as for all other
countries, sometimes the forces pull in the same direction,
and sometimes they are opposing forces. The Chinese
government’s stability enables priority-based long-term
planning to a greater extent than in other regions.
However, geopolitical, economic and technology trends
that China’s government is unable to foresee will always
influence and alter the long-term plans.
China’s most pronounced climate policy is its commitment
for emissions to peak before 2030, and to reach climate
neutrality in 2060. On the 2030 goal, there is an array of
supporting targets, goals, and measures, both in the
present 14th FYP to 2025 and in specific 2030 targets.
We describe some of this earlier in this section on Greater
China. On the 2060 goals, there are very few supporting
measures yet. Although not explicitly stated in official
documents, recent information from China's special
envoy for climate change, Xie Zhenhua, says that 2060
carbon neutrality includes all types of GHGs, is a very
important specification (Ecology China Network, 2021).
Electricity
Electrification is the key means to reduce emissions
because it is effective and relatively easily decarbonized.
As illustrated in Figure 9.7.3, electricity currently meets
24% of final energy demand in China. We forecast this will
nearly double to 46% in 2050, which would be the highest
share among all the Outlook’s regions. Electricity use
will grow in all main demand sectors — buildings, manu-
facturing, and transport. Extensive programmes are
underway in all these sectors to speed up this transition.
The most visible impact of electrification is in road
transport. China dominates global EV production, for
which it had a 44% share in 2021. It is also a leader in
domestic EV uptake, though the typical Chinese EV has a
much smaller battery size on average than European and
US counterparts. The majority of batteries for EVs
produced outside China are also Chinese, illustrating that
for China, EVs are not just a consideration within energy
and climate policies. It is also industrial policy to enter the
global market for vehicles, which Europe, Japan and the
US have dominated for decades. DNV expects uptake of
EVs in China to be the fastest among all regions, with half
the new passenger vehicles sold in China being battery-
electric vehicles (BEVs) by 2026 and half the fleet of entire
vehicles being BEVs by 2035. The country is also leading
the transition to EVs for commercial vehicles and two and
three-wheelers.
China also has goals on hydrogen-powered passenger
and commercial vehicles. As detailed in Chapter 1 of our
Outlook, our modelling currently indicates that hydrogen
vehicles are unable to compete for passenger vehicles.
We therefore consider it unlikely that China will continue
to push for this long term and believe that hydrogen
vehicles’ share of this market will remain negligible.
Hydrogen is likely to play a modest role in the commercial
vehicles segment, but here too we forecast uptake lower
than China’s ambitions.
Another advantage of electricity is that it will be
produced domestically. Hence, just like coal, but not oil
and gas, advancing electricity use is positive for energy
security in China. The electricity mix is explained in
further detail below.
Direct use of coal represents one third of Chinese energy
demand today, but will roughly halve to cover 15% of
demand in 2050. One significant driver of this reduction
will be coal use in manufacturing declining by half as
heavy industries like iron, steel, and cement production
both decline in size and change production methods.
The reduction of coal use in electricity generation will be
even greater, as described below.
Oil’s share of the energy mix will reduce from 25% to 15%
as road transport (the biggest user of oil products)
electrifies. Non-energy use of oil ultimately reduces in the
2040s; but from 2042, oil use in feedstock (e.g. for
chemicals and fertilizer production) will overtake oil use
in transport as the largest user of oil.
Coal-to-gas switching is a prominent policy in China for
buildings and manufacturing. Direct use of gas grows
over the next decade before starting to decline from the
mid-2030s as hydrogen, for example, begins to replace it.
As coal is a domestic energy source and natural gas is
mostly imported, geopolitical developments over the
past year might slow down governmental focus on
coal-to-gas switching, which is more about local air
quality than emissions and cost.
Hydrogen is negligible as an energy carrier today, but
from the 2030s will start to replace some coal and gas use
in manufacturing. In the 2040s, we will see uptake of
ammonia in shipping and e-fuels in aviation. In total,
hydrogen and its derivatives will have a 6% share in 2050.
ProductioninChinawillbepredominantlygreenhydrogen
produced via electrolysis powered from dedicated
renewables. There will also be a large shift in how
hydrogen is produced for use as industrial feedstock,
from coal gasification today to green hydrogen from
electrolysers in the future.
China’s annual electricity production will almost double
from 8.4 PWh to reach 15.4 PWh 2050. As illustrated in
Figure 9.7.4, coal’s share of the mix has already reduced
from 75% a decade ago to 62% today, and will further
decline to 40% in 2030 and only 4% in 2050. Gas main-
tains a minor share in 2050, and oil is negligible by then,
meaning that only 5% of China’s electricity will be gene-
rated from fossil fuels in mid-century.
Nuclear in China is interesting, presently at 5% of the
electricity mix. China is building almost as much nuclear
generating capacity as the rest of the world combined.
Over the next decades, China’s nuclear capacity and
production will almost double, keeping its share of the
electricity mix. China’s nuclear production of 660 TWh in
2050 will be bigger than in North America. It is building
nuclear power stations at much lower cost than OECD
countries, and nuclear is part of its industrial policy, with a
focus on exporting the technology. In spite of this,
nuclear will remain a modest energy source in China too.
The huge growth will come in renewables, as included in
climate, energy and industrial policies. China already
dominates global solar PV production and uptake and
has recently assumed the same role in wind. The share of
gridded wind-generated electricity in China is 8% in 2022
and will grow to 15% in 2030 and 39% in 2050. Solar PV
has presently an even higher growth rate, with 5% in
2022, 17% in 2030, and will be at 38% in 2050.
298
DNV Energy Transition Outlook 2022
299
Regional transitions CHAPTER 9
The 2025 targets for renewable installations in the 14th
FYP are likely to be exceeded for both wind and solar.
Including both on-grid and off-grid, we expect 1.8 TW of
solar PV by 2030. The fast growth continues, reaching 5
TW in 2050. For wind, we expect 0.9 TW installed by 2030
of which 120 GW is fixed offshore and 2 GW floating
offshore. The growth will continue; we expect 2.8 TW
onshore by mid-century, 580 GW of it fixed offshore and
100 GW floating offshore.
Hydropower is also large in China, producing 1.3 PWh
today, a Figure that will grow 60% over the next decade
and thereafter stabilize. With a share of about 15% of the
total electricity mix, this dispatchable renewable energy
source is crucial to balance the variable renewable
production from solar PV and wind.
Peak coal
Peak coal in China, both in direct use and in electricity, is
worth a detailed look.
In April 2021, President Xi announced that China will
reach peak coal by 2025. As China’s coal use represented
more than 22% of global CO2
emissions in 2019, this has
real implications for the world reaching its Paris Agree-
ment ambitions. China’s coal use increased steeply until
2013, and has since hovered around that level, and the
developments also for 2022 are still uncertain. By 2025,
however, we expect that coal use is on a steady decline,
achieving the peak 2025 announcement.
The power generation and manufacturing sectors are the
major coal consumers in China. According to our Outlook
(Figure 9.7.5), coal consumption in both will decline from
2022 onwards. In China’s manufacturing sector rapid
electrification will result in coal demand in the sector
rapidly reducing, from 27 EJ in 2020 to 13 EJ in 2050. As
described above, in electricity, the coal share will reduce
from 62% today to 4% in 2050. In 2044, manufacturing
will overtake the power sector as the largest consumer of
coal in China. Coal use in buildings, which is relatively
small, will fall in the coming years and will be largely
replaced by natural gas.
Last year, China also announced it will stop financing and
supporting technology for coal plants overseas. This is an
important step that increases costs of new coal-fired
generation in other regions and helps the transition to
cleaner technologies.
If Chinese coal use follows the path in our forecast, the
resulting emissions will fall from 7.4 GtCO2
today to 1.7
GtCO2
in 2050, making a crucial contribution to reducing
global emissions, but will still be too high for the world to
reach net zero.
The carbon intensity of Chinese energy use, measured as
gCO2
/MJ, reduces from 65 to 23 over the coming three
decadesandisfirstandforemostcoupledtothereduction
in Chinese coal consumption.
Energy Efficiency
Energy efficiency is another key lever for the relatively fast
energy transition in China. Urbanization and general
technology improvement both contribute to the shift.
However, the doubling of electricity’s share in the energy
mix is by far the biggest contributor, and even more
important when the electricity also becomes renewable.
The efficiency improvements come in all sectors, as all
electrify, but there are many other initiatives to improve
energy efficiency.
Energy intensity, measured as MJ of primary energy per
unit of GDP, is a key metric being focused on in Chinese
policymaking. We find that the present energy intensity
of 4.9 MJ/USD will reduce to 3.3 MJ/USD in 2030 and 1.9
MJ/USD in 2050. The annual reduction rates will fall from
around 4% per year today towards around 2% per year
towards 2050, as shown in five-year intervals in Figure
9.7.6. The main reason for the slowdown is that the
electrification growth rate — in road transport, for example
— will slow down, though the overall electrification rate
still rises.
Figure 9.7.6 also explains the trends in primary energy
shown in Figure 9.7.1, showing an interesting transition in
a country that has strong energy-efficiency growth,
declining GDP/capita growth, and declining population.
Energy security
Energy security is a high priority for China. Coal is
predominantly domestically supplied today, but 45% of
natural gas and 74% of oil is imported. The non-fossil
energy — nuclear, bioenergy, and renewables — is also
developed mainly domestically with little foreign
resources except some minerals and metals needed for
making wind turbines and solar panels.
We do not expect any dramatic change in this picture
within the forecast period. There are ample coal supplies
domestically, but it will not be possible for China to
increase oil and gas production to levels at which the
country is self-supplied. In our results, the share of
imported natural gas stays roughly the same as now,
while the share of imported oil grows. China is constantly
positioning itself towards the large oil and gas exporting
nations in the Middle East to have supplies available.
Recent Western sanctions against Russia following the
war in Ukraine has given China an opportunity to further
strengthen energy cooperation with Russia. Russian oil
and gas not being sold to Europe is available for China,
including through new pipelines that will be constructed
to cement a long-term import.
Nevertheless, China’s long-term aim is to be energy
independent. The switch to renewables will over the
coming decades make China less and less reliant on
imported energy from any other country, though full
energy independence is not achieved in our forecast
period.
300
DNV Energy Transition Outlook 2022
301
Regional transitions CHAPTER 9
Emissions
28% of global energy-related CO2
emissions come from
Greater China, a share that increased steadily to 2013 and
has been relatively stable since. This level is expected to
persist through the 2020s, after which China’s emissions
will fall much more rapidly than the global average, China
accounting for 24% of global emissions in 2040 and 16%
in 2050.
In absolute terms, China’s emissions, shown below in
Figure 9.7.7, are the biggest in the world, at around 10.4
GtCO2
of energy-related emission in 2021, a new record
high. They are currently dominated by those from
manufacturing, a 55% share in total Chinese emissions
that will be maintained through to 2050, albeit with
strongly reducing absolute levels. The 16% and 13%
shares of buildings and transport, respectively, will also
remain relatively unchanged through to 2050, demon-
strating that all sectors will reduce emissions at about the
same pace.
The energy carrier that reduces its share of emissions
fastest, and which impacts emissions from all the demand
sectors above, is electricity. It will be nearly fully decar-
bonized by mid-century, as shown in Figure 9.7.4. Coal
emissions dominate today, accounting for 76% of the
total, a share that will reduce to 60% by 2050.
We forecast that 320 MtCO2
per year will be captured by
CCS in Greater China in 2050, the highest absolute level
among all regions. However, the 10% share of Greater
China emissions that this represents is still much lower
than the equivalent percentages for CO2
capture in all the
three OECD regions. Figure 9.7.8 shows that the ramp-up
of CCS will be steep in the 2040s, with 2040 capture
levels being only a fifth of those in 2050. CCS will be
largest in manufacturing and from process emissions,
around 140 MtCO2
per year in each, while capture from
power generation will dominate in 2040, slowly reducing
towards 2050 as the power industry largely phases out
fossil fuel.
Our projection for China’s average carbon-price level is
USD 22/tCO2
in 2030 followed by rapid growth, especially
in the 2040s, to USD 90/tCO2
by 2050, a level exceeded
only by Europe and on a par with the OECD Pacific. The
upward pricing trend is underpinned by inclusion of more
sectors and expanding coverage in China’s national
emissions trading scheme (see Section 6.4).
Comparing the DNV forecast with official Chinese goals
and other Chinese forecasts — from CNPC, for example
— we find that the main goal of peaking CO2
emissions
before 2030 is easily met unless we see a high level of
Chinese AFOLU emissions, which is not likely. Regarding
the Chinese target to reduce carbon intensity by 65%
from 2005 levels by 2030, our Outlook suggests a
reduction of 66% by then, indicating that this target will
also be achieved.
China’s high-level goal of carbon neutrality by 2060
cannot be read from our forecast, which stops in 2050.
The direction in 2050 is clear, but the present trajectory
makes it unlikely that full carbon neutrality will be
achieved in 2060. However, emissions in 2060 will be
small, most likely less than 90% of their present level,
i.e. less than 1 GtCO2
of energy-related emissions.
303
Regional transitions CHAPTER 9
302
DNV Energy Transition Outlook 2022
PNZ – Greater China
Our pathway to net zero (PNZ) for Greater China sees CO2
emissions reduce from 10.2 Gt in 2021 to 0 Gt in 2050,
one decade before the Chinese long-term ambitions
(which admittingly is for all GHG and not CO2
only). CCS
of 1.3Gt and DAC of 0.2 Gt in 2050 are removing in total
1.5Gt of emissions, which equals the remaining emissions
from fossil fuels, making the total in 2050 being zero.
As shown in figure 9.7.9, primary energy use in 2050 is
only slightly lower than in the main forecast (121 vs 125 EJ),
but the energy mix is dramatically different, with a much
more rapid reduction in all fossil fuels. Solar and wind will
be at 30 and 31% of the primary energy mix in 2050,
respectively, and absolute wind and solar energy
production 50% higher than in our main forecast.
To achieve the ambitious 2050 figures, changes towards
2030 also need to be significant. We need to see a
decline in Chinese coal use of more than 20% in the
coming decade, and a more than 10% decrease in oil use
in the same period, and solar, wind and bioenergy having
a correspondingly much faster growth. As shown in
figure 9.7.10, emission reduction will be 20% by 2030 and
70% by 2040.
Electricity and hydrogen use grow fast to
reach 50% and 13%, respectively, of final
energy demand in 2050.
CO2
price — The rise in average regional carbon prices to
USD 100/tCO2
in 2030 and USD 200/tCO2
is reflected as
costs for fossil fuels.
Transport — China institutes a ban on the sale of ICE
passenger and commercial vehicles from 2035, while
subsidizing the electricity price for EV charging by 20%
from 2022.
Buildings — A partial ban of 50% on all new fossil-fuel
equipment in buildings is implemented by 2050, while
the lifetime of new fossil-fuel equipment is halved (from
15 to 7.5 years), contributing to faster phase-out of fossil
fuel infrastructure.
Manufacturing — To reduce attractiveness and speed up
phase-out of fossil equipment, the cost of capital of oil
and gas equipment increases from 8% in 2022 to 17% in
2050, and to 20% for coal equipment. Investment support
of 20% is given to electric heat production.
Energy supply — Enforced shorter lifetime for all fossil-
fuel power. New oil and gas capacity additions are
banned from 2028. Grid electricity is subsidized for
hydrogen production, and capacity investment support
of 10% is given for dedicated renewable hydrogen
production.
PNZ – Policy levers
304
DNV Energy Transition Outlook 2022
305
Regional transitions CHAPTER 9
Characteristics and current position Pointers to the future
9.8 INDIAN SUBCONTINENT (IND)
This region consists of India, Pakistan,
Afghanistan, Bangladesh, Sri Lanka,
Nepal, Bhutan, and the Maldives
Population (BN) GDP/person (USD)
GDP* (USD TRN)
Energy-related emissions/person (T)
Energy-related emissions (GT)
2020
2050
Energy use/person (GJ)
Energy use (EJ)
1.84 6 450
11.9
1.4
2.5
25
46
2.28 21 200
48.3
2.0
3.5
43
97
Economic and population growth in the Indian Sub-
continent are driving up energy demand. Energy security,
cheaper renewables and tackling air pollution are prime
motivations for the transition, and policies supporting
low-carbon energy developments are common. Pakistan,
Bangladesh, and India are among the countries with the
worst air pollution globally; in India, air pollution is back
at pre-COVID lockdown levels (IQAir, 2022).
More than 75% of electricity is fossil-derived, and India’s
energy choices will largely determine the region’s
transition pace. India has warned that high energy costs
could threaten emissions targets (Reuters, 2022), but it
remains committed to a renewable energy expansion.
Renewables capacity additions have outstripped growth
in coal-based power in the last five years. With over 10
GW of solar installation in 2021, India is ranked fifth
globally in solar power deployment and has one of the
cheapest solar tariffs. Government programmes
promoting access to electricity and clean cooking have
made significant progress.
Fossil fuels and imports dominate the energy mixes of
Bangladesh, Pakistan, and Sri Lanka. While thermal
generation is complemented by hydropower, production
is affected by climate change impacts. Governance and
security issues have deterred private investments.
Financial assistance and investments in renewables are
part of India’s ‘Neighbourhood First’ policy to alleviate
Sri Lanka’s fuel and economic crisis (NewsFirst, 2022)
Nepal and Bhutan are hydropower rich but reliant on
imported fossil fuels for their other energy requirements.
In Afghanistan, less than 50% of the population has
access to electricity; the country is largely dependent on
hydropower and power imports. Maldives is heavily
dependent on imported fossil fuels and approximately
half of the fuel imports are used for electricity generation.
− Record capacity additions ( 15 GW non-hydro
renewables) in 2022 puts India on track for 111 GW
(April 2022), falling short of the 175 GW targeted. A
500 GW non-fossil capacity target by 2030, with more
than 400 GW wind and solar, will depend on an
incentivized manufacturing scale up in advanced cell
batteries and solar panels, and how quickly these
become competitive globally.
− India’s 2070 net zero ambition (COP26) brings added
focus on energy efficiency, offshore wind, and green
hydrogen. Its National Hydrogen Mission will be
supported by the Green Hydrogen Policy and associ-
ated demand and supply measures framed in 2022.
− India will discourage greenfield coal-power projects
but will use existing capacity for base load, although 81
old and expensive plants will run at reduced capacity
to accommodate cheaper renewables. Major reforms,
including a real-time electricity market and future
fixed-minimum percentages for renewables and green
hydrogen, will assist the transition. National initiatives
are in place for e-mobility and battery storage, along
with a programme aiming to reduce airborne
particulate matter by 20-30% by 2024, with supporting
initiatives on transport fuels, and some limits on
coal-plant emissions.
− Bangladesh plans for 40% renewable electricity in
2041, aiming for 4,100 MW renewable capacity by
2030 with solar accounting for more than half. The
government cancelled 10 coal-fired plants and a reset
of gas expansion plans is expected given the volatile
LNG market.
− Pakistan’s super-floods epitomize consequences of
climate disaster. Its focus will shift from coal to
renewables and hydropower where Pakistan aims for
30% renewable electricity by 2030. Sri Lanka’s current
financial crisis is similarly emphasizing transition with
the government targeting 70% electricity from
renewables by 2030 from current 20%.
*All GDP Figures in the report are based on 2011 purchasing power parity and in 2017 international USD
306
DNV Energy Transition Outlook 2022
307
Regional transitions CHAPTER 9
9.8 INDIAN SUBCONTINENT
Energy transition:
feeling the heat
The Indian Subcontinent experienced sweltering heat in
April, some places in India and Pakistan reaching 50°C.
To tackle and survive the heat, huge swathes of the
population consumed electricity in the form of cooling
fans or air-conditioning units, which led to record
demand for power across the region. India, the biggest
economy in the region, transported massive amounts of
coal from domestic mines to power stations via trains, to
ramp up power production, thus also disrupting
passenger rail services (New York Times, 2018  2022).
This is just one example of the pernicious effect of
fossil-fuel use and its feedback effects coming full circle
for this region. In fact, the subcontinent is on the frontline
of extreme-weather events and slowly rising sea levels.
In the past decade, Afghanistan, Bangladesh, India and
Pakistan have all ranked among the top-10 countries most
affected by extreme-weather events on the Global
Climate Risk Index (Germanwatch, 2021).
Power sector transition
Despite living the real-world consequences of a warming
world caused by a carbon-based energy system, the
region is slow to change. We forecast that in 2030, 51% of
electricity generated in the region will be from coal power
plants (Figure 9.8.1). Our Outlook foresees 1.2 GW of coal
power plants being installed as late as 2040, implying that
coal is going to be locked into the power grid.
Primary energy consumption and delayed shift to
renewables
The region continues using coal well into the 2040s, as
seen in Figure 9.8.2. Even in 2050, 22% of primary energy
consumption will be coal. The majority of this coal will
continue to be used in power plants and the manu-
facturing sector. In fact, our forecast indicates that 53% of
primary energy will come from coal, oil and natural gas in
2050. Not only is this higher than the global average, in
terms of the 49% share of fossil fuels in primary energy,
the region even now is a net importer of all three: coal, oil
and natural gas. This has huge implications for energy
expenditure, along with a drain on its revenue. Further-
more, such dependence on imported fossil fuels is
detrimental to the region’s energy security and leaves its
economies vulnerable to the vagaries of market shocks
and upheavals.
Until 2040, the role of solar and wind in the primary energy
mix will be very limited. In 2030, the combined share of
both solar and wind is less than 5%, which is expected to
grow to 12% in 2040 and 24% in 2050. We foresee this
trend being reflected in their share in electricity genera-
tion. We expect solar and wind to generate an increasing
amount of electricity starting from the 2030s, and that by
2050, their combined share in total electricity generation
will be 67%. We forecast that 1.4 TW of new solar and wind
capacity will be added in the region from 2030 to 2040,
followed by an additional 2 TW between 2040 and 2050.
Final energy demand
Such enormous amounts of solar and wind are needed,
along with maintaining coal and gas generation, because
of the region’s burgeoning demand for electricity, which
grows five-fold from 1.6 PWh (51. EJ) in 2020 to 8.3 PWh
(26 EJ) in 2050. Correspondingly, electricity’s share in
final energy demand increases from 15% to 33%, as
shown in Figure 9.8.3. All energy carriers except biomass
see an absolute increase in demand between 2020 and
mid-century, though electricity sees the most dramatic
demand growth in both absolute and relative terms.
The main contributors to this explosive electricity
308
DNV Energy Transition Outlook 2022
309
Regional transitions CHAPTER 9
demand growth are the manufacturing and buildings
sectors. In 2020, electricity’s share in manufacturing
energy demand was 19% and this increases to 27% by
2050. Most of the increase is for use in machines, motors
and appliances.
In buildings, electricity’s share increases from 17% to
48%, mostly in the transition away from traditional
cooking appliances to electric cooking, higher penetration
of appliances and lighting, and greater demand for space
cooling. In buildings, electricity demand for space
cooling increases eight-fold, albeit from a small level in
2020; quadruples for appliances and lighting; and,
doubles for cooking — all between 2020 and 2050
(Figure 9.8.5). Off-grid solar PV generation also grows in
the region, the majority of which is used in buildings
(Figure 9.8.1).
This sustained growth in electricity demand ensures
huge investments in renewables for power, while coal
and natural gas also persist in the region’s future power
system.
Rising electricity consumption in buildings
The forecast electrification of buildings energy use has
myriad impacts on the region. At a household level, we
forecast that more and more households will have access
to electric cooking stoves, appliances and lighting, along
with space cooling in a fast-warming world which leads to
households consuming more electricity. The fraction of
households without access to modern cooking reduces
from 30% in 2020 to less than 3% in 2050. This has a huge
impact on the standard of living and respiratory health of
the population, as less and less harmful solid fuels and
kerosene are used for cooking. At the same time, this will
also put upward pressure on household energy expendi-
ture in the region.
We foresee the effects of wider penetration of household
electrical equipment in Figure 9.8.5. The electrification of
household energy services also has the effect of increasing
energy efficiency, especially for cooking. We forecast that
less electric energy will be consumed to provide the
same level of cooking than if using oil or traditional
biomass for energy, even though the useful energy
needed for cooking increases in the region.
In addition, the Indian Subcontinent will continue to be a
net importer of coal, oil and natural gas. Figure 9.8.6
presents the import-to-demand ratios of these three
fossil fuels. While the ratios dip in 2020 due to COVID-19,
both oil and natural gas have increasingly to be imported
to satisfy domestic demand. In fact, we forecast that the
region will be the biggest importer of natural gas in the
world by 2040.
Hence, despite the massive numbers for future solar and
wind-based electricity generation, the persistence of
coal (in power and manufacturing), oil (in transport) and
natural gas (in power) in the energy system implies that
the region will spend increasing amounts of money on
fossil-fuel imports. Such high import levels will leave it
vulnerable to supply and price shocks. For example, the
Ukraine war has seen Europe willing to pay higher prices
for LNG, leaving countries such as India and Pakistan
having to pay even more to source that LNG or face
supply disruptions detrimental to their development
goals (Business Standard, 2022b).
Tethered to fossil-sourced energy
Furthermore, and as mentioned before, the large imports
of critical energy needed for the region imply that it will
have a large bill to source energy, as well as increasing
household expenditure due to higher electricity
consumption. Figure 9.8.7 presents the fossil-fuel import
bill and household energy expenditure of the region
from 2010 to 2050, indexed to the 2010 value. The
fossil-fuel import bill consists of the expenditure to
import coal, oil and natural gas for all energy purposes.
The household energy expenditure consists of the costs
for each household per year for both residential and
passenger transport energy demand. The import bill is
highly susceptible to price shocks, as can be observed in
the sharp rise in 2022 corresponding to the Ukraine war
and rising prices for natural gas, and to a lesser extent for
coal and oil. Such disruptions to natural gas supply also
tip the region towards more cheap coal, thus locking in
coal infrastructure even further along the timeline.
While the household expenditure is somewhat insulated
from the same sharp rises as the import bill, we still
forecast a rising trend for the region. This is because of
the increasing consumption of energy due to higher
demand of household energy services, and to increasing
imports of natural gas and oil, with part of the expense for
these being transferred to households.
Despite the rising energy import expenditure, and its
implications for energy security and the timetable for
phasing out fossil fuels, it is not all doom and gloom. We
do foresee a sharp increase in energy use per capita,
rising from 25 GJ in 2020 to 34 GJ by 2030, and 43 GJ by
2050 (Figure 9.8.8). In 2020, this energy use per capita is
split 30:70 in fossil-based energy’s favour. But from 2030,
310
DNV Energy Transition Outlook 2022
311
Regional transitions CHAPTER 9
there is a change in how much renewable energy and
fossil-based energy use per capita is prevalent in the
region. Until 2030, we forecast similar growth rates (28%)
for both renewable and fossil-based energy use per
capita. But from 2030 to 2050, there is a divergence, with
renewables dominating per capita energy use growth.
Overall, per capita use of renewable energy almost
triples between 2020 and 2050 while the equivalent
fossil-based measure grows 28%.
Historically this region has had very low levels of energy
use per capita, implying extreme energy deprivation for a
large portion of the population, with a plethora of
corresponding negative impacts on income, quality of
life, lifespan, and economic growth. That this is improving,
and with increasing contribution from renewables and
electricity, is a very welcome development.
This region's low levels of energy use
per capita is improving, with increasing
contribution from renewables.
Emissions
Historically,theIndianSubcontinenthas hadvery low
emissions,despitehavinga highershare of fossil-fuel use in
itsprimaryenergy.Thisismostlydueto its economic
activitybeinglowerthantheotherregions,andto the low
energyintensityofitseconomy.Incontrast,some other
regions–e.g.NorthAmerica,EuropeandOECDPacific –
havehad carbon-intensivegrowthtrajectories in the past.
Despite being the most populous region in 2020, the
Indian Subcontinent’s 2.5 Gt of energy-related CO2
emissions were less than those of either Greater China,
North America, Europe, or Middle East and North Africa.
We foresee the Indian Subcontinent’s emissions increasing
to peak in 2039 at 4.1 GtCO2
per year (Figure 9.8.9).
Worryingly, beyond that peak, we expect these emissions
to decrease by only 15%, to 3.5 GtCO2
per year by 2050.
We expect the region to overtake Greater China by 2047 to
become the largest emitter of energy-related carbon
dioxide. Unsurprisingly, given the persistence of coal in the
Indian Subcontinent’s energy system, coal will remain the
main contributor to energy-related emissions, followed by
oil and natural gas.
While tracking and forecasting a region’s absolute
emissions is important to mitigate global warming, it
does not always accurately represent the true picture on
energy-related emissions, especially when it comes to
CO2
emissions related to productivity and energy use.
Figure 9.8.10 presents the changes in five key intensity
indicators for the Indian Subcontinent: carbon intensity of
energy; carbon intensity of the economy; carbon emis-
sions per capita; energy intensity; and GDP per capita.
The changes are indexed relative to the year 2010, thus
eliminating the need to reconcile the units and scale of
these indicators.
As seen from the Figure, the region’s GDP per capita is
increasing while its energy intensity is decreasing,
implying a decoupling of energy from its economic
growth over time. This is to be expected as the region’s
economy matures and shifts towards a more service-
based economy. Similarly, the carbon intensity of its
economy is also decreasing.
What is perhaps significant to note is that both its carbon
emissions per capita and carbon intensity of energy
increase in the short term. This indicates, as discussed
previously, that the energy system is not decarbonizing
fast enough. Rather, in the short term, the region is
increasing its use of coal and natural gas. Given that,
historically, the region has had very low per capita energy
use, it is not surprising that we see increasing carbon
emissions per capita because of increasing energy use
per capita. We forecast that the carbon emissions per
capita will peak in 2033 at 2 tonnes, six years before the
peak for absolute emissions. This is not due to a slowdown
in energy use per capita, but rather the larger slowdown
in population growth in the region.
In summary, better technology transfer and support to
phase-out fossil fuels faster will have a positive impact on
the emissions trajectory of the Indian Subcontinent.
Mechanisms such as carbon prices will place downward
pressure on energy-related emissions.
Our projection for the regional average carbon-price
level is USD 10/tCO2
in 2030 and USD 25/tCO2
in 2050.
But there is currently no explicit carbon pricing in the
region. Pakistan is considering carbon pricing and an
announcement from India suggests a planned
carbon-trading scheme (see Section 6.4).
NDC pledges indicate that the region aims to limit
growth in emissions to no more than 376% by 2030
relative to 1990. Our Outlook indicates energy-related
emissions increasing by 482% over this period, which at
first glance indicates that the region will not achieve its
implied overall goal. Therew are some uncertainties in
comparing our forecast with these pledges, as some
major countries in the region also include non-energy-
related CO2
emissions in their targets.
India announced its net-zero carbon emissions target by
2070 at COP26 and has submitted an updated NDC in
August 2022. The update includes a target to reduce
carbon intensity of GDP by 45% between 2005 and 2030,
similar to how China sets its reduction target. This
commitment is not easily measured in our forecast since
we predominantly focus on energy-related emissions,
and because our model does not regionalize non-
energy-related CO2
emissions. Our results suggest a
reduction of 31% in carbon intensity by 2030 for the
Indian Subcontinent.
313
Regional transitions CHAPTER 9
312
DNV Energy Transition Outlook 2022
PNZ – Indian Subcontinent
The pathway to net zero (PNZ) for the Indian Subcontinent
sees CO2
emissions reduce from 2.9 Gt in 2021 to 0.5 Gt in
2050 (Figure 9.8.11), driven by rapid penetration of
renewables, such as solar and wind in primary energy.
Overall energy demand in 2050 is also markedly lower
(26%) in the pathway to net zero than in our ETO forecast
— i.e. total final energy demand of 62 EJ instead of 78 EJ,
as illustrated in Figure 9.8.12.
Electricity and hydrogen use grow fast to reach 49% and
11%, respectively, of final energy demand in 2050
(Figure 9.8.12). Despite this rapid electrification substantial
shares of natural gas (7%), coal (10%) and oil (11%) persist
in the energy system in 2050. The Indian Subcontinent
has the second largest CO2
emissions in 2050, behind
Sub-Saharan Africa.
Given its historically low emissions from the energy
sector, it is vital that a PNZ helps the region phase out
fossil fuels and avoid being locked-in to new fossil
infrastructure. The role of CCS will be critical to achieving
net zero in the Indian Subcontinent, where 0.4 Gt will be
captured in 2040, rising to 1 Gt by 2050.
The pathway to net zero for the Indian
Subcontinent sees a rapid penetration of
solar and wind, and electrification of all
demand sectors.
CO2
price – The rise in average regional carbon prices to
USD 30/tCO2
in 2030 and USD 75/tCO2
is reflected as
costs for fossil fuels.
Transport — The region institutes a ban on the sale of ICE
passenger and commercial vehicles from 2041 and 2047,
respectively, while subsidizing the electricity price by 8%
from 2022.
Buildings — A partial ban of 25% on all new fossil-fuel
equipment in buildings is implemented by 2050, while
the lifetime of new fossil-fuel equipment is halved (from
15 to 7.5 years), contributing to faster phase-out of fossil
fuel infrastructure and electrification of buildings.
Manufacturing — To reduce attractiveness and speed up
phase-out of fossil equipment, the cost of capital of oil
and gas equipment increases from 8% in 2022 to 17% in
2050, and to 20% for coal equipment. Investment support
of 3% is given to electric and hydrogen-based heat
production.
Energy supply — Shortened lifetime for all new fossil-fuel
power capacity additions. New oil and gas capacity
developments are banned from 2028. Grid electricity is
subsidized for hydrogen production, and capacity
investment support of 7.5% is given for dedicated
renewable hydrogen production
PNZ – Policy levers
314
DNV Energy Transition Outlook 2022
315
Regional transitions CHAPTER 9
Indonesia, the Philippines, and Thailand are the largest
economies in the region, and Singapore has the highest
GDP per person. In the current energy system, hydro-
carbons dominate the primary energy mix (81%); oil for
transport, coal and gas for electricity.
To fuel growth in economies, state-owned coal-fired
power has been the preferred option. An expanding urban
middle class is the main driver of electricity demand in
residential and service sectors, and a flourishing manufac-
turing sector pushes up industrial energy demand.
At COP26, Indonesia, Philippines, and Vietnam signed a
pledge to stop using coal over the 2040s. Vietnam
promises no new coal after 2035, the Philippines banned
new coal in 2020, and Indonesia’s government directs
state-owned utility (PLN) to retire three plants by 2030
and phase-out by 2055. But the region accounts for
almost the entire global pipeline of new coal power
plants, with support from governments, hence a coal
fleet is set to operate in years to come.
Energy access (population, geographic coverage,
stability of power provision) remains a priority, wherefore
energy transition policy focuses on expanding power
from renewables, and once high shares are reached,
green hydrogen production is envisioned (Nakano, 2022).
Renewable power targets are common, and recently,
renewables have had a greater role in power develop-
ments, representing about 82% of 22 GW of new
capacity in 2020 (ASEAN, 2021). Of the ASEAN
members, Vietnam has the highest renewable invest-
ments and the fastest growth in wind and solar, with
4 GW and 16.6 GW respectively, installed in the last
couple of years, motivated by declining hydrocarbon
sources. In 2022, the Philippines’ Green Energy Auction
programme allocated 2 GW renewable capacity, with
solar getting the largest share at 1.5 GW.
There are net zero goals in the region: Laos, Malaysia,
Vietnam for 2050, Indonesia for 2060, Thailand for 2065.
− CCSandlow-carbonhydrogenwillbehamperedbylack
of carbon pricing. Indonesia has plans for CC(U)S in
tandem with the development of gas fields, yet its
Carbon Pricing Roadmap has been delayed, wherefore
otherincentives/internationalsupportwouldberequired.
− The Asian Development Bank has chosen Indonesia,
the Philippines, and Vietnam for its Energy Transition
Mechanism(ETM)pilot.Itaimstosetupfundspurchasing
and accelerating coal-plant retirement. It is this type of
scheme that will decide the realism of phase-out
pledges by helping governments financially if they are
to shed coal assets. ETM is not reflected in this year’s
forecast but will be monitored for future Outlooks.
− Renewable power will do the heavy lifting in region
decarbonization. ASEAN member states are targeting
the following goals for 2025: 23% renewables in
primary energy supply (~17% in 2019); 30% lower
energy intensity than in 2005; 35% renewables in
installed power capacity (~29% in 2019). The power
goal looks achievable. We project 21.5%, a 27%
reduction and 41%, respectively.
− Hydropower, solar and wind will grow massively. Also,
offshore wind, e.g. Vietnam and the Philippines having
technical potential of 475 GW and 178 GW (ESMAP,
2019), will start to be realized from the mid-2030s.
Across the region, grid infrastructure and fragmented
electricity networks will need handling to accommo-
date renewables.
− Singapore’s goal of 4 GW low-carbon electricity
imports by 2035 for 30% of its power (EMA, 2021) will
drive power interconnections, the first multilateral
power trade and import (hydropower from Laos via
Thailand and Malaysia) happening this year. Singapore
will also front-run hydrogen use with imports from
Australia, Chile and New Zealand.
− Sustainable finance will expand aided by the ASEAN
Taxonomy under development. Carbon-border
adjustments and net-zero ambitions among conglom-
erates will pressure decarbonization efforts, the region
being at the start of many supply chains.
Characteristics and current position Pointers to the future
9.9 SOUTH EAST ASIA (SEA)
This region stretches from Myanmar to
Papua New Guinea, and includes the
Pacific Ocean States
Population (MN) GDP/person (USD)
GDP* (USD TRN)
Energy-related emissions/person (T)
Energy-related emissions (GT)
2020
2050
Energy use/person (GJ)
Energy use (EJ)
676 12 800
8.7
2.3
1.5
44
30
778 32 300
25.2
2.4
1.5
65
50
*All GDP Figures in the report are based on 2011 purchasing power parity and in 2017 international USD
316
DNV Energy Transition Outlook 2022
317
Regional transitions CHAPTER 9
9.9 SOUTH EAST ASIA
Energy transition:
Light at the end of the
fossil tunnel
On paper, South East Asia is a paradise for renewables-
based energy transition; in reality, that transition has not
materialized (Weatherby, 2020). Despite good technical
potential for solar and wind (NREL, 2020), the region has
struggled with the build-out of renewables. The region is
rich in coal and natural gas and has found it difficult to
wean itself off dependence on these fuels both for
energy and power generation. Additionally, South East
Asia is the greatest exporter of coal, 400 Mt of it in 2020,
with North East Eurasia coming a distant second at 290 Mt.
The coal sector intersects with the mining, processing,
energy, and steel industries, and is entrenched in the
region’s economies. For example, in Indonesia, the most
populous country in the region, phasing out coal is
extremely unpopular, especially among the resource
holders who wield disproportionate influence among the
political decision makers.
Other countries and regions, alarmed at South East Asia’s
plan for continuous coal use, are hoping to incentivize
breaking the coal dependence with generous financing
deals for ‘greening’ the energy and power sectors
(Bloomberg 2022). But the Ukraine war has put a damp-
ener on this shift away from coal. The supply choke of
natural gas from North East Eurasia implies that more of
the region’s coal is demanded, at least in the short term.
This demand makes it attractive and lucrative to invest in
coal, bringing the risk of further entrenchment of coal in
the energy system.
Primary energy consumption
The dependence on coal and fossil fuels is of course
apparent in the region’s primary energy consumption.
As shown in Figure 9.9.1, 80% of the primary energy
consumption is from fossil fuels. It reduces to 51% by
2050, but this is still above the global average projected
to be 49% in mid-century. Of the 80% share of fossil fuel
in primary energy in 2020, oil’s share is 30%, followed by
coal (27%) and natural gas (23%). Coal’s share is forecast
to reduce to less than 10% by 2050, and natural gas's
share to 17%. More troublingly, oil’s importance reduces
only marginally from 30% in 2020 to 25% in 2050; and in
absoluteterms,oilconsumptionincreases 40% in that time.
In contrast, solar and wind have very little share in primary
energy in 2020, less than 5% combined in 2030, but grow-
ing to 28% in 2050. The major economies of the region
— e.g. Indonesia, Malayasia, Singapore, Thailand and
Vietnam – have struggled to have stable, longlasting and
consistent policies supporting renewables; but there are
signs that this is changing. For example, renewable
policies (feed-in tariffs) in Vietnam have played an
important role in the uptake of renewables (solar, wind)
and developing the industry (DNV, 2021a), and have seen
investments burgeoning in onshore and offshore wind
power despite grid constraints holding back integration
of variable renewables.
Final energy demand
Figure 9.9.2 shows the breakdown of the region’s final
energy demand by energy carrier. Electricity doubles its
share of 18% in final energy demand in 2020 to 36% by
2050. This also corresponds to nearly five-fold growth in
electricity generation in the region over that period
(Figure 9.9.3).
In terms of electricity generation in South East Asia, the
evolution to a more renewable grid is stark, as seen in
Figure 9.9.3. From 90% fossil fuel-based generation in
2020, the region’s grid generates only 10% of its electricity
from fossil fuels in 2050. Of this 10%, the majority is from
natural gas. Both solar PV and solar coupled with storage
play a significant role in the region’s electricity generation
318
DNV Energy Transition Outlook 2022
319
Regional transitions CHAPTER 9
share, rising sharply from the late 2030s to generating
74% of the electricity by 2050.
Besides electricity, oil plays a dominant role in meeting
demand for energy in South East Asia. While oil’s share in
final energy demand reduces from 41% in 2020 to 28% in
2050, oil demand in absolute numbers increases from
8 EJ to 12 EJ per year over the same period. The over-
whelming majority of this oil demand goes towards
sustaining the region’s transport energy demand.
Buildings will be the largest growth sector for electricity
demand in South East Asia, accounting for 2 EJ (556 TWh)
in 2020 and 9 EJ (2,500 TWh) in 2050, according to our
forecast. Of all the end uses in buildings, space cooling
creates the largest growth in demand for electricity in the
region.
The cooling challenge
The energy demand for space cooling depends on the
cooling degree days (CDD), which increase in South East
Asia in the future due to climate change. CDD is a measure
of the cumulative positive difference between daily
average outdoor temperature and reference indoor
temperature of 21.1°C. The space cooling energy
demand increases with penetration of air-conditioners,
which is set to rise with higher GDP per capita. Total
building area and energy-efficiency standards also
impact buildings’ energy demand for space cooling.
The greater the building area to be cooled, the more the
cooling energy demand, while better energy-efficiency
standards and insulation lead to lower cooling energy
demand.
Figure 9.9.4 presents the space cooling energy consump-
tion in South East Asia from 2020 to 2050, indexed to
2020 values. Specific cooling demand with CDD and GDP
effects shows that if everything else remains the same,
the need for energy for space cooling in residential
buildings would increase 20-fold between 2020 and
2050. We foresee building regulatory standards and the
willingness to invest in passive and net-zero energy
buildings as consistent trends in the region. South East
Asia has so far tended to take a myopic view when it
comes to investment in state-of-the-art equipment for
space cooling – with short-term cost considerations
winning over long-term savings (UNEP and IEA, 2020).
Despite the forecast energy-efficiency gains from better
building insulation and retrofitting, the penetration of
air-conditioners drastically increases, which coupled with
increasing building area to be cooled, results in a 28-fold
increase in cooling energy demand in residences
between years 2020 and 2050 (Figure 9.9.4).
There is already significant penetration of space cooling
in commercial buildings in the region, and we forecast
such demand to increase nine-fold. Improvements in
energy efficiency in buildings, with both voluntary and
regulatory building-efficiency standards, will dampen
the increase. So, all else being equal, we foresee a
nine-fold increase in this demand between 2020 to 2050,
or seven-fold with better building insulation, retrofitting,
and investment in the best available technologies (Figure
9.9.4). However, with structural changes to the economy
and impetus shifting toward the tertiary sector, we also
foresee total buildings floor space multiplying almost
three-fold, which results in cooling energy demand
increasing 27-fold between 2020 and 2050.
A difficult shift to green transport
Unlike buildings, the transport sector will see little
evolution in terms of energy carrier shift. We forecast that
most of the oil demand in South East Asia will continue to
be for transport purposes, specifically the 72% going to
road transport needs (Figure 9.9.5). From a COVID-19
impacted 5.7 EJ per year oil demand in 2020, we forecast
an increase to 6.6 EJ per year in 2050 in the region.
South East Asia also has a large fleet of two and
three-wheelers alongside its four-wheel passenger
vehicles. The region’s two and three-wheeler fleet will
expand 43% from 227mn vehicles in 2020 to 324mn in
2050. Of this 324mn, we expect less than 2.5mn to be
ICEVs by 2050, which implies that 99% are electric two
or three-wheelers. Similarly, with the increase in GDP per
capita, more and more people will opt for passenger
vehicles, forsaking their two-wheelers for added comfort
and range. As a consequence, we project the passenger
vehicle fleet to grow from 56mn in 2020 to 174mn, which
is a tripling of the fleet size. Of the total fleet of passenger
vehicles, we foresee less than half being electric vehicles,
and the rest being combustion vehicles.
The uptake of EVs is expected to be sluggish in the
region when compared with Greater China, despite
South East Asia’s proximity to China and being an
automobile manufacturing powerhouse. Reasons touted
for the region’s lacklustre uptake of EVs include higher
upfront cost than for ICEVs; lack of policy/support
measures such as EV uptake targets and consumer
point-of-sales incentives; regulatory delay and indecision
by governments; and a still undeveloped charging
infrastructure.
Cities in South East Asia, such as Bangkok and Jakarta to
name two, face many problems due to congestion mostly
caused by passenger vehicles – e.g. heavy local air
pollution, productivity lost while waiting in traffic, GHG
emissions while idling (AECOM 2022). Given that EVs are
not going to solve the traffic volume and congestion
problems, metropolitan governments in the region have
turned their attention to mass transit, especially within
urban and densely populated regions. Here, we use the
term mass transit to denote all the different modes of city
and suburban railway systems (Future Southeast Asia,
2022). Cities where construction of mass transit systems
is currently underway include, among others, Ho Chi
Minh City and Hanoi (Vietnam), Vientiane (Laos), and
Bangkok urban rail transit expansion (Thailand).
In our forecast, we do not categorize mass transit as a
separate entity but include it in rail transport. For South
320
DNV Energy Transition Outlook 2022
321
Regional transitions CHAPTER 9
East Asia, we predict that 28 PJ per year of energy
demand for rail transport in 2020 will increase to 49 PJ per
year in 2050. More importantly, we also expect the rail
transport segment to become increasingly electrified,
which also improves energy efficiency. In 2020, only half
the energy used for rail transport was electricity. By 2050,
almost all the rail transport energy will be electricity.
While rail’s share in transport energy demand does not
change between 2020 and 2050 in South East Asia, it is
important to stress that the absolute rise in energy
demand for rail transport corresponds to a higher than
equivalent reduction in road energy demand. Rail is a less
energy-intensive transport mode; an increase of 21 PJ per
year between 2020 and 2050 in rail transport energy
translates to a considerably greater reduction in road
passenger energy demand. Furthermore, the co-benefits
of reduced road traffic congestion, less air pollution, and
avoidance of productivity loss, all contribute to increase
the preference for rail transport, especially in densely
populated or far-flung locations in South East Asia.
In summary, measures are being taken to haul the region
out of the long fossil tunnel, but these measures need to
be wide-ranging with cohesive and sustained policy
support.
Emissions
Our projection for the regional average carbon-price
level is USD 25/tCO2
in 2030 and 50/tCO2
by 2050. There
is currently limited explicit carbon pricing in the region,
but several countries are taking steps toward introducing
or expanding pricing schemes by the middle of the
decade (see Section 6.4).
We forecast that annual energy-related CO2
emission
from South East Asia will peak at 2 Gt in 2032 and then
reduce to 1.5 Gt in 2050, which is equivalent to the
region’s emissions in 2018. The emissions in 2020 were
1.6 Gt, but there was a reduction of almost 0.2 Gt from
2019 to 2020 due to the economic slowdown because of
COVID-19.
Coal use is the largest contributor to emissions at pres-
ent, but we forecast that oil will overtake coal emissions in
2027 and remain the largest emitter through to 2050
(Figure 9.9.6). As explained before, this is mostly due to
the transport sector continuing to be dependent on oil.
While manufacturing is currently the end-use sector with
the largest emissions footprint, transport will catch up,
each accounting for almost equal shares in total CO2
emissions by 2050 (Figure 9.9.7). We project faster
electrification in manufacturing than in transport, which
results in faster decarbonization of manufacturing, when
compared to transport.
In the context of global climate policy, South East Asia's
country pledges in NDCs imply a regional target of
limiting increases in energy-related emissions to no more
than 521% by 2030 relative to 1990. There are some
uncertainties in the comparisons of targets and forecasts,
as some countries are unclear about whether the targets
also include non-energy-related CO2
emissions. Our
Outlook has energy-related emissions increasing by
382% by 2030 in the region, suggesting that these
pledges are rather unambitious and will be easily met.
Among South East Asian nations, few have emission
reduction targets beyond mid-century. Laos, Malaysia,
Vietnam for 2050, Indonesia for 2060, and Thailand for
2065, but real policy has yet to be developed. Energy-
related emissions for the region are expected to be 1.5
GtCO2
per year in 2050, 3% less than in 2020.
323
Regional transitions CHAPTER 9
322
DNV Energy Transition Outlook 2022
PNZ – South East Asia
The pathway to net zero (PNZ) for South East Asia sees
CO2
emissions reduce from 1.8 Gt in 2021 to 0.3 Gt in
2050 (Figure 9.9.8), with a strong growth in solar and wind
in primary energy, coupled with electrification. Overall
final energy demand in 2050 is also markedly lower (21%)
in the pathway to net zero than in our most likely forecast.
Total final energy demand is 34 EJ instead of 42 EJ, as
illustrated in Figure 9.9.9. Electricity and hydrogen use
grow fast to reach 45% and 8%, respectively, of final
energy demand in 2050. However, significant amounts of
fossil fuels remain even in 2050, especially natural gas in
power, coal in manufacturing, and oil in transport
(accountable for 50% of emissions in 2050).
Power sector emissions in South East Asia will reach
negative levels by 2047 because of the use of bioenergy,
but this is not sufficient to reach net zero by 2050.
Carbon capture and storage capacity will peak in the
region at 0.5 MtCO2
per year in 2047, the majority of
which will be in the power sector.
The pathway to net zero for South East Asia
sees a rapid reduction in all fossil fuels, and
strong solar and wind growth.
CO2
price — The rise in average regional carbon prices to
USD 50/tCO2
in 2030 and USD 100/tCO2
is reflected as
costs for fossil fuels.
Transport — South East Asia implements a ban on the sale
of passenger ICE vehicles from 2040 and on commercial
ICE vehicles from 2047, while subsidizing the electricity
price for transport by 10% from 2022.
Buildings —A partial ban of 25% on all new fossil-fuel
equipment in buildings is implementedby 2050,while the
lifetime of new fossil-fuel equipment is halved(from15 to
7.5 years),contributingto faster phase-out of fossil fuel
infrastructure.Additionally,higher rate of retrofittingwhen
comparedto our most like future is implemented,to
increaseenergyefficiencyofbuildings,whileelectrification
is incentivisedbythepartialbanoffossil-fuelequipment.
Manufacturing — To reduce attractiveness and speed up
phase-out of fossil equipment, the cost of capital of oil
and gas equipment increases from 8% in 2022 to 17% in
2050, and to 20% for coal equipment. Investment support
of 4% is given to electric and hydrogen heat production.
Energy supply — All new fossil fuel power capacity has
reduced lifetimes (from 40 to 25 years). New oil and gas
exploration and developments are banned from 2028.
Grid electricity is subsidized for hydrogen production,
and capacity investment support of 10% is given for
dedicated renewable hydrogen production.
PNZ – Policy levers
324
DNV Energy Transition Outlook 2022
325
Regional transitions CHAPTER 9
The mature economies in this region have diverse energy
use and resources. Australia is a net exporter of energy,
and in late 2021 the outgoing Federal Government
committed to a technology-driven net zero plan by 2050.
New Zealand, Japan and South Korea depend on energy
imports and have all committed to net zero by 2050.
In Australia, with its vast coal and gas resources for
domestic energy use and for export, carbon emissions
are declining slowly. Its national 2020 renewables target,
was met with rapid growth in wind, rooftop and utility-
scale solar. Renewables now contribute over 30% of
electricity supply, and there is significant interest in
hydrogen.
New Zealand relies heavily on renewables for electricity,
particularly hydropower and geothermal, and to a lesser
extent wind and solar; fossil fuels still dominate energy
supply but there is accelerated interest in hydrogen. A
longstanding ETS system is in place.
Japan imports coal, LNG, and almost all its oil. Most of its
geothermal and hydropower potential is already
deployed. Geographic factors constrain solar, onshore
wind, and grid connectivity. Nuclear power remains
contentious, and shortfalls in power supply have been
balanced with imported fossil fuels and greater coal-fired
generation. Japan plans to increase offshore wind
capacity and innovate decarbonization technologies.
South Korea’s energy mix is dominated by fossil fuels
( 80%) relying on imports of coal, oil, and LNG. Reduction
of air pollutants, carbon emissions and energy inde-
pendence are prime energy policy motivations, and
newly elected president Yoon Suk-yeol has promised a
U-turn in nuclear power phase-out plans. Wind and solar
account for about 4% of electricity (2020). The export-
oriented manufacturing base is carbon-intensive. Efforts
to become a global hydrogen powerhouse have grown
since 2017.
− After a prolonged period of uncertain energy policy,
Australia’s new Federal government has ambitious
energy transition plans. These include spending on grid
development, promotion of EVs, and investment in
green metals. A 45% reduction in emissions by 2030 is
targeted. The world’s largest exporter of LNG, Australia
is exploring hydrogen for domestic use and export,
aided by its excellent gas and renewables supply base,
and state/territory level aspirations.
− New Zealand targets net zero by 2050 for non-
agricultural emissions, and a 50% reduction by 2030.
In May 2022, a comprehensive Emissions Reduction
Plan was launched which details a package of social,
financial, and technical initiatives, including alignment
of the existing emissions trading scheme with the
established emissions budgets.
− Japan carbon neutrality is enshrined into law, condi-
tional on innovation. Its Green Growth Strategy holds
sectoral plans and envisioned policy tools (METI, 2021).
Expanding renewables and storage, near-term coal to
gas-switching, CCUS and hydrogen are in focus.
Existing nuclear power plants will be used if safety is
secured. Its hydrogen strategy includes funding to
develop international supply chains and applications
in aviation, shipping, steelmaking, and ammonia
production. There are capacity targets for hydrogen-
based power plants and road vehicle targets.
− South Korean’s 2050 Carbon Neutral Strategy
(Government of the Republic of Korea, 2020) outlines
comprehensive energy decarbonization, favouring
LNG, renewables, and electrification of transport.
Electricity plans target above 40% renewables with a
major role for offshore wind by 2034, and 10% nuclear,
the latter likely to see a boost. Coal-to-gas conversion
and CCUS in power and manufacturing will be pursued.
There are targeted annual funds for hydrogen projects
and firms (RD, loans, tax exemptions) for both
production and applications to become a leading
hydrogen economy by 2040.
Characteristics and current position Pointers to the future
9.10 OECD PACIFIC (OPA)
This region consists of Australia,
New Zealand, Japan and South Korea
Population (MN) GDP/person (USD)
GDP* (USD TRN)
Energy-related emissions/person (T)
Energy-related emissions (GT)
2020
2050
Energy use/person (GJ)
Energy use (EJ)
207 39 800
8.3
9.4
1.9
170
35
193 57 000
11
2.3
0.4
122
24
*All GDP Figures in the report are based on 2011 purchasing power parity and in 2017 international USD
326
DNV Energy Transition Outlook 2022
327
Regional transitions CHAPTER 9
9.10 OECD PACIFIC
Energy transition:
innovating carbon out of
the system
OECD Pacific is different compared to other regions in
that the countries are all industrialized but do not have
common borders and connected grids. Population
density, energy resources and infrastructure vary greatly
fromJapan’snorthtoNewZeeland’ssouth.Commonalities
are access to great wind resources and plenty of coast-
lines to capitalize on the growing offshore wind market.
However, to complement variable solar and wind, the
region's North Asian countries Japan and South Korea
will increase the share of electricity using nuclear or
hydrogen. Both forms of power generation have their
challenges and emission advantages.
OECD Pacific countries are expected to be at the forefront
of hydrogen uptake as an energy carrier. Hydrogen and
its derivatives will represent 8% of the final energy
demand in the region by 2050, the second highest share
after Europe. Initially, it is primarily in refineries that
hydrogen will play a role in the region. By 2050 buildings,
power generation, e-fuel production and the manufac-
turing sector will be equally big. While we do not model
intraregional trade it is fair to assume much of the
hydrogen produced (Figure 9.10.1) will be from dedicated
onshore wind and solar PV-based electrolysis plants in
Australia and then transported to South Korea and Japan
for electricity generation, as well as use in manufacturing
and buildings.
Transport
The region will transform its transport system from being
based purely on oil and gas to being only 50% fossil-fuel
based with the rest running on electricity and 15% on
hydrogen and its derivatives. In aviation, most of the fuel
is still oil based (60%) in 2050, and the rest will be based
on bioenergy and e-fuels. All countries in the region have
lengthy coastlines and are dependent on shipping for
imports and exports. In 2050, the maritime fuel mix will
only be 30% fossil-based whereas ammonia will take
centre stage and represent 35% of all shipping fuel,
however, uptake will be most prevalent after 2040, see
Figure 9.10.2. Road, representing 56% of final energy
demand for transport purposes, will transform to have an
almost equal split between fossil and non-fossil. Here
electricity (46%) and some hydrogen (7%) will be the main
fuel to decarbonize road transport.
Power sector
The region will see significant growth in renewable
energy capacity. Much of this capacity is utility scale solar
PV sometimes including storage, which mainly will be
installed in Australia. Rooftop solar will find applications
in all countries in the region, but in Australia and New
Zealand the floor area per household is larger than
compared to Japan and South Korea which limits rooftop
availability for the North Asian countries. Wind, initially
onshore and starting mid 2020s offshore will be growing
considerably. Much of the capacity will be installed to
supply the grid, but a considerable share of the capacity
(120GW) will be dedicated to produce hydrogen,
ammonia and e-fuels. By 2030 — all capacity additions for
power generation in the region are from renewable
energy or nuclear, as shown in Figure 9.10.3.
By 2050, 72% of on-grid electricity is based on renewable
energy and another 15% comes from nuclear power
generation. The region will see continuous additions of
nuclear capacity coming online during the forecast
period, both existing nuclear that has been temporarily
shut down, but also new capacity will be built. Together a
total of 35 GW capacity will be added by 2050, which
amounts to around 15 new plants in the next 30 years
compared to the existing 40 (of which 10 are in operation)
in Japan and 6 in South Korea. Nuclear supplies the
region (Japan and South Korea) with 200 TWh of nuclear
electricity in 2020 which will grow to 350 TWh by 2050.
Hydrogen and ammonia imports
Hydrogen demand more than doubles from less than
8 Mt in 2020 to 15 Mt in 2050. Hydrogen demand and
supply largely match for the region with a small amount
(1.5 Mt/yr) imported mainly by pipeline from Greater
China. Ammonia and methanol will see a growth trajec-
tory equivalent to hydrogen and will represent about 12
Mt each in demand by 2050. Most of the demand is to be
used as an energy carrier. However, production capacity
will be limited and thus OECD Pacific will turn to imports
to satisfy growing demand. For ammonia, this would
mean 8 Mt/yr imported by 2050, as seen in Figure 9.10.4.
By 2030 — all capacity additions for power
generation in the region are from renewable
energy or nuclear.
328
DNV Energy Transition Outlook 2022
329
Regional transitions CHAPTER 9
Primary energy use
Primary energy demand is declining with a shrinking
population, even if GDP is continuing to grow. However,
the GDP growth will be slower towards 2050. Primary
energy use is 34% lower in 2050 compared to 2020 levels
which is equal to about 1.4% decline per year, as shown in
Figure 9.10.5. Energy intensity, which measures primary
energy use per GDP, is declining with even greater
numbers than the decline in primary energy use. This
development is pointing towards an economy less
dependent on primary energy and transforming into
services and higher value goods.
Emissions
Declining primary energy use combined with declining
population will lead to emissions falling continuously
during the forecast period. CO2
emissions will decline by
77% by 2050 in contrast to 2020 figures. All sectors as
well as all fossil fuels will decline with the fastest rate seen
in coal use and buildings (and manufacturing). All
countries in the region have an ambition of reaching
net-zero emissions in 2050. However, in our forecast there
will be around 440mn tonnes of CO2
still in 2050. These
emissions will be equally split between the three main
sectors, but over half of the emissions are from oil,
Figure 9.10.6.
Our projection for the regional average carbon-price
level is USD 35/tCO2
in 2030 and USD 90/tCO2
by 2050.
Carbon pricing will play an important part of the policy
mix to achieve net-zero 2050 targets adopted by all
countries in the region (see Section 6.4). The amount of
captured emissions amounts 109 million tonnes or 8% of
globally captured CO2
emissions.
In the context of global climate policy, OECD Pacific
country pledges in NDCs indicate a regional target of
reducing energy-related emission by 12% by 2030,
relative to 1990. Japan, South Korea, New Zealand and
Australia strengthened their ambitions in NDC updates
the past year. The region is showing an increased ambition
level, but still falling short of Paris targets. Our forecast
indicates OECD Pacific energy-related emissions
decreasing 22% by 2030 compared to 2020 levels,
however declines only 7% compared to 1990 levels.
New Zealand was first in the region to enshrine in law its
2050 net-zero emission target (non-agricultural activities),
in 2019. South Korea and Japan have pledged carbon
neutrality by 2050 (October 2020), with the latter creating
a law obliging it to “strive to reach net-zero emissions by
2050, conditional on disruptive innovations”. Australia
unveiled its net-zero 2050 ambition ahead of COP26. For
the region, energy-related emissions are expected to be
0.4 GtCO2
per year in 2050, 77% less than in 2020. Figure
9.10.7.
331
Regional transitions CHAPTER 9
330
DNV Energy Transition Outlook 2022
PNZ – OECD Pacific
The pathway to net zero (PNZ) sees OECD Pacific CO2
emissions reduce from 1.9 Gt in 2020 to -0.25 Gt in 2050
(Figure 9.10.8). This reduction is achieved through
electrification, transitioning to hydrogen, and deployment
of CCS and DAC.
In transport, CO2
emissions reduce from 468 Mt in 2020
to 5 Mt by 2050; in buildings, CO2
emissions fall from 621
Mt in 2020 to -49 Mt by 2050; and in manufacturing, CO2
emissions reduce from 690 Mt in 2020 to -36 Mt in 2050.
CO2
emissions from the power sector reduce from 858 Mt
in 2020 to -93 Mt in 2050. Simultaneously the share of
electricity in final energy grows, rising from 25% in 2020
to 52% in 2050. Similarly, the share of hydrogen grows
from very low levels in 2020 to 29% by 2050.
Despite the slightly negative emissions, the region has
considerable oil (10%) and natural gas (2%) remaining in
the energy mix (Figure 9.10.9), mostly used in the non-
energy sector. Nevertheless, about 70% of the primary
energy is obtained from solar and wind in 2050.
About 70% of the primary energy is obtained
from solar and wind in 2050.
Economy-wide economic signals − The rise in average
region carbon prices, to USD 100/tCO2
in 2030 and USD
250/tCO2
in 2050, is reflected as costs for fossil fuels.
Transport − Bans are instituted on the sale of passenger
ICE vehicles from 2036 and of commercial ICE vehicles
from 2035, while subsidizing the transport electricity price
by 25% from 2022.
Buildings − A partial ban of 50% on all new fossil fuel
equipment in buildings is instituted by 2050, while the
lifetime of new fossil-fuel equipment is halved (from 15 to
7.5 years) from 2022. Additionally, all subsidies on natural
gas consumption are eliminated from 2022. These policies
enable faster phase-out of fossil-fuel infrastructure and
promoting electrification of buildings.
Manufacturing − Cost of capital of oil and natural gas
equipment in the manufacturing sector increases from 8%
in 2022 to 17% in 2050 while cost of capital of coal equip-
ment increases to 20%. An investment subsidy of 10% is
given to electric and hydrogen heat production. These
considerably reduce the attractiveness of fossil-fuel
equipment, enabling faster phase-out of fossil-fuel
technologies.
Energy supply − All new fossil-fuel power capacity
additions have reduced lifetimes (from 40 to 25 years), thus
enabling faster phase-out of fossil-fuel use for power
generation. New oil and gas exploration and development
are banned from 2024 and grid electricity is subsidized
when used for hydrogen production. In addition, capacity
investment support of 25% for dedicated renewables for
hydrogen production is implemented.
PNZ – Policy levers
332
DNV Energy Transition Outlook 2022
333
Regional transitions CHAPTER 9
Energy intensity is measured as primary energy consumption per unit of GDP. All regions experience a decline in this measure due mainly
to efficiency gains associated with the steady electrification of energy end-use, but also to the increasing share of renewables in electricity
generation, reducing losses to heat. Despite a 54% decline in energy intensity between 2020 and 2050, North East Eurasia remains the
region with highest energy intensity. Europe continues to require the least amount of energy per dollar of economic activity, followed by
South East Asia, and Greater China. By 2050, regional differences are, however, minor as regional energy intensities trend towards 2 MJ/
USD, with the exception of North East Eurasia.
Carbon intensity is measured as grammes of CO2
per megajoule of primary energy consumption. Decarbonization is most rapid in Europe
and Greater China with their carbon intensities declining by 72%, and 64%, respectively. North East Eurasia and Sub-Saharan Africa have the
least improvement in carbon intensity (18% and 6%). North East Eurasia will become the most carbon-intensive energy system in 2050. The
spread between the leading and lagging region remains fairly consistent between 2020 and 2050 at some 30 gCO2
/MJ.
Electrification is measured as the share of electricity in the final energy demand mix. This share is increasing everywhere and is fastest in
Sub-Saharan Africa, where electrification will almost triple, from 7% in 2020 to 15% in 2050. By 2035, Greater China will overtake OECD Pacific as
the most-electrified region with electricity meeting 35% of final energy. In 2050, Greater China leads with electrification at 46%, followed closely
by Europe, North America and OECD Pacific. By then, North East Eurasia and Sub Saharan Africa lag the rest of the world by a large margin.
Renewables include biomass, solar, wind, geothermal, and hydropower. Because of its high share of traditional biomass, Sub-Saharan Africa
remainstheregionwiththehighestshareofrenewables.MiddleEastandNorthAfricawillseethefastestrelativegrowthratein this measure, from
3% in 2020 to 27% in 2050, but because fossil fuels will still be dominant in 2050, it will have the second-lowest renewables share by then. OECD
Pacific will see the second-largest relative increase, with its share of renewables growing from 7% to 47%. Most of the world cluster between 40%
and60%ofrenewableinprimaryenergyconsumptionby2050,withonlyNorthEastEurasiaandMiddleEastandNorthAfricahavinglowershares.
9.11 COMPARISON OF REGIONAL ENERGY TRANSITIONS
334
DNV Energy Transition Outlook 2022
335
ANNEX
A1. TEN REGIONS A2. POPULATION
In this Outlook, we have divided the world into 10
geographical regions. These regions are chosen based
on geographical location, extent of economic develop-
ment, and energy characteristics.
Each region’s input and results are the sum of all coun-
tries in the region. Where relevant, weighted averages
are used, such that countries are assigned weights
relative to population, energy use, or other relevant
parameters. Distinctive characteristics of certain
countries – for example, nuclear dominance in France —
are thus averaged over the entire region.
In a few places, we refer to ‘OECD regions’; that
comprises the three regions North America, Europe
and OECD Pacific. We also use the terms ‘high income’,
‘medium income’ and ‘low income’ countries and
regions, broadly in line with the definition established
by the World Bank (2019).
Detailed discussions, results, and characteristics of the
regional energy transitions are included in Chapter 9 of
this Outlook, presenting regional analyses and forecast
energy transitions for each of the ten world regions.
North America (NAM)
Latin America (LAM)
Europe (EUR)
Sub-Saharan Africa (SSA)
Middle East and North Africa (MEA)
North East Eurasia (NEE)
Greater China (CHN)
Indian Subcontinent (IND)
South East Asia (SEA)
OECD Pacific (OPA)
FIGURE A.1
A typical energy forecast starts by considering the
number of people that need energy. Although energy
consumption per person varies considerably, and will
continue to do so, everyone requires access to energy in
one form or another.
The source most frequently used for population data and
projections is the UN Department of Economic and Social
Affairs, which publishes its World Population Prospects,
normally every other year. The forecast in the latest
update, published in July 2022, runs to 2100. Other
entities that separately produce population forecasts
include the US Census Bureau and the Wittgenstein
Centre for Demography and Global Human Capital in
Austria.
The Wittgenstein Centre places more emphasis than the
UN does on considering how future education levels,
particularly among women, will influence fertility.
As noted by Lutz (2014), urbanization in developing
countries will result in fertility rates falling; having many
children is a greater economic burden and less of a
necessity in cities than in traditional, rural settings.
Furthermore, evidence indicates that higher levels of
education among women are associated with a lower
fertility rate (Canning et al., 2015). Sustainable Develop-
ment Goal (SDG) #4 Quality Education and SDG #5
Gender Equality are providing further impetus to
improving female education.
Fertility is low in both the OECD and China, and in
non-OECD regions it is falling considerably. In Sub-
Saharan Africa , the reduction in fertility has been slower
than in other parts of the world, and the total fertility rate
is still at about 4.5 births per woman, falling by about 0.6
births per woman per decade. SSA, where many of the
low-income countries are located, also lags behind other
regions in the expansion of education. However, we
assume that urbanization and improved education levels
among women will, eventually, also accelerate the
decline in fertility rates in Africa.
The pandemic has been influencing fertility figures,
and the number of births in most developed countries
has fallen. The pandemic's effect on education has been
worst in developing countries, with schools being closed
for 12 to 18 months, and many young teenagers falling
out of school, giving potential higher fertility rates. We
noted the conclusion of a recent study of the impact of
COVID-19 across 29 countries in Europe and the Americas
which concluded that “The … pandemic triggered
significant mortality increases in 2020 of a magnitude not
witnessed since World War II in Western Europe or the
breakup of the Soviet Union in Eastern Europe.” (Aburto
et al., 2020). It is noteworthy that this demographic effect
coincides with world regions with the highest per capita
energy consumption. Research on the long-term impact
of these developments will be followed closely, but at the
moment, no change in our forecast figures has been
included.
The Wittgenstein Centre uses several scenarios related
to the five different ‘storylines’ that were developed in
the context of the Inter-governmental Panel on Climate
Change, IPCC (van Vuuren et al., 2011). The IPCC calls
these storylines “Shared Socioeconomic Pathways
(SSPs)”. In this Outlook, we follow the central scenario
(SSP2) for population and use it as a source of inspiration
for other forecast inputs.
Using the Wittgenstein population projections for SSP2,
we arrive at our 2050 population forecast of 9.3 billion,
which is an increase of 18% from the most recent UN
(2021) population estimate of 7.9 billion. By mid-century,
the global population will still be growing, but the rate is
reduced to 0.3% per year, and with SSA as the only region
with notable growth.
Our 2050 figure of 9.3 billion is 4% lower than the latest
UN median estimate of 9.7 billion. Had we used the UN
median population projection, most of our energy
demand figures would have increased commensurately,
but with regional variations. The difference would,
however, have been minor. The main uncertainty lies in
the long term (2100 and beyond) forecast, where most
mainstream forecasts, including the UN’s, now indicate
a peak in global population before 2100.
336
DNV Energy Transition Outlook 2022
337
ANNEX
A3. PRODUCTIVITY AND GDP
GDP per capita is a measure of the standard of living in a
country and is a major driver of energy consumption in
our model. From a production point of view, it is also a
good proxy for labour productivity, as it reflects the
amount of economic output per person.
We base our GDP per capita growth forecast on the
inverse relationship between GDP per capita level and
its growth rate. This relationship is a result of sectoral
transitions that an economy experiences as it becomes
more affluent. An increase in the standard of living in a
low-income country initially arises from productivity
improvements in the primary sector, and, thereafter,
from productivity improvements in the secondary sector.
In both sectors, the move from manual to industrial
processes carries vast potential for productivity improve-
ments. Mature economies employ increasing shares of
their GDP in the tertiary (service) sector. Although
services such as financial services and healthcare also
benefit from technology uptake, productivity improve-
ments tend to increase the quality, rather than the
quantity, of output. This implies that productivity growth
will slow down as
economies approach maturity, and, indeed, this has been
demonstrated empirically time and again.
Measured in purchasing power-adjusted constant (2017)
USD, historical GDP per capita developments from 1990
to today, along with forecast developments towards
2050, can be seen in Figure A.2. On a world-average
level, a compound annual growth rate (CAGR) of only
1.3%/yr is estimated in the 2019-2021 period, due to
COVID-19. COVID-19 will leave a permanent impact on
the economy. In 2023, the global economy will be 4.6%
smaller compared to the pre-pandemic projections. The
post COVID-19 boost in 2023 will result in some regional
economies growing slightly faster than they otherwise
would have, and in 2050 the loss declines to 2%.
Compared to our forecast last year, the only region which
has undergone a significant revision in terms of future
GDP forecast is North East Eurasia, due to the ongoing
war in Ukraine. The war has tremendously and irreversibly
affected the economies of both Russia (not least because
of Western sanctions) and Ukraine, two major countries in
the region. Compared to last year, our forecast for the
region’s GDP is 19.3% and 16.1% lower in 2030 and in
2050, respectively.
The fastest growth in GDP per capita, between 2021 and
2030, will be in Asia. The Indian Subcontinent (IND) will
have the highest growth rate, at an average of 6.4%/yr,
followed by South East Asia (SEA) at 5.0%/yr and Greater
China (CHN) at 4.5%/yr, as shown in Figure A.2.
As the Asian economies mature, growth in GDP per
capita will slow down after 2030. The period between
2030-2050 will be characterized by a more-even spread
of prosperity improvements globally, with highest growth
in the low-income regions. The region with the fastest
GDP per capita growth will therefore be SSA, with a
CAGR 5.2%/yr. Improvements in the standard of living in
economically developed regions will reduce to under
1%/ yr in the 2030-2050 period. The forecast beyond
2030 does not include any larger changes in the relative
positions among the productivity of the different regions.
World GDP is expected to grow from USD 134 trn/yr in
2020 to USD 295 trn/yr in 2050. This more than doubling
over the 30-year period is a result of a 20% increase in
population and a 83% increase in average GDP per
capita, with large regional differences. Figure A.3
illustrates the combined effect of population change
(x-axis) and GDP per capita growth (y-axis); the decadal
growth figures are included in Table A.1.
As Table A.1 shows, the world experienced a 3.3%
compound annual GDP growth from 2000 to 2020. In the
2040s, this will gradually slow to 1.9%/yr, combining the
effect of slowdown in population growth with the
economies of more and more countries becoming service
orientated. Nonetheless, most economies around the
world will continue to grow, albeit at varying rates, with
likely exceptions only in mature economies that are
experiencing marked population decline, such as Japan.
TABLE A.1
Compound annual GDP growth rate by region
2000-2020 2020-2030 2030-2040 2040-2050 2020-2050
NAM North America 1.7% 2.4% 1.2% 1.0% 1.5%
LAM Latin America 1.9% 2.9% 3.0% 2.7% 2.9%
EUR Europe 1.1% 2.1% 1.1% 0.7% 1.3%
SSA Sub-Saharan Africa 4.3% 4.7% 5.3% 5.2% 5.1%
MEA Middle East and North Africa 3.4% 3.9% 3.2% 2.6% 3.3%
NEE North East Eurasia 3.3% 0.7% 2.5% 2.4% 1.8%
CHN Greater China 8.1% 4.8% 2.0% 0.7% 2.5%
IND Indian Subcontinent 5.8% 6.6% 4.3% 3.4% 4.8%
SEA South East Asia 4.8% 4.8% 3.5% 2.6% 3.6%
OPA OECD Pacific 1.4% 1.6% 0.9% 0.4% 1.0%
World 3.3% 3.7% 2.5% 1.9% 2.7%
338
DNV Energy Transition Outlook 2022
339
ANNEX
A4. RESOURCE LIMITATIONS
Our forecast describes the production and use of energy
towards 2050. During the coming three decades there
will be a profound shift in world energy use, which has
relied on fossil sources since the Industrial Revolution,
and which is now headed for an energy mix where
renewables take a slightly-larger-than 50% share by 2050.
This shift will not only impact the structure of the energy
system but also the type of raw materials and land and
surface areas needed to support the transition. Coal
mines will shutter, and nickel and lithium mining boom;
instead of extracting oil and gas from offshore platforms
there will be turbines harvesting wind resources for
energy.
One central feature of our forecast is the increasing rate
of electrification of the world’s energy system. Road
transport will increasingly be powered by electricity and
energy stored in batteries. In 2050, there will be 1.3bn
passenger EVs on the road and transitions on this scale
require sufficient raw materials to build the infrastructure
and end-use technology and equipment. Supply of
natural resources must be capable of expanding at rates
that can support demand, both sustainably and cumula-
tively, between now and the future. Although we expect
there will be local resource demand challenges and
price volatility in the future, the overall picture is that
there are enough raw materials and land to support the
transition. Expansion of existing extractive industries
combined with agility, technology and materials
choices, and greater recycling and re-use of resources
will be important for ensuring that major disruptions are
avoided.
Our Pathway to Net Zero (Chapter 8) is a ‘back cast’
designing a future compliant with the Paris Agreement
and limiting global warming to 1.5°C. The pathway is
prescriptive in that it describes one possible pathway
that is not necessarily optimally designed using
multi-variant selection criteria. Success in implementing
this or other pathways to net zero requires war-footing
policies which includes the extensive use of land and
surface areas as well as intensified raw material demand
extraction. Land, sea and mining permits, financing,
and distribution of existing resources would need to be
managed through multilateral collaboration that takes
into account the complex challenges facing reaching
1.5°C, and which would have to be far more effective in
resolving resource access and limitations than market
forces alone. How such a scenario could play out is the
subject of future research. At present, our investigation
of resource limitations has been confined to our ‘most
likely’ forecast – the main subject of this report.
Land and sea-areas to support renewable growth
We forecast a 20-fold increase in solar PV capacity by
2050, with sufficient land and building area as a prereq-
uisite to support such expansion. In our model, solar PV
is installed at utility scale, in microgrids, on the roofs of
residential or commercial buildings or off-grid as
capacity to produce hydrogen. The first two of these
categories combined with off-grid capacity compete
with other uses of land. In our Outlook, we forecast 20%
of all solar to be installed on rooftops and commercial
buildings globally. 6% of total capacity (1TW) is further
installed to support hydrogen production. Applying an
estimated average 60 MW/ km2
for non-rooftop solar-PV
installations indicates a requirement of less than 1% of
total land area globally in 2050. Even for regions with
large shares of solar PV in their power mix, the land-area
requirement is not unmanageable. For example, 2% of
agricultural land in South East Asia and 1.6% of the
Indian Subcontinent agricultural land will be used for
solar PV installations in 2050. Co-use of land for grazing
or for certain types of agriculture is also possible, and
therefore it seems unlikely that the expansion of solar PV
will encounter land-area limitations overall. We are also
seeing a growing interest in and developments involv-
ing floating solar PV where the available land issue is
less of a concern.
We predict a 10-fold capacity rise in wind energy, and
the question arises as to whether there will be sufficient
land and ocean-surface area. Onshore wind has a
relatively small footprint, effectively just the base of the
tower, so there will be no lack of land area. However, the
siting of tall, rotating structures in densely populated
areas is a growing societal concern. In our analysis, we
have reviewed the overall technical potential and only
included areas with sufficient wind speeds, while
avoiding densely populated or ultra-remote locations.
With these limitations and using an estimated area
demand of 5 MW/km2
giving almost 1 km of space
between each turbine, then all wind farms cover
900,000 square-km. This equates globally to less than
1% of available land, or in comparison about 2% of
agricultural land. The expected capacity represents
1.6% with regional variations between 1-14%, of the
technical potential. Thus, it is not availability of land that
will be the limiting factor, but rather peoples’ collective
acceptance of visual, noise and other environmental
impacts associated with land-based wind power.
The overall picture is that there are enough
raw materials and land to support the
transition.
In contrast, offshore wind is located far from popula-
tions and provides plentiful energy in our Outlook. Our
analysis and modelling include both fixed offshore wind
and, in water depths exceeding 50 m, floating offshore
wind. Globally, there will be sea area and coastline to
accommodate the forecast amount of offshore wind.
Europe and Greater China will account for 56% of global
installed offshore wind capacity. Europe and the
North-Sea basin are expected to install mostly fixed
(86%) but also floating offshore wind. Greater China will
install the largest amount of offshore wind. The mean
water depth of 44 m off the region’s coastline and in the
Yellow Sea is well suited for this purpose, so there, 86%
will be bottom fixed. When considering the technical
capacity, only a fraction of the installations will be
floating offshore wind, but Greater China as well as the
Indian Subcontinent will install 50% and 75% respec-
tively of the technical potential of fixed offshore wind by
2050. This would mean that Greater China (including
Taiwan) coastal areas would utilize almost 40% of its
coastline for installing offshore wind. Growing concerns
concerning biodiversity and other uses of the ocean will
need to be managed to successfully install such large
amounts of offshore wind. Offshore energy extraction,
fishing as well as the growing area of ocean-based food
farming will need to collaborate successfully — and
explore synergies — to ensure enough areas for all
parties to thrive.
Water scarcity and the energy transition
Water is a scarce resource and water stress is a global
challenge, more stressful is some regions than in others,
which is expected to be further exacerbated by climate
change. Access to and additional cost for water can have
an impact on the energy transition. As part of under-
standing the effect, we have identified three areas of the
energy system where water is of importance. Cooling in
power plants, electrolysis of water to produce hydrogen,
and increased use of water as part of CCS implementation.
Thermal power plants use water for cooling. Already
today, heat waves create a double challenge as use of air
conditioning peaks when both ambient air and water
temperature makes cooling less effective. In such
situations, curtailments may be required to prevent
overheating. Additionally, warmer temperature leads to
dry spells and less available water.
Such phenomena will worsen in the future where air
conditioning will be more extensive and cooling water
will experience shortages and less cooling effect. Coffel
and Mankin (2021) find that for every degree Celsius of
warmer weather, curtailment increases by 1 percentage
point. On peak days in a 2°C degree future, they find that
curtailment (for this reason) in thermal power plants will
increase by 4.5%. They cite that the 2019 heat wave in
France forced 8% of French power plant capacity (mainly
nuclear) to be curtailed. On the cost side, Lubega and
Stillwell (2019) find that cooling water costs are so low
that using higher water costs as an incentive for improving
energy efficiency (thus automatically impacting water
use) will not work. Water costs are such a small fraction
of total costs that to impact plant economics, water
costs would have to be multiples of municipal water
costs which has little chance of happening.
340
DNV Energy Transition Outlook 2022
341
ANNEX
Electrolysis-based hydrogen production in 2050
represents over 50% of all hydrogen produced.
However, when reviewing the costs of such production,
water costs are negligible in contrast to the cost of
power for electrolysers. Even when water is assumed to
be obtained through desalination, the cost for water will
be around 2% of total cost (Blanco, 2021). In energy
terms, water use is about 1% of total energy consumption
when operating an electrolyser plant.
CCS uses water in pre-combustion (in power plants) and
post-combustion (for SMR) processes. In both instances,
increases of water use compared to the non-CCS case,
an increase of 100% has been observed. Thus, in regions
with growing power generation or manufacturing
sectors utilizing CCS, a doubling of water demand could
impact such projects. For this reason, future CCS
processes are projected to add less than half, typically a
quarter, of a CCS process’ water consumption. Yet, even
an increase by one quarter will come on top of increased
water consumption from expanded thermal energy use
in manufacturing as well as combusting power instal-
lations. Thus, precaution should be observed in regions
with expected growth of CCS combined with manufac-
turing or power generation, such as in the case of the
Indian Subcontinent or South East Asia.
In conclusion, a warmer future will make thermal power
plants marginally less fit than today as water shortages
and increased water temperatures will be more prevalent.
Yet, the combined effect of less thermal power output,
and the marginal cost component provided by thermal
plants’ water usage leads us to conclude that the power
sector will not be significantly impacted by water-related
challenges.
There is no reason to make water scarcity an economic
risk for electrolysis. On the other hand, just as for
thermal power plants, electrolyser location will need to
take water availability into consideration: There may be
locations where lower power costs come at the expense
of water availability. But even ‘energy islands’ will be
able to solve this through desalination of surrounding
salt water, as both the costs and the energy use of
providing such water will be dwarfed by power
consumption and non-water infrastructure costs.
CCS typically increases water use in a power plant or an
SMR facility by 25 to 50 %, depending on the technology
used. Yet, since the uptake of CCS coincides with
decreasing use of combusted energy, post-combustion
power plants will not lead to increased water stress in
most regions. However, in the Indian Subcontinent and
South East Asia, where thermal combustion will expand
at the same time as CCS is added, stresses might
hamper the roll-out of CCS and/or increase water costs.
Especially in the context of a ‘Pathway to Net Zero’, CCS
installations and electrolyser capacity are significantly
higher, and thus locations should be investigated for
water availability today and in the future.
The forecast growth in battery capacity is by
far the largest driver of demand for minerals
containing lithium, nickel, and cobalt used in
battery anodes and cathodes and is where we
expect the biggest supply challenges.
Demand for raw material
We have considered the energy transition’s footprint on
demand for materials. For example, solar PV panels are
expected to consist mainly of crystalline silicon cells
(DNV, 2022c), where the main component is silicon,
which is considered an abundant material (USGS, 2020),
even though there are some limitations to processing
facilities to enrich the silicon to a high enough grade
needed for the photovoltaic panels. New, thin-film
technologies, which are not yet prevalent but are
showing potential, will further reduce the overall
demand for material. Wind turbines use common
building materials, but the vast amounts of steel and
cement necessary will put pressure on those hard-to-
abate sectors to reduce their embedded carbon
footprint during production to ensure low lifecycle
emissions from wind. There could be supply-chain
challenges for rare earth elements, which are abundant,
but expensive and resource-intensive to extract,
especially in the case of neodymium used for permanent
magnets in the turbines.
Growth in the number of EVs and vehicle battery sizes
will drive a 300-fold increase in global battery capacity
in 2050. This will spur the demand for minerals currently
used in Lithium-ion batteries unless new battery
chemistries are developed. The forecast growth in
battery capacity is by far the largest driver of demand
for minerals, containing, lithium, nickel, and cobalt used
in battery anodes and cathodes and is where we expect
the biggest supply challenges. Battery manufacturing
capacity is growing exponentially and there are several
initiatives to increase supply for lithium and nickel, while
for cobalt the supply chain is less geared for demand
surges and we therefore identify cobalt as a critical
resource for the energy transition. See our ETO (DNV,
2020a) for a detailed analysis of cobalt supply and
demand. The price of cobalt has fluctuated with a
doubling in cost and before reducing over the last year
(LME, 2022); there are clear signs that auto manufacturers
are diversifying their use of battery chemistries. BYD, a
big Chinese manufacturer focuses solely on LFP; 95% of
commercial vehicles in China, and many of those
exported, use LFP chemistry (Campbell, 2019). For its
standard range model 3 vehicle, Tesla has decided to
use LFP batteries without cobalt, while for their long
range and performance vehicles they use a cobalt-
based battery but are working on developing a cobalt-
free high-performance battery.
In our view, the energy transition we forecast will not be
significantly constrained globally by the availability of
either land/sea area, water or raw materials. Narrowing
the perspective, some regions may struggle to find raw
materials and some land/sea area will be contending
with competing uses, while others will enjoy an abun-
dance. Historically, such imbalances would be solved by
global collaboration and trade. The intensified focus on
energy security also includes security of supply of
critical resources, so many regions are reviewing their
strategy and dependence on other regions providing
the raw materials necessary for securing their energy
supply or transition. The effect will further augment
existing imbalances and could affect costs in the short,
to medium term and warrants further investigation.
Also, when considering a more ambitious energy
transition focusing on reducing emissions in line with a
Paris compliant 1.5°C future, as described in Chapter 8,
there will be a further strain on resource demands. Every
national plan for reaching net zero, should include a
plan for the needed natural resources and how to secure
such supply. Many of the minerals and metals required
are in low-income countries benefitting climate finance
support, which could be an important aspect of negoti-
ations around accessing such resources. We aim to
revisit the topic of resource availability and understand
the possible limitations a net zero future would entail in
future research.
342
DNV Energy Transition Outlook 2022
343
ANNEX
A5. MODEL DESCRIPTION
The basis for our forecast is our Energy Transition Outlook
Model – an integrated system-dynamics simulation model
that reflects relationships between demand and supply in
several interconnected modules.
Each sector of the energy system (see Figure A.4) is
modelled by modules representing:
— final energy demand (buildings, manufacturing,
transport, non-energy, and other)
— energy supply (coal, gas, and oil production)
— transformations (power generation, oil refineries,
hydrogen production, biomethane production)
and other relevant developments (economy, grids,
pipelines, CCS, energy markets, trade volumes,
emissions)
These modules exchange information regarding
demand, cost, trade volumes, and other parameters to
provide a coherent forecast.
Modelling process
The equations and parameters in the model are based
on academic papers, external databases, commercial
reports, and expert judgement from both within and
outside DNV. Examples of external databases used
include IEA World Energy Balances, IRENA Capacity 
Generation Database, GlobalData Power Database,
Marklines Automotive Industry Portal, Rystad Upstream
Database, UN Comtrade Database, and Clarksons
Shipping Intelligence Network.
For reliable forecasting, we have run dozens of work-
shops and discussions with DNV industry experts. Nearly
100 people have been involved in this work, acting as
conduits to historical data sources in the many domains,
as quality assurers of model sectors and interrelation-
ships, and as expert assessors of end results.
Timescale
The Energy Transition Outlook model covers the period
1980–2050. Historical simulation outputs have been used
to test the model’s ability to replicate historical develop-
ments, and hence validate our forecast. The model is a
continuous-time model, with years as the base time unit:
it is designed to reflect dynamics that are happening only
at the yearly scale or longer. Shorter scale dynamics, such
as within-year seasonality of oil demand, are implied in
annual parameters and are not directly reflected in the
model. An exception is the power-market module, which
balances supply and demand at an hourly resolution.
With the model deliberately ignoring short-term fluct-
uations occurring over months or even a few years, the
Outlook has less reliability over shorter time periods.
For example, although the average growth rate of gas
demand over 10-year intervals can be compared with
confidence, analysing the rate for a particular year in
isolation would not necessarily yield meaningful insights.
We depart from this approach to incorporate the
expected short-term, as well as long-term, impact from
the COVID-19 pandemic as well as from Russia`s invasion
in Ukraine on social behaviour, economic activity, and
energy consumption.
Geographical scale
The spatial resolution of the model is limited to 10 world
regions. Regions interact directly, through trade in
energy carriers, and, indirectly, by affecting, and being
influenced by, global parameters, such as the cost of
wind turbines, which is a function of global capacity
additions. Although we do not explicitly model each
country or state within regions, we account for variability
through statistical distributions of the parameters. For
example, the investment cost of a particular power-station
type is modelled as a normally distributed parameter
to reflect differences between countries and sub-
technologies. This allows the model to reflect that
capacity additions might occur in some countries,
despite the possibility that the average cost of a given
technology may be uncompetitively high.
Modelling principles
Our main priorities when designing the Energy Transition
Outlook model were to include three key characteristics
of the world energy system: interconnectedness, inertia,
and non-linearity. The whole energy supply chain, from
demand to supply, is one huge interconnected system.
What happens in solar PV technology influences
power-generation demand for coal, which, in turn, affects
shipping volumes for bulk carriers, and oil demand for
the maritime subsector. Inertia is present in all parts of
the energy system, from household appliances to oil
refineries, and slows energy transitions. Also, many
processes are non-linear: a unit increase in one factor
does not always have the same effect on another variable.
Our model reflects these key characteristics. Whereas
many energy models are econometric and assume
equilibrium conditions, our model is not. Instead, it
simulates the consequences of its assumed goals,
parameters, and interrelationships. The model explicitly
reflects the delays in reaching a desired state and,
consequently, is able to forecast the path and speed of
energy transitions.
Our model does not assume optimality or rationality as a
prerequisite. Its methodology is strongly influenced by
behavioural economics, where, given the particularities
of a given situation, decision making can be predicted
(Thaler, 2015). However, the decisions themselves are not
necessarily rational, in the utility-maximizing sense of the
term. For example, we reflect the fact that more emphasis
is placed on the initial purchase price of a vehicle by
private buyers than by commercial purchasers. Thus,
private buyers may choose a technology that has a lower
upfront cost, although it may be more expensive from the
perspective of total cost of ownership.
Our Energy Transition Outlook model is not stochastic,
but deterministic. We have used past data and our best
judgment to provide expected values for all input
parameters, and each run of the model gives an exact
output as there is no randomness in the model. However,
there are, of course, multiple sources of uncertainty in the
outputs, and the model cannot provide confidence levels
for these. In order to address this to some extent, sensitiv-
ity tests have been run to help us understand how the
model results change when selected input parameters
are adjusted. Our aim is to present a transparent model,
not a black box. This is because we believe that this
makes it easier to discuss the results. Furthermore, if it is
of interest to test the consequences of an alternative
assumption or to try a different value, perhaps due to
disagreement with a value chosen, then that is easily
accomplished. Although the exact calculations that
emerge from a complex model are therefore not
amenable to simple checking with a pocket calculator, we
are clear about the parameters that have been used and
how they are related. Detailed documentation of the
model is provided elsewhere (DNV, 2022d).
Continuous improvement
The structure and input data of the model are
continually updated in order to:
— provide a more complete and accurate
representation of the world energy system;
— generate new outputs relevant to our stakeholders;
— reflect recent changes in the energy sector.
—
The most significant changes to the model since
our 2021 Outlook are:
— revision of the hydrogen demand and supply
sector including hydrogen trade
— introduction of ammonia and e-fuels as new
energy carriers;
— revision of the manufacturing sector. There is a
new breakdown to cement production and the
petrochemical sector
— a revised formulation for the effect of insulation
and retrofitting on the space heating and cooling
energy demand of buildings
— a revised formulation for the uptake of hydrogen
in commercial vehicles
— introduction of inter-regional power trade
— impact assessment of material shortages and
long-term impacts of Ukraine-Russia War on
the energy system
— updated parameters for heat pumps
— revision of nuclear parameters to reflect cost
overruns and the impact of SMRs
344
DNV Energy Transition Outlook 2022
345
ANNEX
Energy demand
We use policy and behavioural effects, either explicitly, as
in the effect of increased recycling on plastics demand,
or implicitly, such as the impact of expected electricity
prices on electrification of heating. Generally, we estimate
sectoral energy demand in two stages. First, we estimate
the energy services provided, such as passenger-
kilometres of transport, tonnes of manufacturing, or
useful heat for water heating. Then we use parameters on
energy efficiency and energy-mix dynamics to forecast
the final energy demand by sector and by energy carrier.
We use non-linear econometric models to estimate
regional demand for energy services. Population and GDP
per capita are the main drivers, but we also incorporate
other technological, economic, social, and natural
drivers, as necessary.
In road transport, the number of vehicles required rises
as regional GDP increases. This is a non-linear effect that
reaches saturation at different levels for each region.
Vehicle demand is also affected by driving distance and
vehicle lifetime, both of which are influenced by the
uptake of autonomous and shared vehicles. The link
between maritime trade and production/ consumption
balance of energy and non-energy commodities is
explicitly modelled. For non-cargo vessels, air travel and
rail passengers, and freight demand, GDP is used as the
driving factor.
In the buildings sector, we estimate the energy required
for residential and commercial buildings for five end
uses. Together with insulation and climate, the floor area
of buildings is the major determinant for regional
space-heating and cooling demand. Hot-water demand
is linked to standard of living and population. For cooking,
we use the useful heat delivered as the energy service,
and estimate it by household size and population. GDP
from the tertiary sector, which increases with GDP per
capita, is a major factor for commercial buildings, driving
both the floor area and the demand for various energy
services.
The energy service we use for manufacturing is the value
added in USD, estimated separately for base materials,
manufactured goods, and construction and mining. For
iron and steel, we measure the output in tonnes. Total
manufacturing value added in each of our world regions
is driven by the secondary sector GDP. Total value added
is split into subsectors using historical shares. Demand
for iron and steel is linked to building construction,
vehicle production, shipbuilding, and economic activity.
In terms of energy services, we distinguish between
process and non-process heating, machines and appli-
ances, iron ore reduction, and on-site vehicles.
The choice of energy carrier is based on levelized costs in
buildings, manufacturing and EV uptake. For the energy
mix of other end uses, our forecasts are derived from
extrapolating past-usage trends into the future. These
trends have been subject to expert judgement in our
workshops, and adjustments have been made where
deemed appropriate.
Energy carriers
Among the 12 energy carriers that we model, seven are
also primary energy sources; i.e. they can be used
without any conversion or transformation process. The
others are secondary forms of energy obtained from
primary sources. Primary energy sources are coal
(including peat and derived fuels), oil, natural gas
(including methane, ethane, propane, butane and bio-
methane), geothermal, bioenergy (including wood,
charcoal, waste, biogases, and biofuels), solar thermal
(thermal energy from solar water heaters), and off-grid PV
(electricity from solar panels not connected to the grid).
Secondary energy sources are electricity, direct heat
(thermal energy produced by power stations), ammonia,
e-fuels and hydrogen.
Energy transformations
We place special emphasis on electricity generation. We
have calculated the regional equilibrium price, supply,
and demand for 12 power-station types, four storage
technologies, 12 load segments, and power-to-hydrogen
conversion for hourly intervals over the whole year. Hourly
profiles for load segments and variable renewable
generation are deterministic but vary over years. Certain
load segments, and all but variable renewable generation
and storage technologies, respond to price. For power
station and storage investments, we employ a profitability-
based algorithm. Our estimate of the required additional
generation capacity is based on increased electricity
demand and estimated capacity retirements. We
determine the mix of capacity additions based on a
probabilistic model that makes use of the expected
received price and the levelized cost of electricity. We
explicitly estimate the effect of renewable support,
carbon price, and the cost of CCS. The investment for
storage is driven by expected received price and levelized
cost of storage, both of which are informed from the
hourly power-market module. The role of direct heat is a
diminishing one. Consequently, we use a simple extra-
polation to estimate regional mixes of direct heat supply.
Hydrogen is supplied either by electrolysis or from fossil
fuels, through steam methane reforming (SMR) or coal
gasification. We make a distinction between hydrogen
supplied via electrolysis from grid electricity and via
off-grid dedicated renewable-based electrolysers.
Annual operating hours and expected electricity price
for electrolysis are calculated dynamically in the hourly
power-market module. The levelized cost of hydrogen
from competing technologies determines the investment
mix in hydrogen production capacity.
Fossil-fuel extraction
When it comes to the supply of energy from primary
sources, the model focuses on the production of oil,
natural gas, and coal. For oil and gas, we use a cost-based
approach to determine regional production dynamics.
On the oil-supply side, we model production capacity as
a cost-driven global competition between regions and in
three field types: offshore, onshore conventional, and
unconventional. Since transportation is typically less than
10% of the final crude-oil cost, we use total breakeven
prices of prospective fields to estimate the location and
type of future oil production.
We model regional gas production slightly differently
from that of crude oil. First, we estimate the fraction of
gas demand to be supplied from the region’s own
sources, based on production and transportation costs.
Then, to determine the development of new fields
constrained by resource limitations, we set three field
types to compete on breakeven prices on a regional
scale. Regional refinery capacities and gas liquefaction /
LNG regasification capacities are also part of the model.
Coal production is modelled by differentiating between
hard coal and brown coal. Each region’s hard-coal supply
reflects its mining capacity, which expands as demand
increases and is limited by its geologically available
reserves. For brown coal, we assume that most regions
are self-sufficient.
Trade
Trade, especially seaborne trade, of energy carriers, is a
vital component of the model. For crude oil, the gap
between a region’s production and refinery input
determines the surplus for export or the deficit to be met
by imports, which is mainly transported on keel. For
natural gas, any shortfall in meeting demand from
regional production is allocated to exporting regions
according to their current shares as gas trading partners
and future changes in gas import costs between trade
partners. Intra-regional trade is determined as a constant
multiplier of regional gas demand. For coal, as for natural
gas, we assume a stable mix and shares of trade partners.
Coal from exporting regions is imported by those regions
with domestic shortfalls. Our manufacturing sector
provides a baseline for non-energy commodity trade of
raw materials and manufactured goods.
All the forecast data in DNV’s suite of Energy Transition
Outlook reports, and further detail from our model, is
accessible on Veracity – DNV’s secure industry data
platform.
eto.dnv.com/forecast-data
Download our forecast data
346
DNV Energy Transition Outlook 2022
347
Energy
prices
Population
GDP per capita
Battery price
Autonomous
and communal
driving
Retirements
Unit energy use
of new vehicles
Lifetime
Variability
in electricity
demand
Vehicle fleet
Levelized
cost of
electricity
Profitability
of storage
Energy use
of fleet
Travel distance
per vehicle
Storage
additions
Power grid
strength
Accumulated
storage
additions
Vehicle sales
by type
Fuelling
and repair
availability
Government
support
Tax
Vehicle
demand
Available
storage
Grid
investments
Energy demand
by energy carrier
Energy use
of vehicle
additions
Electricity
demand
Fossil fuel
demand
Battery size
Resources
Refuelling
speed
Fossil fuel
supply
by type
and region
Range
Maritime
energy
demand
Aviation
energy
demand
Investment cost
Rail
energy
demand
Electricity
price
Fossil fuel
production
cost
Installed
capacity
Operating
cost
Power station
additions
by type
Capacity
Retirements
Firm capacity
demand
Use of fast
recharging
Firm
capacity
availability
Share of
variable renewables
in capacity
Fast recharging
density
Accumulated
additions
Capital cost
Cumulative EV
sales
Variable
cost
Generation
hours
Received
electricity
price
Vehicle
utility
Profitability
Subsidy
Variability
in electricity
price
Cost of
ownership
TRANSPO
R
T
ROAD
F
O
S
S
I
L
F
U
EL EXTRACTION
POW
ER SUPPLY
M
A
NUFACTURI
N
G
Demand feedback
process details
not shown
BUILDINGS
Demand feedback
process details
not shown
1
FIGURE A.4
Energy Transition Outlook model showing the interconnectivity
of energy systems and technologies
Novel shipping technologies
Pipelines for low-carbon gases
Meshed
HVDC grids
New battery
technologies
Developments in solar PV
Green hydrogen
Floating Wind
EVs and grid integration
Waste to fuel
Carbon capture
and storage
REFERENCES
Abu Dhabi Government Media Office (2022) Abu Dhabi Depart-
ment of Energy’s Low-Carbon Hydrogen Policy and Regulatory
Framework to Accelerate UAE’s National Hydrogen Strategy.
https://www.mediaoffice.abudhabi/ar/
Aburto, J.M. et al. (2022) ”Quantifying impacts of the COVID-19
pandemic through life-expectancy losses: a population-level study
of 29 countries”. International Journal of Epidemiology, Vol. 51, Issue
1, February. https://doi.org/10.1093/ije/dyab207
ADNOC (2021) Mitsui and GS Energy to Join TA'ZIZ in World-Scale
Low-Carbon Blue Ammonia Project. Press release 16. November.
Available at: https://www.adnoc.ae/en/news-and-media/press-re-
leases/2021/mitsui-and-gs-energy-to-join-taziz-in-world-scale-
low-carbon-blue-ammonia-project
AECOM (2020) Going the extra kilometre: Moving Southeast Asia’s
cities forward — The future of infrastructure. By Scott Dunn. Available
at: https://infrastructure.aecom.com/2020/going-the-extra-kilo-
metre-moving-southeast-asias-cities-forward
African Business (2022) Independent power projects conquer new
territory in Africa. By James Gavin, 8. July. Available at: https://
african.business/2022/07/energy-resources/independent-pow-
er-projects-conquer-new-territory-in-africa/
AfDB — African Development Bank (2017) The Bank Group’s
Strategy for The New Deal on Energy for Africa 2016 – 2025.
©African Development Bank
Allianz (2022) Global claims review 2022 – Trends and developments
in corporate insurance losses. ©2022 Allianz Global Corporate 
Specialty SE.
ACP – American Clean Power (2022) New Data Confirms Depart-
ment of Commerce Inquiry Severely Disrupts U.S. Utility-Scale Solar
Market. By Heather Zichal, 19. April. https://cleanpower.org/blog/
new-data-confirms-department-of-commerce-inquiry-severe-
ly-disrupts-u-s-utility-scale-solar-market/
Archer, D. et al. (2009) “Atmospheric Lifetime of Fossil Fuel Carbon
Dioxide”. Annual Review of Earth and Planetary Sciences, Vol.
37:117–34. https://doi.org/10.1146/annurev.earth.031208.100206
ASEAN (2021) ASEAN Power Updates 2021. https://aseanenergy.
org/asean-power-updates-2021/
Ayele, S. and Mutyaba, V. (2021) Chinese-Funded Electricity
Generation in Sub-Saharan Africa and Implications for Public Debt
and Transition to Renewable Energy. IDS Working Paper 557,
Brighton: Institute of Development Studies
Batres, M. et al. (2021) “Environmental and climate justice and
technological carbon removal”. The Electricity Journal, Vol. 34,
Issue 7. https://doi.org/10.1016/j.tej.2021.107002
Blanco, Herib (2021) Hydrogen production in 2050: how much water
will 74EJ need? 22. July. Available at: https://energypost.eu/
hydrogen-production-in-2050-how-much-water-will-74ej-need/
Bloomberg (2022a) Breaking Indonesia’s Coal Habit May Cost Rich
Nations Billions. Available at: https://www.bloomberg.com/news/
features/2022-06-07/breaking-indonesia-s-coal-habit-may-cost-
rich-nations-billions
Bloomberg (2022b) Iran Moves More Oil Onto Ships in Preparation
for a Nuclear Deal. Available at: https://www.bloomberg.com/
news/articles/2022-02-23/iran-moves-more-oil-onto-ships-in-
preparation-for-a-nuclear-deal
Bloomberg (2022c) Saudi Arabia to Start Building Green Hydrogen
Plant in Neom. By Vivian Nereim, March 17. Available at: https://
www.bloomberg.com/news/articles/2022-03-17/saudi-arabia-to-
start-building-green-hydrogen-plant-in-neom
BNEF (2022) Corporate clean energy buying tops 30GW mark in
record year. 31. January. Available at: https://about.bnef.com/blog/
corporate-clean-energy-buying-tops-30gw-mark-in-record-year/
Bordoff, J. and O’Sullivan, M.L. (2022) “The new energy order – How
governments will transform energy markets”, Foreign Affairs, July/
August. https://www.foreignaffairs.com/articles/energy/2022-06-
07/markets-new-energy-order
Boston University Global Development Policy Center (2022)
Chinese Loans to Africa Database. Available at: https://www.bu.
edu/gdp/chinese-loans-to-africa-database/. Accessed 30. August.
Business Standard (2022a) China population to shrink for the first
time in 60 years. By Xiujian Peng, 30. May. Available at: https://www.
business-standard.com/article/international/china-population-to-
shrink-for-1st-time-in-60-yrs-what-it-means-for-
world-122053000429_1.html
Business Standard (2022b) India's bet on gas-based economy runs
into Ukraine war challenges. By S. Dinakar, 18. July. Available at:
https://www.business-standard.com/article/specials/india-s-bet-
on-gas-based-economy-runs-into-ukraine-war-chal-
lenges-122071801004_1.html
References
348
DNV Energy Transition Outlook 2022
349
CADGAT (2022) Fossil Fuels in Central Asia: Trends and Energy
Transition Risks. https://osce-academy.net/upload/file/CADGAT_
data_article_28.pdf
Campbell M. and Tian Y. (2019) The World’s Biggest Electric Vehicle
Company Looks Nothing Like Tesla. Bloomberg Europe Edition.
Available at: https://www.bloomberg.com/news/
features/2019-04-16/the-world-s-biggest-electric-vehicle-compa-
ny-looks-nothing-like-tesla
Canning D. et al. (2015) Africa's Demographic Transition: Dividend
or Disaster? Africa Development Forum series. Washington D.C.,
World Bank Group.
Carbon Policy Watcher (2022) The Top 20 Carbon Dioxide Emitters.
Update 5. September. Available at: https://www.climate-poli-
cy-watcher.org/greenhouse-gases-2/the-top-20-carbon-diox-
ide-emitters.html
Carbon Pricing Leadership Coalition (2017) Report of the High-
Level Commission on Carbon Prices. The World Bank, Washington,
D.C., 29. May. https://www.carbonpricingleadership.org/
report-ofthe-highlevel-commission-on-carbon-prices/
CAREC and ADB (2019) CAREC Energy Strategy 2030 — Common
borders. Common solutions. Common energy future. November ©
2019 Asian Development Bank.
CERRE — Centre for Regulation in Europe (2021) Electricity and gas
coupling in a decarbonised economy. March. © Copyright 2021,
Centre on Regulation in Europe
China Briefing (2021) Understanding China’s Action Plan for
Reaching Peak Carbon Emissions by 2030. Available at: https://
www.china-briefing.com
ClientEarth (2021): The Greenwashing Files. Available at: https://
www.clientearth.org/projects/the-greenwashing-files/
CAT — Climate Action Tracker (2021a) Glasgow’s 2030 credibility
gap: net zero’s lip service to climate action. 9. November. https://
climateactiontracker.org/publications/glasgows-2030-credibility-
gap-net-zeros-lip-service-to-climate-action/
CAT (2021b)Climatetargetupdatesslowasscienceramps up need for
action. September. https://climateactiontracker.org/documents/871/
CAT_2021-09_Briefing_GlobalUpdate.pdf
Coffel E.D. and Mankin J.S. (2021) “Thermal power generation is
disadvantaged in a warming world”. Environmental Research
Letters. 16. 024043. https://doi.org/10.1088/1748-9326/abd4a8
Conventus Law (2022) Kazakhstan — Carbon credits — A tool to
control greenhouse gas emissions. https://conventuslaw.com/
report/kazakhstan-carbon-credits-a-tool-to-control/
Council of the European Union (2021) Joint Declaration of the
Eastern Partnership Summit. Brussels, 15. December https://www.
consilium.europa.eu/media/53527/20211215-eap-joint-declara-
tion-en.pdf
DNV (2022a) Hydrogen forecast to 2050. Available at: dnv.com/eto
DNV (2022b) The Ukraine war will not derail Europe’s energy
transition. Available at: dnv.com/eto
DNV (2022c) Maritime Forecast to 2050. Available at: dnv.com/eto
DNV (2022d) The Energy Transition Outlook 2022 — Model
documentation. Forthcoming
DNV (2021a) Energy Transition Outlook 2021. Available at: dnv.com/
eto
DNV (2021b) Financing the Energy Transition. Available at: dnv.com/
eto
DNV (2020a) Energy Transition Outlook 2020. Available at: dnv.
com/eto
DNV (2020b) The Promise of Seasonal Storage. By Rob van Gerwen,
Marcel Eijgelaar, Theo Bosma. Available at: https://www.dnv.com/
publications/the-promise-of-seasonal-storage-168761
DNV (2020c) Technology Outlook 2030. Available at: https://www.
dnv.com/to2030
DNV (2019) Utility-scale solar PV: From big to biggest. By Dana
Olson  Bent Erik Bakken. Available at: https://www.dnv.com/
feature/utility-scale-solar.html
DNV (2018a) Are solid-state batteries the holy grail for 2030?
Technology Outlook 2030. Available at: https://www.dnv.com/
to2030/technology/are-solid-state-batteries-the-holy-grail-
for-2030.html
DNV (2018b) Is peak energy coming soon? Available at: https://
www.dnv.com/feature/counting-energy.html
Dubai Future Foundation (2022) The Future of Hydrogen in the UAE.
Available at: https://www.dubaifuture.ae/
Ecology China Network (2021) Xie Zhenhua: Carbon peaking is
carbon dioxide, carbon neutral includes all greenhouse gases. 6.
December. Available at: http://www.eco.gov.cn/index.php/news_
info/51201.html
Economic Times (2022) India plans own uniform carbon trading
market. By Sarita C Singh, 26. April. Available at: https://economic-
times.indiatimes.com/industry/renewables/india-plans-own-uni-
form-carbon-trading-market/articleshow/91082527.cms
Eicon (2022) Green Taxonomy Approved in Kazakhstan. https://
eicon.green/tpost/3m8r5h51o1-green-taxonomy-approved-in-ka-
zakhstan
Electrek (2022) Wind and solar produce more electricity than
nuclear for the first time in the US. By Michelle Lewis, 7. July.
Available at: https://electrek.co/2022/07/07/wind-and-solar-pro-
duce-more-electricity-than-nuclear-for-the-first-time-in-the-us/
EMA – Energy Market Authority (2021) EMA to Seek Proposals for
Electricity Imports. https://www.ema.gov.sg/media_release.
aspx?news_sid=20211024ouxMNg5jwnht
ESMAP – Energy Sector Management Assistance Program (2019)
Going Global: Expanding Offshore Wind to Emerging Markets.
Washington, DC: ©World Bank
ETC – Energy Transitions Commission (2021) Bioresources within a
Net-Zero Emissions Economy: Making a Sustainable Approach
Possible
ETC (2020) Mission Possible
EC – European Commission (2022) REPowerEU: A plan to rapidly
reduce dependence on Russian fossil fuels and fast forward the
green transition. Press release 18. May, Brussels. https://ec.europa.
eu/commission/presscorner/detail/en/ip_22_3131
EC, Joint Research Centre (EC-JRC)  Netherlands Environmental
Assessment Agency (PBL) (2021) Emissions Database for Global
Atmospheric Research (EDGAR), release EDGAR v6.0_GHG (1970
– 2018). https://edgar.jrc.ec.europa.eu/dataset_ghg60
EC (2010) Global biomass potential under sustainable constraints,
DG Environment News Alert Service, edited by SCU, The University
of the West of England, Bristol SCU, The University of the West of
England, Bristol.
European Council (2022) Climate change costs lives and money.
©European Union. https://www.consilium.europa.eu/en/info-
graphics/climate-costs/
ESMA — European Securities and Markets Authority (2022) ESMA
publishes results of its call for evidence on ESG ratings. https://www.
esma.europa.eu/
Financial Times (2022a) Methane emissions are only getting worse.
Available at: https://www.ft.com/content/a380307d-4d88-4f3c-
9e73-887f2dcc7276
Financial Times (2022b) US says Iran nuclear deal has made
progress but warns ‘gaps’ remain. Available at: https://www.ft.com/
content/dc86fe2b-0e94-4976-a7d9-5d965159d025
Fischer, A. (2022) Clean hydrogen and energy storage project in
Utah receives $504 million loan guarantee from DOE. 10. June.
Available at: https://pv-magazine-usa.com/2022/06/10/clean-hy-
drogen-and-energy-storage-project-in-utah-receives-504-million-
loan-guarantee-from-doe/
Future Southeast Asia (2022) Urban Rail Transit of Southeast Asia.
Available at: https://futuresoutheastasia.com/urban-rail-tranist/
G7 Germany (2022) G7 Climate, Energy and Environment Ministers’
Communiqué. Berlin. 27. May. https://www.bmwk.de/Redaktion/
DE/Downloads/G/g7-konferenz-klima-energie-umweltminis-
ter-05-2022-abschlusskommunique.pdf?__blob=publication-
Filev=14
GermanWatch (2021) Global Climate Risk Index. Available at:
https://www.germanwatch.org/en/cri
GCCA – Global Cement and Concrete Association (2022) Getting
the Numbers Right. Available at: https://gccassociation.org/
sustainability-innovation/gnr-gcca-in-numbers/
GCCSI – Global CCS Institute (2021) Global Status of CCS 2021: CCS
Accelerating to Net Zero. Available at: https://www.globalccsinsti-
tute.com/resources/global-status-report/
GCP – Global Carbon Project (2022) Carbon budget and trends
2021. Published on 26. April 2022. Available at: https://www.
globalcarbonproject.org/carbonbudget
Global Forrest Watch (2021) Forest Pulse: The Latest on the World’s
Forests. Available at: https://research.wri.org/gfr/forest-pulse
Global Methane Pledge (2021) Available at: https://www.
globalmethanepledge.org/
GOGLA (2022) Investment Data. Available at: https://www.gogla.
org/access-to-finance/investment-data. Accessed 1. August
Government of Canada (2022) 2030 Emissions Reduction Plan —
Canada’s next steps for clear air and a strong economy. https://www.
canada.ca/content/dam/eccc/documents/pdf/climate-change/
erp/Canada-2030-Emissions-Reduction-Plan-eng.pdf
Government of the Republic of Korea (2020) 2050 Carbon neutral
strategy of the Republic of Korea towards a sustainable and green
society. December. https://unfccc.int/documents/267683
GreenBiz (2022) State of Green Business 2022. Available at: https://
www.greenbiz.com/report/state-green-business-2022
Gulf International Forum (2022) The Iran Nuclear Deal and World
Energy Markets. Available at: https://gulfif.org/the-iran-nuclear-
deal-and-world-energy-markets/
References
350
DNV Energy Transition Outlook 2022
351
Heggelund, G. et al. (2021) Linking Asian carbon markets: opportu-
nities and barriers. Fridtjof Nansens Institutt, FNI Report 2
Hernes S. et al. (2021) Ringvirkninger av Olje- og Gass-næringens
aktivitet i 2019. Menon Economics Publikasjon NR. 22/2021.
Menon, Oslo
Holovo, Iryna (2021) Ukraine and the European Green Deal Guiding
Principles for Effective Cooperation. December 2021. Heinrich Böll
Foundation. https://boell.org/sites/default/files/2022-01/E-Paper_
Ukraine_and_the_European_Green_Deal_Endf_0.pdf
Houache, M.S.E. et al. (2022) “On the Current and Future Outlook of
Battery Chemistries for Electric Vehicles—Mini Review”. Batteries, 8,
70. https://doi.org/10.3390/batteries8070070
Hydrogen Rise (2022) Hydrogen Rise and Jindal Shadeed Iron 
Steel to evaluate landmark trial of green hydrogen in the production
of environment-friendly steel in Sohar. Available at: https://
hydrogenrise.com/hydrogen-rise-and-jindal-shadeed-sohar/
ICAP – International Carbon Action Partnership (2022) Emissions
Trading Worldwide — Status report 2022. Berlin: International
Carbon Action Partnership
ICCT – International Council on Clean Transportation (2022) New
legislation in Chile shows climate leadership. By Oscar Delgado and
Samantha Pettigrew, 25. April. Available at: https://theicct.org/
chile-latam-lvs-leg-en-apr22/
IEA – International Energy Agency (2022a) Oil Market Report
— August 2022. IEA, Paris https://www.iea.org/reports/oil-mar-
ket-report-august-2022
IEA (2022b) Renewable energy market update – May 2022. https://
www.iea.org/reports/renewable-energy-market-update-may-2022
INSERT IEA (2022c) Solar PV Global Supply Chains. https://www.iea.
org/reports/solar-pv-global-supply-chains
IEA (2021a) Direct Air Capture: Tracking Report. https://www.iea.
org/reports/direct-air-capture
IEA (2021b) Is carbon capture too expensive? By Baylin-Stern, A. and
Berghout, N. https://www.iea.org/commentaries/is-carbon-cap-
ture-too-expensive
IEA (2021c) Methane Tracker 2021. https://www.iea.org/reports/
methane-tracker-2021
IEA (2021d) Net Zero by 2050: A Roadmap for the Global Energy
Sector. https://www.iea.org/reports/net-zero-by-2050
IEA (2020) Energy Technology Perspectives. https://www.iea.org/
reports/energy-technology-perspectives-2020
IEA (2017) Energy Technology Perspectives 2017 — Catalysing
Energy Technology Transformations.
IEA-Tsinghua University (2021) The role of China’s ETS in power
sector decarbonisation. https://prod.iea.org/events/iea-tsing-
hua-joint-report-launch-the-role-of-china-s-ets-in-power-sector-
decarbonisation
IEA (2018) The Future of petrochemicals
IMF – International Monetary Fund (2022) World Economic Outlook
International Monetary Fund Update. IMF; Washington DC, July
IMF (2019) Sub-Saharan Africa Regional Economic Outlook:
Recovery Amid Elevated Uncertainty. https://www.imf.org/en/
Publications/REO/SSA/Issues/2019/04/01/sreo0419
IPCC – Intergovernmental Panel on Climate Change (2022) Climate
change 2022 — Mitigation of climate change. The sixth Intergovern-
mental Panel on Climate Change Assessment Report, Working
Group III. https://www.ipcc.ch/report/ar6/wg3/
IPCC (2021) Climate Change 2021: The Physical Science Basis.
The sixth Intergovernmental Panel on Climate Change Assessment
Report. https://www.ipcc.ch/report/ar6/wg1/
IPBES (2019) Summary for policymakers of the global assessment
report on biodiversity and ecosystem services. https://ipbes.net/
global-assessment
IRENA – International Renewable Energy Agency (2022) Renewable
Energy Market Analysis: Africa and its Regions. ©IRENA 2022. Abu
Dhabi.
IRENA  AfDB (2022) Renewable Energy Market Analysis: Africa and
Its Regions, International Renewable Energy Agency and African
Development Bank, Abu Dhabi and Abidjan.
IRENA (2019a) Scaling up renewable energy deployment in Africa.
©IRENA 2019. Abu Dhabi.
IRENA (2019b) Innovation landscape brief: Flexibility in conventional
power plants. IRENA 2019. Abu Dhabi.
IQAir (2022) 2021 World Air Quality Report – Region  City PM2.5
Ranking. https://www.iqair.com/world-most-polluted-countries
Lebel Eric D. et al. (2022) “Methane and NOx emissions from
Natural Gas Stoves, Cooktops and Ovens in Residential Homes”.
Environmental Science and Technology. 56, 4, 2529–2539. https://
doi.org/10.1021/acs.est.1c04707
LME (2022) LME Cobalt price graph. Available at: https://www.lme.
com/Metals/Minor-metals/Cobalt#tabIndex=2
Los Angeles Times (2022) Newsletter: Here’s how California plans to
spend $37 billion fighting climate change. By Sammy Roth, 13.
January. Available at: https://www.latimes.com/environment/
newsletter/2022-01-13/heres-how-california-plans-to-spend-22-
billion-fighting-climate-change-boiling-point
Lutz, W. (2014) “A Population Policy Rationale for the Twenty-First
Century”. PopulationandDevelopmentReview.Vol40(3).September
Lubega W. and Stillwell A. (2019) “Analyzing the economic value of
thermal power plant cooling water consumption”. Water Resources
and Economics, Vol. 27, July
Masdar (2022) Masdar signs landmark agreements to develop 4
GW-capacity green hydrogen plants in Egypt by 2030. https://news.
masdar.ae/en/News/2022/04/24/19/05/Masdar-signs-landmark-
agreements-to-develop-4-GW
McKinsey (2021) How COVID-19 is reshaping supply chains. New
York, November. https://www.mckinsey.com/capabilities/
operations/our-insights/how-covid-19-is-reshaping-supply-chains
McKinsey (2020) Laying the foundation for zero-carbon cement
METI (2021) Overview of Japan’s Green Growth Strategy Through
Achieving Carbon Neutrality in 2050. https://www.meti.go.jp/
english/policy/energy_environment/global_warming/ggs2050/
index.html
Ministerio de Energia (2021) The National Green Hydrogen Strategy
of Chile — Hydrogen Technologies and Production of Synthetic Fuels.
https://fch.cl/wp-content/uploads/2021/03/20210309-Chilean-Na-
tional-Green-H2-Strategy.pdf
MongaBay (2022) Planned coal plants fizzle as Japan ends financing
in Indonesia, Bangladesh. By Hans Nicholas Jong, 28. June.
Available at: https://news.mongabay.com/2022/06/planned-coal-
plants-fizzle-as-japan-ends-financing-in-indonesia-bangladesh/
Nahm, J. et al. (2022) G20’s US$14-trillion economic stimulus
reneges on emissions pledges. Nature, 2. March. https://www.
nature.com/articles/d41586-022-00540-6
Nakano, Jane (2022) The Geopolitics of Hydrogen in the Indo-Pacific
Region. A report from the CSIS Energy Security and Climate
Change Program. ©Center for Strategic  International Studies
Nasdaq (2022) Renewable Energy News Update – February 2022. By
Dan Brdar, 17. February. Available at: https://www.nasdaq.com/
articles/renewable-energy-news-update-february-2022
National Centers for Environmental Information – NOAA (2022)
Billion-Dollar Weather and Climate Disasters. https://www.ncei.
noaa.gov/access/billions/
NOAA GML (2022) Trends in Atmospheric Carbon Dioxide. https://
gml.noaa.gov/ccgg/trends/global.html
NDRC–NationalDevelopmentandReformCommission(2021)
WorkingGuidanceforCarbonDioxidePeakingandCarbonNeutrality
inFullandFaithfulImplementationoftheNewDevelopmentPhiloso-
phy.https://en.ndrc.gov.cn/policies/202110/t20211024_1300725.html
NREL – National Renewable Energy Laboratory (2020) Exploring
renewable energy opportunities in select Southeast Asian countries
— A Geospatial Analysis of the Levelized Cost of Energy of Utility-Scale
Wind and Solar Photovoltaics. https://www.nrel.gov/docs/
fy19osti/71814.pdf
Net Zero Tracker (2022) Net Zero Stocktake 2022. June. https://
zerotracker.net/analysis/net-zero-stocktake-2022
NewsFirst (2022) Long-term investments in Sri Lanka are India’s plan
to fix economic crisis. By Zulfick Farzan, 26. July. Available at:
https://www.newsfirst.lk/2022/07/26/long-term-investments-in-
sri-lanka-are-indias-plan-to-fix-economic-crisis/
NYT – New York Times (2022) An extraordinary heat wave exposes
the limits of protecting people. In: Climate Forward Newsletter,
April. Available at: https://www.nytimes.com/2022/05/03/climate/
india-heat-wave.html
NYT (2021) Why the Markets Need a Strong Government Hand. By
Robert H. Frank, 2. April. Available at: https://www.nytimes.
com/2021/04/02/business/markets-strong-government.html
NYT (2018) In India, Summer Heat May Soon Be Literally Unbearable.
By Somini Sengupta, 17. July. Available at: https://www.nytimes.
com/2018/07/17/climate/india-heat-wave-summer.html
Porthos (2021) Dutch government supports Porthos customers with
SDE++ subsidy reservation. https://www.porthosco2.nl/en/
dutch-government-supports-porthos-customers-with-sde-subsi-
dy-reservation/
Recharge (2022) 'Mega projects': Azerbaijan and Masdar eye
Caspian offshore wind and hydrogen in 10GW pact. By Andrew Lee,
6. June. Available at: https://www.rechargenews.com/energy-tran-
sition/mega-projects-azerbaijan-and-masdar-eye-caspian-off-
shore-wind-and-hydrogen-in-10gw-pact/2-1-1232334
Reuters (2022) Emerging nations warn high energy costs could
threaten emissions targets. Available at: https://www.reuters.com/
business/environment/emerging-nations-warn-high-energy-costs-
could-threaten-emissions-targets-2022-07-14/
Reuters (2021) Saudi Arabia wants to be top supplier of hydrogen
– energy minister. Available at: https://www.reuters.com/business/
energy/saudi-arabia-wants-be-top-supplier-hydrogen-ener-
gy-minister-2021-10-24/
References
352
DNV Energy Transition Outlook 2022
353
Rockström, J. and Gaffney, O. (2021) Breaking boundaries — The
science of our planet. Penguin Random House
Rosenow, J. and Eyre, N. (2016) “A post mortem of the Green Deal:
Austerity, energy efficiency, and failure in British energy policy”.
Energy Research  Social Science, Vol. 21, November. https://doi.
org/10.1016/j.erss.2016.07.005
Smart Energy Europe and DNV (2022) Demand-side flexibility in the
EU: Quantification of benefits in 2030. September. ©2022 smartEn
Smart Energy Europe.
SP Global (2021a) Siemens Energy, Masdar to build pilot UAE
hydrogen plant by 2022, with focus on SAF. By Dania Saadi, 6. May.
Available at: https://www.spglobal.com/commodityinsights/en/
market-insights/latest-news/electric-power/050621-siemens-ener-
gy-masdar-to-build-pilot-uae-hydrogen-plant-by-2022-with-focus-
on-saf
SP Global (2021b) World's largest renewable hydrogen developer
adds 25-GW Oman export project. By James Burgess, 18. May.
Available at: https://www.spglobal.com/commodityinsights/en/
market-insights/latest-news/petrochemicals/051821-worlds-larg-
est-renewable-hydrogen-developer-adds-25-gw-oman-ex-
port-project
SP Global (2021c) COP26: UAE targets 25% of global low-carbon
hydrogen market by 2030. By James Burgess, 4. November.
Available at: https://www.spglobal.com/commodityinsights/en/
market-insights/latest-news/electric-power/110421-cop26-uae-
targets-25-of-global-low-carbon-hydrogen-market-by-2030
SP Global (2021d) Path to net-zero: Stakeholders demand action
on ambitions as pledges swell. By Taylor Kuykendall, 13. December.
Available at: https://www.spglobal.com/marketintelligence/en/
news-insights/latest-news-headlines/path-to-net-zero-stakehold-
ers-demand-action-on-ambitions-as-pledges-swell-67951124
SolarReviews (2022) President Biden takes executive action to boost
solar — what will it mean for homeowners. 6. July. Available at:
https://www.solarreviews.com/blog/president-biden-execu-
tive-orders-on-solar
State Council (2021) Carbon Peak Action Plan for 2030. 24. October.
http://www.gov.cn/zhengce/content/2021-10/26/
content_5644984.htm
State of California (2022) 2022-2023 Governor’s Budget — Climate
Change. https://www.ebudget.ca.gov/2022-23/pdf/BudgetSum-
mary/ClimateChange.pdf
Swiss Re Group (2021) The economics of climate change: impacts
for Asia. By Cherie Grey  Thomas Heller. 21. May. Available at:
https://www.swissre.com/risk-knowledge/mitigating-climate-risk/
economics-of-climate-change-impacts-for-asia.html
SYSTEMIQ (2022) ReShaping Plastics: Pathways to a Circular,
Climate Neutral Plastics System in Europe
TAQA (2021a) TAQA Group and Abu Dhabi Ports Planning 2 GW
Green Hydrogen to Ammonia Project. Available at: https://www.
taqa.com/wp-content/uploads/2022/01/20210707_TAQA-AD-
Ports-Green-Hydrogen-PRL-En.pdf
TAQA (2021b) TAQA Group, Emirates Steel to Enable the Region’s
First Green Steel Manufacturing. Available at: https://www.taqa.
com/press-releases/greensteel/
Thaler, Richard H. (2015) Misbehaving: the making of behavioral
economics. New York, NY: Norton and Company
UN – United Nations (2022a) Expert Group on the net-zero emissions
commitments of non-state entities. Statement 31. March. https://
www.un.org/sg/en/content/sg/personnel-appoint-
ments/2022-03-31/expert-group-the-net-zero-emissions-commit-
ments-of-non-state-entities%C2%A0
UN (2022b) Full transcript of Secretary-General's press encounter
after Global Crisis Response Group Roundtable and Leaders’
Roundtable on Climate Change. 21. September. https://www.un.
org/sg/en
UN (2021) World Population Prospects. Department of Economic
and Social Affairs, Population Division. https://population.un.org/
wpp/
UNCTAD – United Nations Conference on Trade and Development
(2021) State of Commodity Dependence 2021. https://unctad.org/
system/files/official-document/ditccom2021d2_en.pdf
UNEP – United Nations Environment Programme (2021) Emissions
Gap Report. https://www.unep.org/resources/emissions-gap-re-
port-2021
UNEP and Climate and Clean Air Coalition (2021) Global Methane
Assessment: Benefits and Costs of Mitigating Methane Emissions,
Nairobi: United Nations Environment Programme
UNEP and IEA (2020) GlobalABC Regional Roadmap for Buildings
and Construction in Asia 2020-2050. https://globalabc.org/sites/
default/files/inline-files/Asia_Buildings%20Roadmap_FINAL.pdf
UNFCCC – United Nations Framework Convention on Climate
Change (2021a) Glasgow Climate Pact. https://unfccc.int/sites/
default/files/resource/cma2021_10_add1_adv.pdf
UNFCCC (2021b) Compilation of good practices and lessons
learned on international collaborative research, development and
demonstration initiatives of climate technology. https://unfccc.int/
ttclear/tec/rdandr
University of Cambridge (2022) Cambridge Bitcoin Electricity
Consumption Index. https://ccaf.io/cbeci/index
USGS – U.S. Geological Survey (2020) Mineral commodity summaries
2020., https://pubs.usgs.gov/periodicals/ mcs2020/mcs2020.pdf
Ürge-Vorsatz et al. (2015) “Heating and cooling energy trends and
drivers in buildings”. Renewable and Sustainable Energy Reviews.
Vol 41. January. https://doi.org/10.1016/j.rser.2014.08.039
Vakulchuk, R. and Overland, I. (2021) Central Asia is a missing link in
analyses of critical materials for the global clean energy transition.
https://www.cell.com/action/showPd-
f?pii=S2590-3322%2821%2900660-6
van Vuuren, D. et al. (2011) “The representative concentration
pathways: an overview”. Climatic Change, Vol. 109. August. https://
link.springer.com/article/10.1007/s10584-011-0148-z
Way, R. et al. (2022): Empirically grounded technology forecasts
and the energy transition. Joule, Vol. 6, Issue 9. https://doi.
org/10.1016/j.joule.2022.08.009
Weatherby, C., (2020) Renewable Energy in Southeast Asia, Written
in Powering Southeast Asia — Meeting the Region’s Electricity
Needs’. Available at: https://www.nbr.org/publication/power-
ing-southeast-asia-introduction/
World Bank (2022a) Global Economic Prospects. June. ©World
Bank, Washington DC.
World Bank (2022b) State and Trends of Carbon Pricing 2022. May.
©World Bank, Washington, DC.
World Bank (2019) Classifying countries by income. By Espen Prydz
 Divyanshi Wadhwa. 9. September. Available at: https://datatop-
ics.worldbank.org/world-development-indicators/stories/
the-classification-of-countries-by-income.html
WBCSD – World Business Council for Sustainable Development
(2022) H2Zero — Hydrogen Pledges. https://www.wbcsd.org/
Programs/Climate-and-Energy/Hydrogen-Pledges
World Energy Council (2022) World Energy Pulse 2022. https://
www.worldenergy.org/world-energy-pulse-2022
WEF – World Economic Forum (2021) Financing the transition to a
net-zero future. Insight report in collaboration with Oliver Wyman,
October. https://www3.weforum.org/docs/WEF_Financing_the_
Transition_to_a_Net_Zero_Future_2021.pdf
WEF (2020) Clean skies for tomorrow, Sustainable aviation fuels as a
pathway to net zero aviation. November ©2020 World Economic
Forum
WRI – World Resources Institute (2022a) Trends show companies are
ready for scope 3 reporting with US Climate Disclosure Rule. https://
www.wri.org/update/trends-show-companies-are-ready-scope-3-
reporting-us-climate-disclosure-rule
WRI (2022b) World Greenhouse Gas Emissions in 2019. https://www.
wri.org/data/world-greenhouse-gas-emissions-2019
World Steel (2019) Total production of crude steel. Available at:
https://www.worldsteel.org/
World Trade Organization (2022) The crisis in Ukraine — Implications
of the war for global trade and development. https://www.wto.org/
english/res_e/booksp_e/imparctukraine422_e.pdf
Zawya (2021) PROJECTS: Oman Hydrogen Strategy envisages
$34bln investment in green hydrogen. By Sowmya Sundar, 1.
December. Available at: https://www.zawya.com/en/projects/
projects-oman-hydrogen-strategy-envisages-34bln-invest-
ment-in-green-hydrogen-fb2glvou
References
Historical data
This work is partly based on the World Energy Balances
database developed by the International Energy
Agency© OECD/IEA 2022, but the resulting work has
been prepared by DNV and does not necessarily reflect
the views of the International Energy Agency.
For energy-related charts, historical (up to and includ-
ing 2021) numerical data is mainly based on IEA data
from World Energy Balances© OECD/ IEA 2022, www.
iea.org/ statistics, License: www.iea. org/tc; as
modified by DNV.
354
DNV Energy Transition Outlook 2022 ANNEX
355
The project team
CORE CONTRIBUTORS FROM DNV:
Steering committee: Remi Eriksen, Ditlev Engel, Ulrike
Haugen, Trond Hodne, Liv Hovem, Jin James Huang
Project director: Sverre Alvik (sverre.alvik@dnv.com)
Modelling responsible: Onur Özgün
Core modelling- and research team and contributing
authors: Bent Erik Bakken, Kaveh Dianati, Thomas
Horschig, Anne Louise Koefoed, Erica McConnell, Mats
Rinaldo, Sujeetha Selvakkumaran, Adrien Zambon
Communication responsible and editor: Mark Irvine
(mark.irvine@dnv.com)
Reference group: Peter Bjerager, Theo Bosma, Lucy
Craig, Al-Karim Govindji, Jan Kvålsvold, Pierre C. Sames,
Rune Torhaug
Energy Systems: Jørg Aarnes, Kjersti Aarrestad, Mario A.
Acevedo, Carlos Albero, Aasta Andreassen, Mohammed
Atif, Alireza Bayat, Sarah Barber, Graham Bennett, Frida
Berglund, Mario Andrés Bilbao, Jørgen Bjørndalen,
Santiago Blanco, Mattia Boccolini, Peter Brun, Marco
Ceriotto, Ben Chivers, Nicholas Cole, Jochum Douma,
Magnus Ebbesen, Ken Elser, Yerún Fernández, Maja
Frost, Rob van Gerwen, Marta Ramos Gomez, Jason
Goodhand, Simen Loe Heggen, Christian Hewicker,
Daniel Antonio Herrmann, Tchiarles Coutinho Hilbig,
Eckhard Hinrichsen, Alexandre Imperial, Michael
Johnson, Magnus Killingland, Sarah Karen Kimpton,
Alok Kumar, James Thornton Laybourn, Thomas Leonard,
Ingrid Bye Løken, Nicholas Marquet, Jennifer McWilliams,
Melissa Morrison, Rohit Nair, Benoit Nguyen, Albert van
den Noort, Dana Olson, Camiel Oremus, Jeremy Parkes,
Kevin Dave Peiris, Mitchell Rosenberg, Matthew Rowe,
Varadaraj Salian, Graham Slack, Bart Stoffer, Christopher
Taylor, Corin Taylor, Anil Thomas, Nellie Tong, Yukinobu
Uchida, Ton van Wingerden, Yongtao Yang, Naim
Youssef, Wen Qian Zhou, Jan Zschommler, Roel Jouke
Zwart
Maritime: Eirik Ovrum (Maritime project manager),
Kjersti Aalbu, Christos Chryssakis, Helge Drösemeyer,
Magnus S. Eide, Øyvind Endresen, Henrik Helgesen,
Kristian Hammer, Linda Hammer, Håkon Hustad, Marius
Lesiner, Tore Longva, Eirik Nyhus, Sharin Osman, Nikolai
Hydle Rivedal, Øyvind Sekkesæter, Terje Sverud, Jakub
Walenkiewicz, Martin Wold
Group Technology and Research: Hendrik Brinks, Ida
Synnøve Bukkholm, Marcel Eijgelaar, Erik Andreas
Hektor, Frank Børre Pedersen, Tianyu Wang
Group Government and Public Affairs: Lars Almklov, Per
Busk Christiansen, Jerome Colombe, Rob Coveney,
Magnus Dahlen, Joyce Dalgarno, Thomas Fries, Caroline
Kamerbeek, Peter Lovegrove, Christian Parker, Steven
Sawhill, Jeanette Schäfer, Laure Simonnot, Neil Slater,
Therese Sanni, Dag Thorstensen, Anne Vandbakk, Ros
Williamson, Charlotte Zwick
Our external collaboration network for
our 2022 Outlook includes:
Henok Asmelash (University of Birmingham), Per Brevik
(Heidelberg Cement), Maria Paula de Barros Cantusio
(Santander), Alejandro Falkner (Enel), Kirsty Gogan and
Eric Ingersoll (TerraPraxis), Wolfgang Lutz (Wittgenstein
Centre for Demography and Global Human Capital),
Alessio Pastore (Enel), Glen Peters (CICERO), Knut Einar
Rosendal (NMBU), KC Samir (Wittgenstein Centre for
Demography and Global Human Capital), Philip de
Smedt (Cefic), Nick Stansbury (LGIM), Yongping Zai
(Tencent).
This report has been prepared by DNV as a cross-disciplinary exercise between the DNV Group and our business areas
of Energy Systems and Maritime across 20 countries. The core model development and research have been conducted
by a dedicated team in our Energy Transition Outlook research unit, part of the Group Research  Development division,
based in Oslo, Norway. In addition, we have been assisted by external energy transition experts, with the core names
listed below:
THE PROJECT TEAM
OTHER ENERGY TRANSITION OUTLOOK 2022 REPORTS
Maritime forecast to 2050
The 2022 Maritime Forecast to 2050 presents an updated
outlook on regulations, drivers, technologies and fuel
availability. From that, a new and extended fuel-mix
scenario library has been created, with each scenario
describing a possible future fleet composition, its energy
use and fuel mix, and emissions to 2050. The library can
be applied to DNV’s updated Carbon-Risk-Framework
and supports shipowners in their decision making.
Hydrogen forecast to 2050
DNV’s new report on hydrogen supply and demand and
its role in decarbonization. The report details, inter alia,
policy driving the rise of hydrogen ecosystems, develop-
ments in approaches to safety, technical aspects of
production, storage and transport of hydrogen, expected
developments in the regional and international trade of
hydrogen and its derivatives, and a comparison of various
hydrogen value chains.
Published by DNV AS.
Design: SDG/McCann Oslo/Infogr8. Images: Cover: Gettyimages, p. 11, 18, 21, 36, 51, 53, 57, 58, 82, 92, 98, 103, 104, 124, 174, 197, 215, 222,
224, 227, 230, 235, 239, 242, 257, 259, 273, 274, 281, 283, 289, 292, 301, 303, 320, 323, 324, 331: Getty Images, p. 31, 43, 96,154, 155, 160, 162, 239,
236, 246, 254, 260, 271, 284 : Shutterstock, p. 14: Unsplash, Joey Kyber, p. 24: Volvo Trucks, p 45: Unsplash, Ashwini Chaudhary, p. 47 Unsplash,
Daniel Smyth, p. 55: Quantafuel, p. 70: Unsplash/Czar Nyiko, p. 79: HydrogenPro, p. 89: Unsplash/Andreas Gucklhorn, p. 138: Unsplash/Harold
Mendoza, p. 166: Climeworks, p. 171: UN/Mark Garten, p. 179: Unsplash/Olha fedchenko, p. 219: Unsplash/Jan Antonin, p. 245: Unsplash/
William Felipe, p. 256: Unsplash/Marek Piwnicki, p. 311: Unsplash/Arnab Dey, p. 313: Unsplash/Ashwini Chaudhary, p. 314: Unsplash/Jia Le SwuI.
Headquarters:
DNV AS
NO-1322 Høvik, Norway
Tel: +47 67 57 99 00
www.dnv.com
The trademarks DNV® and Det Norske Veritas® are the properties of companies
in the Det Norske Veritas group. All rights reserved.
DNV is a global quality assurance and risk management company. Driven by our
purpose of safeguarding life, property and the environment, we enable organizations
to advance the safety and sustainability of their business. We provide classification,
technical assurance, software and independent expert advisory services to the maritime,
oil  gas, power and renewables industries. We also provide certification, supply chain
and data management services to customers across a wide range of industries.
Combining technical, digital and operational expertise, risk methodology and in-depth
industry knowledge, we empower our customers’ decisions and actions with trust and
confidence. We continuously invest in research and collaborative innovation to provide
customers and society with operational and technological foresight. With origins
stretching back to 1864 and operations in more than 100 countries, our experts
are dedicated to helping customers make the world safer, smarter and greener.
dnv.com/eto
About DNV
The trademarks DNV® and Det Norske Veritas® are the properties of companies
in the Det Norske Veritas group. All rights reserved.
Headquarters:
DNV AS
NO-1322 Høvik, Norway
Tel: +47 67 57 99 00
www.dnv.com
DNV is an independent assurance and risk management provider, operating in
more than 100 countries, with the purpose of safeguarding life, property, and the
environment. Whether assessing a new ship design, qualifying technology for a
floating wind farm, analysing sensor data from a gas pipeline or certifying a food
company's supply chain, DNV enables its customers and their stakeholders to
manage technological and regulatory complexity with confidence. As a trusted
voice for many of the world’s most successful organizations, we use our broad
experience and deep expertise to advance safety and sustainable performance,
set industry standards, and inspire and invent solutions.
dnv.com/eto

DNV Energy Transition Outlook 2022

  • 1.
  • 2.
    2 SHORT TERM High energyprices and a greater focus on energy security due to the war in Ukraine will not slow the long-term transition − Europe aims to accelerate its renewables build-out to achieve energy security − In the rest of the world, tackling high energy and food prices may shift decarbonization down the list of priorities in the short term − The long-term influence of the war on the pace of the energy transition is low compared with main long-term drivers of change: plunging renewables costs, electrification, and rising carbon prices COP26 and the IPCC have called for urgent action which has not materialized: emissions remain at record levels − Emissions must fall by 8% each year to secure net zero by 2050 − Opportunities for intensified action abound – the transition is opening up unprecedented opportunities for new and existing players in the energy space LONG-TERM FORECAST Electricity remains the mainstay of the transition; it is growing and greening everywhere − With an 83% share of the electricity system in 2050, renewables are squeezing the fossil share of the overall energy mix to just below the 50% mark in 2050 − Despite short-term raw material cost challenges, the capacity growth of solar and wind is unstoppable: by 2050 they will have grown 20-fold and 10-fold, respectively Hydrogen only supplies 5% of global energy demand in 2050, a third of the level needed for net zero − Pure hydrogen use scales in manufacturing from the early 2030s and in derivative form (ammonia, e-methanol and other e-fuels) in heavy transport from the late 2030s − Green hydrogen from dedicated renewables and from the grid will become dominant over time; blue hydrogen and blue ammonia retain important roles in the long term PATHWAY TO NET ZERO We are heading towards a 2.2°C warming; war-footing policy implementation is needed to secure net zero by 2050 − Massive, early action to curb record emissions is critical; the window to act is closing − No new oil and gas will be needed after 2024 in high income countries, and after 2028 in middle- and low-income countries. Net zero means leading regions and sectors have to go much further and faster − OECD regions must be net zero by 2043 and net negative thereafter; China needs to reduce emissions to net zero by 2050 − Renewable electricity, hydrogen and bioenergy are essential, but insufficient: almost a quarter of net decarbonization relies on carbon capture and removal combined with land-use changes (reduced deforestation). HIGHLIGHTS Highlights FOREWORD The present turbulence in energy markets is not inconse- quential, however. Europe will transition to a renewables- dominated power system more rapidly, but higher energy prices may dampen investment in clean energy elsewhere. These two effects tend to offset each other globally over time. Supply-chain disruptions will continue in the shorter term, delaying the global EV ‘milestone’ (when the EV share of new vehicle sales surpasses 50%) by one year in our forecast — to 2033. But here too there are compensatory developments, where high prices will encourage energy-saving behaviour among power consumers. For aviation, we also forecast a permanent reduction of 7% in annual passenger trips due to pandemic-related changes in work habits. This year, our forecast sees non-fossil energy nudge slightly above 50% of the global energy mix by 2050. The principal underlying dynamic is rapid electrification, with supply climbing from 27 PWh/yr now to 62 PWh/yr in 2050. We detail how this leads to enormous energy- efficiency gains in power generation and end-use. We are entering a prolonged period where efficiency gains in our energy system outstrip the rate of economic growth. Over the long term this means the world will spend significantly less on energy as a proportion of GDP. In theory, that should provide policymakers with confi- dence to accelerate the transition. Bold and brave policy choices are critical in the face of climate change. This year, for the first time, we include our ‘Pathway to Net Zero’ alongside our ‘best estimate’ forecast for the energy transition. Put another way, we compare a forecast that we think will unfold with a pathway that we hope the world will embrace. Even under a net zero pathway we think it infeasible for the world to completely discontinue fossil-fuel use, which is why you will find a 13% fossil share in the energy mix in our Pathway to Net Zero in 2050. That overshoot in fossil use will require huge expenditure on carbon capture and removal efforts in the 2040s – running to USD 1 trillion per year. Deglobalization is much talked about. However, the energy transition is likely to see unprecedented regional and cross-industry cooperation — for example within hydrogen ecosystems or the creation of green shipping corridors. DNV will, as an independent provider of technical expertise, strive to catalyse such cooperation wherever we can. I hope you find this Outlook a useful strategy and planning tool, and, as ever, I look forward to your feedback. Looking beyond today’s high energy prices to see what the longer-term energy future holds is difficult. That is what this Outlook does. Our forecast considers the demand shock of the pandemic and the supply shock that camewithRussia’sinvasionofUkraineandconcludesthatthosedevelopments exertlittlelong-terminfluenceoveratransitionthatwillberapidandextensive. Remi Eriksen Group President and CEO DNV 3
  • 3.
    High energy pricesand a heightened focus on energy security due to the war in Ukraine will not slow the long-term transition Europe is likely to accelerate its energy transition during and after the war in Ukraine. There will be a rapid phase- out of imported Russian fossil fuel sources and rising to the top of the agenda will be energy security, which hinges on a renewables-dominated energy system and measures to accelerate energy efficiency. Energy security and sustainability thus pull in the same direction. Afforda- bility is a major short-term concern with record high prices for natural gas and electricity. The policy response focuses on diversification of supply initially, giving some fossil sources a short-term boost, but the main policy thrust is to achieve energy independence for Europe earlier, based primarily on renewable energy. Outside Europe, and particularly in low- and middle- income countries, high energy and food prices plus the looming risk of global recession have shifted attention to short-term priorities. Long-term climate change invest- ments and actions like electricity infrastructure build-out are likely to be postponed. High-priced LNG could make for a short-term coal resurgence, and although renewables are local and support domestic energy security, domestic coal could find favour over imported gas. The net effect is that, due to short-term pressure, there is reduced likelihood of extraordinary action being taken to reach a net-zero future; however, the steady pace of the financially-driven energy transition will continue. Short- term commodity cost increases and the war in Ukraine will not put the brakes on the big drivers of the transition like the plunging costs of renewables, electrification, and rising carbon prices. COP26 and the IPCC have called for urgent action which has not materialized: emissions remain at record levels At COP26, UN Secretary António Guterres stressed the urgency of immediate action on global warming, calling it a Code Red for humanity. His warning has been amplified by the successive AR6 reports from the IPCC. COP26 saw agreements on important issues like coal phase-down, methane reduction, and land-use changes, but that sense of urgency has generally not been reflected since then in national policy plans or actions. Global GHG emissions reduction of some 8% every year is needed for a net-zero trajectory. In 2021, emissions were rising steeply, approaching pre-pandemic all-time highs, and 2022 may only show a 1% decline in global emissions. That makes for two ‘lost’ years in the battle against emissions. The lack of action is attributed to a weakening global economy amid inflation challenges. However, our analysis points to enormous opportunities inherent in decarbonization for both companies and nations. Renewables expenditures are expected to double over the next 10 years to more than USD 1,400 billion per year, while grid expenditures also are likely to exceed USD 1,000 billion per year in 2030. We show that building out renewable technologies does not come at a green premium, but rather as a green prize. Owing to the considerable efficiencies linked to electrification and the plunging costs of renewables, the world will be spending far less on energy as a proportion of GDP by 2050. There is scope for accelerated action, and for private sector frontrunners to run well ahead of antici- pated governmental support. Hydrogen will be only 5% of global energy demand in 2050, a third of the level needed for net zero Hydrogen is inefficient and expensive compared with direct electricity use but is essential for decarbonizing hard-to-abate sectors like high-heat processes in manu- facturing, and maritime transport and aviation. However, the global uptake of hydrogen as an energy carrier sees it supplying only 5% of energy demand in 2050, a third of the level needed in a net-zero energy mix. Hydrogen will scale in the manufacturing sector from the early 2030s in the leading regions. In heavy trans- port like aviation and maritime, we will see the hydrogen derivates ammonia, e-methanol and other e-fuels starting to scale in the late 2030s. We see a more limited uptake of hydrogen in heavy, long-distance trucking, and in the heating of buildings in areas with existing gas distribution networks, but almost zero use in passenger vehicles. Green hydrogen from dedicated renewables and from the grid will dominate hydrogen production; blue hydrogen remains important, for example in ammonia production. The number of hydrogen initia- tives in hard-to-abate sectors is growing rapidly, but few have reached final investment decision. Highlights – short term Highlights – long term Electricity remains the mainstay of the transition; it is growing and greening everywhere The strongest engine of the global energy transition is electrification, expanding in all regions and almost all sectors, while the electricity mix itself is greening rapidly. Electricity production will more than double, with the share of electricity rising from 19% to 36% in the global energy mix over the next 30 years. In addition, electricity will take over and dominate hydrogen production. The share of fossil fuels in the electricity mix reduces sharply from the present 59% to only 12% in 2050. Solar PV and wind are already the cheapest forms of new electricity in most places, and by 2050 it will grow 20-fold and 10-fold, respectively. Solar PV takes a 38% share of electricity generated in 2050 and wind 31%. Nuclear will only manage to slightly increase present production levels due to its high costs and long lead times; its share of the electricity mix will therefore decline. The strong growth of renewables in electricity is the main reason why the fossil-fuel share of total energy use in 2050 is pushed to just below the 50% mark. DNV Energy Transition Outlook 2022 Highlights 4 5
  • 4.
    We are headingtowards 2.2°C warming; war-footing policy implementation is needed to secure net zero by 2050 The Paris Agreement aim of limiting global warming to 1.5°C is still possible, but the window to act is closing. Securing 1.5°C without a temporary carbon overshoot is already out of reach. DNV’s ETO forecast of the 'most likely' energy future — one driven by market forces and often dilatory climate policies — results in 2.2°C warming by the end of the century. On their own, technological and market developments are insufficient drivers of the change needed for net zero; war-footing-like policy implementation with massive early action across regions and sectors is needed. Low-income regions need dedicated technology and financial assistance to transition at the required rate. No new oil and gas will be needed after 2024 in high-in- come countries and after 2028 in middle- and low-income countries. However, renewables need to triple and grid investment rise more than 50% over the next 10 years. Closing the gap to 1.5°C Highlights – Pathway to Net Zero Net zero means leading regions and sectors must go below zero before 2050 Different regions and sectors have different starting points and capabilities, and if the world is to reach net zero in 2050, leading regions and sectors have to go much further and faster. OECD regions must be net zero by 2043 and net negative thereafter via carbon capture and removal. China needs to reduce emissions to zero by 2050, while the remaining regions all reduce emissions significantly, but do not reach net zero by mid-century. Some sectors, like power, will reach net zero before 2050, while other sectors, like cement and aviation, will still have remaining emissions. Maritime needs a strengthened IMO strategy to reduce emissions by 95% by 2050. Renewable electricity, hydrogen and bioenergy are essential, but insufficient: almost a quarter of net decarbonization relies on carbon capture and removal, including CCS from power and industry, direct air capture, and nature-based solutions. Between 2050 and 2100, the ETO projection is that net annual emissions reduce slowly from 22 Gt towards 0, while the PNZ has net-negative annual emissions from 2050. In 2100, the emissions gap is 7 Gt CO2 of negative emissions, corresponding to around 0.7 °C temperature difference and 1,050 Gt of cumulative CO2 emissions. How to close the gap? The gap must be closed by a combination of: — Reduced combustion of fossil fuels, replacing coal, oil and gas with renewables and nuclear — Energy efficiency improvements — Carbon capture and removal, including net negative emissions from: — Bioenergy with CCS — Direct air capture — Nature-based solutions (e.g. reforestation) In this year’s ETO, DNV has added a Pathway to Net Zero scenario that outlines what needs to be done by 2050 for the world to close the gap from the most likely 2.2°C trajectory to the agreed 1.5°C future. How big is the gap? Global CO2 emissions were 38 Gt in 2020 and by 2050 the annual emissions gap is 22 Gt CO2 with cumulative emissions resulting in about 0.2°C difference. 174 DNV Energy Transition Outlook 2022 175 Pathway to net zero emissions CHAPTER 8 PATHWAY TO NET ZERO EMISSIONS 8 PATHWAY TO NET ZERO EMISSIONS (PNZ) Highlights This chapter presents DNV’s Pathway to Net Zero emissions, which we consider to be a technically and economically feasible — but unavoidably challenging scenario. Unlike our ETO forecast (the main focus of this report), which results in global warming of 2.2°C by 2100, our Pathway to Net Zero emissions (PNZ) is a ‘back-cast’ estimation of what is needed to achieve a net-zero energy system by 2050 with the aim of securing a 1.5°C warming future. We detail here the size of the gap between our forecast and the PNZ, and detail what needs to change in the supply and demand sectors to achieve net zero. A key principle is that not all sectors will be able to reach net zero emission by 2050. Moreover, not all regions will be able to do so — implying that some demand sectors (e.g. transport) and regions (typically high-income regions) must go below zero before 2050. Chapter 9 provides more detail on the net zero pathways for each of our 10 world regions. 8.1 Pathway to net zero emissions (PNZ) 176 8.2 Net zero policies 180 8.3 Net zero demand and supply 182 8.4 Net zero expenditures 192 8.5 CO2 and methane emissions 194 8.6 Sectoral roadmaps 198 Highlights Highlights DNV Energy Transition Outlook 2022 6 7
  • 5.
    8 DNV Energy TransitionOutlook 2022 9 Highlights 2015 2020 2025 2030 2035 2040 2045 2050 2036 Feedstock use of fossil fuel peaks 2033 Wind overtakes hydro 2040 Seaborne container trade exceeds crude oil trade 2044 Every third commercial vehicle on the road is electric 2034 Maritime energy demand peaks 2033 Half of all passenger vehicles sales electric 2014 Coal peaked 2025 Oil peaks Highlights of our forecast energy transition to 2050. The green slope represents the share of non-fossil energy sources in the energy mix. **Average primary energy used for production of H2 & derivatives. *Energy peaks not to scale relative to primary energy 2036 Natural gas peaks 2036 Primary energy supply peaks 2041 Final energy demand peaks 2.2ºC warming by 2100 2030 Transport energy demand peaks 2047 CCS captures 5% of global energy-related CO2 emissions 2038 Nuclear peaks 2020 COVID-19 drop-off, removing 6% of energy demand 2043 Half of world’s road vehicles electric 2044 Electricity use doubles relative to 2020 2050 Hydrogen 5% of energy demand 2041 Manufacturing energy demand peaks 2022 PV installations 1TW 2018 Energy demand for space heating peaked 2029 1.5ºC carbon budget exceeded COP15 Paris Agreement 2056 2ºC carbon budget exceeded Hydrogen** Maritime non-fossil Maritime fossil Energy transitions sea Energy peaks* Non-fossil share Energy milestones Energy transitions 20% of energy mix non-fossil 51% of energy mix non-fossil ENERGY TRANSITION TIMELINE -6% 2045 Solar PV 35% of power supply 2042 Wind 30% of power supply
  • 6.
    10 DNV Energy TransitionOutlook 2022 11 CONTENTS Foreword 2 Highlights 3 Introduction 12 1 Energy Demand 14 Contents Foreword 2 Highlights 3 Introduction 12 1 Energy Demand 14 1.1 Energy demand 16 1.2 Transport 22 1.3 Buildings 36 1.4 Manufacturing 47 1.5 Non-energy use (feedstock) 54 1.6 Final energy demand from all sectors 56 2 Electricity and hydrogen 58 2.1 Electricity 60 2.2 Grids 68 2.3 Storage and Flexibility 71 2.4 Hydrogen 74 2.5 Direct heat 81 3 Renewable energy 82 3.1 Solar 85 3.2 Wind 91 3.3 Hydropower 95 3.4 Nuclear power 97 3.5 Bioenergy 99 3.6 Other renewables 102 4 Energy supply and fossil fuels 104 4.1 Coal 107 4.2 Oil 109 4.3 Natural gas 113 4.4 Summarizing energy supply 119 5 Energy efficiency and finance 124 5.1 Energy intensity 126 5.2 Sectoral energy efficiency 129 5.3 Energy expenditures 131 6 Policy and the energy transition 138 6 .1 The policy landscape shaping the transition 140 6.2 Drivers and barriers 142 6.3 Key regional policy developments 146 6.4 The policy toolbox 148 6.5 Policy factors in our Outlook 154 7 Emissions and climate implications 160 7.1 Emissions 163 7.2 Climate implications 169 8 Pathway to net zero emissions (PNZ) 174 8.1 Pathway to net zero emissions (PNZ) 176 8.2 Net zero policies 180 8.3 Net zero demand and supply 182 8.4 Net zero expenditures 192 8.5 CO2 and methane emissions 194 8.6 Sectoral roadmaps 198 9 Regional transitions 220 9.1 North America 224 9.2 Latin America 236 9.3 Europe 246 9.4 Sub-Saharan Africa 260 9.5 Middle East and North Africa 274 9.6 North East Eurasia 284 9.7 Greater China 292 9.8 Indian Subcontinent 304 9.9 South East Asia 314 9.10 OECD Pacific 324 9.11 Comparison of the regions 332 Annex 334 References 347 The project team 355
  • 7.
    12 DNV Energy TransitionOutlook 2022 13 INTRODUCTION Introduction Our best estimate, not the future we want A single forecast, not scenarios Long term dynamics, not short-term imbalances Continued development of proven technology, not uncertain breakthroughs Main policy trends included; caution on untested commitments, e.g. NDCs, etc. Behavioural changes: some assumptions made, e.g. linked to a changing environment Our best estimate, not the future we want A single forecast, not scenarios Long term dynamics, not short-term imbalances Continued development of proven technology, not uncertain breakthroughs Main policy trends included; caution on untested commitments, e.g. NDCs, etc. Behavioural changes: some assumptions made, e.g. linked to a changing environment Our best estimate, not the future we want A single forecast, not scenarios Long term dynamics, not short-term imbalances Continued development of proven technology, not uncertain breakthroughs Main policy trends included; caution on untested commitments, e.g. NDCs, etc. Behavioural changes: some assumptions made, e.g. linked to a changing environment Our best estimate, not the future we want A single forecast, not scenarios Long term dynamics, not short-term imbalances Continued development of proven technology, not uncertain breakthroughs Main policy trends included; caution on untested commitments, e.g. NDCs, etc. Behavioural changes: some assumptions made, e.g. linked to a changing environment ETO Model Our analysis covers the period 1980-2050, with changes unfolding on a multi-year scale that in some cases is fine-tuned to reflect hourly dynamics. We continually update the structure of and input data to our model. The most significant changes to the model since our 2021 Outlook are listed on page 343. The figure below presents our model framework. The arrows in the diagram show information flows, starting with population and GDP per person, while physical flows are in the opposite direction. Policy influences all aspects of the energy system. Energy-efficiency improvements in extraction, conversion, and end use are cornerstones of the energy transition. About this Outlook This annual Energy Transition Outlook (ETO), now in its 6th edition, presents the results from our independent model of the world’s energy system. It covers the period through to 2050 and forecasts the energy transition globally and in 10 world regions. Our forecast data may be accessed at eto.dnv.com/data. More details on our methodology and model can be found on page 342. The changes we forecast hold significant risks and opportunities across many indus- tries. Some of these are detailed in our supplements: — Maritime forecast to 2050 — Hydrogen forecast to 2050 All ETO reports are feely available on www.dnv.com. In addition, we draw our readers’ attention to ongoing insights into the energy industry published by DNV, which include our most recent Insight report, Future-proofing our power grids. Our approach DNV presents a single ‘best estimate’ forecast of the energy future, with sensitivities considered in relation to our main conclusions. However, this year, we include our ‘Pathway to Net Zero Emissions’ scenario (Chapter 8), which is effectively a ‘back cast’ of what we consider to be a feasible, albeit challenging, pathway for the world to achieve net zero emissions by 2050 to secure a 1.5°C warming future. We believe readers will find it useful to explore the dimensions of the gap between our ‘best estimate future’ and our net zero pathway scenario. Foundational aspects of our approach are illustrated opposite. These include the fact that we focus on long term dynamics, not short-term imbalances. However, given the scale of the impact on energy supply and demand of both COVID-19 and Russia’s invasion of Ukraine, we describe how we take these developments into consideration in Chapter 1. Independent view DNV was founded 158 years ago to safeguard life, prop- erty, and the environment. We are owned by a foundation and are trusted by a wide range of customers to advance the safety and sustainability of their businesses. 70% of our business is related to the production, genera- tion, transmission, and transport of energy. Developing an independent understanding of, and forecasting, the energy transition is of strategic importance to both us and our customers. This Outlook draws on the expertise of over 100 professionals in DNV. In addition, we are very grateful for the assistance provided by a number of external experts. All contributors are listed on the last page of this report. ETO model framework ENERGY SECTOR’S OWN USE POWER GENERATION HYDROGEN OIL REFINERIES Electricity Direct heat Energy transformation OTHER Road Maritime Aviation Rail Pipelines Residential Commercial Manufactured goods Base materials Iron and steel Construction and mining Feedstock TRANSPORT Final energy demand BUILDINGS MANUFACTURING NON-ENERGY Solar Wind Hydropower Nuclear Bioenergy Geothermal Crude oil Natural gas Coal Primary energy supply FOSSIL FUEL EXTRACTION Source of demand TRANSPORT BUILDINGS POPULATION GDP PER PERSON POLICY DIRECT USE ENERGY EFFICIENCY Space heating & cooling, water heating, cooking, and appliances & lighting Measured in tonne-miles, passenger- kilometres and vehicles MANUFACTURING Production output measured as Manufacturing Value Added
  • 8.
    14 DNV Energy TransitionOutlook 2022 15 Energy demand CHAPTER 1 1 ENERGY DEMAND 1.1 Energy demand 16 1.2 Transport 22 1.3 Buildings 36 1.4 Manufacturing 47 1.5 Non-energy use (feedstock) 54 1.6 Final energy demand from all sectors 56 Highlights In the next 30 years, global energy demand will level off even as the global economy grows. This historic decoupling is due to the dramatic effect of efficiency gains, largely enabled by accelerated electrification, that will outpace economic growth in the coming years. We analyse the lingering effects of the energy demand shock from the COVID-19 pandemic, and the impact of the disruption to energy supply brought on by Russia’s invasion of Ukraine. While both developments have seen large shifts in demand and supply in the short term, their impact over the longer term is marginal compared with the key drivers of the transition: rapid electrification, tightening policy on decarbonization, and the plunging cost of renewables and storage. This chapter details expected shifts in the key demand sectors, with a modest growth in energy demand expected in buildings and manufacturing, and a small decline in transport over the coming decades. This occurs despite tremendous growth in energy service linked to expanding floor space and cooling needs, growth in demand for manufactured goods, a rise in annual passenger trips in aviation, and a near-doubling in the size of the vehicle fleet.
  • 9.
    16 DNV Energy TransitionOutlook 2022 17 Energy demand CHAPTER 1 1.1 ENERGY DEMAND The shock to energy demand caused by the pandemic was a forceful reminder that understanding the nature and dimensions of energy demand is fundamental to any energy forecast. This chapters covers developments in the four sectors responsible for almost all energy demand: transport, buildings, manufacturing, and feedstock. Part of our analysis involves a consideration of effects of the pandemic and Russia’s invasion of Ukraine on energy demand. Historically, energy demand has grown in lockstep with GDP — population growth and improvements in standards of living — moderated by efficiency improvements. Global population growth is slowing down and is expected to reach 9.4 billion people in 2050. Economic growth will continue, and the size of the global economy in 2050 will be USD 300 trillion, with an average growth rate of 2.5% from 2019 to 2050. Further details on population and economicgrowthareincludedintheannexofthisOutlook. More and wealthier people imply ever-more energy services — for transportation, housing, consumer goods and so on. This leads to increased energy demand, unless countered by strong efficiency gains. The effect of energy efficiency In the coming three decades this counterforce will, indeed, be strong, and we forecast that massive efficiency gains, particularly those enabled by electrification, will offset the population and economic growth propelling demand for energy services. Put another way, a burgeoning middle class will drive ever-higher demand for energy services in the form of a growing car fleet, more buildings with more cooling requirements, appliances, and so forth. But, owing to compounding efficiencies, the world will be using progressively less primary energy to satisfy the rising demand for energy services. We forecast, therefore, that final energy demand will, in fact, level off just below 500EJ, a level only 13% higher than today. In the years between 2035 to mid-century, final energy demand varies by less than1%,meaningitisvirtuallyflat, asillustratedinFigure1.1. It is not a given that energy demand will remain flat after 2050. Once most energy services are converted to electricity, which automatically improves energy efficiency in most sectors, energy demand may start to increase again. This could well be countered by an eventual decline in the global population and a world economy dramati- cally hobbled by the effects of global warming. Post 2050, rising energy demand will almost certainly not be accom- panied by rising emissions. ‘Final’ energy in this Outlook and as shown in Figure 1.1, means the energy delivered to end-use sectors, excluding losses and excluding the energy sector’s own use of energy in power stations, oil and gas fields, refineries, pipelines, and similar infrastructure. Sectoral shifts Global energy use is relatively equally distributed across the three sectors of transport, buildings, and manufactur- ing, with a modest growth expected in buildings and manufacturing, and a small decline in transport over the coming decades. In buildings, energy use will grow particularly in space cooling, and in appliances, whereas in space heating, efficiency gains and new technologies like heat pumps will reduce energy needs. Most of the growth will occur in commercial buildings. In total, buildings will collectively consume 23% more final energy in 2050 than in 2021. In manufacturing, substantial energy-efficiency gains, including increased recycling, will balance the growth in demand for goods, such that manufacturing energy use will grow by 14% to 2035 and thereafter remain flat to 2050. The feedstock sector will see energy demand grow by 17% and peak in the mid-2030s, reducing slowly thereafter owing to increased recycling and efficiency gains. Although transport services will grow signifi- cantly, overall energy demand in the transport sector will reduce over the forecast period. This is strongly associ- ated with the switch from internal combustion to battery electric engines, with half of the world’s fleet of passenger vehicles electrified by 2043. Efficiency gains in the road- transport subsector will more than counterbalance growth in energy demand in aviation. This trend will also be helped by the maritime subsector undergoing significant efficiency gains that lead to a peak in its energy use in the mid-2030s, despite growth in the size of the world fleet. Regional developments Although global final energy demand will level off, this is not the case for all the regions. In Europe and OECD Pacific, energy demand has already peaked, while in many of the middle- and low-income regions, energy demand will continue to increase through to 2050, as illustrated in Figure 1.2. Greater China's share of global energy demand is at 25%, but will reduce to about 20% in 2050, while the Indian Subcontinent will overtake North America as the second largest energy consuming region in 2040. Energy carriers Energy demand by carrier is summarized in Section 1.6. It is in carrier form that the story of the energy transition is most apparent. Historically, energy carriers have shifted gradually from solids to liquids; in recent decades, there has been a partly shift from liquids to gases. The coming decades are characterized by a shift to electricity.
  • 10.
    18 DNV Energy TransitionOutlook 2022 19 Energy demand CHAPTER 1 At the time of publication, Russia continues to wage war on Ukraine. Devastating consequences are being felt mostly in that country, but the reduction in commodities output, notably cereal, oilseed and potash for fertilizers is deepening worldwide food insecurity — already impacted by climate change and COVID-19 before the invasion. The war has also sent shockwaves through world energy markets, due to OECD-led sanctions against Russian energy exports, that are likely to have considerable long-term consequences even after what now looks to be a protracted war is over. Some 40% of European gas consumption has been covered by Russian exports in recent years. Terminating this source of supply — in line with EU plans — before 2025, will lead to large changes in not only the European arena, but also globally. In the short term, energy efficiency and the LNG trade will be the main beneficiaries of a choking- off of Russian gas exports. But in the longer term, the combined effect of higher gas prices, and policy support — including tough mandates — for renewable energy, will hasten the European energy transition. Our initial assessment (DNV, 2022) showed that, relative to our pre-invasion forecast, sanctions on Russian energy exports and its consequences will reduce overall European final energy demand. Since then, the war on gas has become even stronger, and we now find European 2030 gas consumption to be 26% lower, and European 2030 energy related CO2 emissions to be 8% lower, than we found a year ago. Despite the fall in European gas demand, global gas shipments (LNG and LPG — measured in tonne-miles) will expand by 12%, as empty gas pipelines from Russia will be replaced not only by piped gas from the North Sea and Middle East / North Africa to Europe, but notably by North American shale and Middle East gas — on-keel. The North East Eurasia region, where Russia is the major economy and fossil energy producer, will see its gas output reduced by one third in 2030 compared to last year’s forecast. Its gas exports will be cut in half, but even its domestic gas demand will decline as its economy suffers from sanctions, and export products such as fertilizers that use fossil fuels are also affected. We assume that sanctions against Russia remain predom- inantly a western policy tool. With low transport costs, oil trading patterns will shift. Compared to our 2021 ETO, North East Eurasia’s oil production in 2026 will decline by 17% to 12.6 Mbpd. Compared to 2021 levels, this repre- sents a 12% decline, as we discuss further in Section 9.6. However, global adjustments will ensure that the region will be less affected in the longer run. Thus, in 2050, the lingering effect will only be a 4% decline in the region’s oil production: some oil exports will be subjected to successful embargo, with previous importers of Russian oil importing from elsewhere. Russian exports that used to go to Europe and North America will be diverted to new consumers, principally those regions crowded out by the western demand seeking to replace Russian oil. Such Russian oil will be traded at a discount. Though clearly material in the short term, and with Europe inching towards a faster transition, it must be noted that over a three-decade perspective to mid- century, the impact of the present war on the energy transition will be vastly outweighed by other factors like carbon price developments and the declining costs of renewables and storage. A critical issue for Europe in its pursuit of energy independence will be its ability to fast-track the permitting of new, multinational renewables projects, where issues like the impact on biodiversity of these large projects require an efficient, coordinated approach. Over a three-decade perspective to mid-century, the impact of the present war on the energy transition will be vastly outweighed by other factors like carbon price developments and the declining costs of renewables and storage. Ukraine and Russia are key producers for many critical minerals for the energy transition. Both western sanctions and Russian trade war policy tools limit such exports. This means less availability of materials and higher costs. These higher costs will lead to more exploration and production elsewhere in the medium term. However, in the meantime, they imply higher battery, wind turbine, and solar PV costs amplifying pandemic-related supply chain challenges. These factors contribute to a slower transition speed, but are counteracted by emerging energy independence policies, particularly in Europe, that lead to faster uptake of renewable energy sources. The regional transition stories in Chapter 9, notably for North East Eurasia and Europe, provide more details and data on the energy implications of the invasion and related western sanctions on Russian energy exports. The Russian invasion of Ukraine
  • 11.
    20 DNV Energy TransitionOutlook 2022 21 Energy demand CHAPTER 1 This Outlook is being released almost 3 years after the SARS-CoV-2 virus was first detected in Wuhan, People's Republic of China. Although the risk remains of the emergence of an immunity-evading variant, much of the world, with the notable exception of China, is now on a path to COVID-19 as an endemic. However, the pandem- ic’s social and economic impact endures. The present inflationary environment, although exacer- bated by the war in Ukraine, is strongly linked to the pandemic stimulus packages put in place by govern- ments which have driven unemployment to near record lows in many OECD countries, coupled with supply-chain disruptions related directly to COVID-19, and wild swings in consumer spending habits as a consequence of lockdowns. Stimulus packages have also gone directly to energy sector activities. Our previous Outlooks (DNV 2020, DNV 2021) forecast stimulus packages for fossil end renewable industries to be balanced, producing a neutral effect from the pandemic over the longer term. What we see now is that because fossil energy production, especially shale developments, has shorter time delays than the expan- sion of wind and solar supply chains, fossil energy has been the main beneficiary of support schemes, and only 6% of stimulus has gone towards greening and carbon emissions reduction (Nahm et al., 2022). A case in point is Norway’s stimulus package. With an oil and gas sector directly providing 17% of GDP (Hernes et al., 2021), and network effects of a similar scale, support packages favoured fossil industries, keeping workers and engineers active, leading to higher oil and gas production than otherwise would have been the case. As noted on the page 8-9 timeline, the global GDP negative effect of COVID-19 was 6% in 2020. Note, however, that though economic growth in 2021 was stronger than forecast pre-COVID-19, and 2022 growth will be stronger than expected three years ago, the net effect on accumulated GDP over the last three years has been negative. IMF (2022) and World Bank (2022a) forecasts have substituted our own macroeconomic projections through 2027, and leave them slightly lower (1.5%) than our pre-pandemic economic projections. This difference is kept through to 2050 and contributes to dampen energy demand, but only marginally. Supply-chain disruptions will delay the transition in the short term but the pandemic lowers some energy demand permanently. Other developments will also leave permanent pandemic scars. That COVID-19 caused havoc across global supply chains, already made vulnerable by ‘just in time’ policies, is now well established. However, more consequential for the long term is how businesses have begun responding. There is evidence that while many companies have invested in smarter analytics and more diverse sourcing to de-risk their supply chains, the overwhelming response has been to pursue near- shoring or localization plans for supply chains (McKinsey, 2022). Re-shoring means lower efficiency in the use of resources and thus lower GDP-growth, now factored into IMF forecasts, and consequently less demand for energy-related services. The aviation and buildings sectors will see permanent changes. Reflecting IATA and other forecasts, ETO assumes that leisure air travel will rebound to pre-covid growth rates in 2024. By contrast, with the pandemic advancing the practice of virtual collaboration, business travel will reduce permanently to 80% of its pre-covid path. As leisure travel counts for two thirds of air travel, however, the airline industry will experience a drop off in air travel of only 7%. A similar, but weaker effect will be found in real estate. Home office use will remain higher than pre-covid forecasts and the people working from home will demand more space there. Home office expansion will dampen commercial and office space demand. Bigger homes and smaller offices will tend to cancel out and so the net permanent effect on energy demand is marginal. Rivalry between the major trading blocs created global challenges long before the COVID-19 pandemic and the Ukraine war. Yet both events have exacerbated the deglobalization trend. Less trade will impact world GDP negatively. Supply chains, notably for some critical metals will experience increased vulnerability. Disruptions are likelytohaveagreaterinfluenceonproductionofbatteries, solar panels, and wind turbines than on the production of fossil fuels. However, our analysis shows that for most critical resources, such disruptions will eventually be circumvented by alternative chemistries (for batteries), new sites of production (for batteries, solar panels, and wind turbines), and new materials. Yet, in the short run — to 2030 — supply-chain disruption effects will delay the transition. For example, we now expect the timing of the ‘yardstick’ measure for EV uptake (i.e. when EVs constitute 50%ofnewcarsales)tobedelayedbyanotheryear,to2033. The pandemic and energy Business travel will be permanently impacted by COVID-19, remaining 20% lower throughout our forecast period relative to pre-pandemic projections.
  • 12.
    22 DNV Energy TransitionOutlook 2022 23 Energy demand CHAPTER 1 1.2 TRANSPORT Current developments The transport sector has seen pandemic-associated reductions in energy demand in all subsectors — air, road, rail, and at sea — albeit with significant differences. In 2020, the combined demand across these sectors fell by more than a tenth (11%). Aviation, which experienced the highest percentage reduction, almost halving from 2019 to 2020, has not yet fully recovered and will not do so in our forecast period because business travel is expected to remain lower than the pre-pandemic level. By contrast, energy demand for maritime transportation fell by 4%, rail by 5% and road by 7%. In 2020, transport was responsible for 26% of global final energy demand, supplied almost entirely by fossil fuels. Figure 1.3 shows that 89% of transport energy use is oil, with natural gas and biofuels taking 6% and 4% shares, respectively, and electricity 1%. At present, the energy mixes in aviation, maritime and road almost mirror that of the global transport sector, whereas rail energy is mainly from electricity. To reduce local air pollution and global emissions, natural gas and biofuels — either pure form or blended with gasoline and diesel — were introduced decades ago. Greater China and North East Eurasia have a leading natural gas share (8%) in road transport. All regions, except Middle East and North Africa, have biofuel-blend mandates or give biofuels preferential treatment. Biofuel mandates are prime examples of the role of public policy in transport fuels. Decarbonization and fuel efficiency are interlinked — some regions, notably Greater China and OECD countries, use a mixture of push-and-pull policy measures to achieve decarbonization ambitions. We envisage public policy targeting and banning emissions continuing for at least another decade, supported by significant industrial and consumer approval. Over time, though, technology cost-learning dynamics will make such policies superfluous — at least in road transport, which accounts for almost 75% of transport-energy use. Vehicle manufacturers are increasingly overhauling their strategies to cope with the looming market dominance of EVs. For almost all use cases, EVs will soon become more cost effective than internal combustion engine vehicles (ICEVs). EVs typically have less than a third of the energy consumption of ICEVs, and lower maintenance costs. However, removing EV support too soon will reverse EV-uptake dynamics (Testa and Bakken, 2018). If one factors in both direct and indirect subsidies, EVs have already reached cost parity with ICEVs in most world regions, and sales will accelerate as an ever-larger range of models enters the market. Removing EV support too soon will reverse EV-uptake dynamics. EJ, TWh, or Mtoe? The oil and gas industry normally presents its energy figures in tonnes of oil equivalents (toe) based on m³ of gas and barrels of oil, whereas the power industry uses kilowatt hours (kWh). The main unit for energy, according to the International System of Units (SI), is, however, joules, or rather exajoules (EJ) when it comes to the very large quantities associated with national or global production. EJ is therefore the primary unit that we use in this Outlook. So, what is a joule? Practically, a joule can be thought of as the energy needed to lift a 100 g smartphone one metre up; or the amount of electricity needed to power a 1-watt LED bulb for 1 second (1 Ws). In other words, a joule is a very small unit of energy, and, when talking about global energy, we use EJ, being 1018 J, or a billion billion joules. While we use J or EJ as the main unit of energy, in a few places we use Wh. For measurements of quantities of energy production, we use tonnes, m³, and barrels. For ease of comparison, conversions are: 1 EJ = 277.8 TWh 1 EJ = 23.88 Mtoe Measuring energy; joules, watts and toes *Mbpd = million barrels per day of crude oil. 53Mbpd* 89%of transport demand Oil for transport 29Mbpd* 51%of transport demand 2021 2050
  • 13.
    24 DNV Energy TransitionOutlook 2022 25 Energy demand CHAPTER 1 Road Vehicle fleet size, categories and dynamics Standard of living (GDP/person) drives vehicle density (vehicles per person). Regionally, this relationship is influenced by geographical, cultural, technological, infrastructure and environmental factors, and by the availability of alternatives to road transport. To predict future developments in vehicle density, we have fitted historical data to a Gompertz-curve (a type of S-shape curve), as illustrated in Figure 1.4. In some regions this is supplemented by expert opinion, enabling us, for example, to adjust for the effects of policy support for alternatives to road transportation. We break down the road transport sector into three categories: passenger vehicles, commercial vehicles, and two-and three-wheelers. ’Passenger vehicles’ encompasses all vehicles with three to eight passenger seats; thus, it includes most taxis, but excludes buses. Other non- passenger vehicles with at least four wheels are considered ‘commercial vehicles’. These tend to be a significant fraction of road vehicles in less-developed countries; but, as these nations become more prosperous, the passenger-vehicle share of the fleet increases. We expect this trend to bottom out within the next few years, however. Taxis represent a significant fraction of today’s global passenger-vehicle fleet. In the coming years however, a number of structural changes must be taken into account in calculating the overall size of the car fleet and, impor- tantly, aggregate vehicle kilometres. Communal use of passenger vehicles is typically more prevalent in low- income regions. Because platform-based ridesharing services can offer improved services at higher efficiency and lower costs, this segment will continue to grow. A reduction in private ownership will ensue, especially in high-income regions. In addition, we assume automated vehicles, which we will see increasingly towards mid- century, are driven 50% more, and shared vehicles five times as much, as conventional, privately-owned vehicles. The latter is in line with the fact that taxis typically drive five times as much as privately-owned passenger vehicles. Consequently, an automated, communal vehicle will be driven 7.5 times as much as a non-automated private vehicle. The growing use of digitally-enabled forms of transport (automation and ridesharing) may happen at the expense of traditional public transportation, as well as walking and bicycle use, but these modal shifts have not been analysed. As we expect several factors to counter- balance each other, we assume that aggregate vehicle- kilometres driven will not be significantly affected by automation or car sharing. Image courtesy: Volvo Trucks.
  • 14.
    27 Energy demand CHAPTER1 EV uptake The uptake of EVs — passenger EVs first — will occur rapidly. Supported by contemporary findings (Keith et al., 2018), we assume that people choosing to acquire an EV will base their decision on weighing costs against benefits. Within our approach, simulated buyers have the choice between EVs (becoming increasingly cheaper and providing a longer range over time) and ICEVs in the categories: passenger vehicle, commercial vehicle, and two- and three-wheelers. Potential buyers of passenger vehicles will consider purchase price to be the main factor, putting less emphasis on the advanta- geous operating costs. Owners of commercial vehicles will give greater weight to the advantages of EV opera- tional costs. Currently, having too few charging stations within range or at the final destination (e.g. at home or at work) is a major barrier to EV uptake in most regions. Significant uptake of EVs cannot be achieved without both the average fleet range leaping higher and charging-station density increasing. We assume that the current battery cost-learning rate of 19% per doubling of accumulated capacity will continue throughout the forecast period. Consequently, vehicle prices will fall in the long run, in contrast to a near-term increase in the price of EVs due to base material shortages and supply-chain problems. In our view, higher prices will be partly mitigated by rising competition among EV manufacturers and by innovation such as cell-to-body and cell-to-chassis configurations. In Europe, the average battery size will grow from today’s 60 kWh/vehicle to about 90 kWh/vehicle in 10 years, resulting in an expanded vehicle range and EVs seeming even more attractive. Elsewhere, we will see different average battery sizes, depending on regional commuting and thus range needs. Total cost of ownership Total cost of ownership (TCO) is a purchase decision construct, reflecting public policy support. Figure 1.5 shows that EV TCO will decrease only slightly between 2020 and 2025, as increasing battery sizes almost offset lower battery costs. Moreover, material scarcity and supply-chain constraints, including localization, will place further pressure on vehicle costs, but will ease over time due to competitive forces and innovation. After 2030, low operating costs will start to inch driving distances upwards, which will in turn raise the TCO per vehicle. Current policies impacting TCO include buyer incen- tives for passenger EVs. Per vehicle, the value of these incentives varies from zero in low-income countries, to a few hundred USD in others, and to more than a thousand USD in OECD regions. Both passenger and commercial vehicles are supported by subsidies. When calculating the value of subsidies, we have included significant support provided to vehicle and battery manufacturers. The two countries with highest EV uptake rates, China (commercial vehicles) and Norway (passenger vehicles), use a mixture of preferential treatment of EVs and de facto subsidies on the buyers’ side, as shown by Testa and Bakken (2018). In Europe current policies favouring EVs are implemented as vehicle-emissions limits, giving carmakers bonuses for zero-emissions vehicles, and surtaxing fleets that exceed the target (EC, 2019). Commercial vehicles require much larger batteries, and we expect significantly higher and more-prolonged subsidy levels per vehicle. We assume that in OECD regions, and Greater China, there will be willingness to continue such support, which boosts commercial EV uptake through the TCO effect by making ICEs less attractive through higher carbon prices. Aside from direct purchase and manufacturing subsi- dies, a host of other preferential operating treatments for EVs are used, including, among others, permission to drive in bus lanes, free parking, and low-to-zero registration costs or road taxes. Except in a few oil-rich countries in Middle East and North Africa (Mundaca, 2017), direct fossil-fuel subsidies are not widespread. On the contrary, road taxes are prevalent across the world and, in OECD countries, typically also include an explicit carbon tax element (OECD, 2019). We foresee increasing tax and carbon-price levels to reflect local air-pollution prevention, and efforts to limit congestion and GHG emissions. 2021 2035 2050 0 4000 3000 2000 1000 5000 6000 Annualized passenger vehicle price Units: USD Combustion vehicle Electric vehicle Commercial vehicle cost of ownership Units: USD/Vehicle 2015 2020 2025 2030 2035 2040 2045 2050 Passenger vehicle cost of ownership Units: USD/Vehicle 2015 2020 2025 2030 2035 2040 2045 2050 350k 300k 250k 200k 150k 100k 50k 0 120k 100k 80k 60k 40k 20k 0 Vehicle operating cost Units: USD/100 km 2050 2021 10 5 15 25 0 20 30 Relative availability of gas stations for Petrol and EV The size of stations are relative to each other for each year, and cannot be compared visually across years. 2021 2035 2050 Drivers of EV uptake towards 2050 Today, new EVs tend to be priced higher than their combustion counterparts, which is why many countries have subsidies and incentives to support their uptake. EVs will become significantly cheaper within a decade and remain cheap. As scale advantages for Original Equipment Manufacturers (OEMs) erode, combustion vehicle prices are likely to rise. Despite the fact that EVs already have much lower running cost per 100 km, private buyers mainly look at purchase price. As upfront costs decline and total cost of ownership (TCO) advantages become clearer, passenger and commercial EVs will soon outcompete combustion vehicles. Unlike private buyers, commercial owners are strongly motivated by TCO calculations. While EVs have already plunged through the fossil TCO line, buyer behaviour lags cost developments as other considerations like range and ease of charging come into play. By 2050, 78% of all vehicles worldwide will be EVs. This will significantly alter road transport infrastructure. As ever more petrol stations are transformed into EV charging facilities, range anxiety may become an issue for combustion vehicles drivers. 26 DNV Energy Transition Outlook 2022 Figures are based on OECD data, including 2021 average gasoline prices, electricity prices and vehicle costs. Vehicle operating costs include maintenance costs.
  • 15.
    28 DNV Energy TransitionOutlook 2022 29 Energy demand CHAPTER 1 and automation. The passenger vehicle fleet climbs from 1.2 billion cars today to slightly above 2 billion in 2050, with the ICEV share falling precipitously from 97% to less than 25% by mid-century. Almost the entire fleet of two- and three-wheelers will be electrified by 2040, while EV uptake in commercial vehicles clearly lags develop- ments in the other two categories. We foresee that fuel-cell electric vehicles (FCEVs) will only play a role in road transport after 2030. These will account for up to 7% of the commercial EV fleet in China by 2050, with modest single digit shares in the other regions where hydrogen uptake is supported by respec- tive policies. The cost and energy-efficiency disadvan- tage of fuels cells compared with BEVs will prevent their large-scale uptake in all but one market segment – heavy, long-distance commercial vehicle transport. But even in this category, a significant share will be taken by battery electric trucking, sharing the market for non- fossil transport with FCEV-propelled trucking. This segment will also continue to use combustion technolo- gies, although it should be noted that this also allows for biofuel use. Whereas policy support is essential for hydrogen uptake in the demand sectors, and some countries, such as Japan and South Korea, strongly support the uptake of FCEVs as part of their automotive emission-reduction plans (see Chapter 9 for more details), there are still significant barriers hindering a stronger uptake of hydrogen in road transport. There is a significant energy loss (by a factor of two) when converting power to hydrogen. Additional well-to- wheel efficiency reduction happens when hydrogen is converted to electricity in the vehicle. Consequently, FCEVs can only reach an overall well-to-wheel efficiency of 25% – 35%, significantly lower than the 70% - 90% range for BEVs. Furthermore, FCEV propulsion is more complicated, and thus more costly, than that of BEVs. For these reasons, most major vehicle manufacturers appear to be introducing solely BEV models. Two- and three-wheelers are a form of transport repre- senting only marginal energy use in most regions — except in Greater China, the Indian Subcontinent, and South East Asia. Consequently, we have modelled vehicle demand and electrification of two- and three-wheelers in those three regions only, limited to those vehicles requiring registration (electric bikes are categorized as household appliances rather than road vehicles). We forecast rapid electrification in this segment — already more than a third of all Chinese two- and three-wheeler sales are BEVs. Relative utility: EVs and ICEVs In considering the relative utility of EVs compared with ICEVs, we assume four factors, of different weight, to be important: — Recharging/refuelling speed — Charging/fuelling stations within range — EV convenience — EV footprint advantage The EV footprint advantage reflects the value, if any, assigned to low-emission electricity as fuel and the associated sustainability gains. However, even EVs powered by electricity generated from a high-fossil energy mix have superior lifetime carbon efficiencies than size-equivalent ICEVs (ICCT, 2018). Comparing the utility of EVs and ICEVs across the four factors listed above, EV-uptake rates are significantly slower for commercial than for passenger vehicles — despite prolonged subsidies being expected. Figure 1.6 reflects our forecast that EVs will reach 50% of new passenger vehicle market share in Greater China and Europe in the late 2020s, in the early 2030s in OECD Pacific and North America, and globally by 2033. This milestone is central in our forecast and has not changed significantly between our Outlooks over the last five years. In low-income regions, uptake will come later as early uptake is hindered by a low density of charging infra- structure and by the dearth of subsidies. However, even in the region of slowest uptake, the 50% milestone will be reached by mid-century. By 2050, hardly any ICEVs will be sold in Greater China and Europe; sales of ICEVs will continue elsewhere, notably accounting for 30% of new passenger vehicles sales in North East Eurasia at that time. Electrification will be more prolonged for commercial vehicles. The world is split into frontrunner regions and laggards regarding uptake of commercial battery- electric vehicles (BEVs). Greater China will see a 50% sales share for commercial BEVs within five or so years, with Europe following two years later, while North East Eurasia will not see a 50% split in sales within our forecast period (Figure 1.7). Figure 1.8 shows our combined forecast for vehicle numbers, including two- and three-wheelers, with demand attenuated by an increase in both car sharing
  • 16.
    30 DNV Energy TransitionOutlook 2022 31 Energy demand CHAPTER 1 and, doubling them from our base case, will bring much faster uptake — some 35 million more commercial EVs. Note, however, that the main conclusion is that EV uptake over time is not insensitive to subsidies, with support given during early market uptake being the most important. Our sensitivity analysis indicates that were manufacturers to install larger batteries in their EVs, this would be detrimental to short-term sales, if battery costs per kWh remained the same. For example, a 25% increase in battery sizes would lead to a 11% reduction in global EV stock and 22% fewer EV sales in 2025. The long-term impact, however, would be negligible. Aviation Prior to the pandemic, civilian aircraft consumed almost 9% of the world’s oil, and that share was growing. Driven by rising standards of living, global aviation had tripled in the first two decades of this century, revealing a clear relationship between GDP growth and the number of people that fly, and the number of flights they take. By 2050, we will see annual global passenger flights growing to 10.2 billion flights (Figure 1.10), 130% higher than pre-pandemic levels. The strongest growth will occur in Greater China, followed by South East Asia. The growth in passenger trips occurs despite COVID-19, which really put the brakes on air travel, which more than halved from the onset of the pandemic. The rebound has been slower compared with other sectors. While we do not foresee a permanent effect on leisure travel, the pandemic introduced new work patterns that will have a long-term impact — re-basing business travel down 20% through our forecast period. Efficiency, as measured in energy use per passenger km, will continue to improve due to efficiency gains in aircraft and engine technology, better routes and operational patterns, and some gains in higher load factors and larger planes. Annual efficiency improvements will slow from 1.9%/year today to 1.2%/year in 2050 but cumulatively they will lead to fuel use increasing by only 40% (Figure 1.11) despite a 140% rise in the number of flights. The number of cargo flights will also increase, but aviation is and will continue to be dominated by passenger flights. Today, cargo trips represent 15% of global aviation energy use (WEF, 2020), and we keep this fraction constant for all regions and throughout the forecast period. Conclusions Despite the dampening effect on demand due to car sharing and automation, the size of the global passenger- vehicle fleet will increase by about two thirds by 2050. As noted previously, vehicle-kilometres will also rise, more than doubling by mid-century. A similar dynamic is anticipated for commercial vehicles, though growth will be slightly lower, with the fleet size expanding about 50% towards 2050. Importantly, the expansion of the world’s passenger and commercial fleet over the next three decades will not result in a similar pattern of growth in road-sector energy demand. In fact, quite the opposite: road-sector energy demand will be considerably lower in 2050 than it is today, principally because EVs are three to four times more efficient than vehicles with combustion engines. Figure 1.9 shows that while over three quarters of vehicles globally (78%) will be EVs in 2050, they will constitute just about 30% of the road subsector’s energy demand, with hydrogen FCEVs taking a further 3%. Mostly through mandated blend rates, 3% of this sub-sectoral energy demand will come from biofuel. The smaller part of the vehicle fleet still reliant on fossil-fuel combustion will be responsible for the lion’s share of energy consumption. Fossil fuel oil constitutes close to 60% of the global road- subsector’senergydemand in2050,with natural gas at 4%. Sensitivities New chemistries and configurations could drive the already high cost-learning rates (CLRs) for batteries even higher. A 50% higher battery CLR (27% instead of 18%) results in 150 million more passenger vehicles (+11%) and 85 million more commercial vehicles (+50%) by 2050, powered by batteries at the expense of combustion vehicles. Subsidy levels for passenger and commercial EVs, which are assumed to be substantial, have a considerable effect. Cutting them by 90% from the base case, will result in six million fewer passenger EVs in 2050. Subsi- dies are even more important for commercial vehicles, World road subsector energy demand by carrier and split between ICEs and EVs World road subsector energy demand by carrier and split between ICEs and EVs 2.8bn electric vehicles 0.77bn combustion vehicles Electricity 33% Oil 57% Hydrogen and synthetic fuels Bioenergy Natural gas In 2050, electricity is one third of energy demand in road transport, but powers nearly 80% of the global vehicle fleet.
  • 17.
    32 DNV Energy TransitionOutlook 2022 33 Energy demand CHAPTER 1 power are better suited for decarbonizing aviation because they are viable drop-in fuels, using existing infrastructure and combustion technology. Weighing the different advantages of hydrogen and e-fuels against each other, we will see three times more e-fuels — a 13% share in the mix — than pure hydrogen in the aviation subsector, principally because as a drop-in option, e-fuels can serve all types of flights, whereas pure hydrogen is limited mainly to medium-haul flights. However, oil will remain the main fuel source for aviation, retaining a 59% share in 2050, though in absolute terms oil use will be 26% lower than today. The efficiency gains and the gradual change in fuel mix mean that in our forecast, aviation will fare better longer term than the (currently under revision) CORSIA goals of carbon-neutral aviation growth to 2050. Maritime Maritime transport is by far the most energy efficient transportation in terms of energy per tonne-kilometre. Consequently, over 80% of the volume of internationally traded goods is carried by sea (UNCTAD, 2021). Nearly 3% of global final energy demand, including 7% of the world’s oil, is presently consumed by ships, mainly by international cargo shipping. The IMO regulation capping the sulfur content of ship fuel came into force in 2020, dramatically changing the type of fuels being used. The main shift has been to a much larger share of lighter distillates in the overall fuel mix, or other variants of fuels with less sulfur. However, a significant share of marine heavy fuel oil is still being used on ships with scrubbers installed. In the longer run, the IMO targets a 50% absolute reduction in CO2 emissions between 2008 and 2050. The strategy was established in 2018 and there is now mounting pressure from regulators and parts of the maritime industry for it to be further strengthened, and, indeed, the IMO plans to revise the strategy. Our analysis expects that the current target will be met through decarbonization involving a mixture of improved fleet and ship utilization, wind assisted propulsion, on-board CCS, energy efficiency improve- ments and a massive fuel switch including conversion from oil to gas and ammonia and other low- and zero-carbon fuel alternatives. Potential for electrification in the maritime subsector is limited to shore power when berthing and to the short-sea shipping segment. This is because the energy density of batteries today and in the future is likely to remain too low to play any sizeable role in deep-sea shipping. In the short term, the IMO’s 2020 target for reducing sulfur emissions will result in an increase in carbon emissions as scrubbers in particular require additional use of energy that other- wise would be used for propulsion. A world in which GDP doubles by 2050 will see cargo transportation needs considerably outweighing efficiency improvements. Cargo tonne-miles will therefore increase in almost all ship categories (Figure 1.12), with a total growth of 35% between 2020 and 2050. The later part of the forecast period will see growth in some categories such as gas carriers, but also reductions in most segments as efficiency improve- ments equal demand growth and ongoing decarboniza- tion is reflected in global trade patterns. Consequently, coal transport halves by 2050 in tonnes, and crude oil and oil products transport reduces by 20%. Fuel mix From a technology standpoint, aviation has relatively few options to replace oil-based fuel and is frequently termed a hard-to-abate sector. Yet, with a limited set of stakeholders, and an international governance structure enabling decision-making, it could be relatively easy to implement and monitor the uptake of technologies and fuels that emit less GHGs. However, even if alternatives to fossil fuels progress in the future, they are still prohibitively expensive and less readily available in terms of supply and infrastructure. Batteries weight makes electrification a realistic propul- sion option only in the short-haul flight segment. Deployment of electric airplanes is likely to start before 2030 on very small aircrafts with fewer than 20 passengers, expanding in the 2030s to slightly larger short-haul planes in leading regions. Batteries have very low energy density, and only hybrid-electric solutions are relevant for medium and long-haul flights. Since only a minor part of aviation fuel is consumed on short-haul flights, electricity will represent only 2% of the aviation fuel mix in 2050. The two remaining routes investigated and expected to change the aviation fuel mix are pure hydrogen and sustainable aviation fuels (SAF), including biomass- based first- and second-generation fuels as well as power-to-liquid- / e-fuels based on hydrogen. Common to all alternative solutions is that costs, both short-term and towards 2050, will be higher than current oil-based fuel. All changes in fuel and technology are therefore expected to come as the result of regulatory and consumer-supported forces. Examples include the ReFuelEU Aviation initiative in the ‘Fit for 55’ legislative package, higher carbon pricing from removal of free allowances to aviation in the future EU emissions-trading scheme (EU ETS) (EC, 2021), and individual willingness to pay for sustainable aviation. As an aviation fuel, pure hydrogen has some advantages over SAF. Produced from renewable sources, a hydrogen value chain in aviation could guarantee almost zero emission transport, assuming the produced by-products (water vapour and NOx emissions) are treated carefully. However, hydrogen is less suitable from a technical perspective due to its low energy density. The tanks needed for the large amount of hydrogen would require a very different airplane design with higher costs per passenger. Furthermore, the implementation of new designs takes at least 20 years due to the long operating life of aircraft. Aircraft design and infrastructure adjust- ments, handling and safety regulation would also need to adjust to evolve in synchrony with technology devel- opments. All these barriers to a widespread implemen- tation of pure hydrogen in aviation before mid-century result in its relatively small share of around 4% of the subsector's energy demand by 2050. Bio-based SAF is already implemented at small scale because of mandatory biofuel blend rates in certain countries and is expected to scale relatively fast given regulatory push and consumer pull. Thus, in the short and medium term, SAF is likely to consist mainly of biofuels. As described in the bioenergy section in Chapter 3.5, providing large amounts of sustainably produced biofuel is a challenge, but aviation has fewer decarbonization options and a higher ability to pay. We will see small shares of e-fuels based on hydrogen in aviation from the 2030s onwards, but, as with hydrogen in general, significant uptake will only happen in the 2040s. Liquid SAFs from biogenic origin or renewable
  • 18.
    34 DNV Energy TransitionOutlook 2022 35 Energy demand CHAPTER 1 For passenger transport, especially in urban areas, the space efficiency of rail transport is superior to other options. The ease of electrification also makes it a favourable option for transport decarbonization. Growth can also be explained by the increasing speed and competitiveness of high-speed trains compared with aviation, again with decarbonization as a main driver. The greatest passenger growth will happen in the Indian Subcontinent and Greater China, driven by a significant rise in standards of living, and a strong public policy push for rail transport development. As Figure 1.14 shows, almost all passenger rail growth will be in these two regions, with Indian Subcontinent having a 57% share in global rail passenger transport in 2050, and Greater China 27%. In all regions apart from Europe, where rail freight has traditionally been strong, GDP growth and transport sector decarbonization strategies are drivers of increased rail freight volumes. Europe has seen the greatest increase in road-freight demand, but the region’s potential for further growth in rail freight is constrained by already-crowded tracks, improved roads, and prioritization of passenger rail transport. Energy-efficiency improvements will be strong and relate mainly to electrification, though diesel-powered units will also experience significant efficiency gains. As Figure 1.15 shows, we predict that current growth trends in electrification will be sustained to meet demand for rail transport, with the fuel mix in 2050 becoming 54% electricity (41% today), 41% diesel, and 5% biofuel. Hydrogen has potential to replace diesel on non- electrified rail. Though single projects are frequently announced, such as the world’s largest fleet of hydrogen trains to be operated close to Frankfurt, Germany, with a total volume of 27 hydrogen trains, no large-scale use of gaseous energy carriers (e.g. hydrogen) in rail transport is foreseen. This is due to barriers such as limits in pulling power for rail freight transport, a need for governmental support, and the lack of installation of a hydrogen fuelling infrastructure along main rail tracks. World cargo shipping is an integral part of our analysis. Fossil-fuel demand and supply are regionally deter- mined: any mismatch between regions is shipped from the regions in surplus to those in deficit. There is also considerable seaborne transport of fossil fuel within regions. Similarly, base material supply and manufac- tured products are shipped on keel within, and, more importantly, between regions. Fuel mix Driven by the decarbonization push, the fuel mix in the maritime subsector will change significantly over the coming decades. It will transition from being almost entirely oil-based today to a mix dominated in 2050 by the use of low- and/or zero-carbon fuels (50%), natural gas (19%, mostly liquefied natural gas) and biomass (18%), as shown in Figure 1.13. Ammonia will have the highest share (35%) of low-and zero-carbon fuels and e-fuels 15%. Electricity will have only 2% for reasons previously explained. This massive fuel switch will be supported by many regionally imposed decarbonization efforts. In our main ETO forecast, we use one of several scenarios analysed within “IMO ambitions” in our Maritime Forecast to 2050 (DNV, 2022c). That report details 24 scenarios across two maritime decarbonization pathways: IMO ambitions complying with the current IMO GHG Strategy, and Decarbonization by 2050 achieving net-zero shipping by then. The report’s fuel mix information is included here, converted into the main energy-carrier categories used in this Outlook. Rail This subsector consists of all rail-using transportation, including urban rail systems. In 2020, a little less than 2% of global transport energy demand was from rail, about 0.5% of global energy demand. Passenger numbers will more than double (+140%) globally by 2050, driving rail travel up to 9.9trn passenger-kilometres. Rail freight transport grows 90% by mid-century, with significant regional differences. The strongest growth is expected in Greater China, where rail freight demand will double in the next three decades while the equivalent demand in Europe remains stable. DNV Maritime Forecast to 2050
  • 19.
    36 DNV Energy TransitionOutlook 2022 37 Energy demand CHAPTER 1 Despite increasing electrification and improvements in the efficiency of thermal insulation and heating/cooling equipment, global energy demand for buildings is set to grow nearly a quarter (24%) in the next three decades, from 120 EJ per year in 2020 to 148 EJ per year in 2050. The sector’s share in final energy demand is also expected to grow slightly from 29% now to 30% by mid-century. This is mainly driven by an increase in population and therefore in floor area demand, as well as a rise in per capita incomes leading to growing demand for space cooling and other electric appliances. Global warming further intensifies the demand for cooling. However, thanks to significant energy efficiency gains, energy demand will not grow as fast as what would have been implied by trends in population, incomes, and average temperatures. In 2020, 29% of the world’s total final energy and 48% of global electricity was consumed in buildings. About three-quarters (88 EJ) of this final energy demand was in residential buildings, and the rest (32 EJ) in commercial buildings including private and public workspaces, hotels, hospitals, schools, and other non-residential buildings. Total CO2 emissions from this sector, including indirect emissions associated with electricity and hydrogen production, amounts to 8 GtCO2 , or about a quarter (25%) of total energy-related CO2 emissions. As the world population continues to increase and the standard of living rises across the world, we will see a continuation of the historical growth in energy services provided in the buildings sector. However, the associ- ated energy consumption will not increase at the same speed thanks to energy-efficiency improvements, driven by higher efficiency standards, continued decline in the costs of energy efficient technologies and improvements in the building stock. For example, heat pump technology enables heat provision with an efficiency above 300% (the ratio between useful heating energy provided over the electricity used). Figure 1.16 shows developments in useful and final energy demand for four different end uses in buildings. As a general pattern, note the starkly different growth rate in the two bars representing useful and final energy demand a result of improving efficiencies in equipment. This is most visible in space cooling which, despite the improv- ing efficiency, is still expected to be the most important source of growth in energy demand from buildings over the next three decades. 1.3 BUILDINGS Zero Carbon Building in Hong Kong
  • 20.
    38 DNV Energy TransitionOutlook 2022 39 Energy demand CHAPTER 1 in demand for appliances and lighting services that leads to an energy demand growth in this subsector (residential and commercial buildings combined) of 87% between 2020 and 2050. In terms of this end use, the Indian Subcontinent, Sub-Saharan Africa, and South East Asia are the top three fastest growing regions. This is linked to rapid increases in both access to electricity and per capita incomes in these regions. Another reason is the expansion of off-grid solar PV in these vast regions where grid-coverage is often sparse. Where electricity load is low due to large distances, the cost of grid connection is high, and off-grid solar PV systems will be an economically feasible alternative for lighting and basic applications such as mobile phone charging. Although off-grid solar PV represents only 1% (511 TWh) of global electricity in 2050, it could meet 45% of Sub-Saharan Africa’s energy demand for appliances and lighting, and up to 18% of such demand across the Indian Subcontinent. The energy consumption of cryptocurrencies like bitcoin continues to draw significant attention. Concerns escalated when the price of bitcoin surged to over 65,000 USDin late 2021,makingminingmore attractive.Electricity consumption from bitcoin mining is estimated to be 40-180 TWh per year (University of Cambridge, 2022), or 0.2-0.8% of global electricity consumption. The explosive growth in electricity-intensive bitcoin mining has raised concerns over the capacity of grids to respond to this rapidly rising demand and over its environmental impact. Future demand for mining of bitcoin and other crypto­ currencies is linked to government actions that help or hinder their use. China, for example, completely banned domestic cryptocurrency mining and the use of associ- ated exchanges in 2021. On the other end of the spectrum are crypto mining-friendly countries like Kazakhstan or some US states like Texas, whose policies see crypto mining businesses as a potential boon to their economies. Building stock The floor area of the building stock is one of the most important drivers of energy demand in buildings, since energy consumption in key end uses, such as space heating and cooling, scale with floor area. In 2020, the total global floor area of residential and commercial buildings covered 250,000 km², just above the size of the United Kingdom. The floor area of residential buildings is expected to grow globally by 52% through to 2050, while commercial floor area will more than double in line with the growth in economic activity. This will result in a 64% expansion of residential/commercial floor area. Figure 1.17 shows developments in buildings' final energy demand by energy carrier. The most salient feature of the graph has to do with electricity taking an increasingly larger share in the mix, up from 32.5% in 2020 to 55.5% in 2050. This reflects the growing domi- nance of more efficient electric appliances in buildings, most importantly heat pumps. The growing share for electricity mostly comes out of the share of natural gas and biomass, going down from 29% in 2020 to 18.5% in 2050 and from 24% in 2020 to 14% in 2050, respectively. In the 2030s, we will start to see hydrogen use for heating purposes in buildings rising to a modest 1.6% share in the energy mix by 2050. This will be mostly in the form of hydrogen blended into natural gas pipelines at first, transitioning to some use of pure hydrogen as fuel further ahead. As outlined in more detail in DNV’s Hydrogen Forecast to 2050 (DNV, 2022a) published earlier this year, hydrogen use will be rather limited in buildings because it will be relatively expensive from a levelized cost perspective, losing out competitively to increasingly cost-efficient heat pumps. Appliances and lighting In 2020, appliances and lighting used 24 EJ of final energy, 20% of global buildings energy demand. We expect this demand to reach 45 EJ by 2050, with its share of global buildings’ energy demand rising to 30%. This projection is despite significant expected improvements in the energy efficiency of appliances and lighting. First postulated by Jevons (1865) in the context of the impact of blast-furnace efficiency on coal consumption, the Jevons Paradox asserts that efficiency gains will lead to a demand increase as savings from efficiencies will be used to consume more. This rebound effect has many examples, from cars to refrigerators, across various times and cultures. When it comes to the energy intensity of appliances and lighting, measured as watt-hours per US dollar of GDP, the top two most energy-intensive regions are OECD Pacific (OPA) and North America (NAM) (Figure 1.18). Greater China (CHN) and the Indian Subcontinent (IND) are the least energy-intensive economies in this regard. This ranking is not expected to change dramatically by 2050 (except that Greater China replaces the Indian Sub- continent as the least energy-intensive for appliances and lighting). However, these regions are expected to converge somewhat, with higher-income economies becoming generally more efficient in terms of appliances and lighting use and lower income regions requiring more appliance and lighting energy per unit of GDP. In 2020, energy intensity of this end use ranges from 20 Wh/USD (IND) to 85 Wh/USD (OPA) but this range narrows slightly to between 21 Wh/USD (OPA) and 78 Wh/USD (CHN) in 2050. We expect the steepness of the relationship between GDP and appliances’ energy consumption to reduce very gradually (by 0.6% per year) in unit energy intensity. These modest efficiency gains contrast with the rapid rise Despite increasing electrification and improvements in the efficiency of thermal insulation and heating/cooling equipment, global energy demand for buildings is set to grow nearly a quarter.
  • 21.
    40 DNV Energy TransitionOutlook 2022 41 Energy demand CHAPTER 1 temperature and reference indoor temperature of 21.1°C) as a result of global warming; — Developments in building-envelope insulation that reduce the loss of cool air inside buildings; — Improved efficiency of air conditioners. Growth in floor area, increasing market penetration of air conditioners and increasing CDD; all heighten cooling- energy demand, while developments in building- envelope insulation and improved efficiency have a dampening effect. The increase in final energy demand for space cooling due to greater floor area and more use of air conditioners will exceed savings from insulation and improved equipment efficiency, thus resulting in a quadrupling of energy demand for space cooling. This is despite a 30% increase in efficiency and an insulation and retrofit-driven reduction in energy losses of 28% on average between 2020 and 2050. This quadrupling also has regional variations, mostly driven by the increases in CDD and in air conditioner penetration, the latter due to rising income levels. North America presently accounts for half of global electricity demand for cooling. However, in 2050, about 30% of cooling demand will be from Greater China, and only 14% from North America. Europe’s electricity consumption for cooling will grow by a factor of 2.7 between 2020 and 2050 (Figure 1.21). Those regions with the greatest economic growth also happen to be those that demand the most cooling, measured in CDD. Currently, four regions have CDD above 1000 Celsius degree-days per year: IND, MEA, SEA and SSA. Collectively, their economic output is expected to more than triple by 2050. The result would be a ten-fold increase in electricity consumption associ- ated with space cooling for these regions (Figure 1.21). By mid-century almost half of all energy consumed for cooling will be in these regions with high CDD. Global warming will drive an increase in cooling degree-days and hence energy demand Figure 1.19 shows forecast developments in the shares of residential and commercial buildings in five selected regions. The share of commercial buildings is expected to grow in all these regions, with GDP growth outpacing population growth. This is most visible in regions such as Greater China and the Indian Subcontinent, where GDP will be growing much faster than population. By 2050, Greater China’s total floor area will be about 105,000 km2 , which is equal to the current (2020) floor area across all four of the regions shown in Figure 1.19. It is perhaps not surprising then that buildings in Greater China will continue to consume about one-sixth of energy use in buildings globally. Figure 1.20 shows trends in total floor area of buildings in the same regions, distinguishing between new buildings (25 years) and old buildings (25years). Globally, the share of new buildings in total floor area is expected to fall from 63% now to 58% by 2050, although there are differences across regions and over time in this trend. New building lifetime is driven by the region’s GDP per capita. In higher-income regions, where existing build quality is higher and population growth is slower, build- ing stock renewal will be slower, resulting in a higher average age of buildings. The age distribution of build- ings has implications regarding the ease and cost of adoption of new and more-efficient technologies and insulation. In higher-income parts of the world, where the building stock is older, governments should provide stronger incentives for energy efficiency as part of their emissions-reduction policies. Space cooling We estimate that space cooling accounted for only 5.3% of the buildings' energy demand in 2020 but predict an increase to 18% by 2050, with a roughly 60-40 split between residential and commercial buildings, respec- tively. Energy demand for cooling will grow from 6.3 EJ per year in 2020 to 26.7 EJ per year in 2050. Demand for space-cooling energy is shaped by five factors which are: — Growth in floor area that requires cooling; — Increasing market penetration of air conditioners, as increases in both income levels and standards of living mean more people can afford them; — Increasing cooling degree-days (CDD; the cumulative positive difference between daily average outdoor
  • 22.
    42 DNV Energy TransitionOutlook 2022 43 Energy demand CHAPTER 1 Space and water heating Space and water heating accounted for 32% and 21%, respectively, of the buildings sector’s total energy consumption in 2020, respectively. With increase in population and greater floor area, demand for space heating will also continue to grow, rising 9% in terms of useful heat demand by 2050. Improvements in insulation, and fewer heating degree days (when energy is required for heating buildings) due to global warming, will help reduce the rate of this growth. GDP per capita is the main driver of demand per person for water heating in residen- tial buildings. The water heating demand of commercial buildings — about 26% of total final energy used for water heating — is driven primarily by floor area. Globally, demand for hot water will rise more than 60% from 11.4 EJ of useful heat in 2020 to 18.4 EJ in 2050. Regions with colder climates (North East Eurasia, North America, Europe, and Greater China) create most of the demand for space heating. For water heating, the regional differences are mostly driven by standard of living. In higher-income regions, increasingly efficient hot water tanks are used continuously to serve multiple needs, from daily showers to washing dishes. In some lower-income countries, water is heated as required for basic needs using inefficient methods. Average efficiency of heating equipment is defined as the ratio of useful energy provided to final energy demand. This efficiency varies widely between technolo- gies, from less than 10% for traditional open wood-burn- ing to more than 300% for heat pumps. Heat pumps extract more energy in the form of heat from the air or earth than the energy they consume in the form of electricity. Figure 1.22 shows developments in the share of heat pumps in providing useful heat and in final energy use. It also tracks the impact of these developments in technology uptake on the overall efficiency of space and water heating. By 2050, heat pumps will provide 51% of total useful energy for space heating and 20% for water heating, while using only 19% and 5% of final energy, respectively. Thanks mainly to the expected transition from less efficient technologies such as gas boilers to using heat pumps for space and water heating — and because of gradual efficiency improvements in technolo- gies — we see average efficiency rising from 0.94 in 2020 to 1.58 in 2050 for space heating, and from 0.46 to 0.76 for water heating. Although energy-efficiency improvements in buildings are typically profitable, governments face challenges in encouraging homeowners to implement such measures. One prominent example is the UK government’s Green Spraying Eco wool insulation in a home. Policies to incentivize energy efficiency improvements need to overcome underinvestment due to split incentives. Deal scheme. It aimed to support the retrofitting of 14 million homes by 2020 but was terminated by 2020 after only 14,000 supported retrofits in 2016, and is now being widely seen as a failure (Rosenow and Eyre, 2016). One factor that hinders energy efficiency retrofits is the ‘split incentive’ mechanism that arises in the rental sector where the homeowners' interests differ from those of tenants, with the costs of retrofitting typically borne by the landlord, and the benefits accruing mostly to the tenant. Smarter policy interventions are needed to tackle split incentives that frequently result in underinvestment in efficiency measures. In our forecast, we expect a 24% reduction in space heating demand by 2050 due to better insulation and retrofitting, representing a relatively modest improvement trajectory. The increased uptake of heat pumps is a result of the reduction in their cost, helped by cost-learning feedback loops where the cumulative installed capacity of the technology brings down production costs. Costs vary between regions, but with a global learning rate of 20% decreasing gradually to 12% in 2050, we expect to see a reduction by mid-century in the levelized cost of heating by heat pumps in all regions (except for North East Eurasia, due to rising electricity prices). This cost reduc- tion is expected to be between 17% and 34% for various
  • 23.
    44 DNV Energy TransitionOutlook 2022 45 Energy demand CHAPTER 1 regions, and 25% on average. Figure 1.23 presents the average levelized cost of selected heating technologies per MWh of heat for selected regions. This contains the fuel cost and the annualized investment cost over the equipment’s lifetime. European households carry a tax burden averaging over 30% of the electricity price, whereas the rates are less than half of this is other regions. Thus, although heat pumps reach a levelized cost parity with gas boilers in Greater China during the 2020s, they remain relatively expensive in Europe. Nonetheless, in some local markets like Norway, where cheaper electricity prices reduce operating costs, and long winters ensure a higher investment profitability, heat pumps constitute the majority of the market even though cold temperatures mean a lower seasonal coefficient of performance. Thus, in Europe, heat pumps maintain over 30% market share in space heating capacity additions, going as high as 70% by 2050. Globally, heat pumps will provide about 40% of the useful heat for space heating in 2050 while consuming only 19% of the total final energy supply. The move away from traditional biomass stoves for water heating is another big driver of efficiency improvements. Although consuming 25% of the final energy used globally forwaterheatingin2020,traditionalbiomassonlyprovided 7% of the useful energy. Increased energy access will bring the final energy represented by traditional biomass to 15% by 2050, resulting in savings of 2.5 EJ per year. Figure 1.24 shows developments in the global energy mix for space and water heating in buildings, and total final energy demand for each end use. As a result of the above developments, final energy demand for water heating will stay stable in the range 24 to 25 EJ from 2020 to 2050, with a slight shift from residential to commercial buildings. Final energy demand for space heating will fall from 38 EJ per year to 25 EJ per year in the same period with further implementation of insulation and retrofitting measures, and as the use of heat pumps spreads. In terms of energy mix, we see a stronger growth in electricity in space heating than in water heating. In space heating, the share of natural gas shrinks, giving way to electricity and to direct heat. Water heating will be more stable, both in terms of total energy demand and energy mix, the only notable development being natural gas replacing biomass. Cooking There are large regional variations in cookstove use. We estimate that globally in 2020, almost half of the cooking
  • 24.
    46 DNV Energy TransitionOutlook 2022 47 Energy demand CHAPTER 1 energy demand is provided by traditional biomass stoves, which entails burning biomass such as animal waste, charcoal, and wood. This represents 25% of the population, the majority of whom live in Sub-Saharan Africa (SSA) and Indian Subcontinent (IND). By 2050, the share of traditional biomass stoves will reduce to 31%, primarily replaced by electric and modern biomass stoves (Figure 1.25). Even the phasing out of traditional biomass stoves has regional variations. In IND, traditional biomass stoves are replaced by electric and gas stoves, while in SSA they are mostly replaced by modern biomass stoves, due to availability and affordability of different energy carriers. In 2020, cooking was responsible for 22% of the energy consumption in buildings (26 EJ per year), and about 6% of all energy consumption. Despite population growth and an increase in the number of households, final energy demand sees hardly any growth, remaining at 27 EJ year in 2050. This is the consequence of electrification and adoption of efficient cooking stoves. We assume that a typical household needs 4.3 GJ per year of useful heat for cooking, based on estimates in 2014 of final energy use for cooking (IEA, 2017b). Due to heat losses in the process, this amount of cooking requires 12 GJ of final energy, in the form of fossil fuel, bioenergy, or electricity. By 2050, the global average household size is expected to decline to 2.4 (Ürge-Vorsatz et al., 2015), which will reduce final energy demand for cooking to 7 GJ per year per household. Accounting for the increase in the number of households, we expect global total useful energy demand for cooking to rise from 6 EJ per year in 2020 to 8 EJ per year in 2050. Ultimately, lower-income countries will seek to reduce both burning of solid biomass for cooking and the local use of kerosene, a major health hazard that is responsible for many deaths because of household air pollution. By 2050, the population without access to modern cooking fuels will decline by 44%, bringing large efficiency improvements that will be further boosted by switching from coal and oil to electricity and modern biomass cooking stoves. Gas stoves, using methane, persist in the cooking energy mix, their share growing slightly from 27% in 2020 to 29% in 2050. This will have implications for indoor air pollution and respiratory health in regions with high use of gas stoves, such as North America (Lebel et al., 2022), notwithstanding the warming implications of methane leaking to the atmosphere. 1.4 MANUFACTURING Manufacturing is currently the largest energy consumer at 133 EJ (32%) of final energy demand in 2020. Despite substantial energy-efficiency gains and increased recycling and reuse of materials and goods, the sector’s energy demand will keep growing. Most of the increase will occur within the current decade, as energy demand will grow by 16% to 154 EJ by 2030. Demand will then slowly reach a plateau at ~162 EJ by mid-2030s, staying at around that level until 2050. Figure 1.26 shows the sector’s energy mix today being dominated by fossil fuels, in particular coal and natural gas, which together supply more than half of its final energy. Their combined share will progressively decline in favour of direct electrification, hydrogen, and bioen- ergy. But the high heat often required poses a problem for using decarbonized alternatives. This is why the iron and steel, chemicals and cement production industries are often described as ‘hard-to-abate’, as they cannot easily be decarbonized through electrification.
  • 25.
    48 DNV Energy TransitionOutlook 2022 49 Energy demand CHAPTER 1 Sectoral energy demand Trends, regulatory frameworks and technological possibilities are different in the various subsectors that are modelled in the Outlook, and details of the evolu- tion of both energy demand and fuel mix are provided in Figure 1.27. Iron and steel The steel production subsector is the single biggest energy user in manufacturing, representing 35 EJ (31%) of the whole sector’s energy demand in 2020. Steel production has doubled in two decades, due mainly to infrastructure and industrial developments in China; we forecast it will increase 15% to the mid-2030s, thereafter plateauing. Steel production involves two main, competing methods, with different inputs and energy needs: — Blast furnace, basic oxygen furnace (BF-BOF), is the conventional method. It converts virgin iron ore into steel in a very energy-intensive process using coke, a coal derivative, as a reducing agent. — Electric arc furnace (EAF) uses scrap steel or direct reduced iron. EAF is much more energy efficient, needing on average 54% less energy per tonne of steel compared with BF-BOF. EAF’s share in global steel production will progressively increase from 26% in 2020 to 49% in 2050 (Figure 1.28), driven by reduced demand for steel and an increasing quantity of scrap steel becoming available. Consequently,energydemandforsteelmakingwillplateau around 40 EJ from 2030. Coal use will progressively decreasebutwillstillmeetmorethanhalfofthesubsector’s energydemandbythen.Steelwillplayakeyroleinsustain- ingdemandforcoalthroughtomid-century.Thesubsector accounted for a sixth of global demand for coal in 2020. In 2050, steel will represent a third of that demand. The increased share of EAF will lead to a 58% increase in electricity demand for steelmaking, from 1.3 PWh in 2020 to 2.1 PWh in 2050. A drive towards ‘green’ steel and DRI will increase the subsector’s use of hydrogen for energy, from practically zero today to 9% of its fuel mix by 2050. China and the Indian Subcontinent will together account for two thirds (62%) of total hydrogen consumption for iron and steel production in mid-century, and a fifth (20%) will go to European steelmaking. Although most steel production is for domestic markets, steel and its by-products are globally traded commodi- ties. Production is today dominated by China. Steel plants in China today are 15 years’ old on average, and even if demand there declines, these plants will have a few more decades of economic lifetime ahead of them (IEA,2020). China will thus remain the main steel producer, with the Indian Subcontinent playing a growing second-place role. Chemical and petrochemical This subsector includes the manufacture of plastics and other petrochemicals, including ammonia and methanol used as feedstock. It traditionally needs fossil fuels as feedstock for the final product as well as for energy, as the atoms from these fuels are embedded into the plastics, fertilizers and other final chemical products produced. This closely linked non-energy use is accounted for separately (see Section 1.5). The subsector’s energy demand is expected to grow by about half from 21 EJ in 2020 to 31 EJ in the mid-2030s, then slowly decrease to 26 EJ in 2050. The variation of energy demand is mostly attributed to demand for virgin plastics. This demand is initially expected to continue increasing exponentially but will become progressively attenuated by higher recycling rates in all regions (see Section 1.5 for more details). Energy and non-energy uses are for the most part intertwined in today’s industrial processes. Future processes like green ammonia production or electrified steam cracking will progressively decouple these two distinct uses in the subsector. However, long-life, multi-billion-dollar petrochemical sites operate on a fragile equilibrium. Heat recovery is well-developed, and excess heat or by-products from some processes often fuel others. Retrofitting options are consequently limited, as are potential energy-efficiency gains. This leads us to expect a slow transition in the energy mix, slow uptake of hydrogen for energy, and slow electrification.
  • 26.
    50 DNV Energy TransitionOutlook 2022 51 Energy demand CHAPTER 1 Cement Making cement, the main raw material for concrete, is also very energy-intensive, accounting for 11 EJ (8%) of manufacturing demand in 2020. Cement has turned into an indispensable raw material for construction around the world but is under scrutiny due to its high carbon footprint (see discussion, opposite). In recent decades. cement production has more than doubled from 1.7 billion tonnes in 2000 to 4.2 billion tonnes in 2020. Most of this growth is attributed to massive development in buildings and infrastructure in Greater China, where around half of all cement production occurs today. Global production will increase only slightly in the future, to 5.0 billion tonnes in 2050, as production in China slows and other regions such as the Indian Subcontinent step in. Most energy demand for cement making is related to energy-intensive production of clinker, the binding constituent of cement. Dry kilns where most clinker production takes place today are long-life equipment and already quite energy efficient. Energy-efficiency gains will be obtained by reducing the overall share of clinker in cement, and the subsector’s energy demand will plateau around 12 EJ from 2030 onwards. For the 1,500°C high-heat clinkering phase, the subsector relies heavily on coal, oil (as petroleum coke, ‘pet coke’, a by-product of oil refining) and, to a lesser extent, natural gas. Recycling schemes in some regions have also created an abundant source of highly calorific and subsidized waste to fuel the process. The cement industry, in Europe in particular, has thus specialized in energy recovery, which is expected to grow. The corresponding share of bioen- ergy is expected to increase, but political decisions and competition from recycling technologies will limit the available waste stream. Hydrogen and electrification are expected to play limited roles, due to the necessity to abate the process emissions of cement regardless of the energy mix. The fuel mix will remain highly carbon-intensive, and decarbonization goals will be covered with carbon capture and storage. Manufactured goods The manufactured goods subsector includes production of general consumer goods; food and tobacco; electron- ics, appliances, and machinery; textiles and leather; and vehicles and transport equipment. In 2020, manufactured goods energy demand was 42 EJ. As economies grow, the demand for finished goods experiences a similar rise. Despite efficiency improve- ments, this expected growth in demand will lead to an increase of 26% in the subsector’s annual energy demand by 2050. The subsector’s great diversity is reflected in its energy use and fuel mix. Fossil fuels cover half of its energy demand now, but their share will progressively decline as electricity, bioenergy, and hydrogen to a lesser extent, become attractive options to fuel the usually low- or medium-temperature industrial processes. Around 60% of today’s energy demand is concentrated in three regions: Greater China, the Indian Subcontinent and Middle East and North Africa. These regions will continue todominate,buttheIndianSubcontinent will progressively take over China’s leading position and will represent a third of the subsector’s energy demand by 2050. Base materials The base materials subsector covers the production of non-metallic minerals (excluding cement); non-ferrous materials, including aluminium; wood and its product, including paper, pulp, and print. These energy-intensive industries had an energy demand of 20 EJ in 2020, which will slowly increase to 22 EJ in 2050. Construction and mining Construction (of roads, buildings, and infrastructure) and mining is the smallest of the ETO manufacturing subsec- tors, with 6 EJ of energy demand in 2020. However, it will see the largest relative increase in energy use, growing 50% to 9 EJ in 2050. The growth is especially pronounced in regions that will see rapid economic growth, including Sub-Saharan Africa (+260%), the Indian Subcontinent (+247%) and South East Asia (+88%). Cement is a carbon-intensive material, representing around 6% of global CO2 emissions. The production of clinker accounts for most of the emissions. As in other manufacturing processes, high heat is necessary for the clinkering phase. This is usually achieved using coal, pet coke or natural gas. However, energy use accounts for only 40% of the emissions. The remaining 60% comes from the chemical reaction itself, where CO2 is released from limestone and other minerals to form clinker. These so-called process emissions are inseparable from today’s cement production. Decarbonizingcement productionis consequently a challenge.This is exacerbatedby the fact that no process so far exists for cradle-to-cradle cement or concrete recycling. Carbon capture is currently the favoured option to decarbonize cement production, as it would target both combustion and process emissions. Acting on cement chemistry is a first available option. Lowering the clinker content in cement decreases the total footprint, and there is already a global trend towards a slow decrease of the clinker-to-cement ratio. Clinker-free cementitious materials are already produced at industrial scale, for example, by Hoffmann Green Cement Technologies (World Cement Magazine, 2022). Other solutions such as substitution of limestone in clinkering are also possible. However, raw material availability, lock-in mechanisms and inflexible construction standards will slow the uptake of these different solutions. Acting on fuel mix is a second option. Hydrogen could be a solution to retrofit current installations, with a pilot test being recently conducted by buildings materials supplier Hanson UK, for example. Kiln electrification is also an option, though it is not suitable for retrofitting, and no commercial-scale installation has ever been in use. This could eliminate direct emissions from combustion, but process emissions would remain. In regions with high carbon prices like Europe, where hydrogen could be competitive, solid recycling schemes are also in place. Waste recovery often creates a substantial source of income as well as a replacement for fossil fuels, which can represent up to 100% of the fuel mix and easily compen- sate for high carbon price. Carbon capture is currently the favoured option to decarbonize cement production, as it would target both combustion and process emissions, with little impact on kiln operation. As part of the Northern Lights project, the world’s first industrial-scale capture facility will start operating in 2024 at Norcem Brevik in Norway. Cement producers operate on tight margins in a very competitive environment. Cement is a low value-added product, and decarbonization costs could double its price (ETC, 2018). Public procurement is then essential to drive decarbonized cement demand, and strong policies would be necessary to protect the leading regions against carbon leakage. The complexity of decarbonizing cement production
  • 27.
    52 DNV Energy TransitionOutlook 2022 53 Energy demand CHAPTER 1 Industrial heat represents fully two thirds of the energy demand in the manufacturing sector. Heat is often needed to perform material transformations, chemical reactions, or metal melting. As Figure 1.29 shows, heat demand differs among the manufacturing subsectors and can represent up to 90% of their total energy demands. Despite energy-efficiency gains, these shares of heat demand are forecast to remain relatively constant to 2050. The source of the heat will, however, change. Temperature requirements differ across the subsectors and will influence the trajectory of their heating energy mixes. In manufactured goods, heating temperature require- ments are usually moderate and can, and will increas- ingly be, supplied by industrial heat pumps. The competitiveness of these pumps will grow as their high coefficient of performance will increase, by a factor of up to six. As a result, electricity will see its share in the heat mix of the manufactured goods subsector increase from 7% in 2020 to 12% in 2050. But where energy is used for high-heat processes — cement, petrochemicals, base materials, iron and steel — fossil fuels will remain the most competitive energy carrier. Electrification of heat processes in these high- heat subsectors will be significantly less-pronounced than in the manufactured goods subsector, due to the limited efficiency gains from switching to electricity in high-heat furnaces. Because electricity is still mainly produced from fossil-fuel sources in the near-term, there are significant losses during its production. Thus, the losses and increased costs associated with electrification compared with using direct heat from fossil-fuel sources, make the base materials subsector reliant on fossil fuels for the coming decades. This is one of the main reasons why the subsector's associated emissions are considered hard to abate. There will consequently be only moderate changes in the fuel mix for industrial heat during our forecast period, as Figure 1.30 illustrates. Coal will remain the largest energy carrier, driven by persistent use of coal in Greater China and the Indian Subcontinent which, together, will still represent two thirds of demand by mid-century. However, coal’s share in heating for manufacturing will decrease from 37% in 2020 to 28% by 2050. Natural gas will also lose ground, from 30% in 2020 to 24% by 2050. Hydrogen will be used for heating and as a reducing agent and will hold a share of 9% of industrial heating energy demand by the end of our forecast period. Europe will be the largest consumer of hydrogen for these purposes (54% of demand), followed by North America (34%) and OECD Pacific (11%). Hydrogen will become a viable source of heating in industry only in these high carbon-price regions where it will partly outcompete natural gas. With lower emission factors, bioenergy will also become an interesting alternative, growing from 11% to 16% of the heat demand in manufacturing. Focus on industrial heat
  • 28.
    54 DNV Energy TransitionOutlook 2022 55 Energy demand CHAPTER 1 Fuel mix Oil and natural gas dominate today’s fuel mix for non- energy use, meeting 54% and 41%, respectively, of demand in 2020, with coal covering the rest of the mix. 90% of this coal use is in China, mainly for ammonia and methanol production. Plastics production necessitates primary chemicals like ethene (ethylene) or propene (propylene), which can be obtained from cracking oil or from natural gas. Feedstock choice is dependent on local availability and prices. North America relies, for instance, on natural gas due to the abundance of ethane, a by-product of natural gas extraction. Regions with little fossil fuel extraction, such as Europe or Greater China, will usually use naphtha, a fraction of oil which can be easily imported. In 2020, 64% of plastics feedstock demand was covered by oil and the rest via natural gas (methanol-to-olefins is not included here). These shares will remain stable to 2050. 80% of ammonia is produced from natural gas by steam methane reforming, and this share is expected to stay constant. Coal gasification will be progressively phased out and will represent 11% of ammonia production in 2050 versus 20% in 2020. The fuel mix for other chemicals is closely related to that for plastics, given that in most cases (not for methanol), the same primary chemicals obtained via steam cracking are used. Non-chemical uses are and will be covered by oil; for example, bitumen is essential for roads. Overall, non-energy demand for oil and natural gas will increase. As Figure 1.33 shows, non-energy will maintain a constant share of total natural gas demand. For oil, the share of non-energy demand will gradually increase from 14% in 2020 to 22% in 2050 as demand grows for feed- stock (particularly plastic) but will decline for other end uses like lubricants for road transport. Feedstock use will therefore be one of the key drivers for oil demand in the coming decades, with the caveat that it will peak in the 2030s and thereafter steadily decline. 1.5 NON-ENERGY USE (FEEDSTOCK) Non-energy use reflects consumption of coal, oil, natural gas, or biomass as industrial feedstock, and typically results in tangible products like plastics, paints or fertilizers. In 2020, 39 EJ (about 8%) of global primary fossil-fuel supply was used for non-energy purposes. Demand Plastics production represented 18 EJ (45%) of total non-energy demand in 2020. Global plastics demand has grown significantly in recent decades, reaching 450 Mt per year in 2020. This growth is expected to continue and reach 860 Mt per year in 2050, as plastics consumption is strongly related to increasing GDP per capita. However, even if plastics demand increases by 91%, non-energy use will only rise 28%. This is due to a significant increase in recycling rates. Secondary plastics obtained by mechani- cal recycling covered 7% of global demand in 2020. This will grow to 27% by 2050, thanks to the generalization of recycling schemes in all regions, and to advances in recycling technologies, including feedstock recycling. At the same time, the uptake of chemical recycling via pyrolysis and similar technologies will create a stream of recycled fuel that could be directly fed into traditional steam crackers, as a replacement for oil. By 2050, 1.1 EJ of this recycled fuel will be produced each year, covering about 1% of oil primary energy demand. Demand for ammonia, mainly driven by fertilizer consump- tion, is expected to slightly increase. Natural gas or coal (mainly in China) are used to provide hydrogen for the production. Ammonia produced via electrolysis-based hydrogen could reduce the non-energy demand, but subsequent reuse of CO2 in the process to produce urea, will limit the interest for this alternative. Thus, production using fossil fuels (with and without CCS) will retain a 90% share in 2050. Non-energy demand will be stable at 4 EJ over the coming decades. Demand for other chemicals (methanol, paints, cosmetics, pharmaceuticals) is expected to slightly decrease from 8 EJ in 2020 to 6 EJ in 2050. Non-chemical uses include applications for asphalt (bitumen), lubricants and solvents. Demand for these purposes is expected to increase from 6 EJ in 2020 to 10 EJ in 2050, driven by increased demand for road infrastructure in growing economies. Quantafuel’s advanced plastic recycling plant at Skive, Denmark. Image courtesy Quantafuel.
  • 29.
    56 DNV Energy TransitionOutlook 2022 57 Energy demand CHAPTER 1 1.6 FINAL ENERGY DEMAND FROM ALL SECTORS The final energy demand by energy carrier for all sectors combined is summarized in Figure 1.34. The ongoing transition is extraordinary in relation to the growing role of electricity in the final energy demand mix. In 2021, electricity represented just 19% of the world’s final energy use. In 2050, this will be 36%, with growth in electricity demand more than doubling from 84 EJ per year in 2020 to 179 EJ per year by mid-century. In the first 10 years, the growth is above 3% per year. As electricity has a higher efficiency in its end use, it could be argued that more than half of all energy services in mid-century will be provided by electricity. The reason for a steady increase in electrification is a combination of cost, technology, and policy. As costs of solar and wind will continue to decline rapidly, and their shares of the electricity mix also increase, electricity will become cheaper relative to other fuels. Technological progress will make electricity available and viable for use in ever-more subsectors and new applications, often in sectors where electric alternatives were either non-exist- ent or very expensive. New applications requiring modern energy are emerging — e.g. communication appliances and air conditioning — for which there are few or no alternatives to electricity. Finally, more ambitious decarbonization policies favour electricity’s low-carbon footprint, an advantage that further strengthens as the electricity mix becomes greener. The share of hydrogen and hydrogen derivatives like ammonia and e-fuels also increases significantly, from a negligible share today to 5% combined in 2050. In addition, direct use of biomass has been and will keep increasing, but at a much lower rate. Direct use of fossil fuel reduces over the coming years, but the decline is less than for the fossil fuel used in electricity production. Still, direct use of fossil fuel reduces its share from 67% to 45% of final energy demand over the next 30 years, with the reduction of oil and coal being bigger than for natural gas.
  • 30.
    58 DNV Energy TransitionOutlook 2022 59 Electricity and hydrogen CHAPTER 2 2 Highlights 2.1 Electricity60 2.2 Grids68 2.3 Storage and flexibility71 2.4 Hydrogen74 2.5 Direct heat81 Electrification is the main engine of the ongoing energy transition: it is not only more than doubling — increasing from 27 PWh/yr in 2020 to 62 PWh/yr by 2050 — but it is greening at the same time, with the proportion supplied by wind and solar PV rising from 11% now to close to 70% by 2050. Critically, indirect electrification via green hydrogen, half of which will be produced by dedicated renewable sources by 2050, will help to decarbonize hard-to- electrify sectors like aviation, maritime transport, and high heat processes in manufacturing. We find however, that low and zero-carbon hydrogen will be only 5% of energy demand by 2050 — whereas a net zero energy system would require roughly three times as much hydrogen. This chapter covers a range of subjects associated with rising electrification, including estimations on the scale of transmission and distribution infrastructure needed, requirements for storage and flexibility, and invest- ments in analytics and digitalization. We also cover new categories of demand, including EVs, space cooling, manufacturing, and the production of green hydrogen. ELECTRICITY AND HYDROGEN
  • 31.
    60 DNV Energy TransitionOutlook 2022 61 Electricity and hydrogen CHAPTER 2 2.1 ELECTRICITY Electrification is the main engine of the energy transition. Electricity demand will more than double by 2050, and it will be greening at the same time – also penetrating sectors that have hitherto been hard to electrify via green hydrogen. Electricity supply Global grid-connected electricity supply increases from 27 PWh/yr in 2020 to 62 PWh/yr by 2050. This signifies a 2.7%/yr annual average growth in electricity generation. At present, the biggest share of the power generation in the world comes from coal-fired power plants (35%), as seen in Figure 2.1. This will shrink to just 4% by 2050 owing to decarbonization, pressure on financing of coal-fired power plants, and the declining costs for renewable electricity generation. The second-largest electricity generator in the world at present is the gas-fired power plant. Its current share of the electricity mix, 24%, will be maintained through to 2030, despite the short-term supply shock caused by Russia’s invasion of Ukraine. From 2030, this share enters a period of steady decline to reach 8% by 2050. Because it is relatively cleaner than coal, we expect gas-fired power plants, primarily run with methane, to have a longer staying power. Such plants have a larger share in regions such as Middle East and North Africa and North East Eurasia, where domestic natural gas resources are plentiful. The role of fossil-fuel powered power stations will be increasingly confined to providing flexibility and backup in power systems when variable renewable energy sources (VRES) are unavailable, especially through low-capital expenditure (CAPEX) gas-fired power stations. In 2050, fossil fuels will generate just 12% of power needs and nuclear 5%. By mid-century dispatcha- ble power, under intense pressure to decarbonize, will still have a price-setting role, possibly not as pronounced as today, and will continue to play a pivotal role in the power system. We are likely therefore to see considera- ble attention being paid to maintaining fossil-fuel generation, despite its diminishing role in the electricity supply. Hydrogen in electricity generation In the long term, hydrogen also has potential to be blended into gas-fired power plants. We project a maximum volumetric blending fraction of 60% in gas-fired power plants, starting from 2026, a ratio determined by the price differential between methane and hydrogen. Despite high volumetric blending frac- tions, globally, hydrogen-fired electricity reaches only a maximum of 1% in 2038, and then reduces to 0.3% by 2050, as a share of world electricity generation. In some regions, however, hydrogen takes a significant share of gas-fired electricity. In the OECD Pacific, we project almost 50% of electricity from gas-fired power plants to be running on hydrogen in 2050 (Figure 2.2). Similarly, in Europe and Greater China, 20 and 30% of the electricity from gas-fired power plants will be generated by hydrogen in 2050, respectively. In these regions, hydrogen will increasingly be produced by grid-connected electrolysers. These grid-connected electrolysers will produce hydrogen when electricity prices are low, typically when VRES have a large produc- tion share, and then blend the hydrogen produced and stored when gas-fired power plants need to be ramped up, typically in hours when electricity prices are high. So, while hydrogen on the global scale will not have a significant share even in 2050, in regions where hydrogen is present as an energy carrier, we foresee hydrogen playing a significant role in gas-fired electricity genera- tion, as well as reducing the need for curtailment of VRES, and thus keeping electricity costs low. In 2020, renewables generated 29% of the electricity, with almost two thirds of this from hydropower. As decarbonization pressure grows and the costs of solar PV, wind generation, and battery storage costs continue to fall, VRES will take an ever-greater share. We expect VRES to overtake fossil-based electricity generation globally by 2035 (Figure 2.3). By 2050, 83% of the world’s grid-connected electricity will be generated from renewa- ble sources, and 69% alone from variable renewables. Reflecting its lowest levelized costs, solar PV’s share in the 2050 power supply will be 38%. A third of this will be utility-scale solar farms with on-site storage (solar + storage), with storage helping the business case for solar. Despite having somewhat higher costs than solar, wind will also have growing shares in all regions, as, unlike solar energy, it does not have a cyclical daily intermittency problem. This ensures a higher income for wind plants on the yearly average and results in continued investments. In 2050, one third of grid-connected electricity supply will be wind-based, with that share split between: 75% onshore wind, 22% bottom-fixed offshore wind, and 3% floating offshore wind. Due to higher and more-reliable wind speeds, and less constraints on hub heights and site locations, offshore wind will show a 13% average annual growth from 2020 to mid-century.
  • 32.
    62 DNV Energy TransitionOutlook 2022 63 Electricity and hydrogen CHAPTER 2 The role of carbon capture and storage (CCS) The role of CCS in the power sector will be limited all the way through to 2050. Globally, only 7% of the coal- and oil-fired power station emissions will be captured by 2050 (Figure 2.4). While we expect coal-fired power emissions to be continuously captured from 2030s, oil-fired emissions will see significant uptake only from 2040. Given the marginal role oil-fired power plants play in the global electricity system in 2050, this is not very significant. Gas-fired power emissions will see an earlier CCS uptake than coal-fired power plants, but the fraction of capture stabilizesbetween5%to6%ofthetotalgas-fired emissions by 2040. The main reason for the capture share staying constant is the higher share of hydrogen blending in regions such as OECD Pacific, Greater China and Europe. In regions such as Middle East and North Africa and North East Eurasia (NEE), where gas-fired generation is dominant the challenge is that the projected carbon prices remain too low to incentivise higher rates of capture. The cost of CO2 avoided ranges from USD 40/tCO2 in NEE and USD 60/tCO2 in Europe in 2050 for coal-fired genera- tion. The difference in the costs is mainly due to the cost of fuel. But NEE carbon price is lower than the cost of CO2 capture, which limits the uptake of CCS in NEE. In fact, most of the costs of avoided CO2 are significantly higher than the carbon prices in most regions, even in 2050. Electricity demand World electricity demand grew 3%/yr from the 1980s until 2020, as both a consequence and cause of economic growth. In 2020, global electricity demand, including off-grid rural demand was 27 PWh/yr. We project demand to grow to 62 PWh/yr by 2050. This is an average annual growth of 2%/yr. In 2050, we expect electricity to make up 36% of the global energy demand. At present, electricity’s share is 19% of final energy demand. Figure 2.5 shows the evolution of the global electricity demand by sector, and this includes off-grid rural demand and off-grid dedicated electrolyser power demand. It is evident that not all demand sectors have the same growth trajectories. Dedicated off-grid electrolyser demand does not exist to any significant degree today. But by 2050, it will comprise of 8% of the electricity demand. Similarly, transport only has a share of 2% at present, which burgeons to 12% by 2050, spurred on by electrification of passenger, and later, commercial transport. Contrastingly, the residential space and water heating and cooking segment had a share of 8% of electricity demand in 2020, which reduces to 5% by 2050. The electrification of cooking stoves, space and water heating lead to increasing electricity demand over the world for this segment and commercial space and water heating as well. But, this rate of absolute demand increase is lower than the growth other segments experience, which reduces their share of total electricity demand. The demand for this segment increases from 2 PWh/yr in 2020 to 3 PWh/yr by 2050. Similarly, space cooling, both in residential and commercial buildings, which only contributes to a combined demand of 1.7 PWh/yr today, will grow four-fold by 2050. An increase in the number of cooling degree days (Chapter 1: Buildings) in the world because of global warming, along with higher penetration of air-conditioners due to increasing prosperity in warmer regions, such as the Indian Subcontinent and South East Asia, are the reasons for this growth. The electricity demand for appliances and lighting in both residential and commercial buildings almost doubles from now to 2050, mostly driven by the increased electrification in currently under-electrified regions such as the Indian Subcontinent and Sub-Saharan Africa. Most electricity in the manufacturing sector is used either as industrial heat or to run machines, motors and appli- ances. Of these two, machines, motors and appliances make up 33% of the total electricity demand, which is the single largest share among all demand segments. By 2050, energy efficiency in this demand segment, and growth in transport sector electricity demand ensures that its relative share reduces to 19%, despite its absolute demand increasing from 8 PWh/yr in 2020 to 12 PWh/yr. Regional variation in electricity demand Not all regions experience the same growth in electricity demand. In 2020, Greater China had the largest share of electricity demand (31%), followed by North America (19%) and Europe (13%). We foresee Greater China remaining the region with the largest electricity demand in 2050, but its share will reduce to 26%. Furthermore, we project the Indian Subcontinent overtaking both North America and Europe and having the second largest electricity demand in 2050, with a regional share of 15% of the global demand. Given that the Indian Subcontinent will remain the most populous region in 2050, and with increasing GDP per capita, it is not surprising that it overtakes North America and Europe in terms of electric- ity demand, given that it has lower electrification rates compared with higher-income regions.
  • 33.
    64 DNV Energy TransitionOutlook 2022 65 Electricity and hydrogen CHAPTER 2 It is instructive to investigate how growth of electricity demand will vary over time in the different regions. Figure 2.6 shows these variations for six selected regions. The growth rate is calculated and presented for each year relative to the previous year. In the short term, we expect the Indian Subcontinent and Sub-Saharan Africa to have the highest growth rates; 7.5% in 2024 and 6% in 2026, respectively. As discussed before, both these regions have low electrification rates in almost all the key demand sectors today, and as such we foresee massive electrification drives in the regions leading to very high demand growth in the short term. Interestingly, while the growth rate of the Indian Subcon- tinent reduces after 2026, Sub-Saharan Africa’s demand growth rate continues to increase into the 2030s and 2040s. Given the potential for economic growth, and the projected population increase, Sub-Saharan Africa will have the highest growth in electricity demand globally. This signifies the enormous potential the region has to invest in renewables, and in electrifying much of its demand segments. Unlike the Indian Subcontinent and Sub-Saharan Africa, North America and Europe have stable and near-constant growth rates of about 2% year on year owing to already high electrification rates, and comparatively low economic growth. On the other hand, the growth of new demand segments such as transport and grid-connected electrolyser demand, ensure that their growth rates do not reach zero, even by mid-century. We foresee Greater China’s very high growth rate (5.3% in 2027) reducing in the 2030s. This is to be expected given the expected stabilization of China’s population and economy and front-loading of vehicle electrification today. By 2050, almost all of China’s vehicle fleet will be EVs, with relatively little electrification in transport in the late 2040s. Furthermore, unlike North America and Europe, Greater China will not prioritize grid-connected electrolysers, which otherwise could be responsible for the later uplift demand. Due to these reasons, we expect electricity demand growth in Greater China to reach zero by mid-century. In the Middle East and North Africa region, we see rapid electrification in buildings, thanks to higher penetration of space cooling spurred on by increasing GDP per capita. This leads to the increasing growth rate of elec- tricity demand in the 2030s. Power demand In this Outlook, peak power demand is the highest electricity demand of each region over a given year on an hourly basis. Peak power demand increases year on year for all regions in our forecast, except for North East Eurasia in the short term. That region’s two major economies are Russia and Ukraine, and due to the Ukraine war, we project a reduc- tion in peak power demand. World total peak power demand was 3.9 TWh/h in 2020, and this increases to 10 TWh/h by 2050, a 3.1%/yr aver- age growth. This average growth is higher than that of the electricity demand growth. This has implications not only for the power generators, but also for the physical transmission and distribution grid in the regions. The grid infrastructure needs to be designed and capable of transporting this peak power at instantaneous speeds from the power generators to consumers, which means strengthening and expansion of the transmission and distribution grids, even in regions which are at 100% electrification today. Figure 2.7 shows how peak power demand and average electricity demand is expected to evolve in selected regions for 2030, 2040 and 2050, relative to each region’s 2020 peak power and average electricity demand. The largest growth in peak power demand is expected in the Indian Subcontinent and South East Asia, due to high rates of electrification in buildings, manufacturing and transport. By comparison, regions such as North America and OECD Pacific have lower rates of growth. In all the regions, the growth in peak power demand is higher than the growth in average electricity demand. We project that as regions consume more and more electricity, their peak power demand will also rise, at a proportion higher than the growth in average electricity demand. World peak power demand was 3.9 TWh/h in 2020, and grows to 10 TWh/h by 2050, a 3.1%/yr average growth.
  • 34.
    66 DNV Energy TransitionOutlook 2022 67 Electricity and hydrogen CHAPTER 2 Modelling power hour by hour Here we illustrate how our model determines the operating hours of power stations with reference to region North America and year 2041. Annual electricity demand by segment comes from the corresponding parts of the model. We expand the year 2041 over 52 weeks. All profiles are aggregated over North America. Over the year, nuclear performs as the baseload with very little variation, while solar increases generation over the non-winter months. This next chart zooms in on week 36. How storage and hydrogen production plants operate is based on price signals. In the middle of the day, when solar resources are plentiful and electricity is cheaper, the grid-connected electrolysis plants operate, and storage is charged. At nighttime, the stored electricity is discharged, while solar+storage plants continue to supply. At each hour, the model establishes demand and supply curves, as shown below, demonstrating supply and demand at each possible price. The point at which supply, and demand curves intersect indicates the realized supply, demand, and price.
  • 35.
    68 DNV Energy TransitionOutlook 2022 69 Electricity and hydrogen CHAPTER 2 2.2 GRIDS Physical infrastructure More grid connections will be needed as the global grid-connected electricity demand will grow by 2.7%/yr from 2020 to 2050. As Figure 2.8 shows, world transmis- sion lines will increase from just over 6 million circuit-kilo- metres in 2020 to almost 18.5 million by 2050. The fastest progress will occur in regions with relatively weaker infrastructure: the Indian Subcontinent, Sub-Saharan Africa, and South East Asia. In terms of volume, the Indian Subcontinent and Greater China will be the regions with the longest new lines, with 40% of all new transmission lines installed in these two regions. Although it could be argued that distributed renewables remove the need for centralized electricity systems, our modelling highlights that transmission infrastructure does not become obsolete in transitioning to a more-decentralized grid despite a shift towards distribution lines, as power plants become smaller. Modern societies require the highest reliability level from their electrical infrastructure, and this can be provided by a greater number of more-widely distributed elements connected via a strong backbone. Furthermore, while the electricity demand grows 2.7%/yr, peak power demand grows at a slightly higher rate of 3.1%/yr, which has a direct impact on the growth of physical grid infrastruc- ture, which needs to be able to handle the high power and ensuing congestion. This is another reason why the transmission grid will expand more rapidly than the rate of the electricity demand growth. A development we project is the more widespread use of high-voltage direct current (HVDC) lines in the transmis- sion grid in the future. HVDC lines make up only 1% of the transmission grid in terms of circuit-kilometres at present. This will increase to 5% by 2050. But, in terms of power capacity, they will have a share of 20% in the transmission grid, by 2050. Distribution lines will almost triple from 2020 to 2050, reaching about 230 million circuit-kilometres globally, from 80 million circuit-kilometres. As the percentage of VRES grows significantly, integration of renewables and grid modernization will have to work hand-in-hand to achieve the reliable grids needed for modern societies and successful economies. Modernization of the grid will involve: reinforcement or upgrade of transmission and distribution systems, investments in international interconnections, implementing decentralized energy data and information processes, installing advanced grid features (smart meters, sensors, remote controls), changing processes and business models, establishing more flexible energy markets, undergoing regulatory review, and modernizing system operations. Investment in transmission and distribution infrastructure Although total grid investments were at around USD 270bn/yr in 2020, post-COVID recovery and expansion of renewable power will ensure a steady increase in grid investments, reaching levels of USD 500bn/yr in the 2030s, and growing up to USD 1trn/yr by 2050. The continued growth in grid investments shown in Figure 2.9 is driven by actions from grid operators accelerating renewables integration, grid modernization to improve resilience and reliability, and digital transformation. Grid investments are typically reflected to consumers over years. World transmission lines will increase from just over 6 million circuit-kilometres in 2020 to almost 18.5 million by 2050. As global power grids steadily expand, the annualized depreciation cost of past investments is higher than the investment expenditures (Figure 2.9). We estimate global transmission and distribution depreciation costs to be about USD 700bn/yr. The operating expenditures (OPEX) add another USD 310bn to the bill, bringing the total expenditures (TOTEX) to USD 1trn in 2020. This rises to about 3trn by 2050. The total cost of grid operators includes additional costs, such as tax, levies, dividends, profits, and interest rates. These make up about 30% of the total costs of the grid operators. Investments are not only for grid expansion; some 15% of grid investment today goes into digital infrastructure, to address the complexity of a more decentralized power system and to support decision making in asset manage- ment and operations. Investments in digital tools will A great deal of attention, investment, and policy is rightly focused on clean energy generation and decarbonization ofindustry.Buttheroleofpowergridsissometimes under-appreciated and misunderstood, which could ultimately contribute to the failure of an expedient energy transition — one fast enough to support the goals of the Paris Agreement. Future Proofing our Power Grids: Making mass electrification possible is part of DNV’s Industry Insights series. It is based on research with over 400 industry leaders involved in the transmission and distribution sector as well as nine in-depth interviews with senior figures from Ofgem, The World Bank, Alliander, E.ON, Enel, Eurelectric, Stratkraft, Siemens, and Strategen. The report explores power grids' readi- ness to support the demands of the energy transition and highlights challenges involved in transforming the grid to suit a new energy mix, as the sector embarks on fundamental, structural change to revolutionize a system — rapidly — that must keep functioning, reliably, all day, every day.
  • 36.
    70 DNV Energy TransitionOutlook 2022 71 Electricity and hydrogen CHAPTER 2 Flexibility With a 16-fold increase in global VRES capacity over the next 30 years the need for flexibility will increase between two- and four-fold across the world regions. Figure 2.10 shows how VRES, especially PV panels, will create substantially more variability in the future power system. This will not only require more storage, but the increased need for flexibility will also influence thermal generation technologies, where existing plants will increasingly operate alongside renewables and hence the premium on the flexibility of the thermal sources will increase. Flexibility in this context means shorter start-up times and higher ramp rates. Thermal sources are not uniformly conducive to these objectives — ranging from nuclear where flexibility is difficult, followed by coal, gas (particularly open cycle gas turbines) to oil-fired plants which offer most flexibility, but are costly. Equally impor- tant will be the ability of thermal plants to run economi- cally at predominantly low load factors when the bulk of power is provided cheaply by VRES. Adapting for flexibility requires both physical changes, for example retrofitting certain components, but also investment in automation and analytics. Better prediction of renewable-power generation levels and demand response will assist with reacting to excess renewables and shifting electricity usage from peak periods to times of lower demand. In addition, new market designs will be needed that incentivise the flexible operation of thermal plants, and which create room for new contract structures, grid code changes and new standards (IRENA, 2019b). From a system perspective, implementation of smart grid features (such as smart meters, IoT sensors, remote control, and advanced automation) will enable better management of energy flows. There is also a rising 'prosumer' phenomenon: new technologies and market mechanisms will allow ever more consumers to provide flexibility in the form of demand response, vehicle-to-grid (V2G) and behind-the-meter storage. It is worth outlining the scale of the contribution that EVs will make in power storage. Clearly, the rapid decline of Li-ion battery prices is mainly driven by the increasing number of EVs. Moreover, smart meters, smart grids, and regulatory changes will incentivize car owners to use V2G 2.3 STORAGE AND FLEXIBILITY expand to enable collection of data and information from the grid and feed these to core processes. These tools include: advanced analytical algorithms enhanced with machine learning to translate data from various sources into validated information about market processes, asset conditions, and decision-support functions; IT infrastruc- ture to store and manage data for authorization and data quality; standardized and secure data-communication infrastructure to transfer market and field data, enabling connectivity and interoperability; and sensor arrays, collecting asset data to be utilized by a digitally enabled workforce. This digital ecosystem enables the operation of equipment closer to physical limits, and for optimizing maintenance and replacement plans, as well as integrating distributed energy resources. By allocating total cost of grid operators to the total electricity consumption, the grid charges in the end users’ electricity bills can be estimated. The world average for the unit grid charges has been around USD 60/MWh for the last two decades; we forecast this number to be stable in the USD 63-70/MWh band in the future. Regionally, the picture will vary. In Europe and North America, where strong renewable growth is not accompanied by equally strong growth in electricity demand, unit grid charges will rise and constitute a larger portion of the electricity bill. In Europe, grid charges will rise from about USD 75/MWh in 2020 to USD 90/MWh by 2050, while in North America it will reach USD 75/MWh by 2050. In both these regions, grid charges constitute about 25% of the residential electricity price at present and will increase its share to about 40% by 2050. FIGURE 2.10
  • 37.
    72 DNV Energy TransitionOutlook 2022 73 Electricity and hydrogen CHAPTER 2 solutions. EV-charging systems can provide the grid with 10% of all EV storage capacity. From 2040 onwards, the impact of V2G systems worldwide will be almost as large as that of dedicated Li-ion batteries (or more advanced chemistries) and pumped hydro, reaching 220 TWh/yr globally by mid-century. Converting VRES to other energy carriers, such as hydro- gen, is yet another option that will provide flexibility. Invest- ment in physical transmission systems, and in the links between generation and load centres, will also contribute towards better utilization of renewable power supply. Storage Storage in today’s power system is mostly in the form of pumped hydro (Figure 2.11). Limited by geography, pumped hydro is a mature technology, and will only provide marginal increase in the dramatic added require- ment to power storage over the next three decades. Li-ion is today’s dominant battery chemistry for utili- ty-scale storage, EVs, and information and communica- tion technologies. Approximately 95% of storage projects in which DNV is currently involved through feasibility assessment, development, and construction, are Li-ion. Costs have long been declining strongly, but supply-chain shortages, amplified during and after the pandemic, has seen battery costs increase. At cell level, the ‘threshold’ of USD 100/kWh will be delayed by a year, also creating a one-year-delay in reaching 50% new passenger vehicle market share for the battery-electric vehicles. This will partly be offset through innovation and adjustments at both cell- and pack-level and through manufacturing efficiencies as scale builds. Towards the end of this decade, solid state batteries appear to offer the best potential for a next wave in performance and cost improvements (DNV, 2018b and Haouche et al., 2022). Over the longer term, prices for batteries will continue to plunge in line with a cost-learning rate of 19%, with more than 80% cost reduction between now and 2050. Ongoing improvements in the cost, energy density, weight, and volume of electric batteries will enable wider use of battery-storage systems. New battery chemistries, will have to compete with existing Li-ion energy density, manufacturing infrastructure, and costs. If significantly cheaper batteries, based on Earth-abundant materials, emerge, that could lead to cost reductions affecting the speed at which batteries are deployed to meet energy- storage challenges in power production and transport. However, while new discoveries may lead to some step changes in cost, we don’t foresee the cost trajectory of batteries deviating too far from the long-term 19% learning rate. Furthermore, there are limiting factors on the total market for batteries, such as the total demand for electricity or road vehicles, which will eventually limit the growth of battery deployment in a self-regulating manner as the market saturates. Where there are larger markets for utility-scale battery storage (e.g. China, South Korea, Japan, the US), a shift in the charge/discharge duration required from projects is already seen. As storage capacity exceeds 0.5% of grid capacity, the trend is for business models to shift from frequency-response management as a primary applica- tion, often requiring one-hour duration or less, to price arbitrage or, in some markets, capacity provision. Average storage duration therefore extends from two to four hours. As this trend for longer-duration batteries continues, alternative chemistries and technologies with 8-24 hours storage will have increasing value: e.g. flow batteries, zinc-based chemistries, compressed air, liquid air, liquid CO2 , or gravity-based storage technologies. These alternative, long-duration storage solutions look set to enter the market at scale in the second half of the 2030s. Seasonal storage Seasonal storage involves the storage of energy to accommodate yearly cycles in electricity demand and generation. In a sense, it moves electricity from the months in the year when electricity output is high to the times where electricity demand is high. The need for seasonal storage will become more apparent as the future electric- ity system becomes increasingly seasonal in terms of both supply and demand. From a load perspective for example, as space heating electrifies, the electricity demand of regions with a cold winter will become more seasonal. On the supply side, VRES, and especially solar, will create a pronounced imbalance in summer and winter electrical output in countries in higher latitudes. The factors determining whether a technology is suitable for seasonal storage are storage losses, cost of storage, and roundtrip efficiency. Only chemical energy, i.e. energy stored in molecules, is capable of delivering low-loss, high-efficiency and low-cost storage in large quantities. Among chemical storage technologies, storing compressed hydrogen in salt caverns or depleted hydro- carbon fields, appears to offer a low-cost viable solution. Figure 2.12 shows our forecast for global underground gas storage capacity in salt caverns and depleted oil and gas fields, based on an analysis of weekly production and consumption patterns of natural gas and hydrogen, and the likely need for storage to ensure enough supply is available when it is needed — not only for reconversion for electricity but also for other uses like heating or transport. As the demand for gas for space heating starts to decline, especially in high-latitude regions of Europe and North America, the global need for seasonal natural gas storage will peak within five year. In contrast, by 2050, about 70 billion m³ of hydrogen storage will be developed, about 40% of which will be repurposed methane storage sites. In a 2020 position paper titled: The Promise of Seasonal Storage, (DNV, 2020b), DNV investigated the need for seasonal storage, the promising technologies that can be used, and how short and medium storage interacts with seasonal storage. Using the Netherlands as a case study, the paper highlights that it is not easy to distinguish between adequacy capacity and seasonal storage due to the variability in demand and VRES generation between years. The paper also highlights that seasonal storage will only work if all relevant players in the supply chain invest in power-to-gas, physical storage, and power generation. Co-locating hydrogen production and storage may help to ensure that investments in key stages go hand in hand. An example of an integrated generation-storage project is the Advanced Clean Energy Storage I project in Utah, the world’s largest to date, combining 220 MW of alkaline electrolysis-based green hydrogen production with salt cavern storage for grid scale energy conversion. The projectwasrecentlyawardedaUSD500mnloanguarantee fromtheUSDepartmentofEnergy(Fischer,2022).
  • 38.
    74 DNV Energy TransitionOutlook 2022 75 Electricity and hydrogen CHAPTER 2 Transport Maritime: Hydrogen will be critical for the decarboniza- tion of international shipping. With electrification limited to shore power when berthing as well as the short-sea shipping segment, hydrogen-based fuels like ammonia and e-fuels, are likely to make up the bulk of zero-emis- sion fuels for shipping by 2050. Our forecast of the most likely hydrogen future to 2050 includes e-methanol uptake in shipping of 360 PJ (2% of shipping fuel mix) in 2030, 1400 PJ (10%) in 2040 and 1800 PJ (14%) in 2050. Similar to e-methanol, ammonia can use large parts of the existing infrastructure, but has the same challenges with significantly higher production costs than the present alternatives. If produced from renewable energy, the conversion losses are significant, and we would need a massive ramp-up of renewable power. Capturing CO2 from natural gas during ammonia production is, however, relativelysimple,andthedominantshareofammoniabeing usedinshippingintheforecastwilllikelybeblueammonia. Use of ammonia by ships has toxicity risks, but we believe this will be solved and that there will be large-scale transport taking place from cheap producing regions to the global bunkering hubs. Ammonia will likely have a lower initial uptake than e-methanol until 2040, but then scale faster towards the end of the forecast period. Our hydrogen forecast projects ammonia uptake in shipping of 43 PJ (0.3% of shipping fuel mix) in 2030, 1100 PJ (8%) in 2040 and 4500 PJ (35%) in 2050. Aviation: Hydrogen, either in its pure form, or in derived e-fuel form will only start to scale for aviation in the 2030s for reasons of cost and availability. A wider use of e-fuels is achievable only with an immense scale-up of renewa- ble power production, and the current cost difference of a factor of four to five, compared with fossil kerosene, needs to be reduced. We will see three times more e-fuels than pure hydrogen in the aviation subsector, representing a 13% share, mainly due to the fact that e-fuels as a type of drop-in fuel can serve all types of flights. Hydrogen by contrast is limited to mainly medium- haul flights owing its low energy density, and the hydrogen tanks needed for the large amount of hydrogen would require a very different airplane design with higher costs per passenger. In combination, the share of pure hydro- gen and hydrogen-based e-fuel represents around 17% of energy use in aviation by 2050. 2.4 HYDROGEN Renewable and low-carbon hydrogen is crucial for decarbonizing hard-to-abate sectors and meeting Paris Agreement goals. To achieve Paris targets, hydrogen would need to meet around 15% of world energy demand by mid-century. We forecast that global hydrogen uptake is very low and late relative to Paris Agreement require- ments — reaching 0.5% of global final energy mix in 2030 and 5% in 2050, although the share of hydrogen in the energy mix of some world regions will be double these percentages. Even at 5% of global energy demand, developments in hydrogen over the next 30 years will be substantial, and in some cases, industry changing. Global spend on produc- ing hydrogen for energy purposes from now until 2050 will be USD 6.8trn, with an additional USD 180bn spent on hydrogen pipelines and USD 530bn on building and operating ammonia terminals. Hydrogen demand Demand for hydrogen as an energy carrier will rocket upwards from negligible levels today to well over 250 MtH2 per year by 2050 — with demand climbing steeply by then (Figure 2.13). The bulk of hydrogen end use will be for manufacturing (61%), followed by transport (17%) and buildings (14%), with the remainder going to electricity generation and other uses. Editor’s note: This section on hydrogen is summarized from our companion report: Hydrogen Forecast to 2050, published June 2022 (eto.com/hydrogenforecast2050). The report contains much more detail on, inter alia, policy driving the rise of hydrogen ecosystems, developments in approaches to safety, technical aspects of production, storage and transport of hydrogen, expected developments in the regional and international trade of hydrogen and its derivatives, and a comparison of various hydrogen value chains.
  • 39.
    76 DNV Energy TransitionOutlook 2022 77 Electricity and hydrogen CHAPTER 2 Road transport: Fuel cell electric vehicle (FCEV) propul- sion is much less efficient, more complicated, and thus more costly, than that of battery electric vehicles (BEVs). For these reasons, major vehicle manufacturers are focusing almost exclusively on BEV models for passenger transport which will lead to a global share for BEVs of 85% of new car sales in 2050, versus only 0.01% FCEVs. Regarding light commercial vehicles, the shares will be 64% and 4%, respectively in 2050. Hydrogen was long seen as the only solution to decar- bonize heavy trucking, but as things now stand, battery-electric solutions are likely to have a decent share in this segment. As a result, we project hydrogen to play only a minor role in road transport, namely for heavy-duty long-distance trucking. By mid-century, hydrogen will account for a 2.5% share of road transport energy demand, slightly less then biomass and natural gas. Accounting for the fact that hydrogen will be used in heavy-duty and long-distance trucking where fuel consumption is naturally higher, this still amounts to about 2,000 PJ in 2050 (16.7 MtH2 /yr). Half of this will be consumed in Greater China alone, owing to the large vehicle fleet and policy focus on decarbonized transport, followed by Europe and North America each having a 15% share and OECD Pacific with a 9% share. Manufacturing Hydrogen can be used instead of fossil fuels to generate high-temperature heat. However, at present, negligible quantities of hydrogen are used for industrial high-heat processes. This is because hydrogen remains an expen- sive alternative fuel, uncompetitive against conventional fossil-fuelled technologies, and losing out to bioenergy in most contexts even under higher carbon prices. Nevertheless, low-carbon hydrogen is expected to play an important role in the manufacturing sector by 2050 in front-runner regions, such as Greater China and Europe. In our forecast, demand for hydrogen as an energy carrier in manufacturing is set to grow gradually up to nearly 10.1 EJ/yr (~84 MtH2 /yr) by 2050, amounting to around 7% of total manufacturing energy demand, and around 33 % of global demand for hydrogen as energy carrier. In terms of direct use of hydrogen (as opposed to blended hydrogen or hydrogen derivatives), manufactur- ing will dominate usage with an over 90% share until 2030 and over 65% share in 2050. The largest share of hydro- gen demand in manufacturing (2.8 EJ/yr or 28% of total) comes from the iron and steel industry. This is in addition to the non-energy demand of hydrogen used for direct reduction of iron at 1.6 EJ/yr (~13.5 MtH2 /yr). Buildings In our analysis, we project an uptake of 1.9 EJ/yr (~15.8 MtH2 /yr) of hydrogen in buildings by 2050, constituting a mere 1.3% of the total energy demand in the buildings sector. The largest shares of the demand will come from space and water heating (36 and 38%, respectively), as shown in Figure 2.17. We expect hydrogen to have a slightly higher share of total demand (about 3-4%) in space and water heating than in the building sector as a whole. However, the share of hydrogen is still minuscule compared with the share of natural gas which accounts for over a third of buildings heating demand by 2050. The limited projected uptake of hydrogen in buildings is explained by comparative efficiency, costs, safety, and infrastructure availability in relation to competing technologies, mainly electric heat pumps and district heating. Use of hydrogen in buildings will be concentrated in four regions with existing natural gas infrastructures and with access to relatively more affordable hydrogen — North America, Europe, Greater China and OECD Pacific. Power and seasonal storage In areas and regions with significant penetration of VRES, the use of hydrogen for peak balancing and long-term storage of 'surplus' electricity has advantages, but it does come with significant energy losses and storage demands. In the merit order of hydrogen applications, re-electrifica- tion is likely to come last. However, we will see hydrogen being used in power stations from 2030 onwards, though in very small amounts and at first mainly due to feeding hydrogen into natural-gas grids. Later, peak-balancing increases the share. OECD Pacific will be the frontrunner in this development, followed by Europe and Greater China. The same regions will increasingly use hydrogen for electricity generation, and a small amount will be used in North America from the mid-2040s. By mid-century, we foresee that those regions will use almost 8 Mt hydrogen per year in power generation. Hydrogen as feedstock Currently, two major needs for feedstock hydrogen are for oil refineries, and for producing ammonia for fertilizers. Our forecast shows that while in absolute quantities the demand for hydrogen in these segments sees a slight decrease, there will be a burgeoning need for derivatives to be used for energy purposes. In fact, by 2050, the hydrogen demand for producing e-fuels and ammonia fuel will be more than that of the combined demand for hydrogen for oil refineries and fertilizer production. By 2050, CO2 —intensive production routes for feedstock hydrogen, such as methane reforming and coal gasifica- tion will lose their dominant positions, replaced by methane reforming coupled with CCS, grid-connected electrolysis and electrolysis coupled to dedicated renewables. Hydrogen supply The future hydrogen supply mix will be shaped by two related trends: firstly, the use of hydrogen as an energy carrier will increase, and secondly, there will be a gradual replacement of existing production capacity with lower-emission alternatives. As the main motivation for hydrogen use in energy systems is to decarbonize sectors that cannot be electrified, only low-carbon production routes are future contenders. In 2030, we forecast that a third of global supply will be low-carbon and renewable, with fossil fuels with CCS taking a 14% share of the global total and hydrogen from electrolysis 18%. In 2050, 85% of world’s hydrogen supply will be
  • 40.
    78 DNV Energy TransitionOutlook 2022 79 Electricity and hydrogen CHAPTER 2 from low-carbon routes, broken down as follows: 27.5% from fossils with CCS, 25.5% from grid-connected electrolysis, 17.5% from dedicated solar-based electroly- sis, 13% from dedicated wind-based electrolysis and 1% from dedicated nuclear-based electrolysis. Blue hydrogen: Cost and the speed of build-up are the main factors determining the shares of production routes in the supply mix. Currently, the cheapest low-carbon hydrogen production route, on average, is methane reforming with CCS, commonly referred to as blue hydrogen, with an average cost just below USD 3/kgH2 in 2020. This global weighted average is more representa- tive of regions like North America and North East Eurasia with access to cheap natural gas, and does not reflect the increase in the gas prices since 2020, which has raised prices for blue hydrogen from 2020 to 2022 by 20-30% in gas producing regions, and 60-400% in gas importing regions. Although we foresee gas prices falling from the current high levels by 2030s, there are additional challenges for blue hydrogen. CCS is still a developing technology and concerns about long-term storage sites, uncertainties on future costs, and only marginal benefits from economies of scale are limiting the speed of deployment. Moreover, CO2 capture rates beyond 90% will remain uneconomi- cal, and will result in a weaker support for blue hydrogen compared with other low-carbon, renewable alternatives. Nonetheless, with the continued reduction in CAPEX for methane reforming (particularly ATR technology) and carbon capture, and with reducing risk premiums for hydrogen investments, and increasing carbon prices, blue hydrogen will gain significant market share, espe- cially in ammonia and methanol production. The cost of carbon capture for ammonia production is lower than the cost of carbon capture for merchant hydrogen. Of the 78 MtH2 /yr produced globally from methane reforming with CCS in 2050 (which will constitute 24% of the global hydrogen supply), 68 MtH2 /yr will be captive hydrogen — produced in the same facility in which it is consumed in ammonia and methanol production or in refineries or in the direct reduction of iron. Green hydrogen: The cost of dedicated renewables- based electrolysis is presently prohibitively expensive, with a global weighted average of USD 5/kgH2 in 2020. But, in the decade to 2030, we will see a sharp reduction in the cost of electrolysis with dedicated solar or wind capacity reducing on average towards USD 2/kgH2 . The main driver of this trend will be a 40% reduction in solar panel costs and a 27% reduction in turbine costs. With continued improvements in turbine sizes and solar panel technologies, the annual operating hours will simultaneously increase by 10-30%, varying between technologies and regions. Moreover, the cost of capital for electrolysers of any kind will see 25-30% reduction as the perceived financial risk keeps coming down. For grid-connected electrolysers, the largest cost component is the cost of electricity, specifically, the availability of cheap electricity. In the longer term, the share of variable renewable energy sources (VRES) in power systems will be the main factor in determining the future electricity price distribution; more VRES means more hours with very cheap (or even free) electricity. However, before 2030, the penetration of VRES in the power systems will not be sufficient to exert large impacts on the electricity price distribution. Hence, any reduction we see in the cost of grid- connected electrolysers in the remaining years of this decade is due to a decline in CAPEX along with any support governments provide. Towards 2050, we will see two main trends that affect annual operating hours: increased competition from alternative hydrogen production routes and more hours with cheap electricity. With increased VRES in the system, the number of hours where hydrogen from electricity will be cheaper than blue hydrogen increase towards 2050. As a result, grid-connected green hydrogen accounts for a very similar share of the total market as blue hydrogen. HydrogenPro taking delivery of the world's largest electrolyser at its test facilities in Herøya, Norway. Image courtesy HydrogenPro, September 2022.
  • 41.
    80 DNV Energy TransitionOutlook 2022 81 Electricity and hydrogen CHAPTER 2 Hydrogen transport Hydrogen will be transported by pipelines up to medium distances within and between countries, but almost never between continents. Ammonia is safer and more convenient to transport, e.g. by ship, and 59% of energy- related ammonia will be traded between regions by 2050. Cost considerations will lead to more than 50% of hydrogen pipelines globally being repurposed from natural gas pipelines, rising to as high as 80% in some regions, as the cost to repurpose pipelines is expected to be just 10-35% of new construction costs. The transport of pure hydrogen between regions will be relatively marginal. Pipeline transport is most economical if transported volumes are high, and at medium distances. Shorter distances and smaller volumes call for trucking and rail — in tanks, usually as ammonia. For longer distances seaborne transport is the logical alternative where depths and/or distances make pipeline transport uncompetitive. However, that requires energy- intensive and costly liquefaction at the exporting end, and a similarly costly regasification at import locations, together adding USD 1.5-2/kgH2 to costs. Less than 2% of global hydrogen will have spent time on keel in 2050, and only about 4% will come through interregional pipelines. Ammonia is likely to be the zero-emission fuel of choice for international shipping, the present analysis assumes that all seaborne hydrogen transport is liquid ammonia. We expect a twenty-fold increase in ammonia seaborne transport from 2030 to 2050, with fuel use growing from virtually nothing in the mid-2030s to 95% of the trade in 2050 — of a total shipment of 150 million tonnes at that time. Further details on hydrogen storage and transport can be found in our Hydrogen Forecast to 2050 (DNV, 2022a). Cost considerations will lead to more than 50% of hydrogen pipelines globally being repurposed from natural gas pipelines, rising to as high as 80% in some regions. We define direct heat as the thermal energy produced by power stations for selling to a third party, e.g. district heating, or by industries for their own activities. In practice, such heat is always delivered as hot water or steam. Direct heat has the major benefit of economies of scale by providing heat to whole neighbourhoods or cities from one facility, making it the obvious choice of heating for households that has the pipeline distribution lines brining the heat. Space and water heating in residential, commercial, and public buildings currently uses 42% of the direct heat globally, only surpassed by manufacturing with 43%. North East Eurasia and Greater China both have 40% share in global direct heat demand. Other major consumer is Europe with 15%, led by Germany. In 2020, coal and gas provided 45% and 44%, respectively, of global direct heat supply. More than two thirds of this came from combined heat and power (CHP) plants. We forecast a plateauing in the use of direct heat demand due to thermal power losing ground to variable renewable power supply. Direct heat energy demand will increase marginally from around 15 EJ/year in 2020 to just below 16 EJ/year by 2030, and remain at that level until mid-century. Generating heat centrally is an advantage for countries aiming to decarbonize their heat supplies. Instead of replacing many individual boilers, moving to lower- emission alternatives can be achieved by replacing one central power station. By 2030, coal will be replaced by bioenergy technologies, which mostly use municipal and industrial waste as fuel, and natural gas-fired technologies, bringing the share of coal in direct heat demand down to 36%. In 2050, bioenergy will provide 23% of direct heat, while coal’s share will have shrunk to 9%. The share of natural gas will increase to 67%. 2.5 DIRECT HEAT
  • 42.
    82 DNV Energy TransitionOutlook 2022 83 Renewable energy CHAPTER 3 3 RENEWABLE ENERGY Highlights This chapter covers current developments in and forecast growth of solar PV, wind energy, hydropower, bioenergy and nuclear energy. All of these sources are set to grow, but at very different rates. For the first time, our forecast finds that non-fossil sources will edge slightly beyond a 50% share of primary energy by 2050. Solar PV will see a 22-fold growth over our forecast period, spurred by the highest technology cost-learning rate among renewable sources. This chapter expands on the growing trend to couple solar PV with storage. Within a decade, about one fifth of all PV installed will be with dedicated storage, and by mid-century this share will have risen to half. Wind energy will expand 9-fold, (onshore 7-fold and offshore 26-fold). We describe developments that will improve capacity factors for both onshore and offshore wind. Hydropower will remain important, supplying 13% of electricity in 2050, and we find that the renewed interest in nuclear energy over the last year will see an uptick (13%) in its output by mid-century, although in relative terms, its share of the power mix declines. 3.1 Solar85 3.2 Wind91 3.3 Hydropower95 3.4 Nuclear Power97 3.5 Bioenergy99 3.6 Other renewables103
  • 43.
    84 DNV Energy TransitionOutlook 2022 85 Renewable energy CHAPTER 3 Solar panels on earth-orbiting satellites generated some of the first-ever electricity produced by solar photovoltaic (PV) means. The cost of such power was at that time prohibitive for general use of solar PV for supplying electricity to the public. Solar PV costs have since declined spectacularly, the technology’s efficiency has increased, and the scale and forms in which it is imple- mented have diversified. Solar PV today comes as household installations meas- ured in kW; commercial-industrial scale (MW scale) installations on industrial rooftops and car ports, to reduce corporate energy bills; and multi-gigawatt, utility-scale solar farms usually on remote, unproductive land. Utility-scale production dominates and will continue to do so because smaller installations cannot compete on energy cost. Small installations, however, offer flexibility and local security of supply. These advan- tages will ensure that rooftop and micro-grid-sized installations will grow significantly in absolute terms, though their market share will decline (DNV, 2019). Cost developments The global weighted average levelized cost of energy (LCOE) for solar PV is currently around USD 50/MWh for solar and USD 120/MWh for solar+storage. In the case of solar PV, we expect it to break the USD 50/MWh barrier and reduce to around USD 30/MWh by mid-century (Figure 3.2), with individual project costs well below USD 20/MWh. The main driver for this reduction in LCOE is the reduction of unit investments costs, which are around USD 900/kW as a global average now. This will fall significantly with every doubling of solar PV installation globally, reaching USD 650/kW in 2050. The panel cost-learning rate for solar PV will remain high throughout our forecast period. It is currently 26%, and while that rate will decline to 17% in 2050, solar PV will be in unassailable position as the cheapest source of new electricity globally, except in unfavourable areas such as in high northern latitudes. The OPEX-learning rate of 9% is expected to remain unchanged until mid-century, as enhanced data monitoring, remote inspections and predictive maintenance continue to drive down operating costs. The panel cost-learning rate for solar PV will remain high throughout our forecast period. It is currently 26%, and while that rate will decline to 17% in 2050, solar PV will be in unassailable position as the cheapest source of new electricity globally. 3 RENEWABLE ENERGY 3.1 SOLAR By contrast, VRES growth is non-linear to 2050 — solar capacity increases 22-fold, wind capacity: 9-fold. Onshore wind: 7-fold, offshore wind: 56-fold. Driving this are both plunging costs and a growing realization that VRES offer the cheapest and quickest route to both decarbonization and energy security. In a world seeing doubling of electricity generation by 2050, hydropower generation will still provide 13% of total electricity supply, down from 16% in 2020. While growing in absolute terms, this loss of share is trans- ferred to solar and wind. Waste management and high construction costs and long lead times remain stubborn realities for nuclear power. However, current energy security concerns are leading to renewed interest in this source, and our forecast this year reflects a modest uptick in nuclear, growing by 13% from today’s levels to 2050. VRES offer the cheapest and quickest route to both decarbonization and energy security. This chapter covers the non-linear rise of renewable energy sources. Coal and gas decline to 4% and 8%, respectively of the power mix by 2050, when they are largely confined to providing flexibility and backup in a power system 70% reliant on variable renewable energy sources (VRES).
  • 44.
    86 DNV Energy TransitionOutlook 2022 87 Renewable energy CHAPTER 3 The levelized cost of solar+storage is currently more than double that of solar PV without storage. A continuous decline in battery prices will narrow this gap to around 50% by mid-century. Despite its higher costs, solar+storage has an advantage over solar PV on capture price (Figure 3.2). Plants with storage can charge their batteries when sunlight is plentiful during the day and sell the stored electricity when the price is high. By 2038, the capture price advantage of solar+storage over regular solar PV plants will surpass the cost disadvantage on a globally averaged basis. PV is intermittent: it will only produce electricity during daylight, and mostly during sunny conditions. To work around this, a host of flexibility options are being devel- oped. These include: — energy storage, such as pumped hydro, bespoke power batteries, and grid-linked EVs — connectivity, distributing power through a reinforced power grid with extensive connections that can be used both ways depending on production and demand — demand-response solutions that shift demand to periods of higher production and lower cost; for example, making industrial hydrogen by solar-powered electrolysis during peak power generation. While flexibility solutions will improve over time, they will have to cope with a rapidly rising share of variable renewables in the power mix. Variability will therefore always be a challenge, and LCOE should not be the sole indicator of solar PV’s competitive position. In our ETO model, we allow for various generation technologies to receive different power prices; hence, levelized profita- bility accounting for both price and costs is more relevant than only levelized costs. We find that solar PV remains the technology with the lowest average capture prices due to its variability. These low prices will vary between regions, influenced by the regional solar PV share, the competing power mix, and the affordability of flexibility options. Lower capture prices will not, however, be a showstopper for the strong growth of PV generation. Increasingly, as discussed above, PV and storage systems are designed as a ‘package’ that can produce energy on demand, just like hydropower, nuclear, or combustion power plants. Forecast The growth of solar PV has been remarkable: 1 GW per year was installed for the first time in 2004, 10 GW added in 2010, and 100 GW in 2019. In 2021, 150 GW was added despite disruptions in global production and supply of solar panels and related equipment due to COVID-19 and the looming threat of war in North East Eurasia. We predict global annual installations will continue to rise, reaching about 550 GW per year of net capacity additions by 2040 (Figure 3.3). Within a decade, about one fifth of all PV installed will be with dedicated storage, and by mid-century this share will have risen to half. By mid-century, total installed capacity will be 9.5 TW for solar PV and 5 TW for solar+storage. The resulting 14.5 TW of solar capacity is 24 times greater than in 2020. In Figure 3.4, we can observe the rise of solar capacity as a share of total installed capacity. While the share of other types of power plants remains more or less constant, solar capacity rises globally while fossil capacity reduces. In 2050, more than half of all installed capacity globally will be solar. While solar will have a share of 54% of installed capacity in mid-century, it will account for 30% of global on-grid electricity generation (Figure 3.5). This is due to the lower capacity factors of solar power stations compared with other VRES such as wind and hydropower. Never- theless, 23 PWh per year of solar electricity will be generated globally in 2050. Regional variations Figure 3.6 presents the solar electricity generated by each region. In 2020, Greater China was the largest producer of solar electricity, with a regional share of 30%, closely followed by North America at 20%. But by 2050, Greater China’s regional solar dominance will reduce slightly, while the Indian Subcontinent catches up, with a share of 25% by 2050. As in 2020, we expect North East Eurasia to have the lowest regional share in 2050, a paltry 2%. In addition to total solar generation, it is instructive to observe the relative importance of solar electricity in total electricity generation for different regions. Figure 3.7 presents the evolution of the share of solar electricity in the power generation mixes of five selected regions,
  • 45.
    88 DNV Energy TransitionOutlook 2022 89 Renewable energy CHAPTER 3 all of which are expected to see such shares increase between 2020 and 2050. But there are some key differ- ences when it comes to when solar will overtake fossil- fuel generation or other VRES and nuclear. For example, other VRES and nuclear are expected to increase their shares in Europe. But climate change concerns, power sector decarbonization, and policies favourable to solar mean that European solar overtakes fossil-fuel generation well before 2040. On the other hand, we expect solar electricity to gener- ate more than half the total electricity in Middle East and North Africa in 2050. This is due to the prevalence of favourable conditions such as high solar irradiation, and relatively less availability of other VRES, such as wind in the region. But high availability of domestic oil and gas resources results in solar electricity overtaking fossil electricity only after 2040. Solar electricity generation in the Indian Subcontinent will have a share of 52% in 2050, the highest among all regions. To achieve this, the region will have about 3 TW of solar capacity connected to the grid (Figure 3.8). This will be second to 4.5 TW installed in Greater China, which will have 30% of all the solar capacity installed in 2050. Off-grid solar capacity In addition to the grid-connected solar, we expect off-grid solar to be installed for hydrogen production through electrolysis and to supply off-grid and mostly rural demand, particularly in Sub-Saharan Africa and the Indian Subcontinent. By 2050, a little more than 1 TW capacity of solar PV will exist exclusively producing hydrogen, the majority of which will be in Greater China and the Indian Subcontinent (Figure 3.9). About 260 GW of off-grid solar capacity will be installed to provide electricity in hard-to-reach districts of Sub-Saharan Africa and the Indian Subcontinent. Sensitivities Solar PV mainly competes with wind and other renewables in power generation and is therefore not so sensitive to carbon prices. Furthermore, future renewable subsidies are of limited importance to the results, as the renewable electricity sources mainly compete with each other. Increasing natural gas prices results in an increasing solar PV share in the power mix. More interestingly, when gas-fired generation decreases because of sustained high natural gas prices, contribution of solar+storage increases. This is because solar+storage has the advantage of supplying electricity more evenly when compared with solar PV alone.
  • 46.
    90 DNV Energy TransitionOutlook 2022 91 Renewable energy CHAPTER 3 3.2 WIND Solar PV co-located with storage technologies (referred to simply as solar+storage) refers to power stations where solar modules and storage, usually battery storage, are at the same site and invariably financed and developed in tandem. We can contrast solar+storage with standalone battery systems and with standalone solar power stations. A utility-scale standalone battery can buy electricity from the grid when power is cheap and sell it back when expensive. Storage in a solar+storage plant recharges only with power from the on-site solar panels, and sells power to the grid when advantageous. Compared to a standalone solar PV power station, solar+storage has the clear advantage of selling its generated power at a time other than the time of generation, meaning it can sell power when the price is higher. Co-locating solar and storage has clear cost advantages. During the investment phase, the costs of permitting, siting, and equipment are shared. Also, by making a single connection to the power grid instead of two, the grid connection cost is also slashed. During the operating phase, further advantages can be gained by sharing transaction costs. Furthermore, co-locating solar and storage may help prevent curtailing solar output. In a normal solar power plant, the inverter capacity is usually designed to be lower than the solar module capacity, thus ensuring higher utilization of the inverter, which has a high cost. This inevitably results in curtailment when the solar output exceeds inverter capacity. But in a solar+storage plant, all solar output can be stored and released at the same power rate as the inverter capacity, thus avoiding curtailments. The biggest financial incentive, however, has been government incentives. In the US, prior to the Inflation Reduction Act in August 2022, energy storage projects qualified for the Federal investment tax credit only if charged from a qualifying generation source such as a wind or solar project. It meant storage developers had about a 30% capital cost advantage if they co-located with solar or wind. This incentive was preferred by solar developers more than wind developers because the production tax credit was more advantageous for the latter. This policy has been so successful that, as of 2021, North America leads the world in solar+storage, hosting more than a third of global solar+storage capacity. However, the lifting of the requirement to charge batteries from renewables will significantly reduce the incentive to co-locate solar and storage. Despite the potential advantages, co-locating solar and storage can also lead to inefficiencies. Selecting the site of solar+storage plants is usually dictated by the solar output. But the biggest potential revenue source for standalone batteries is price arbitrage; buying the electricity cheap and selling it high. Therefore, its location in the power grid is critical for the battery storage. There will be no ultimate victor in the competition between standalone systems and solar+storage, but only local winners where conditions in time and space favour one over the other. One thing is clear though; with cheaper batteries and solar modules, solar and storage, as both co-located and standalone systems, will be two of the main components of the power system. In a solar+storage plant, all solar output can be stored and released at the same power rate as the inverter capacity, thus avoiding curtailments. Solar and Storage — why co-locate? Wind power provided 6% of the world’s electricity output in 2020, almost exclusively in the form of onshore wind. In some regions, like Europe and North America, its share of electricity generated was as high as 15% and 8%, respec- tively (Figure 3.10). This uptake has been driven by financially supportive policies and growing awareness of the impact of conventional energy sources on the environment and climate. We foresee onshore wind being more cautiously supported in the future in some high-income countries where the industry has reached a high maturity level and conflicts over wind-turbine locations loom. For offshore wind, we expect strength- ened support in countries with limited land areas, bypassing community opposition. By 2050, Europe and OECD Pacific will be the key regions where offshore wind generates more energy than onshore wind. Electricity generation We foresee electricity generation from on-grid wind increasing from 1,600 TWh per year in 2020 to 19,000 TWh per year in 2050, with Greater China, Europe and North America providing the largest output. After 2030, regions like OECD Pacific, and the Middle East and North Africa, will also see significant growth. By 2050, wind will provide almost 50% of on-grid electricity in Europe, 40% in North America and Latin America, and more than a third of electricity generation in Greater China (Figure 3.10). The share of offshore wind in total wind electricity generation will increase steadily, rising globally from 8% in 2020 to 34% in 2050, 6% of which is floating offshore. In terms of the percentage of regional electricity demand supplied from bottom-fixed and floating offshore wind, Europe will remain in the leading position throughout the forecast period. Capacity factors and costs In 2020, a 1 MW onshore wind turbine generated on average 2.1 GWh per year of electricity. In other words, the average utilization, or capacity factor, of all onshore wind turbines in the world was 26%. As wind capacity expands, new wind regimes will be exploited. Although some farms may have lower average wind speeds, new turbine types will allow better performance under varying wind conditions. Such developments along with continued increases in turbine, blade, and tower sizes, will lead to improvements in the capacity factors,
  • 47.
    92 DNV Energy TransitionOutlook 2022 93 Renewable energy CHAPTER 3 bringing the world average for onshore wind turbines to 34% by 2050. For offshore wind turbines, the average capacity factor is already 38% due to the more favourable wind conditions offshore. We expect this to rise to 43% by 2050. Figure 3.11 shows where the cost savings will originate. Though onshore wind is the most mature segment, it will still see cost reductions of 50% over the period 2020 to 2050. The largest reduction in the average LCOE from onshore wind will come from higher capacity factors. TABLE 3.1 Installed wind capacity by region Units: GW 2020 2030 2050 Region Onshore Fixed offshore Floating offshore Onshore Fixed offshore Floating offshore Onshore Fixed offshore Floating offshore NAM 136 0 0 270 29 2 662 148 31 LAM 33 0 0 97 29 0 331 120 7 EUR 183 25 0.1 274 98 8 449 312 55 SSA 3 0 0 12 0 0 34 13 3 MEA 13 0 0 59 18 0 250 78 14 NEE 3 0 0 15 11 0 29 41 5 CHN 280 10 0 744 103 2 1669 515 94 IND 41 0 0 103 17 0 415 120 38 SEA 3 0 0 27 15 0 282 96 27 OPA 13 0 0 43 26 2 107 101 16 World 708 35 0.1 1 645 345 14 4 228 1544 289 New turbine types will allow better performance under varying wind conditions. Such developments along with continued increases in turbine, blade, and tower sizes, will lead to improvements in the capacity factors: rising to 34% for onshore turbines, and 43% for offshore wind by 2050.
  • 48.
    94 DNV Energy TransitionOutlook 2022 95 Renewable energy CHAPTER 3 3.3 HYDROPOWER Hydropower is the historical means of renewable electric- ity generation. It represented 55% of total renewable energy generation in 2020, and 16% of overall electricity generation. But in contrast to solar PV and wind, growth will be moderate. In many parts of the world, VRES (i.e. variable renewable energy sources like solar PV and wind) will be a strong competitors against hydropower, causing average electricity prices to decline, and creating adverse conditions for new hydropower. However, policy continu- ity for hydropower projects and rising electricity demand will ensure that hydropower projects will continue to be pursued, at least in developing economies. There is a ‘frenemy’ relationship between VRES and hydropower. As solar PV and wind energy will grow strongly, hydropower will increasingly complement them and provide the necessary flexibility for the grid, both for daily and seasonal variation management. Pumped hydro, which increases water volumes by harnessing surplus solar and wind energy to pump water back up to the reservoir, will remain a part of this picture. However, because pumped hydro requires new invest- ments and involves energy losses, many areas will continue with traditional hydropower, including reser- voirs without pumping facilities. Run-of-river hydro, though lacking storage and therefore resembling PV and wind energy, will also continue to play a role. Compared with wind and solar power, dammed hydropower production can be withheld on sunny and windy days. This enables hydropower to receive much higher average prices and ensure profits despite having a higher LCOE than wind and solar PV. Forecast Hydropower generation has doubled over the last 20 years, and growth will continue until it slows down in the 2040s (Figure 3.13) as suitable resources in prime loca- tions will have been exploited. Until 2040, most of the growth will take place in Greater China, the Indian Subcontinent, and South East Asia. After 2040, growth in generation from hydropower will mainly happen in Sub-Saharan Africa. In a world seeing doubling of electricity generation by 2050, hydropower generation As onshore wind projects move to less favourable locations and to regions with higher costs, there will be a slighter decrease in the ‘non-turbine investment cost’ component — comprising non-turbine material costs, as well as labour, overhead, and tax costs — but its impact will be limited. The reductions in the levelized costs for fixed and floating offshore wind will be 39% and 84%, respectively. The majority of the cost savings will be from capacity factors and turbine costs for fixed offshore wind, while capacity factors and non-turbine investment costs will decrease the most for floating offshore wind, as experience of installing and operating offshore wind turbines builds. Forecast Globally, wind power has been growing steadily since the early installations in the 1980s. Grid-connected installed capacity reached 743 GW at the beginning of 2020. We forecast 1 TW in 2023, 2 TW in 2030, 4 TW in 2042, and 6 TW in 2050, of which 1.8 TW will be offshore (Table 3.1). These developments are linked to larger turbines, mega-sized projects, and a more dedicated offshore supply chain. In addition, the 2020s will see floating offshore wind progress to full-scale demonstration projects and on to commercial-scale deployment. We predict that floating offshore wind projects will have 289 GW of grid-connected installed capacity by 2050. Global wind capacity additions will increase from 92 GW per year in 2020 towards 374 GW per year by mid-century, with a brief stagnation period in the early 2020s due to COVID-19. Starting from the mid-2020s, some of the capacity additions will be due to the replacement of early installations that have completed their lifetimes. Our model assumes 28 years for the lifetime of onshore wind, 33 years for fixed offshore, and 28 years for floating offshore. Because wind technology is still in its early stages of development, it is unclear when existing capacity will complete its technical life, nor what will happen afterwards. However, it is likely that early wind installations that complete their lifetimes will be repow- ered with new wind turbines that reflect state-of-the-art technology. This is already happening, with some existing wind farms being repowered even before the end of their technical lifetimes to take advantage of favourable financial conditions. Capacity dedicated to hydrogen production Towards 2050, there will be a considerable growth of off-grid wind capacity dedicated to green hydrogen production through electrolysis. As specialized installa- tions not connected to the grid, these installations can be designed and economically optimized for the specific task of hydrogen production and not much public infrastructure is required, though some storage capacity will be needed. By 2030, there will be 110 GW worldwide of off-grid wind capacity, rising to 406 GW in 2040 and finally 738 GW in 2050 (Figure 3.12). Onshore wind will dominate off-grid capacity, making up 69% of the mix worldwide in 2030, rising to 77% by 2050. Regionally, Greater China will have the most off-grid capacity in 2050 — about 60% of world capacity — followed by Europe. Towards 2050, there will be a considerable growth of off-grid wind capacity dedicated to green hydrogen production through electrolysis.
  • 49.
    96 DNV Energy TransitionOutlook 2022 97 Renewable energy CHAPTER 3 3.4 NUCLEAR POWER Nuclear power has historically benefitted from energy security concerns in terms of providing reliable, carbon- free baseload power at reasonable prices. With the Fukushima accident in Japan in 2011, and Germany’s subsequent decision to shut down its nuclear generation, nuclear power has had a rough decade competing against incumbent, fossil-based electricity generation and the renewable energy newcomers. With the invigor- ated focus on energy security as an effect of the Ukraine war, many regions are again eyeing nuclear as a viable option to provide power, albeit at high prices, but void of fluctuations and dependency on other countries for delivery of fuel such as natural gas. Even considering those concerns, nuclear will find it difficult to significantly change its future, for the same reasons that previously hindered uptake. The absence of long-term, viable solutions to nuclear waste manage- ment, and the rising costs and construction times stemming from increased safety concerns, will limit new nuclear’s ability to compete in the future. However, the future looks a bit more favourable for the refurbishment and re-starting of nuclear plants that are currently operating, halted, or earmarked for decommissioning. Japan has a considerable capacity of mothballed nuclear power, and there are signs that political and public opinion is starting to shift amid greater awareness of the need for the country to reduce dependency on expen- sive imported LNG that creates geopolitical dependen- cies not necessarily in its long-term interest. Electricity generation Our Outlook reflects the change in perspective, though many of the same roadblocks to nuclear remain. Our forecast shows nuclear staying quite stable at today’s levels, growing from the late 2030s, followed by a long plateau before a slight decline late in the forecast period, see Figure 3.14. The eventual decline happens as many old nuclear plants retire without any new additions and are replaced by renewable power generation. Nuclear power output peaks just above 3 PWh per year by 2037 then reduces to 2.9 PWh per year in 2050, 13% greater than today. North America, Europe, Greater China, and North East Eurasia are currently the top four nuclear energy regions. Within a decade, Greater China’s output will have grown to almost the same level as Europe and North America. OECD Pacific and the Indian Subconti- nent will see significant growth throughout the whole forecast period, doubling and tripling their respective outputs compared with today. South East Asia will add 50 TWh of nuclear by 2050, with such growth starting only in the 2040s. Regional variations Several nations – such as Bangladesh, Belarus, Turkey, and the UAE – are just starting to pivot towards nuclear. However, the future of nuclear will be determined by what happens to existing power stations. Half the world’s installed nuclear capacity is over 30 years old, and many reactors are approaching the end of their original design lifetimes. Some countries, such as Spain and Germany, are most likely decommissioning. However, the new energy reality in Europe and elsewhere is one of increased focus on energy security and high energy will still provide 13% of total electricity supply, down from 16% in 2020. This loss of share is transferred to solar and wind worldwide. The mid-2020s will see expansion of hydropower capacity in Greater China of about 35 GW per year, which will taper off by 2030. This will be followed by capacity additions in the 2030s and 2040s in the Indian Subcontinent, South East Asia, and Sub-Saharan Africa. Stored energy with pumped hydro will follow the increase in hydropower generation. Yearly stored capacity will more than double from 80 PWh in 2020 to 190 PWh in 2050, an additional 2% to hydropower plants' output. Hydropower and climate change Hydropower used to be seen as the most reliable source of power generation. But recent droughts in China, Europe, Latin America, and the US – with related reductions in hydropower output – have shown that climate change may challenge that belief. Climate change will accelerate melting of mountain glaciers, induce greater rainfall variations and more recurrent droughts. These effects create additional uncertainty over future output. Furthermore, hydropower usually has the dual purpose of generating electricity and managing the water resource for flood control and irrigation purposes. While small hydropower schemes are generally low impact, large dams can have regional effects. In some regions where water is already a scare resource, climate change effects might exacerbate conflict around its control. The most iconic example is the Great Renaissance dam in Ethiopia. This dam over the Blue Nile began operating in 2022, and with a 5.2 GW capacity when completed, it will eventually be the largest hydropower plant in Africa. But downstream, Sudan and Egypt fear a strong reduction of water flow, which would endanger a fragile agriculture and water supply to an ever-growing population, also raising risks of a military escalation. The effect of these various parameters is hard to quantify and is not directly accounted for in our forecast. However, they might significantly influence the prospects for hydro- power in the coming decades.
  • 50.
    98 DNV Energy TransitionOutlook 2022 99 Renewable energy CHAPTER 3 Bioenergy is currently the largest source of renewable energy and one of the key options to supply energy needs towards 2050, especially in sectors that are hard to electrify. It is derived from many forms of biomass such as organic waste and residues from agriculture and livestock production, wood from forests, energy crops, and aquatic biomass such as algae. Bioenergy applica- tions are as diverse as its many forms. Solid fuels such as wood or charcoal are used for buildings heating, cooking, or in combined heat and power plants. Wood chips are increasingly used in coal-fired power plants to reduce emissions output. Gaseous forms of bioenergy, such as biogas produced from waste, are used for power production, as fuel and, if further upgraded, as biomethane. Biomethane in particular is gaining much attention as natural gas prices are soaring and domestic energy security becomes an issue. Liquid fuels produced from crops, algae, or genetically modified organisms are viewed as promising options in hard- to-abate transport subsectors such as aviation and maritime. Carbon neutral? Combustion of biomass, including biofuels, is considered carbon neutral, and thus no carbon emissions are counted. This is in line with IPCC assumptions that carbon in biomass is eventually absorbed from the atmosphere by photosynthesis, assuming that the burned plants are replaced with new plants. We note that while biofuels are broadly considered renewable, the view that their use is carbon neutral is contested by many scientists mainly due to the timing of CO2 reabsorption by replacement growth, which is much slower than the sudden release of CO2 via combustion (Scientific American, 2018). The sources of biomass used in the future will differ from today, favouring biofuels derived from waste. Third and fourth generation biofuels are likely to be subject to close scrutiny before they are approved for use and labelled as sustainable and carbon neutral. Between now and 2030, while the next generation of biofuel infrastructure is being developed, it is likely that biofuels produced from unsustainable sources such as energy crops will be an 3.5 BIOENERGY prices. This, coupled with the high cost of nuclear decommissioning and the difficulty of replacing sudden capacity retirements with low-carbon alternatives, have led some governments to consider extending nuclear plant lifetimes through upgrades and life-extension measures. For example, Belgium extended its nuclear decommissioning timetable from 2025 to 2035. France and Sweden are advancing their nuclear shutdown plans, but with increasing debate over re-invigorating nuclear research and, potentially, building new plants. South Korea's new president has vowed to reverse phase-out plans, and Japan is working towards bringing some of its reactors back online, subject to improved safety demonstration. Small modular reactor (SMR) technology has increasingly been praised as the next-generation technology to take over. However, evidence is so far lacking to support SMR’s claim to solve some of the existing hurdles for nuclear, such as high cost, safety, non-proliferation policy. SMRs could eventually – beyond our forecast period – make an important contribution to the decarbonization of hard-to- abate sectors, including shipping and aviation, through dedicated powering of production of low-carbon hydrogen, ammonia, and e-fuels. In last year’s Technology Progress Report (DNV, 2021a), we discuss both new fission and fusion technology in greater depth, where we believe those to be too far from maturity to make an impact within our forecast period.
  • 51.
    100 DNV Energy TransitionOutlook 2022 101 Renewable energy CHAPTER 3 Biomethane is currently in vogue as a carbon-neutral fuel, and even more so since Russia's invasion of Ukraine given the inherent energy security of domestic biomethane. For the different transport subsectors, biofuel-blend mandates will gain momentum. Looking some years ahead, demand will be amplified by the use of pure biofuels in sustainable aviation fuels (SAFs) and for green shipping. However, the big increase in propulsion fuels will be in synthetic fuels and ammonia, with biofuels being used mainly in the transition period. Bio-based fuel demand will extend beyond transport to sectors such as manufacturing and, to a lesser extent, buildings. A decarbonized economy in 2050 will clearly have multiple biofuel requirements — and by then, the emphasis will fall on sustainable bioresources, potentially limiting biofuel supply. We forecast biomass use of around 76 EJ per year in 2050, 25% more than today's 57 EJ. To supply such an enormous quantity of biomass, three main feedstock classes will be prominent — dedicated energy crops, waste and residue streams, and aquatic resources. Estimates of the total available potential from these three sources differ widely within the range 100–1,500 EJ per year. However, applying sustainability constraints narrows the most likely range to 200–500 EJ per year (EC, 2010 and IEA, 2007). More conservative assumptions bring the potential down further to about 150 EJ per year (WBA, 2016). This would still be sufficient to supply the 76 EJ per year biomass use that we forecast, but that does not mean an absence of constraints everywhere. Biomass used for energy purposes should not compromise food production, must avoid additional carbon releases, and should not harm biodiversity (ETC, 2021). As we detail in Chapter 8, the ‘most likely’ future that we forecast does not meet the Paris Agreement temperature goal, which requires a net–zero-emissions global economy by 2050. This has implications for biomass demand. We foresee about 82 EJ of biomass in a net-zero compliant energy system by 2050, which can still be satisfied by the biomass available. However, biomass availability and biomass access are two different things. Biomass sourcing and further inclusion in future supply chains is a difficult task and needs joint efforts from industry, government, and the public. Indian Subcontinent (+40%) will see a significant increase in their bioenergy use, though from a low starting point in Middle East and North Africa. More modest growth is expected in North East Eurasia (+37%), OECD Pacific (+25%), Latin America (+13%) and Sub-Saharan Africa (+12%). Slower growth is anticipated in North America (+7%), and slightly decreasing use in Europe. Over the forecast period, Sub-Saharan Africa will maintain its position as the largest user of biomass, with a stable global share of 28%. As shown in Figure 3.17, overall demand for biomass will increase, and the composition of biomass used globally will also change considerably from the traditional forms such as wood or charcoal (used, for example, in cooking) to a greater share of modern biofuels derived from waste (being used, for example, in aviation and maritime). In some regions, traditional biomass is currently the dominant energy source in residential buildings. This direct use will change but will remain a considerable energy source for some regions. Sensitivities Our sensitivity analysis indicates that high carbon prices will hinder biomass end use because biomass combustion will be subject to carbon pricing. Doubling the carbon price, however, will decrease biomass use by 3%. Similar effects will result from lower prices for competitors of biomass, such as natural gas. Higher natural gas prices, push biomethane development in turn. Is there enough biomass to supply demand across many sectors? important part of the biomass. However, ongoing food-versus-fuel discussions will favour biomass that could not otherwise be used to feed the world. The time perspective of biomass emissions is important and is a concern. In our forecast, potential additional emissions due, for example, to deforestation to make room for crops for liquid biofuels production are accounted for under agriculture, forestry, and other land-use (AFOLU) emissions. Emissions during transport of biomass are accounted for under transport. Neverthe- less, we still adhere to the overall view that biomass and thus biofuels, is carbon neutral over time. Biomass-based value chains can also be carbon negative — such as the use of organic waste as feedstock for energy production rather than being left to rot and thus producing methane. Forecast Global bioenergy demand supplied from biomass has almost doubled since 1980. Figure 3.15 shows biomass for energy use will keep growing until the early 2030s and level off towards the end of our forecast period. The transport, manufacturing and power sectors will be the main contributors to the growth. The overall share of biomass in primary energy supply grows marginally to about 12% in 2050 compared with 10% today. As seen in Figure 3.16, there will be significant growth in the use of bioenergy in the transport sector, mainly as liquid biofuels, with gaseous biofuels having a smaller share. With a predicted doubling between 2020 and 2050, bioenergy will become an important energy source used for decar- bonization of transport, accounting for an 8% share of transport energy use. The major driver for this growth will be decarbonization policies implemented with measures such as mandates and carbon pricing, as well as the limited availability of alternatives such as electrified propulsion technologies in aviation and maritime transport. Today, the overwhelming part of bioenergy use in the transport sector takes place in road transport (99.5%), mainly in the form of blends with gasoline and diesel, with a very small amount used in the form of gaseous energy carriers like biomethane. This is going to change towards 2050. Aviation and maritime transport will increasingly use biofuels to diversify their fuel mixes and foster decarbonization. By 2050, road transport will see a 60% reduction of its current share of bioenergy demand due to ongoing electrification and thus a lower demand for blended fossil fuels. This is also supported by ongoing biomass-sourc- ing competition with other transport sectors. Maritime will by mid-century account for 23% of biofuel use in transport. The majority (52%) will be used in aviation. Bioenergy use in buildings will reduce by about a third by 2050, mainly due to diminished use of traditional biomass in low-income regions to supply space heating and cooking fuel. Even so, bioenergy will retain its leading share in the mix for buildings, though a third of bioenergy will be used in buildings by 2050 compared with 50% in 2020. Power stations will increase the amount of bioenergy used by 50% between 2020 and 2050, raising bioenergy’s share in the power energy mix to 21% by mid-century. In 2020, 17% of the world’s bioenergy was used in manufac- turing, and this share will grow by 8% during the forecast period to reach just above 25% in 2050. Regional developments As seen in Figure 3.17, the regional share of demand will not change dramatically over the forecast period for most regions. Middle East and North Africa (+70%), Greater China (+40%), South East Asia (+45%), and the
  • 52.
    102 DNV Energy TransitionOutlook 2022 103 Renewable energy CHAPTER 3 Other renewable energy sources are likely to remain marginal on a global scale between now and 2050. For example, solar thermal and geothermal combined provide less than 1% of world primary energy by mid- century, and concentrating solar power (CSP) even less. In this Outlook, ‘solar thermal’ refers to heat generated in solar water heaters. Globally, primary energy supply from solar thermal energy will start declining from today's 1.4 EJ in 2020 to reach 1.1 EJ in 2050. Most such energy heats buildings, and Greater China will be responsible for most of the decline as heating water from electricity takes over. Section 1.3 discusses in more detail how buildings use energy for heating water. Though not modelled, CSP is another technology which is not yet large-scale. This technology concentrates a large area of sunlight onto a receiver, generating both heat and electricity. While this improves the efficiency of power generation, it adds additional manufacturing complexity and cost. This complexity has hindered the roll-out of CSP technology, and well publicized failures such as at the Crescent Dunes facility in the US have eroded faith in it. Two types of CSP plants exist, either parabolic trough power plants or molten-salt tower/ central receiver power plants, with both technologies still needing to mature. There are some up-and-coming CSP plants in the works – such as the Redstone Thermal Power Plant in South Africa and Noor Energy 1 in Dubai – and LCOEs are starting to become low enough to be compet- itive with other renewable technologies. However, we do not see this technology reaching a large-scale buiild-out during the forecast period. Geothermal energy from the Earth’s crust originates from hot springs or other low-temperature sources and has many potential applications, ranging from power genera- tion to driving heat pumps. Though geothermal energy for electricity generation is limited to tectonically active areas, it has high capacity factors and is a relatively constant source of energy. As of 2020, geothermal energy provided 3.5 EJ (0.6%) of the world’s primary energy supply. Worldwide, geothermal energy is over- whelmingly used by power stations, but there is a significant demand for it in the buildings sector in China. Although geothermal energy has the technological potential to grow in some applications, high costs in most of the world will limit its expansion. South East Asia is currently the leading region for geothermal energy, with more than a quarter of global supply and use. By 2050, however, there will be signifi- cant growth in Sub-Saharan Africa’s supply of geothermal energy to put it on par with Greater China in second and third place. Potential future energy sources As stated in the introduction, we base our forecast on continued development of proven technologies, includ- ing advances in these technologies. Such improvements, like technological developments in solar PV and wind, are already included in their respective sections. Technologies that are not yet proven, and marginal technologies that are not expected to scale, are not included in our forecast. Ocean energy is one of them. There are several types of ocean energy, including tidal energy, wave energy, ocean thermal energy conversion (OTEC) and marine current power. Of these four, the first two are the most highly developed today, with a current installed capacity of 10.6 MW tidal and 2.3 MW wave power generation capacity. The LCOEs of these technol- ogies, and the investment costs, are declining but remain higher than for other forms of renewable energy. Other barriers to their large-scale implementation are limited suitable locations, often far from an existing grid, with accordingly high grid-connection costs. There is also concern about the environmental impact of these structures, including noise, risk of collision with marine animals, and changes to the flow and water quality. Despite all that, plans have been made for new installa- tions, the largest being the three-phase MeyGen project in Scotland. Situated between the Scottish mainland and 3.6 OTHER RENEWABLES the Island of Stroma, the site has ideal depth, water flows, and proximity to the mainland. Phase one comprising of four 1.5 MW turbines has been operational since March 2018. Phase two is currently underway with a plan to install 80 MW of tidal stream capacity. In the future, it looks like ocean energy technologies will be suited to niche markets – for example small island developing states where it would be most costly to import energy – or coupled to another operation to provide it with power, such as oil and gas platforms or aquaculture operations. In other cases, ocean energy could be used directly. i.e. not converted to electricity first, to avoid additional cost and componentry, for example for wave-powered desalination. Nuclear fusion is a similar case. For several decades, nuclear-fusion technologies have been discussed as a carbon-free source of energy. Several promising research projects focusing on smaller fusion systems are currently being piloted. Advances in computing power, materials science, and manufacturing, together with the rising availability of venture capital, have enabled recent progress in fusion technology. Once the domain of governmental research labs, private companies are now bringing expertise in other areas, and stronger commer- cial focus as they seek to realize the potential of this technology (See details in our Technology Progress Report 2021). Yet, no plant has produced useable energy beyond that required to initiate and sustain a fusion reaction. The availability of fuel – primarily deuterium – is almost limitless, but there are large uncertainties about if and when successful operation of nuclear fusion will occur. Even with a breakthrough, there will still be a significant delay before energy on a scale comparable to other power sources will be provided; so, we confine our forecast to traditional fission technologies. During the period covered by this Outlook, one or more of the emerging energy technologies may achieve a breakthrough, such that they become cost competitive. However, to have a significant impact on our forecast, they would need to grow much faster than incumbent renewable technologies. We do not see this happening at scale and have therefore excluded emerging technolo- gies from the forecast. Geothermal energy in Iceland.
  • 53.
    104 DNV Energy TransitionOutlook 2022 105 Energy supply and fossil fuels CHAPTER 4 4 Highlights By 2050, the fossil share of primary energy will dip slightly below 50% from its current share of more than 80%. This is due to rapid electrification, decarbonization and accelerating energy efficiencies. Coal — has already peaked, and its use is expected to fall almost two-thirds from current levels by 2050. Oil — the route to an overall decline of 45% by 2050 from today’s levels – influenced largely by the electrification of transport – is not smooth. We predict a peak in 2025, a little above today's demand, before demand decreases slowly between 2025 and 2035, after which the decline becomes relatively steep. Natural gas peaks in 2036 and slowly tapers off to end some 10% below today's levels. It surpasses oil as the largest source of primary energy in the late 2040s. Gas has staying power owing to its diversity of uses — half of the demand for gas is as final energy in manufacturing, transport and buildings, and the other half through transformation for other final uses like electricity, petrochemicals, and hydrogen production. By mid- century, just 12% of gas will be carbon free, of which hydrogen will supply roughly one quarter, with the balance made up through CCS in power and industry, and by biomethane. 4.1 Coal107 4.2 Oil109 4.3 Natural gas113 4.4 Summarizing energy supply119 ENERGY SUPPLY AND FOSSIL FUELS
  • 54.
    106 DNV Energy TransitionOutlook 2022 107 Energy supply and fossil fuels CHAPTER 4 Fossil fuels face several challenges from threats of substitution in several energy system subsectors, to CCS scale up pressure and capital markets rewarding non-emitting energy sources with lower capital costs. Over the coming decades, we will see a gradual phase- down, first of coal, having the highest carbon footprint, and thereafter oil and gas, which compete with each other only to a limited degree. Despite the fact that renewable sources are already competitive in most places with fossil-fired electricity, it will take many years for low- and zero-carbon energy sources to dislodge fossil fuels out of the broader energy system. Figure 4.1 illustrates our forecast for how the composition of the various fossil energy sources, and the non-fossil share, will change in the coming three decades. 4 ENERGY SUPPLY AND FOSSIL FUELS 4.1 COAL Fossil fuel presently supplies more than 80% of global energy, and this has been the case for decades. However, this share is set for dramatic change as uptake of renewable energy sources is growing rapidly. The fossil slice of the pie will shrink by around one percentage point per year, and we forecast that by mid-century, its share of global energy supply will be just below the 50% mark. Today, 13% of the world’s oil, 10% of the natural gas, and 1% of the coal is not used for energy purposes, but as feedstock in plastics, petrochemicals, asphalt, and similar products. This fossil fuel is not burned and, unlike fossil fuel used for energy purposes, does not cause direct emissions. Still, we chose to include this non-energy fraction in our primary energy overview, and it is also included in the fossil fuel share in Figure 4.1. Were we to subtract non-energy use of these sources, the present share of fossil fuel in the energy mix would be 79%, not 81%. Chapter 1.5 describes how demand for feedstock is increasing and is expected to peak in the mid-2030s. Use of fossil fuel as an energy carrier is reducing, and therefore the share of fossil fuel (especially oil) not being burned is increasing and will represent 24% of global oil use in 2050. If we subtract this fossil feedstock use from all fossil fuel use, the share of fossil fuel in the energy mix will be 46% in 2050, instead of 49%, and from 2047 onwards, more than half of all energy being used will be non-fossil. The fossil fuel not burned Once an energy sector favourite, global demand for coal grew rapidly from 4.7 Gt per year in 2000 to peak at 8 Gt per year in 2014. But from that point onward, total demand for coal has and will move in only one direction: downwards. The economic and trade contraction associated with the COVID-19 pandemic reduced coal demand by 7% in 2020. Coal demand will rebound but will never reach its previous peak, instead falling almost two-thirds from its current level by 2050. As a cheap and reliable source of power, coal has been the preferred technology for electricity generation in many countries. Power generation was thus the primary driver for coal demand, accounting for nearly 63% of coal consumption in 2020 (Figure 4.2). However, closure of old power stations, particularly in Europe and North America, and the cancellation of several projects in their pre- construction phase, especially in Greater China, are signs of a shift towards wind and solar power generation. Coal is also used as a heat source in manufacturing, and as a carbon source for iron-ore reduction in steel production. For low-heat processes in the production of manufac- tured goods, direct coal use will give way to electricity. Moreover, since coal is a very problematic source of local pollution, China, for example, will continue to switch from coal to gas for industrial processes. In other regions, gas boilers and electricity will ensure a steady phase-down of coal for most industrial heat demand. For higher-temperature processes (such as making cement, iron and steel), the switch will be more difficult, and coal will remain a favoured option despite its high carbon emissions. Coal demand for high-heat processes will increase slightly in the near term before falling rapidly after 2030. Global coal demand in the iron and steel subsector will decrease almost a fifth by 2050. Today’s biggest coal consumer, Greater China, will see a halving of coal use, mainly due to steel production declining by even more (down 65%). In contrast, coal demand for iron and steel in the Indian Subcontinent will double by 2050, resulting in its demand for coal almost equalling Greater China’s by mid-century. Total coal use has already declined strongly in North America and Europe, driven by shifts in the power sector. Low gas prices have been at the forefront of the fall-off in North American coal use, whereas renewables growth is the main factor in Europe. We see a current upswing of coal being used in Europe in response to Russia’s invasion of Ukraine, and the associated gas shortages. However, this is a short-term blip and will not change the long-term decline in coal use in Europe. Coal use has flattened in China recently, supported by policies to curb air pollution in manufacturing and power supply. Over the last decade to 2020 only the Indian Subcontinent (45% growth) and South East Asia (90%) have shown uninterrupted increases in coal usage. All regions will show a long-term reduction in coal consumption, but not necessarily in the short term (Figure 4.3 ). Prior to 2030, coal use in the Indian Subcontinent and South East Asia will grow. By mid-century, coal usage in OECD regions, notably North America and Europe, will have declined by 90% and 80%, respectively. Coal’s decline in coal-rich OECD Pacific will also be substantial, at 75%.
  • 55.
    108 DNV Energy TransitionOutlook 2022 109 Energy supply and fossil fuels CHAPTER 4 In near-term power generation, coal will lose out to gas and renewables in OECD countries, but expand in many developing nations. After 2030, stricter emissions policies, increasing competition from renewables, and a ramping- up of storage and other sources of flexibility technologies will make renewables more dispatchable and reduce the competitive position of fossil fuels in general and coal in particular. Consequently, capacity additions will gradually fade away, retirements increase, and capacity utilization will decrease. Our analysis confirms the coal death spiral feedback-loop: as plant utilization declines, coal power will become more expensive, thus further reducing its competitive position, making coal power less affordable, and thus its use declines yet further. China and India have recently added capacity and more coal-fired power stations are planned along with greater coal use in manufacturing. This inertia will result in Greater China and the Indian Subcontinent continuing to retain their current combined share, 70%, of global coal demand in 2030. Almost all brown coal, and a significant share of hard coal, is consumed within its region of production. Only four of the 10 regions are net importers of coal, namely Europe, Greater China, the Indian Subcontinent, and Middle East and North Africa. China, the largest producer and consumer of coal, is also the biggest importer. However, the phasing out of coal-fired power plants in China, and reduced use of coal in manufacturing, will progressively reduce its demand for coal, though imports will remain high until 2040 before declining significantly towards 2050 (Figure 4.4). Driven by India’s efforts to increase self-sufficiency, the Indian Subcontinent will reduce its share of imported coal. Australia, Indonesia, Russia, and South Africa will continue to be major exporters, but each with progressively lower export totals over our forecast period. In near-term power generation, coal will lose out to gas and renewables in OECD countries, but expand in many developing nations. 4.2 OIL Over the past few decades, global oil demand has grown steadily at about 1% per year, with a minor reversal related to the 2008 financial crisis. In 2020, amid the global COVID-19 pandemic, this steady growth came to an abrupt halt. The main source of demand for oil products is the transport sector, and global transport (land, sea and air) plummeted during the pandemic. Since then, transport in most subsectors and regions has largely recovered to a 'new normal', though in some countries, such as China, regional restrictions are still in place. Figure 4.5 shows historical and projected developments in global oil demand by demand sector from 1990 to 2050. Driven by population- and economic growth, and therefore by an ever-increasing demand for transport, oil has been the world’s leading energy source ever since it surpassed coal in the early 20th century. In 2020, demand for oil was 75 million barrels per day (Mb/d), or 154 EJ. Our modelling suggests that it could peak in 2025 at about 86 Mb/d (176 EJ), 5% above today's level, before going into long-term decline. Initially, demand will decrease slowly between 2025 and 2035, after which the decline becomes relatively steep, averaging -2.4% per year over the period 2035–2050. This rate of decline is much faster than the average growth of about 1% per year that we have seen historically. In 2050, expected global oil demand of 56 Mb/d (115 EJ) will be 32% lower than today. This decline is driven to a large extent by falling demand in the transport sector, where total demand goes down by about 47% in the next 28 years. Sectoral demand The transport sector’s share of oil demand is currently at an all-time high of some 67% but will soon start to reduce as the pace of road transport electrification gathers speed. Even so, the transport sector will continue to dominate oil use, retaining a share of 54% in 2050, with the road subsector taking the largest part, split equally betweenpassengerandcommercialvehicles.Electrification of the passenger segment will happen sooner, and its oil demand will decline by 62% over the next three decades.
  • 56.
    110 DNV Energy TransitionOutlook 2022 111 Energy supply and fossil fuels CHAPTER 4 Oil use in the commercial road segment will hold up a little longer. The global number of ICEVs will peak in 2028 at 1.4bn vehicles. Oil use in aviation, shipping, and rail transport (termed ‘Other transport’ in Figure 4.5) will initially grow for a few years but then start declining rapidly from 2026 onwards, ending at three quarters of today's demand (8 Mb/d) by 2050. By then, the fuel mix will have shifted to some extent from fossil fuels towards biofuel, green ammonia, e-kerosene and other low-car- bon fuels. Oil is also used as feedstock in the petrochemical industries. This use does not entail any emissions and will therefore be sustained in a lower-carbon future. With declining oil use for various energy purposes, the share of non-energy use in oil demand will go up from 13% today to 24% In 2050. In absolute terms, oil demand for non-energy use will increase from around 11 Mb/d today to 14.2 Mb/d by 2040, and then start slowly declining to 13.3 Mb/d by 2050, due mainly to a decrease in plastics production as a result of demand-side reduction and substitution measures as well as higher rates of recycling (see Chapter 1, Section 1.5). The third largest sector in terms of oil use is manufacturing, where demand will remain in the range of 5.5-6.3 Mb/d, but its share of oil demand will rise from 7% to 10% by 2050, reflecting the relative decline in oil demand in other sectors. Oil, or its products, are also used in buildings, power, and ‘other’ sectors, as well as for producing the oil itself. However, these uses are small (5% of total oil demand) and remain so throughout our forecast period. Regional oil demand Peak oil will come at very different times across regions. As with energy demand in general, global oil demand will shift eastwards and southwards. Looking at regional demand (Figure 4.6), North America and Europe had the highest share for many decades, but Greater China overtook Europe as second largest regional market in the second half of the previous decade. North America and China will continue to be the top two users of oil over the next 15 years. However, both will be surpassed by Middle East and North Africa in the 2040s, as rates of electrifica- tion of the road transport subsector in the latter region lag behind EV uptake in North America and Greater China (see Chapter 1, Figures 1.6 and 1.7). In 2050, Middle East and North Africa, Greater China, and the Indian Subcontinent are expected to be the top three regions in terms of oil demand, though several regions will be very close to each other, therefore this ranking is subject to uncertainty. The bottom three regions are expected to be Sub-Saharan Africa, OECD Pacific, and Europe, but demand will be rising in the first and falling in the other two regions, which are more mature in terms of economic development. Oil demand in both Europe and OECD Pacific will be around 40% of present levels by mid-century. Driven by electrification of the road transport segment, North America will see oil use drop to a third (34%) of its present level. In Greater China, an increasing number of vehicles on its roads will mean that oil use grows initially before peaking in 2026, at 9% higher than today. Thereafter, fast uptake of EVs will result in China’s oil use entering rapid decline to 55% of what it is today by 2050. In contrast, Indian Subcontinent's oil use will peak around 2044 and will still be two thirds higher in 2050 than today. Sub-Saharan Africa’s oil use will not peak within the forecast period and will more than double between now and mid-century. Production and trade No other energy commodity is transported around the globe to the same extent as oil, and the centres of global oil production are generally not the main areas of consumption. Middle East and North Africa is the largest oil-producing region, and Figure 4.7 shows that its share in global crude oil production will rise even further from one third today to close to two thirds in 2050. The main reason for this is its abundant reserves and lowest per-barrel extraction costs. Absolute production in the region will also be around 15% greater in mid-century than today. Reliance on one region producing well over half the world’s oil could be considered a risk. However, security of supply is generally improving as the share of energy produced locally or regionally increases proportionally with the growth of renewables, and oil’s role in the geopolitical picture will diminish in the coming decades. Our analysis distinguishes between offshore, onshore conventional, and onshore unconventional oil production. Globally, the distribution remains relatively stable over
  • 57.
    112 DNV Energy TransitionOutlook 2022 113 Energy supply and fossil fuels CHAPTER 4 the forecast period. The share of conventional onshore increases from around 50% today to about 56% by 2050, while the share of offshore production declines slightly from around 33% to 29%. Over the same period, the share of unconventional onshore production, around 18% today, initially rises slightly before declining to around 15%. Naturally, there are large regional variations, with conventional onshore dominating production in Middle East and North East Eurasia, whereas in North America the lead is now taken by unconventional onshore. It should be added that uncertainty over where oil will come from is high. In our ETO model, oil produc- tion equals demand, and regions do not develop their oil resources if cheaper oil can be supplied by other regions. Although global oil production will always equal demand over time, since storage is limited, regional distribution might not follow the same disciplined pattern assumed in our model. Heading into a future in which oil demand levels off and declines, the oil industry is entering unfamiliar territory, with significant risks of volatile and lower oil prices for producers. OPEC decisions on curbing oil production to maintain a certain price level, or similar political decisions, have not been included in our model. In our forecast, new oil production capacity will be developed through to 2050, but we foresee annual global capacity additions peaking around year 2025 and thereafter declining 70% (compared with today) over the next 30 years. As unconventional capacity has a shorter average lifetime than conventional, both onshore and offshore, regional distributions of capacity additions are not directly comparable. Unconventional capacity additions will be predominantly in North America. Middle East and North Africa will dominate conventional capacity addi- tions. The reduction in oil demand will make it less attractive for the industry to expand production into challenging environments, such as deep water, high pressure, and/or remote locations such as the Arctic. Sensitivities The most decisive factor in the rate of decline in oil demand is the speed with which EVs will take over from ICEVs. Battery costs are the most important determinant of EV competitiveness. Battery learning rates — how quickly battery costs come down — are therefore of key importance. If we model a halving of battery learning rates over the next 30 years, we find oil demand in 2050 rises by 12% (or about 13 EJ). Conversely, if the battery learning rate is raised 50%, we forecast that global oil demand would decline beyond our base level by about 7% (or 7 EJ). Over time, technology learning is more important for oil demand than the level of EV subsidies. As oil demand from the power sector is low, sensitivity to changes therein, including those occurring with solar PV and wind, is relatively low. Electricity price itself is a factor, and halving/doubling electricity prices will result in oil demand varying by around ±6% from our base case. Finally, if we look at oil price itself, our analysis indicates that, should the oil price halve, then demand for oil will increase by some 17%, whereas doubling the price will reduce demand by 10%. The numbers might well be higher than these, as significant rebound effects that are not included in the model — for example, on transport services themselves — would occur in addition to changes in the energy mix. In this sensitivity discussion, we have considered changes in individual parameters separately. However, combinations of changes could also happen simultaneously. For oil, we foresee annual global capacity additions peaking around year 2025 and thereafter declining 70% (compared with today) over the next 30 years. 4.3 NATURAL GAS Natural gas, the least carbon-intensive fossil fuel, will surpass oil to become the world’s largest energy source in the late 2040s. There will be new uses for natural gas, particularly with increasing use in maritime transport, but also as a source for low-carbon (blue) hydrogen (Figure 4.8). Slightly less than half of the demand for natural gas will derive from final use — in buildings, manufacturing, and transport. The other half will come from transfor mation to other final uses — for example, electricity generation, non-energy use as feedstock for petro- chemicals and fertilizers, own use (demand from the oil and gas and energy industries during production and distribution), and for hydrogen production. Demand Demand for natural gas and biomethane (both hereafter referred to as gas) is set to slowly increase between now and 2036, then to decline towards 2050. In Europe, gas consumption peaked last decade, and its decline will continue — strongly influenced by the war in Ukraine and its implications (see Chapter 1, The Russian invasion of Ukraine) — reaching about a half of last year’s value in 2050. In OECD Pacific, gas consumption peaked last decade and will continue its subsequent decline right through to mid-century, when it will be half of today’s level. In contrast, in Greater China, gas will peak in the early 2030s. After a five-year respite to 2025, gas growth in the Indian Subcontinent will continue, climbing to a level in 2050 more than twice as high as in 2020. Use of gas in power generation will decline from today`s 35% to 29% by 2050 but will still account for the greatest sector share of gas use at that time. In absolute terms, gas use in power generation will plateau in 2030 then start to decrease from the 2040s as a result of growth in renewables. From a relatively low starting point, gas demand in the transport sector will almost double by 2040, before declining by almost a third to 2050 due to its increasing displacement in its main application, maritime transport by the rise of hydrogen and its derivatives such as ammonia. Manufacturing’s appetite for gas in 2050 will be about the same as today, while its share in demand for
  • 58.
    114 DNV Energy TransitionOutlook 2022 115 Energy supply and fossil fuels CHAPTER 4 gas increases from 16% to 19%. Similarly, demand for gas from the buildings sector will be roughly the same as now in 2050 — albeit after a slight decrease by 2030 — with a continued share of 22%. The share of non-energy applications (largely petrochemicals) in demand for gas will remain stable at 10% as demand for products that use gas as a feedstock remains at current levels and hydrogen is increasingly used. Own use (demand from the oil and gas and energy industries during production and distribution) will grow over the next five years but will fall to 10% of today’s level by 2050. Decreases in own use are likely to arise from efficiency gains, from the electrifica- tion of production facilities, and from less flaring. Some of this use in the energy sector will be for liquefaction and regasification of gas that is transported as liquefied natural gas (LNG). Regional developments Among the regions, primary demand for natural gas will double in the Indian Subcontinent by 2040. It will grow 10% in Greater China by 2030, then decline steeply to return to 2016 levels by mid-century, though still account- ing for 8% of world natural gas demand at that time (Figure 4.9). Together, these two regions accounted for 15% of total natural gas demand in 2020. This will rise to 19% by 2035 and fall to 13% by 2050. Both regions are set to see strong policy support for natural gas consumption in the short term, with local pollution prevention as a main driver. As each has limited natural gas resources, they will togetheraccountfor67%ofnetnaturalgasimportsin2035 and 78% in 2050 (Figure 4.10). Greater China is one of the main importers of natural gas, and imports will increase in the coming decade, followed by a steep decline to 2050 as its consumption of natural gas reduces (Figure 4.11). Europe's natural gas imports will soon begin a steady decline to about a third of current volumes by 2050. European policy is moving decisively to slash the region’s dependency on imported Russian gas to almost zero. North East Eurasia will remain a major gas exporter during the forecast period, but its foreign markets will change significantly. While it will see some increase in liquefaction capacity, pipelines are likely to distribute much of its gas exports, and there will be more focus on supplying countries to the south and east of North East Eurasia. The Indian Subcontinent will significantly increase imports to satisfy a near doubling in its demand for natural gas, requiring substantially greater LNG regasification capacity in the region. Middle East and North Africa will remain among the most important suppliers of gas, replacing North East Eurasia as the biggest natural gas exporter towards the end of our forecast period. South East Asia will see slight growth in natural gas demand between 2023 and 2030, when it will peak before slowly returning to 2028 levels by 2050. The region will remain a net exporter, and its gross imports will decline. Strong demand for natural gas in Middle East and North Africa, North America, and North East Eurasia will continue, collectively accounting for 56% of global demand today and maintaining this share to 2050. Within these big-user regions, gas demand from North America will decline from representing a 25% global share in 2023 to 17% in 2050, as its power sector decarbonizes. North East Eurasia will see much less decarbonization in all of its demand sectors and its share in global demand will edge up to about 16% by mid-century, 2% higher than today. Significant demand growth will be seen in the Middle East and North Africa. These two regions will remain both the main producers and principal net export- ers of natural gas. The consequences of Russia`s invasion of Ukraine for North East Eurasia`s domestic gas demand and exports are explained in more detail in Chapter 1. Europe and OECD Pacific are decarbonizing faster than other regions and, as their own natural gas resources are limited, will both see declines in natural gas demand between now and 2050. Latin America, however, will see little change in its demand. Combined, these three regions accounted for 23% of demand in 2020 and will account for 14% by 2050. They will remain natural gas importers throughout the forecast period. Sub-Saharan Africa will see continued growth in gas use, albeit from a low level, doubling its share in global gas demand to 2% in 2050. Declines in natural gas use occur for three primary reasons. First, gas-fired power generation meets stiff competition from carbon-free renewables. Second, in sectors where it is feasible, direct gas use is hit by electricity growth. In other sectors, low-carbon (blue) hydrogen will be an option for replacing fossil fuels for hard-to-abate applications in a world steadily more eager to decarbonize, and with carbon prices imple- mented worldwide. Third, biomethane – being organic in origin and chemically identical to natural gas, but accounted for as 'carbon-free' — will increasingly replace fossil (i.e. natural) gas in all demand sectors.
  • 59.
    116 DNV Energy TransitionOutlook 2022 117 Energy supply and fossil fuels CHAPTER 4 Decarbonized gas In 2050, 12% of gas will be carbon-free, using natural gas but with CCS in industry, power generation and hydro- gen production (7%); and growing production and use of biomethane (5%) (Figure 4.11). Natural gas consumption will decline 18% between 2020 and 2050. By mid-century, biomethane production will see a more than 100-fold increase from today`s levels, with more than 80% of the production capacity in North America (30%), Europe (20%), the Indian Subcontinent (17%) and Greater China (15%). Global production capacity build-up accelerates significantly in the 2030s and reaches 150 Gm3 in 2050. In 2050, almost 50% of hydrogen will be produced from fossil fuels, and 70% of that with associated carbon capture technology. The majority of fossil-based hydrogen is produced from natural gas. Carbon-free gas develop- ments will be spearheaded in those regions with the most ambitious transition policies, and consequently high carbon prices – Europe, Greater China, North America, and OECD Pacific. Production and transport In the coming decade, global natural gas production will remain largely unchanged (4,520 Gm³ in 2020 and 4,660 Gm³ in 2030) before decreasing to 3,836 Gm³ in 2050 (Figure 4.12). Middle East and North Africa and North East Eurasia will together account for more than half of global output in 2050. North American natural gas production will halve, reflecting a 50% reduction in domestic demand. However, smaller levels of produc- tion in the higher cost regions of Europe and OECD Pacific will experience the most dramatic reduction, falling by 76% and 57%, respectively, between 2020 and 2050. Compared with our forecast for oil (Section 4.2), offshore natural gas production will be more resilient than offshore oil. This is partly due to a more pronounced fall in oil demand, such that more-expensive offshore capacity will lose its oil market share. As demand for natural gas grows more strongly in importing regions, LNG and pipeline transport will increase even when global gas demand does not. Gas transport is expensive and accounts for a significant proportion of the cost of delivered energy. Piping is cheaper than shipping for transport over shorter distances and will expand as production sites and consumption sites move further apart. Global capacity for regasification grows 60% by 2050, while liquefaction more than triples (Figure 4.13). The big producers are also the big exporters, and North America — which is distant from its natural gas customers — will see the largest growth in liquefaction, accounting for 42% of global capacity by 2050. Middle East and North Africa will be second largest, representing about 15% of global liquefaction capacity. By mid-century, almost half (43%) of global regasification capacity will be in the Indian Subcontinent and Greater China. Is natural gas a bridge? There is an ongoing debate as to whether natural gas is a bridging or a destination fuel. In this context ‘bridge’ means a temporary or interim solution on the way to an alternative energy source, while ‘destination’ means that it is part of the longer-term final energy mix. It is helpful to frame this discussion in the context of emissions. For as long as net global emissions are above zero, the global average temperature will continue to increase; a situation which clearly cannot continue ad infinitum. In theory, it is possible to continue with fossil fuels while ensuring zero or negative emissions by deploy- ing carbon capture and removal; but that cannot scale infinitely. Moreover, we know that to reverse the growth in emissions, we will need net negative emissions in the future, allowing only the bare minimum of unabated fossil-fuel combustion. Unabated natural gas is therefore not a destination fuel and has a negligible place in a future final energy mix. Abated natural gas – natural gas with carbon capture and storage (CCS) — has only marginal emissions and could in theory continue for decades if not centuries, provided there is sufficient space for CO2 sequestration. However, sequestration space is limited and subject to strong competition. From a climate-change mitigation perspec- tive, there are stronger claimants for that space than abated natural gas in the form of captured CO2 — for example, from direct air capture, bioenergy with CCS, or industry emissions from processes such as cement. Hence, in the race for net negative emissions, abated natural gas has only a very limited place in a future final energy mix. With all of the above in mind, it is clear that natural gas is not a destination fuel; but that does not in itself mean that gas is a ‘bridge’. New gas infrastructure built today creates the risk of locking in investments that will make it hard to move on to a zero-carbon solution in the future. The argument is then that gas is a detour and that we should instead move directly to zero-carbon alternatives. Another way of looking at this could be that where gas is used today, it should be seen as a bridge to a zero-carbon solution in the future. However, sectors that are not using natural gas today should avoid switching to gas, as they will have to move on to another zero-carbon solution in a decade or two. There are exceptions to this, e.g. in low-in- come countries that need to use natural gas for cooking and heating to avoid the burning of biomass that causes excessive deaths from poor air quality, or in hard-to-abate sectors like shipping where dual fuel engines can use natural gas while waiting for the low-emission fuels to be developed. In summary, natural gas should not be seen as a destina- tion fuel, and the notion of a bridging fuel should be used with caution to avoid prolonging fossil-fuel use beyond that which is absolutely necessary.
  • 60.
    118 DNV Energy TransitionOutlook 2022 119 Energy supply and fossil fuels CHAPTER 4 By any measure, the world, and Europe in particular, have been experiencing extremely high gas prices which, at the time of writing, are at all-time highs. LNG traded on the spot market has followed suit, and gas prices across the world are currently high, but not as high as in Europe. As input to the ETO model generating results for the forecast in this report, we have assumed a natural gas price that remains high (late-Spring 2022 level) until the end of 2024, before gradually returning to normal levels in line with the price before Summer 2021. This price trajectory is highly uncertain; there is a distinct possibility that gas prices will stay high much longer than our base assumption. Therefore, we have performed two model sensitivity runs for an even higher gas price (August 2022 level), maintaining this price for six and 12 years, respectively. This means record high gas price levels in Europe for six and 12 years, and almost record levels in other regions for six and 12 years. These are extreme variants, but nevertheless interesting to test in our model. If gas prices stay high for six years, then the share of gas in the global primary energy mix reduces from 23% now to 18% in 2030, and from 20% to 13% of Europe’s primary energy mix. If gas prices stay at record levels for 12 years, the 2040 energy mix is also dramatically changed; gas almost halves from 15% to 8% in Europe and reduces from 22% to 16% globally. The development of these shares by 2050 is similar — in other words the gas share will be lower ‘forever’. Among demand sectors, power generation will see the most dramatic cut in gas consumption, which is under- standable as this sector has most direct competition among multiple energy sources and technology alterna- tives. In manufacturing, the change is a little less, and less again in the buildings sector, though even there, natural gas use will reduce significantly when prices stay high. Use of other energy carriers will naturally grow if gas prices remain high, and in Europe, the biggest beneficiary will not be coal, but wind. The picture is a little different globally, with coal, oil, solar PV and wind all capturing roughly equal parts of the share lost by natural gas. The ETO model might not be able to capture all the nuances of gas prices remaining high for many years, as investor interests, public perception and additional policies would disturb the more cost-based competition we report on here. Still, the sensitivity results support the intuitive view that a high gas price over many years will damage the outlook for gas in the medium, long, and very-long term. We have assumed a natural gas price that remains high (late-Spring 2022 level) until the end of 2024, before gradually returning to normal levels in line with the price before Summer 2021. What happens if gas prices stay high for long? 4.4 SUMMARIZING ENERGY SUPPLY In this section, we summarize the primary supply of energy from all energy sources, including fossil fuels. Considerable losses occur in the global energy system. Energy is mainly lost when it is converted from one form to another — such as heat losses in a power plant convert- ing coal to electricity. Losses also occur during transport of energy, such as electrical power lost as friction in grids. World primary energy consumption is therefore consid- erably higher than final energy consumption, with conversion losses alone exceeding 100 EJ per year. Primary energy also includes the energy sector’s own use of energy to extract the energy itself. For some energy carriers this share is quite high, for example, around 12% of the primary energy consumption for natural gas. The historical and forecast world energy supply is shown in Figure 4.14 and Table 4.1. A key result from our analysis, as shown in the figure, is that global primary energy supply will peak within the forecast period. This will occur despite the expansion of the global population and economy. The amount of energy services such as heating, lighting, and transport will continue to increase with a growing and more prosperous population. However, energy-intensity improvement — a large share of it from electrification, but also from many other areas — means the energy services over time can be delivered with less use of primary energy. This is explained in more detail under Energy Intensity in Section 5.1. Primary energy supply will peak in 2036 at 643 EJ per year, a level 8% higher than today, then decline by around 3% by 2050. Primary energy had a marked decline during the pandemic, and a return to pre-covid levels is only likely to happen in 2023. Although we will see peak primary energy supply in the 2030s, this will not necessarily last. One main reason why energy consumption will decline to 2050, is the increased energy efficiency associated with continuous energy- efficiency improvements and a steady rise in the use of renewable electricity. Once this transition is complete,
  • 61.
    120 DNV Energy TransitionOutlook 2022 121 Energy supply and fossil fuels CHAPTER 4 further efficiency improvements must come from other sources. Sometime after 2050, primary energy supply might well start to increase again. The primary energy supply mix will change significantly over the coming 30 years. As described in the introduc- tion to this chapter, the fossil share will fall from 80% today to just below 50% in mid-century. The share taken by nuclear energy will be stable at 5% over the entire period, while the renewable share will triple from 15% today to 45% by the end of the forecast period. Within renewables, the large increase will be driven by solar and wind, which will see 18-fold and 12-fold increases in primary energy supply towards 2050, respectively. Solar will reach 15% and wind 13% of the global primary energy mix in 2050, with further growth expected beyond mid-century. Bioenergy and hydro- power will also grow, in both relative and absolute terms. The primary energy supply mix will change significantly over the coming 30 years. The fossil share will fall from 80% today to just below 50% in mid-century. Alternative ways to count energy There are several ways to calculate primary energy, each producing a different energy mix because every method assigns a different efficiency value to each energy source. The differences are most pronounced when measuring primary energy from non-combustibles, such as nuclear and renewables. As the share of renewables rises, differ- ences between the methodologies also increase. For primary energy of non-combustible sources, one view is that renewables are 100% efficient because the input energy (e.g. solar irradiation) is neither captured nor extracted, nor is it traded. Therefore, it is assumed to be outside the boundary of the energy system. Other analysts, however, assign a low conversion efficiency to renewables because, for example, solar panels convert only a small percentage of the solar energy that reaches them. These differences are apparent in the two most frequently used methods of counting primary energy: — The Physical Energy Content Method assumes that the thermal energy generated from thermal fuels is primary energy, while for non-thermal sources, such as wind, solar PV, and hydropower, the electricity generated is primary energy — The Substitution Method computes the primary energy content of non-combustible sources by determining how much fossil fuel would be necessary to generate the same amount of electricity. This method then ‘substitutes’ the efficiency of an average, hypothetical combustion power station for the efficiency of non-combustible sources. There are also variations of these two methods. The Direct Equivalent Method – used, for example, by the IPCC — resembles the Physical Energy Content Method, whereas the Resource Content Method resembles the Substitution Method. In our Outlook, we use the Physical Energy Content Method. This approach is in line with organizations such as Eurostat, IEA, and OECD, and allows for easy comparison with most other reference forecasts. Furthermore, the conversion of individual energy sources is directly compa- rable with the ‘tradeable energy’ metric, which is familiar to energy producers, and has a clear economic value as the energy that is produced is also sold. Put simply, whereas a tonne of crude oil and a day’s electricity generation from a solar PV panel are tradeable, a day of sunshine is not. Detailed conversion factor methods of our counting method, and more details of the alternative methods, are provided in DNV (2018b). The choice of energy-counting method significantly affects energy forecasts. If the Substitution Method was used instead, then peak energy supply would not be reached during the forecast period. Had we used that method, the argument that renewable energy and electricity have much higher efficiencies than fossil- energy sources would not hold; instead, we would have focused on the much lower carbon intensity of those energy sources. There are several ways to calculate primary energy, each producing a different energy mix because every method assigns a different efficiency value to each energy source. TABLE 4.1 World primary energy supply by source Units: EJ/yr Source 2020 2030 2040 2050 Wind 6 20 44 79 Solar 5 21 57 95 Hydropower 15 21 27 29 Bioenergy 57 73 74 76 Geothermal 4 5 5 5 Nuclear 28 29 33 31 Natural gas 149 149 143 123 Oil 159 179 156 118 Coal 157 139 99 66 Total 579 635 638 623 2020 2050 Nuclear, 5% Geothermal, 1% Geothermal, 1% Natural gas, 26% Hydropower, 3% Wind, 1% Bioenergy, 10% Solar, 1% Oil, 27% Coal, 27% Nuclear, 5% Natural gas, 20% Hydropower, 5% Wind, 13% Solar, 15% Bioenergy, 12% Oil, 19% Coal, 11% Nuclear, 5% Geothermal, 1% Geothermal, 1% Natural gas, 26% Hydropower, 3% Wind, 1% Bioenergy, 10% Solar, 1% Oil, 27% Coal, 27% Nuclear, 5% Natural gas, 20% Hydropower, 5% Wind, 13% Solar, 15% Bioenergy, 12% Oil, 19% Coal, 11%
  • 62.
    122 DNV Energy TransitionOutlook 2022 123 Energy supply and fossil fuels CHAPTER 4 COMPARISON OF ENERGY FLOWS: 2020 AND 2050 Direct Coal Oil Natural gas Bioenergy Geothermal Nuclear fuels Solar Wind Hydropower use Grid- connected thermal power stations Grid- connected non-thermal power stations PRIMARY ENERGY DIRECT USE AND TRANSFORMATIONS END USES Road Maritime Aviation Rail Pipelines Manufactured goods Base materials Iron and steel Construction mining Cement Petrochemicals Feedstock Space heating Water heating Cooking Appliances lighting Space cooling Transport Manufacturing Buildings Other FINAL ENERGY Energy sector’s own energy use Hydropower Bioenergy Hydrogen Grid electricity Direct heat Methanol Ammonia Oil Wind power Geothermal Coal Solar power Nuclear fuels Natural gas Direct Coal Oil Natural gas Bioenergy Geothermal Nuclear fuels Solar Solar power Wind power Hydropower use Biomethane production Solar and wind power stations dedicated to hydrogen production Hydrogen production Electricity storage Grid- connected thermal power stations Grid- connected non-thermal power stations PRIMARY ENERGY DIRECT USE AND TRANSFORMATIONS END USES Road Maritime Aviation Rail Pipelines Manufactured goods Base materials Iron and steel Construction mining Cement Petrochemicals Feedstock Space heating Water heating Cooking Appliances lighting Space cooling Transport Manufacturing Buildings Other FINAL ENERGY Energy sector’s own energy use 2020 2050 Direct Coal Oil Natural gas Bioenergy Geothermal Nuclear fuels Solar Wind Hydropower use Grid- connected thermal power stations Grid- connected non-thermal power stations PRIMARY ENERGY DIRECT USE AND TRANSFORMATIONS END USES Road Maritime Aviation Rail Pipelines Manufactured goods Base materials Iron and steel Construction mining Cement Petrochemicals Feedstock Space heating Water heating Cooking Appliances lighting Space cooling Transport Manufacturing Buildings Other FINAL ENERGY Energy sector’s own energy use Hydropower Bioenergy Hydrogen Grid electricity Direct heat Methanol Ammonia Oil Wind power Geothermal Coal Solar power Nuclear fuels Natural gas Direct Coal Oil Natural gas Bioenergy Geothermal Nuclear fuels Solar Wind Hydropower use Grid- connected thermal power stations Grid- connected non-thermal power stations PRIMARY ENERGY DIRECT USE AND TRANSFORMATIONS END USES Road Maritime Aviation Rail Pipelines Manufactured goods Base materials Iron and steel Construction mining Cement Petrochemicals Feedstock Space heating Water heating Cooking Appliances lighting Space cooling Transport Manufacturing Buildings Other FINAL ENERGY Energy sector’s own energy use Hydropower Bioenergy Hydrogen Grid electricity Direct heat Methanol Ammonia Oil Wind power Geothermal Coal Solar power Nuclear fuels Natural gas
  • 63.
    124 DNV Energy TransitionOutlook 2022 125 Energy efficiency and finance CHAPTER 5 5 ENERGY EFFICIENCY AND FINANCE Highlights Accelerating efficiencies in the production and use of energy are key to the transition and should be a top priority for a faster energy transition. As this chapter discusses, a more efficient energy system has important financial implications. There are also important linkages between energy efficiency and energy independence. Energy intensity (i.e. unit of energy per dollar of GDP) globally will be more than halved from 4.3 MJ/USD now to 2.1 MJ/USD by 2050. There is scope to reduce energy intensity even further, but that will require tighter regulation and deeper industry cooperation. Affordability: Expressed as a percentage of global GDP, global energy expenditures (strictly defined) will fall from 3.5% to 2% by 2050, implying a substantial green prize inherent to the transition, and opening up possi­ bilities for faster decarbonization. This year, we analyse energy expenditures at household level and find that these will generally decline in OECD countries, but in developing regions, e.g. the Indian Subcontinent, the growth of new forms of demand (e.g. appliances and space cooling) will see an increase in household energy spend. 5.1 Energy intensity126 5.2 Sectoral energy efficiency129 5.3 Energy expenditures131
  • 64.
    126 DNV Energy TransitionOutlook 2022 127 Energy efficiency and finance CHAPTER 5 5.1 ENERGY INTENSITY Energy efficiency can be measured in several ways. In the engineering sense, the ratio of energy input to useful energy output is the key metric. Economists are more likely to use the term ‘energy intensity’, which compares energy use to the economic production output of an industry. Primary energy intensity Primary energy intensity is measured as primary energy consumption per unit of GDP; the lower the number, the less energy intensive the economy in question is. Primary energy intensity, population growth, and GDP per capita growth together shape how global energy use develops. When the sum of these three parameters falls below zero, primary energy use will start to decline, and the world will start to use less energy, as illustrated in Figure 5.1. This figure plots energy intensity, population growth, and GDP per capita growth as annual average values within five-year intervals between now and 2050. After 2035, the reduction in energy intensity is stronger than the combined growth of population and GDP per capita. Hence, growth in global primary energy supply turns negative and primary energy supply peaks in the mid-2030s. In the final half-decade before mid-century there is a small uptick in global energy use growth. This is because, by then, nearly all electrical power will be generated by renewables and much of the end use that can be electrified will have been converted to electricity, leaving fewer opportunities for efficiency gains. From that point, however, it is likely that slower population growth and efficiency gains through automation and AI will, to some degree at least, offset rising energy use associated with continued GDP growth. Globally, energy intensity has been reducing by 1.7% per year on average for the last two decades, with spikes and troughs along the way. The COVID-19 pandemic intro- duced a new short-term spike, with varying fluctuations in both energy consumption and GDP. Over our forecast period 2020 to 2050 — in which we foresee a doubling (120%) of global GDP and an 8% increase in primary energy consumption — energy intensity will be more than halved from 4.3 MJ/USD to 2.1 MJ/USD. Irrespective of the short-term impacts of the pandemic and of the war in Ukraine, energy intensity will continue to decline faster than in previous decades, dropping by 2.3% per year on average over the next 30 years, as illustrated in Figure 5.2. In the 2040s, the energy-intensity improvement tapers off somewhat because, as noted above, there will be fewer opportunities for further efficiency gains in power generation and energy end use. Economies dominated by the service sector (tertiary sector) often manage to grow without directly increasing regional energy use. (e.g. financial services or consulting). However, if regional changes in energy intensity are measured as the sum of changes in national energy intensities, the result fails to capture inter-regional trade. Manufacturing has to a large extent been outsourced from Europe and North America to Asia over the last decades. Therefore, we do not focus on regional ener- gy-intensity forecasts in this section but review intensity on a global basis, which indicates the overall gains in efficiency. Energy independence and energy efficiency The record-high fossil fuel prices and electricity prices as of 2022 in certain regions have positioned energy-effi- ciency measures as being among the most important tools to increase energy security as part of a path towards energy independence — a high priority now for many countries and regions. High prices for consumers and industry automatically drive incentives for reducing energy use and implementing efficiency measures. In addition to price-driven energy-efficiency measures, regions will most likely implement strategic efficiency measures to further reduce wasteful energy practices. These latter measures can free up energy resources that could fuel more essential end uses, such as heating homes, cooking, and manufacturing value add. This can be attractive for geopolitical reasons, such as Europe trying to limit dependency on Russian gas, or Japan tackling high energy bills associated with its dependence on imported gas.
  • 65.
    128 DNV Energy TransitionOutlook 2022 129 Energy efficiency and finance CHAPTER 5 Electrification and energy losses Energy losses can be measured for each stage of the energy system; in other words, during production, energy transport, and end use. Converting the losses to efficiencies are described below as sectoral efficiencies. Energy losses, resulting from conversion processes (e.g. burning coal to produce electricity) or energy transport (e.g. heat losses from power lines) make energy output smaller than the input. However, it is more relevant to look at ‘useful energy’. Some of the heat generated by a power plant, for example, can be used for district heating, while venting it is considered wasted energy. The aim is to avoid or minimize energy transformations that are either unusable or not needed; for example, heat from an industrial process that is vented directly to the atmos- phere. The Sankey diagram at the end of Chapter 4 (page 122) illustrates energy losses to heat in the generation of electricity. These will be substantially less in 2050 than today because more electricity will come from renewable energy generation with negligible heat losses. The acceleration of electrification, especially from renewables, is the main driver of energy-intensity improvements in the future. More rapid electrification leads to accelerated efficiencies throughout an energy system. As the renewable share of electricity rises, energy intensity benefits from smaller heat losses during power generation. The typical thermal efficiency for utility-scale electrical generators is some 30% to 40% for coal and oil-fired plants, and up to 60% for combined- cycle gas-fired plants. In comparison, solar PV and wind generation are 100% efficient according to the widely accepted Physical Energy Content Method of counting energy. A discussion on calculating primary energy can be found in Chapter 4. Efficiency improvements in the energy system will slow down in the 2040s when most of the electricity system already is renewable, and losses are small. Without any energy-efficiency improvements, global energy demand would increase 73% by 2050, in sharp contrast to the almost flat development that we forecast. UN Sustainable Goal #7 to double the rate of improvement in energy intensity will not be met. Sustainable Development Goal #7 focuses on Affordable energy and clean energy for all. A sub-target is to double the rate of improvement in energy efficiency, which accord- ing to our forecast will not be met. Our forecast shows an improvement to 2.3%/yr from 2015 to 2030 which is much higher than the 1.6% historical rate between 2000 to 2015, but not double as targeted under SDG #7. 0,0% -0,5% -1,0% -1,5% -2,0% -2,5% -3,0% -3,5% 2000-2015 annual energy intensity improvement -1.6%/yr -2.3%/yr -3.2%/yr 2015 - 2030 annual energy intensity improvement (f) SDG energy intensity target 5.2 SECTORAL ENERGY EFFICIENCY The demand for energy services — for example, for transporting passengers and goods, heating and cooling buildings, or producing consumer goods — grows as a function of population and economic activity. Technolog- ical, process and efficiency improvements will typically counter some of the growth in demand, sometimes even leading to decline in energy demand despite growth in energy services delivered. Such improvements are the result of activity changes, technology efficiency gains, and structural shifts. — Activity changes: More people, more buildings to heat and cool, and longer distances travelled all increase the total amount of activities. Other activity changes, like the impact of COVID-19 on business travel, reduce activity levels and/or contribute to slower rates of activity increase. — Technology efficiency improvements: In the various energy-demand sectors, several such improvements continuously drive down energy use per service delivered. Examples include more-effective engines or improvedhullhydrodynamicsandvehicleaerodynamics. — Structural shifts take three principal forms: — Technology shifts: Occasionally, services are better delivered by replacing one technology with another. Examples are replacing a combustion engine with an electric motor, or cooking with gas or electricity instead of burning solid biomass. These changes are often termed ‘efficiency improvements’, which is correct in the sense that they improve the efficiency of the process. However, the underlying service itself does not change; the improvement is due to the use of a new technology. Structural shifts normally reduce energy use. — Service shifts: Sometimes, there are structural changes in the service delivered, such as bigger cars. These shifts can be connected with rebound effects — for example, setting a higher temperature threshold in your house because heating is cheaper or more effective. These shifts may counter technol- ogy-led improvements and lead to higher energy use; in other cases, they might reduce energy use. — Regional shifts: When looking at global numbers, we sometimes have structural changes from regional shifts; for example, in the offshoring or nearshoring of manufactured goods production. Such structural changes might lead to both higher and lower energy use. In our overview (page 130, Figure 5.3), structural shifts are grouped, as it is often impossible to separate one effect from another. Standards and policies Efficiency improvements reduce energy use and/or costs. The ‘cheaper and/or better’ mantra has always been the main driver for technology innovation. But sometimes policy interventions, in the form of efficiency and perfor- mance standards (e.g. technical retrofits, building codes, fuel-efficiency standards) play an important role, as discussed in Chapter 6. We note that in countries with mandatory efficiency policies, growth in energy use or emissions is subdued. Policy frameworks help to direct investment towards energy-efficiency initiatives that otherwise tend to be overlooked by investors. There are severalreasonswhysuchinitiativesareneglected,including thedifficultyofcalculatingdirectreturnsandthepossibility that benefits accrue to parties other than the investor. The present technology and policy momentum is further accelerated by the high energy costs and geopolitical considerations of energy dependency — which further leads to growth in efficiency improvements across all sectors. We find that without any energy-efficiency improvements, global energy demand would increase 73% by 2050, in sharp contrast to the almost flat develop- ment that we forecast. This is illustrated for the main demand sectors in Figure 5.3. The potential to improve efficiency yet further is huge and will be sought after for geopolitical reasons as well as the need to achieve a faster energy transition that is closer to the Paris Agreement ambitions. Chapter 8 — Pathway to net zero emissions, describes our scenario for howtolimitglobalwarmingto1.5°C.
  • 66.
    130 DNV Energy TransitionOutlook 2022 131 Energy efficiency and finance CHAPTER 5 Transport is dominated by road transport, with vehicle kilometres almost doubling over the next 30 years (shown as activity change), though aviation also grows 130% from pre-pandemic levels and maritime transport 45%. In 2050, EVs account for 90% of all passenger km and 74% of the cargo km, and this structural change dramatically reduces energy use. Efficiency improvements in remaining combustion engines, aerodynamics in aviation, and vessel utilization also contribute to the overall 6% energy reduction from pre- pandemic levels and 8% increase from 2020. Over the forecast period, the activity change for manufac- turing includes a 70% increase in base materials, construc- tion, and mining; a 68% rise manufactured goods (measured in USD output); and a 11% reduction for steel and iron (in tonnes of steel produced). Structural changes (e.g. in regional shifts) give a reduction in energy use, while efficiencies in all the manufacturing processes also contribute to a total energy use growth of 20% for the manufacturing sector over the coming three decades. EJ/yr 106 +120.8 −56.5 114.8 −55.6 2020 2050 Activity Chg. Structr Chg. Eff. Gain. 250 200 150 100 50 0 Transport EJ/yr 2020 2050 Activity Chg. Structr Chg. Eff. Gain. 250 200 150 100 50 0 120 +88.3 −30.2 −29.6 148.3 Buildings EJ/yr 2020 2050 Activity Chg. Structr Chg. Eff. Gain. 250 200 150 100 50 0 134.8 +55.5 −4.2 −24.6 161.4 Manufacturing Activity-wise,totalbuildingsfloorareagrows64%inthe forecastperiod,buttheincreaseinenergyservicesinbuildings variesconsiderablyfromcooling,whichgrowsalmostsix-fold, toheating,whichgrowsby10%.Moremodernheating technologies(e.g.heatpumps)andupgradestowaterheating andcooking(e.g.switchingfromtraditionalbiomasstogasor electricity)invariousregionscontributetothestructural improvements.Efficiencygainsarelargestincoolingand lighting.However,overallbuildingssectorenergyusestill grows24%overtheforecastperiod. FIGURE 5.3 Sectoral energy efficiencies in transport, buildings and manufacturing Demand side flexibility For policymakers, we call special attention to the scale of efficiency, and hence financial, gains that can be achieved through demand-side flexibility across regional power systems. Demand-side flexibility involves the percentage of system demand that can be increased, reduced, or moved over a specific, planned, time period and includes, for example, electric heating and transport. In a recent, commissioned report, DNV demonstrates how the judicious use of demand-side flexibility tools can lead to annual savings of hundreds of billions of dollars across Europe if these mechanisms are fully deployed in the coming decades (Smart Energy Europe and DNV, 2022). The energy transition we forecast is not only affordable but leads to considerable savings at a global level. Some aspects of the transition, like the roll-out of renewables or grid build-outs, will require very large upfront invest- ment. This is why some consider the transition to be ‘unaffordable’. Our results suggest the opposite, with energy costs remaining stable and energy expenditures representing a declining share of global GDP. This is a startling conclusion from the perspective of policymakers — i.e. that far from coming at a green premium, the energy transition in fact involves a substan- tial green prize, paying dividends to society for genera- tions to come — and is something that DNV has emphasised consistently over the years in our annual Energy Transition Outlooks. This year, we call attention to the fact that our findings are borne out by a study conducted by researchers at the Oxford Martin School at Oxford University, and published in the journal Joule under the title' Empirically grounded technology forecasts and the energy transition' (Way et al., 2022). The authors find that: Compared to continuing with a fossil fuel-based system, a rapid green energy transition will likely result in overall net savings of many trillions of dollars — even without accounting for climate damages or co-benefits of climate policy. Far from coming at a green premium, the energy transition in fact involves a substantial green prize. Expenditure definition Contrary to other modelling frameworks, such as the IEA’s TIMES and the EU’s PRIMES, our approach does not ensure the global optimality of solutions. However, in many sectors — such as power production, upstream oil and gas, and energy use in manufacturing — we use a merit-order, cost-based algorithm. This has been estab- lished on the basis of production costs in energy sectors (power, oil, and gas), to drive the selection of energy sources / production technologies / regions over each other through time. There are various definitions of ‘energy expenditure’, and we have chosen to use a strict definition. We have therefore included only fossil-fuel extraction, transport, and refinement such as liquefaction, regasification, refineries, and conversion to hydrogen and electricity. Similarly, all costs in the power sector are incorporated (includingpowergrids,storagecapacityandtheinstallation and operation of renewable energy plants). However, we have excluded investments in energy-efficiency measures, as well as in downstream carbon-mitigation costs. Nor do we incorporate costs related to end-use spending (in manufacturing, transport and so on). What actually constitutes a subsidy deserves a chapter in its own right, and we have decided to adopt a simplified approach. The modelled subsidies that we report in this Outlook are seen as support that benefits consumers and are not counted as energy expenditures. Likewise, fuel taxes are not included. Although the simulated decision making in our model discounts expected future cash flows, in this chapter we reportannualsectoraloutlaysintermsofCAPEXandOPEX. 5.3 ENERGY EXPENDITURES
  • 67.
    132 DNV Energy TransitionOutlook 2022 133 Energy efficiency and finance CHAPTER 5 World energy expenditure We consider energy expenditures as the upstream costs related to energy production and transport to the user (see definition on previous page). Using this definition, total world energy expenditure was USD 4.9trn in 2021 (our reference year for this section). We project world energy expenditure to increase 26% to USD 6.2trn by 2050, due mainly to the rise in final energy demand. Note, as we discuss at the end of this chapter, how this 26% expenditure rise compares with the projected global GDP increase of 120% over our forecast period. The unit cost of energy will stay stable around 11-12 USD/ GJ over the forecast period, even if the world energy expenditure by source shown in Figure 5.4 will be totally reshuffled. In 2021, fossil fuels made up 71% of the total world expenditure but we forecast that this share will almost halve to 36% by 2050. In contrast, both grids and non-fossil energy will almost triple their shares, which means all three (including fossil) will have roughly equal shares. Not only do the relative shares change, the absolute USD values of expenditures under these three categories also change. Between 2021 and 2050, fossil expenditure will reduce 40% in USD terms, non-fossil will triple, and grids will also almost triple. Capital and operating expenditures Figure 5.5 presents the breakdown of CAPEX and OPEX for the categories: fossil, non-fossil, and grids. The expenditures are presented as an average expenditure over 10 years leading up to 2020, 2030, and so on. As seen in Figure 5.4, there is a successive reduction in fossil CAPEX, as the world shifts increasingly to non-fossil energy. While CAPEX declines continuously, fossil OPEX continues to increase in the 2020s and 2030s because of continuing use of upstream infrastructure built leading up to the 2020s. The increase in OPEX between 2020 and 2030 is due to the Ukraine war. Less expensive fossil fuel from Russia and Ukraine sees a supply choke. This leads to marginally more expensive fossil fuels being exploited to cover the short supply, which also leads to higher OPEX. We project a structural shift away from fossil CAPEX and OPEX from the 2030s. The succeeding decades will see less and less such CAPEX and OPEX. In contrast, non- fossil and (connected with it) grids will see successive increases in OPEX and CAPEX. Renewables are CAPEX- heavy, and we project CAPEX almost twice as high as OPEX, despite the uninterrupted decade-to-decade increases in OPEX, as seen from Figure 5.5. Non-fossil expenditures In terms of the breakdown of non-fossil expenditure, we foresee large growth in solar+storage and fixed offshore wind, from relatively small levels in 2020. But, established renewable technologies such as solar PV and onshore wind continue to dominate in terms of absolute numbers in our forecast (Figure 5.6). We expect floating offshore wind to experience tremen- dous growth in expenditures, but from a very small level in 2020. On the other hand, solar PV and onshore wind see a three-fold increase in expenditures from 2020 levels by 2050. Given that these technologies are already established today, it is unsurprising that their expenditure growth rates are not as high as for floating- offshore wind. Regional transitions in energy expenditures The transition away from fossil fuels, and the related general trend towards relocation of energy production to a more regional level, will induce important transfers in expenditures. Investments in fossil production will increase in regions such as Middle East and North Africa, at least in the short term. Figure 5.7 shows the change in energy expenditures in North America, Middle East and North Africa, and Europe. These three Outlook regions are selected to contrast how the transition is expected to unfold in terms of expenditures in two fossil-fuel producing regions (North America, Middle East and North Africa) and one (Europe) with relatively less fossil-fuel produc- tion and already ahead of the curve in the transition to non-fossil energy. Both North America and Middle East and North Africa have lower CAPEX for fossil fuel in 2050 compared with in 2021. That said, North America’s CAPEX starts reducing after 2030, while Middle East and North Africa’s transition away from fossil-fuel investments happens a decade later. Even more significantly, OPEX in Middle East and North Africa keeps increasing, thus implying that the region will go on producing fossil fuels and operating existing fossil-fuel infrastructure at increasingly high levels from now until 2050 at least. In contrast, North America’s OPEX starts declining after 2030, signalling the start of its gradual transition away from operating fossil-fuel infrastructure.
  • 68.
    134 DNV Energy TransitionOutlook 2022 135 Energy efficiency and finance CHAPTER 5 Interestingly, in the short term, all regions have increasing CAPEX for non-fossil energy. But in the 2040s, this CAPEX stabilizes in Europe, indicating that almost all the non-fossil investments for the region will have been made by mid-century. All regions presented see an increase in grid expendi- ture. Given the electrification we forecast and increasing peak power demand (see Chapter 2 on electricity and grids), electricity networks needs investment in expan- sion, security, congestion management and balancing. A declining share of GDP Despite massive investments in high capital-cost renewa- bles and electricity networks, the share of global GDP allocated to energy expenditures will fall steadily. Figure 5.8 shows this share declining from 3.4% in 2021 to 2.1% by mid-century. This is a significant finding from our forecast: by mid-century, energy will be both relatively cheaper (as a percentage of GDP) and more affordable at a societal level, given that the energy system itself will be substantially more efficient. The affordability and acceptability of the transition will not be driven solely by energy cost, as discussed in the 'Affordable for whom?' sidebar. However, the declining share of GDP, and stable energy costs, show that from this standpoint a faster transition is possible, as discussed in more detail in Chapter 8. As explained in this chapter, the energy transition is affordable from a global perspective. However, this conclusion is usually not shared by consumers. Several social movements such as the gilets jaunes ('Yellow vests’) in France have shown that the acceptability of the transition is not automatic. The first reason is that expenditures are not market prices paid by the consumer, which include margins, taxes and/or subsi- dies. The gap is especially visible in the current context of high energy prices, with energy producers making exceptional profits while their production costs are not increasing. The second reason is that the transition also implies important investments, both from industries (new production plants) and individuals (buildings insulation, electric cars, heat pumps). Although these investments might be profitable over the long term, upfront costs and lack of visibility on the future regulations and economic situation can favour the status quo. Figure 5.9 forecasts trends in household energy expenditures in North America, Europe and the Indian Subcontinent. This household energy expenditure includes CAPEX for residential space heating and cooling (such as cost of air-conditioners), water heating (such as cost of heat pumps) and cooking (such as cost of electric stoves) and OPEX, which is the energy costs and energy taxes, of running all the household equip- ment and passenger vehicles. In the short term, households in Europe will see their energy expenditure rising sharply until the energy supply shocks are alleviated around 2025. By the late 2020s, household energy expenditures in Europe will be around the same levels as in 2021, in nominal terms. The subsequent decades will see stabilization of household energy expenditure at levels 10% less on average than in 2021, and gradually declining to 30% less by mid-century. North America follows a similar trajectory, without the sustained price shock in the period 2022–2025. In both Europe and North America, the benefits of investing in cheap renewable electrification are felt by households through generally cheaper energy. Similarly, the Indian Subcontinent will see its household energy expenditure going up in the short term owing to price shocks, but gradually stabilizing at almost the same level as 2021 around 2030. However, increasing electrification, especially residential air-conditioners, and higher household energy consumption, sees its household energy expenditure gradually increasing to 30% above the 2021 level by mid-century. Note that over this period, average GDP per capita increases by a factor of more than three across the Indian Subcontinent. Energy costs are also embedded in products and services, but our results show that the energy transition will at least have a positive impact on the visible part of these costs, which is the direct energy expenditure paid by households: direct household energy expenditure. Affordable for whom? FIGURE 5.9
  • 69.
    136 DNV Energy TransitionOutlook 2022 137 Energy efficiency and finance CHAPTER 5 In our Financing the Energy Transition report (DNV, 2021b), we discussed in detail how governments, banks and investors price risk for multi-decade energy projects amid a changing energy order and an ever-more impor- tant climate agenda. To produce a forecast to 2050, DNV makes assumptions about today’s cost of capital (CoC) per technology, and about the speed and direction of capital reallocation up to 2050. Are companies that reduce their emissions in line with net zero rewarded by the capital markets with a lower cost of capital? Are investors and governments in oil-rich regions like the Middle East seeing increased risks for financing new oil and gas projects in 2050? These questions need defendable answers to set CoC across the globe. Cost of capital is one of the key cost drivers for capital- intensive purposes – for example, new power generation projects, investment in power grids and gas infrastruc- ture, equipment in buildings, and infrastructure for zero-emission vehicles. We use levelized cost to compare competing technologies, where the ratio of lifetime costs to lifetime generation (e.g. electricity or hydrogen production) is discounted back to a common year using a discount rate that reflects the cost of capital. With lower discount rates, the break-even price that satisfies equity and debt returns reduces. Hence, predicting the compet- itiveness of, for example, competing power generation technologies now and in the future requires accurate CoC predictions. We therefore continue to focus on the granularity of the CoC inputs. Cost of capital inputs to the ETO The CoC is largely decided by three variables: 1) The cost of debt; i.e. the combination of the risk-free rate and the risk premium (or ‘margin’), together often referred to as borrowing costs 2) The cost of equity; i.e. the equity return required by investors 3) The ratio between 1) and 2) above; i.e. the ‘leverage’ The main driver for these variables is risk perception. To give two examples: financing a greenfield coal-fired power generation project today is less risky than financ- ing such project in 2040. In contrast, financing green hydrogen production will be perceived as riskier today than in 2040, at which time the technology is likely to have matured and been proven in both production and end-use sectors. In addition, a mature market by then for green hydrogen will result in lower risk, lower borrowing costs, lower equity-return requirements from investors, and higher leverage, all driving down the cost of capital. These examples illustrate both the difficulty and dynamic nature of setting assumptions on the cost of capital. ETO cost of capital categories We categorize our inputs under the following technology headings and assumptions: — Solar PV, hydropower, onshore wind and fixed-bottom offshore wind. Cost of capital in the OECD regions and Greater China for mature renewables will be stable over the modelling period. For emerging markets, the CoC for these technologies is expected to reduce due to the economic development of these regions rather than perceptions of technology risk. — Blue and green hydrogen, floating offshore-wind, small-scale nuclear. Cost of capital for these emerging energy-transition technologies is higher today because of their greater technology and market risks. The CoC reduces only slightly before 2030, then falls towards parity with mature renewables in 2050. — Oil and gas upstream, midstream, and downstream, including grey hydrogen and gas-fired power generation. We expect only a slow upward trend in CoC in most regions because of a perception of increased risk associated with the lifetime of projects. The CoC for new oil and gas projects in Middle East and North Africa, and North East Eurasia — two regions with large, low-cost oil and gas resources — will remain stable through to 2050, with capital available from government enterprises. — Coal-fired power generation. Investors already perceive coal as significantly higher risk than other fossil fuels or renewable-energy projects, as evidenced by a clear increase in loan spreads over the past decade. We expect a rapid upward trend in CoC due to reduced availability of capital, a trend that has started in most regions and will reach the Indian Subcontinent, South East Asia, and Sub-Saharan Africa from 2030. Reduced capital availability is exemplified by Chinese, South Korean, and Japanese commit- ments to not build and finance new coal-fired power projects abroad. — Large-scale nuclear. We expect CoC to be low, stable, and to reduce slightly over time, supported by expec- tation that the market will move increasingly towards becoming a low-risk one in which returns are regulated, like currently observed in the UK, where policy moved away from CfD towards a Regulated Asset Base. Our forecast is mostly dependent on CoC levels varying betweenthedifferenttechnologycategories.Thecurrently observed increase in risk-free interest rates in regions such as North America and Europe affect all technologies equally, meaning the impact on our forecast is low. Cost of capital is derived for all 10 of our Outlook regions — today and through to 2050. Figure 5.10 shows the inputs for Europe and the Indian Subcontinent. Other regions’ inputs are differentiated based on country risk premiums, funding methods, and technology preferences. How will cost of capital evolve? FIGURE 5.10
  • 70.
    138 DNV Energy TransitionOutlook 2022 139 Policy and the energy transition CHAPTER 6 6 POLICY AND THE ENERGY TRANSITION Highlights 6.1 The policy landscape shaping the transition140 6.2 Drivers and barriers142 6.3 Key regional policy developments146 6.4 The policy toolbox148 6.5 Policy factors in our Outlook154 In this chapter we explore the role of policy in the energy transition and describe 12 policy considerations directly factored into our Outlook. The energy transition sits in a context of multiple geo­­ political uncertainties instigating a leap forward in policies for achieving energy security and diversification, in addition to preventing climate change and protecting planetary boundary conditions. We discuss a series of drivers of, and barriers to, the energy transition. These create uncertainty over the speed of transition; however, our interpretation is that drivers continue to outweigh barriers, and that stakeholders will not lose sight of long-term risks and transition opportunities. We then feature key policy developments from our forecast regions since last year’s Outlook. We outline our view on a policymaker’s ‘toolbox’ to advance the transition. Some nations are applying, or are expected to apply, this toolbox fairly comprehensively; others less so. This is followed by a discussion of expected carbon price developments across Outlook regions. We conclude by describing the steps in our policy analysis and approach to derive the policy factors included and applied regionally across our forecast period.
  • 71.
    140 DNV Energy TransitionOutlook 2022 141 Policy and the energy transition CHAPTER 6 6.1 THE POLICY LANDSCAPE SHAPING THE TRANSITION This chapter explores the role of policy in the energy transition. We include geopolitical developments, along with both policy drivers and barriers that impact the nature and pace of the transition. We outline a policy ‘toolbox’ covering a range of policy choices that governments could make to drive the energy transition. This year’s Outlook is published at a time of multiple uncertainties likely to impact energy developments, including inflation, food insecurity and disrupted supply chains. These were in train by the pandemic and have been intensified by Russia’s invasion of Ukraine. The war has sparked a rush for energy independence, both geographically and in terms of energy sources used. Against these short-term pressures, must be weighed the continuing commitment to, and goal setting under, the Paris Agreement . It is through this prism that the world aspires for a mission-oriented energy transition to solve planetary, economic, and human-development challenges. Our Outlook is set in a context where today's central difficulty for policymakers is to manage short-term energy supplies without making decisions or investing in energy infrastructure that could undermine long-term societal goals. Energy systems in need of government intervention Policymakers face a long list of urgent challenges — providing energy access, reducing carbon emission and air pollution, adapting to global warming impacts, preserving the environment, securing energy supply, tackling inflation and addressing the swelling food and energy prices. The urgency of these issues means governmentinterventionsinenergysystemsareobliga- tory. Most of these challenges have market failure as a contributory element; for example, the widespread failure to price in externalities associated with fuel use. Others are explained by geopolitical factors. However, they all warrant policy action. John Stuart Mill, the philosopher and political economist, argued that “the only purpose for which power can be rightfully exercised over any member of a civilized community, against his will, is to prevent harm to others”. Economist Robert H. Frank recapped the statement (NYT, 2021) explaining the need for government involvement in the economy due to the failure of individual and collective interests to coincide in addressing the greatest threats facing society. There are strong arguments for an active role for both state and markets in energy systems. Whereas markets may be good at optimizing scarce resources and doing so at least cost, they need regulatory frameworks in which to function and government policy that catalyses growth areas, de-risks activities by creating a level playing field, and provides direction towards desired societal goals (e.g. Paris Agreement, UN 2030 Sustainable Development Goals, Biodiversity Convention). Mixed policy signals Signals on the energy transition are presently mixed. On the one hand, there is progress towards decarbonization, albeit beneath the fog of unsustainably high emissions. Policymakers are responding to the attractiveness of renewables in terms of employment, longer-term efficiencies, and energy security. Renewable build-out is being advanced by governments in all regions. Front- runner transition regions, such as Europe, are building a nexus of climate and trade policies to sustain low-carbon investment and employment with carbon-border adjustment mechanisms (CBAM). At the same time, regulation of fossil fuels has loosened recently to increase oil and gas output and expand infrastructure, despite the obvious climate-related risks and the danger of perpetuating carbon lock-in with renewed fossil-fuel dependencies. Hydrocarbon prod- ucers are responding by fast-tracking new production although demand for these resources will start to decline within the next decade owing to sustainability pressures and the technological transition. Overall, the risk that these assets will become stranded, placing a drag on economies in the medium-to-long term, has risen sharply. Stakeholders align on advancing the transition While policy analysis is challenging during a period of upheaval, the advancement of renewable energy has been resilient, showing record-breaking expansion. The huge, untapped potential for renewables in emerging markets is also receiving heightened attention. In today’s risk picture, companies and government alike are increasingly hedging decisions against high prices to protect inhabitants and industry. Compelling project economics and compara- tively brief development lead-times to bring renewable plants on stream are helping to tilt policy support in favour of renewables in the short term, with long-term energy security as an additional motivation. Given the cost of inaction in terms of economic and human losses from chronic and acute climate impacts along with degradation of nature (see for example Swiss Re, 2021; Allianz, 2022; EU, 2022; NOAA, 2022), DNV expects that investors, insurers, regulators, and policy- makers alike, will not lose sight of long-term risks and will support business models centred on transition opportu- nities. We do not anticipate a reversal of climate commit- ments due to the war in Ukraine; the short-term scramble for hydrocarbons is overshadowed by a renewed focus on energy security, and this strongly favours renewables. The transition will also be invigorated by efforts to stop downward-spiralling crises. Interconnected challenges (e.g. biodiversity, climate, energy access) are expected to be increasingly tackled together to leverage co- benefits from the same investment. Thus, we expect a deepening of regulatory efforts to propel energy-system evolution with decarbonization and accountability/ responsibility along energy value chains. Figure 6.1 presents a snapshot of the policy factors in the analysis. These factors are described in more detail in Section 6.5. FIGURE 6.1 Policy factors included in our Outlook 1. Renewable power support 7. Bans, phase-out plans and mandates 2. Energy-storage support 8. Carbon pricing schemes 3. Zero-emission transport 9. Taxation of fuel, energy, carbon and grid connections 4. Hydrogen support 10. Air pollution intervention 11. Plastic pollution intervention 12. Methane intervention 5. Carbon capture and storage support 6. Standards for energy efficiency
  • 72.
    142 DNV Energy TransitionOutlook 2022 143 Policy and the energy transition CHAPTER 6 6.2 DRIVERS AND BARRIERS The aim of this section is to capture trends in terms of those drivers triggering change and the opposing forces in the form of barriers that seek to uphold status-quo behaviour or otherwise hinder the transition. Technology and energy transformations do not progress in a perfectly linear fashion and the transition will not occur without friction, or, as the Austrian economist Joseph Schumpeter (1942) termed it, “creative destruction” when technology or system innovation diverges from and destabilizes the established way of doing things. Nations are not in control of these trends but their policymakers must manage the inherent tensions in order to arrive at progressive policy choices. In isolation, the drivers and barriers are challenging to connect to our forecastbutacomprehensivearrayofpolicyconsiderations, which cuts across these issues, is included in our analysis (see Section 6.5). The sum of our insights on these trends, is that drivers continue to outweigh barriers, however not equally in all regions, and certainly not to the extent required by the Paris Agreement. DRIVERS DRIVERS BARRIERS BARRIERS Failure to progress collectively on global agreements Despite unequivocal science and its compelling evidence (e.g. glacial retreat, sea-level rise, extreme weather events, species loss), political and business decision making is generally not science-based, and actions are often ‘too little, too late’, failing to drive the transition at the required rate. Deglobalization and economic disintegration are inhibiting collective action and blocking international flows of capital. Disunited policy hinders progress on environmental protection, weakens efforts towards energy transition, and widens the gap between leading countries and followers. Systemic change and response There is a great deal of scientific evidence (IPCC 2021, IPBES 2019, Rockström and Gaffney, 2021) that overlapping and mutually reinforcing crises are associated with the degradation of ecosystems and climate change. Any effective response must be at the level of systems, guiding energy, land, and ocean management. Actions taken in line with the UN Biodiversity Framework — the ‘Paris Agreement for Nature’ — will have a broad effect, including decarbonization of the energy system, and will add to the considerable momentum towards this goal generated at COP26 and the Glasgow Climate Pact, which kept the 1.5°C target alive. 1. Energy security returns to the fore Russia’s invasion of Ukraine and use of energy as an economic weapon, has spurred efforts to replace unreliable energy commodity imports. There is a congruence of Covid-19 recovery, climate response, and energy-security strategies. The best and most effective results are achieved through diversification, domestic renewable-energy production and low-carbon hydrogen for a clean and energy-secure future with predictable consumer prices. The World Energy Pulse (World Energy Council, 2022) expects the pace of energy transitions to increase. A pivot towards more fossil fuels? Destabilized energy markets and soaring energy prices make it difficult for governments to handle the energy trilemma (security / equity / sustainability) while securing short-term energy needs. Supply constraints, high fossil-fuel prices, and windfall profits for producers are boosting exploitation of hydrocarbons. Across the world, new fossil infrastructures are planned to enable exit from dependence on Russian energy. Unless these are designed to be transi- tion ready (Bordoff et al., 2022), they will undermine the Paris Agreement goals. 2. Surge in net zero pledges A net zero stocktake report (Net Zero Tracker, 2022) indicates countries with net zero targets encompass 83% of global emissions and 91% of GDP. The share of targets included in domestic legislation/policy documents has risen substantially (around 65% of total GHG coverage, compared with 10% in 2020). A UN high-level expert group on net zero commitments (UN, 2022a) is developing clearer standards for non-state entity pledges to speed up emission cuts. Climate clubs of first-mover net zero countries will trigger transition efforts world-wide given exposure to carbon-border tariffs. Net zero disunity and hypocrisy Net zero plans in low- to middle-income countries extend beyond mid-century, but climate science indicates that emission cuts must happen in a 2030/2050 timeframe. Arguing for these timelines to accelerate is hypocritical when high-income, net zero regions grapple for fuels, shield consumers from energy price shocks, and/or ease policy measures normally advocated as incentives to reduce emissions. Non-fulfillment of the annual USD 100bn pledge from developed to developing countries not only jeopard- izes climate justice, but also delays economically viable decarbonization projects. 3. Renewables power on despite economic upheaval Wind and solar PV are the least-cost electricity options, and fossil energy price shocks make the economic case for non-fossils more compelling. Hedging against price volatility favours domestic renewable energy, despite increased upfront costs. Decarbonization costs are increasingly part of energy-investment decisions when calibrating alternatives, and offtakers such as corporate tech giants are increasing their spending on renewables (Nasdaq, 2022). Despite supply-chain disruptions and inflation affecting all industries, renewable-energy capacity continues to expand globally. Annual renewable capacity additions broke new records in 2021, increasing by 6% to almost 295 GW (IEA, 2022b). Reinvented globalization adds costs Pandemic-related lockdowns, manufacturing delays, and economic volatility have fuelled efforts to reshore industries to ensure supply-chain reliability. Industrial policy and transition investment also aim to build things ‘at home’ and boost employment. Geopolitical risks have given rise to the concept of ‘friend-shoring’ (WTO, 2022), i.e. trading with political allies, with corresponding reinvention of supply chains, and materials and components sourced from partners rather than global markets. Reinvented globaliza- tion prioritizes security over efficiency and lowest cost, likely making the transition more costly. 4. Insight The momentum behind the Paris Agreement, with constantly improving measurements and ratcheting up of targets, will force leading global businesses and most governments to become part of the solution, despite reluctance to embrace the logic that economies cannot prosper in collapsing ecosystems. Insight Policymakers need far greater global co-ordination on net zero pledges, and these need to be made in the context of how much decarbonization is viable and where. Consensus on these issues is likely to emerge, but will be messy, late and, consequently, require enormous investment in carbon capture/removal and storage. Insight The pursuit of energy security, particularly in Europe, will accelerate the transition to renewable energy and hydrogen in the medium term, trumping the short-term doubling-up of hydrocarbon production. However, only if Europe, and other sanc- tion-imposing countries, persuade other countries to diversify their energy sources, will this affect the global demand for fossil fuels and accelerate the green transition globally. Insight Deglobalization has gained momentum in the wake of supply-chain shocks and Russia’s invasion of Ukraine. However, the world remains largely globalized and, although rising prices will add to the transition costs, renewables will continue to win out as the least-cost, most energy-secure option.
  • 73.
    144 DNV Energy TransitionOutlook 2022 145 Policy and the energy transition CHAPTER 6 DRIVERS DRIVERS BARRIERS BARRIERS Inadequate investments and de-risking There is a massive investment gap where financial flows are a factor of three to six times lower than the levels needed by 2030 to limit warming to below 2°C (IPCC, 2022). Global clean energy investments of approximately USD 4–5trn are required annually by 2030 — more than three times the current rate (IEA, 2021d) — and investments in early-stage technologies are lacking (WEF, 2021). Policy incentives to de-risk investments are unpredictable and short-dated. Public intervention is patchy and does not send the right investment signals. Carbon pricing is low/non-existent in manyregions,fossil-fuelsubsidiesareprevalent,and Covid-19 recovery packages do not focus on decarbonization. Targeted net zero innovation efforts Cross-sectoral decarbonization pathways are dependent on a plethora of known technologies from well-established to less mature. Innovation efforts/investments prioritize structural change and advancing the ‘readiness’ and uptake of technolo- gies necessary for a net zero future. The Technology Executive Committee (UNFCCC, 2021b) is highlighting best practices from global RD collaborations. Policymakers are pushing private-sector engagement, such as in the government-led Glasgow Breakthroughs, the global Mission Innovation initiative, and the public-private partnership First Movers Coalition. 5. Corporate sustainability in energy and value chains Sustainability strategies accelerate the transition through individual energy-company transformations (e.g. Schneider Electric and Ørsted topping the Corporate Knights' index on the most sustainable corporations) and companies’ carbon ambitions in operations. Corporate renewable-power purchase agreements (31.1 GW in 2021, 25.1 GW in 2020, 20.1 GW in 2019 per BNEF, 2022), along with accountability for supply chain, scope 3 emissions (increasing from 93 companies in 2010 to 3,317 in 2021 in the public CDP dataset per WRI, 2022a), are increasingly part of strategies to achieve net zero commitments and secure financing. The gulf between talk and action There is a shortage of quantitative net-zero plans with interim targets and immediate emissions reduction. Net zero has become a shiny smokescreen for delaying action (SP Global, 2021d). Carbon markets, used voluntarily by companies to offset emissions, are ridden with dubious credits that have little demonstrable effect in terms of tangible and additional emissions reduction. Net-zero claims and actions by fossil-fuel firms do not match the reality of carbon-intensive business models and operations; and their capital allocation is misaligned with climate ambitions with hydrocarbon investment still consuming 80-90% of capital spending (ClientEarth, 2021). 6. Promising cross-sectoral synergies The role of different energy carriers in energy system decar- bonization pathways have become clearer in recent years. Energy systems can transform with more physical links, and with a key role for the electricity system in sector coupling through power-to-x projects. Renewable electricity expansion is a prerequisite for e.g. green ammonia and green hydrogen, as is CCS deployment for low carbon (blue), both routes being pillars in the transition. Hydrogen-based energy conversion projects are pushing forward to underpin emission cuts in hard-to-abate sectors (DNV, 2022a). Unfit regulatory frameworks Regulatory frameworks to scale technologies in production, storage and end-uses are not yet in place. Sector coupling will need interconnection between gas and electricity systems / assets / operators. Common definitions and standards need development, and regulation need harmonization, viewing electricity and gas sectors cohesively (CERRE, 2021). Energy taxes discourage fuel switching (to electricity, hydrogen) in demand sectors and need reform. Electricity market design is an insufficient driver of new renewable-capacity investment (Wind Europe, 2022). CCS technology-readiness level is high, but de-risking measures are inadequate or lacking, such as carbon pricing. 8. Insight Convergence in disclosure requirements and metrics is tipping in favour of deeper ESG embedding in capital allocation, pricing and value assessments underpinning decision-making processes. Thus, sustainability objectives are being put in focus to accelerate the transition. GFANZ is an encouraging development, but its members’ commitments are voluntary and uncertain in the absence of tougher disclosure obligations and binding legislation from policymakers. Insight In the frontrunner transition regions, ‘fit-for-purpose’ regulatory frameworks will be developed and feasible within a 2030 timeframe, but the transformation will require immense implementation abilities. Hence, this will pose a challenge to regions with weaker governance structures and where incumbent actors in centralized energy subsectors exercise significant influence on decision-making. 7. Investors propel the transition A staggering amount (USD 130trn) from the COP26 Glasgow Financial Alliance for Net Zero (GFANZ) coupled with an investment boom in ESG issues (environmental, social and governance), reported at USD 35trn in 2021 (GreenBiz, 2022), is pushing the transition. Global scrutiny from regulators, (e.g. the EUs Corporate Sustainability Reporting Directive) make ESG reporting mandatory, and brings transparency to sustainable investments. Standard setters (e.g. TCFD and IFRS/ISSB) are consolidating requirements. With increasing reporting obligations on ESG, companies and investors will face growing liability from climate/nature-related disclosures and breach of fiduciary duty (Allianz, 2022). Greenwashing Greenwashing — a marketing ploy conveying exaggerated claims on the sustainability of products/companies — is side-tracking investments towards net zero. The European Securities and Markets Authority (ESMA, 2022) flagged complexity, lack of transparency, and poor comparability among ESG ratings/data providers. Until taxonomies and disclosures are finalized (e.g. EUs Sustainable Finance Disclosure Regulation (SFDR) and US Securities and Exchange Commission’s (SEC) proposed carbon disclosure rule), there will be uncertainty. Companies/investors are unlikely to invest in the transition without clarity on eligibility for “low-carbon” investments and material information on climate and transition risks. Insight The shortfall in global investments and innovation are a clear hindrance to both the direction and pace of the transition, and one of the principal reasons why DNV forecasts an energy transition that, while rapid, will manifestly fail to deliver on the Paris Agreement targets. Insight Corporate renewable-power purchases are expected to continue growing. Reporting on Scope 3 emissions, on the other hand, is a relatively new and growing trend, lending momentum to the transition. However, the extent of momentum depends on better goal setting and measurement upstream and downstream (e.g. accreditation on science-based criteria, common/ standardizedcarbon-accountingmethodology,measuringcompliance/progress,andopeningupdatatothird-partyverification).
  • 74.
    146 DNV Energy TransitionOutlook 2022 147 Policy and the energy transition CHAPTER 6 6.3 KEY REGIONAL POLICY DEVELOPMENTS Below are snapshots of recent key policy developments in our forecast regions since last year's Outlook, capturing the role of governments in steering and advancing the transition. The map alongside shows each region’s share of global energy-related CO2 emissions in 2019. We highlight 2019 emissions because they reflect pre-pandemic economies and emission levels in the regions. 17% 10% 7% 30% 5% 5% 8% 8% 3% 6% Greater China (CHN) North America (NAM) Europe (EUR) Indian Subcontinent (IND) 30% 17% 10% 8% Middle East and North Africa (MEA) North East Eurasia (NEE) OECD Pacific (OPA) 8% 7% 6% South East Asia (SEA) Latin America (LAM) Sub-Saharan Africa (SSA) 5% 5% 3% Each region’s share of global energy-related CO2 emissions in 2019 17% 10% 7% 30% 5% 5% 8% 8% 3% 6% Prime Minister Modi announced India’s net zero emissions target for 2070 at COP26. Thegovernmentisnowconsidering legislation for a uniform carbon- trading scheme (April 2022). Pakistan updated its NDC before COP26 aiming to reduce emissions by 50% by 2030 (15% uncondi- tional, 35% conditional). All coal projects are being stopped and 60% of power is to come from solar by 2030. In addition, at least 30% of all new vehicles sold in various categories are to be electric. Sri Lanka advanced its carbon- neutrality target to 2050 (originally set for 2060). The 2021 NDC of Bangladesh outlines 40% of power to come from renewables by 2041. Indian subcontinent Brazil published rules to establish the regulatory framework for its offshore wind market (January 2022). The president issued a decree announcing the creation of a national carbon market to reduce GHG emissions, but it lacks detail (May 2022). Chile’s Just Transition Strategy in the energy sector was published in December 2021. Its Climate Change Framework Law, enshrining a binding goal of net zero emissions by 2050, was published in June 2022 . Mexico’s parliament voted down the president-backed electricity reform legislation for state control of the power market (April 2022). Venezuela’s government hosted an energy talk with a US delegation to discuss energy security (March 2022). Latin America Ukraine was granted EU candidate status in a positive opinion issued by the European Commission (June 2022). The National Council for Recovery from the War is developing a Post-war Recovery and Development Plan that aligns with transformation to a green economy and low-emission development principles (July 2022). Kazakhstan vowed to reach carbon neutrality by 2060 and aims to create the Central Asian Climate Hub to address climate change (November 2022). Russia approved its strategy, with a net zero ambition by 2060, but does not specify its achievements nor cuts to 2030 (October 2021). North East Eurasia In March 2022, the National Development and Reform Commission and the National Energy Administration released key documents to guide decarbonization as follows: An Action Plan for carbon dioxide peaking before 2030, including strict control of new coal-power projects, standards for newly built units to reach the international advanced level, and elimination of outdated capacity in an orderly manner. 14th Five-Year Plan for Modern Energy System, outlining plans for the proportion of non-fossil energy consumption to reach 20%, non-fossil power generation at 39%, and electricity to account for 30% of final energy consumption — all by 2025. A Medium and Long-term Plan for the Development of Hydrogen Energy Industry 2021-2035, aiming for 5% of final energy consumption to be hydrogen energy by 2030. Greater China Japan and South Korea signed the Global Methane Pledge of 30% methane cuts by 2030 (COP26). South Korea upped its GHG emission-reduction target to 40% below 2018 levels by 2030 (previous NDC at 24.4%), also aiming for renewable generation around 30%. Japan pledged up to USD 10bn over five years to assist Asia towards zero-carbon emissions. South Korea’s new president vowed to resume nuclear power construction (March 2022). Australia’s new government increased its GHG emissions target to 43% below 2005 levels by 2030, aiming for net zero by 2050 (June 2022). New Zealand passed a law introducing mandatory climate-related reporting for the financial sector (October 2021). OECD Pacific The United Arab Emirates announced its Net Zero Strategic Initiative by 2050 and Saudi Arabia a net zero target by 2060 (October 2021). Saudi Arabia announced a USD 10.4bn fund to provide clean cooking fuels and investments in carbon-capture technology (October 2021). Egypt was selected to host COP27. The government’s 2050 National Strategy for Climate Change estimates costs at USD 211bn for mitigation and 113bn for adaptation (May 2022). Its target for 42% renewable power by 2035 was brought forward to 2030 (November 2021). Turkey, the last G20 country to ratify the Paris Agreement, announced a net zero goal by 2053 (October 2021). Middle East and North Africa Vietnam and Malaysia aim for net zero emissions by 2050. Indonesia pledged to achieve net zero emissions by 2060, and Thailand by 2065 (COP26). Malaysia will no longer build new coal plants. Indonesia stated that between 2026-2030 there will be no additional coal-fired capacity, except for those that have reached financial close or are already under construction (COP26). Japan announced a stop to loans for construction of coal-fired electricity plants in Indonesia (June 2022). Vietnam’s amended law on electricity outlines investment of USD 148bn in the power system to 2030, allowing foreign investments in grids (January 2022). Indonesia’s CCS/utilization regulation is expected by the end of 2022 (April 2022). South East Asia Nigeria passed its Climate Change Bill with a net zero target by 2060 (November 2021). Angola’s state-owned Sonangol signed a declaration of intent to supply Germany with green ammonia, starting in 2024 (June 2022). South Africa’s cap on private power providers was lifted to boost renewables rollout and enable municipalities and large industrial consumers to purchase electricity directly from IPPs (July 2022). The Just Energy Transition Partnership aims to support South Africa’s transition away from coal with the governments of UK, France, Germany, US, and the EU promising USD 8.5bn over 5 years through grants and loans (COP26). Sub-Saharan Africa High EU ETS prices followed a strengthening of emission-reduction targets, with EU allowances ending the year (2021) at just over EUR 80/tonne. The REPowerEU Plan (March 2022) aims to eliminate dependence on Russian fossil imports, replacing two-thirds before the end of the year. To fast forward the clean energy transition, the Plan outlined additional actions, building on the Fit-for-55 package of proposals. These actions include, among others, proposing to raise the 2030 target of renewable share of energy use from the current 40% to 45%. The EU Parliament voted in favour of the Commission’s proposal on certain transitional nuclear and gas activities in the EU taxonomy on sustainable investments (July 2022). Europe US President Joe Biden signed the Inflation Reduction Act into law (August 2022) with an unprecedented climate and clean energy investment of USD 369bn over a 10-year period. The US Supreme Court limited the scope of the Environmental Protection Agency’s (EPA) authority to regulate emissions and dictate power plant shifts from one energy source to another unless Congress has clearly authorized the agency to act (June 2022). The US administration announced that it will invoke the Defense Production Act to expand domestic clean-energy manufacturing (June 2022). Canada published its 2030 Emissions Reduction Plan (March 2022) for cuts of 40% below 2005 levels, including CAD 9.1bn in new investments. The government specified Climate Action Incentive payments to deliver carbon-pricing proceeds quarterly to individuals/ jurisdictions where proceeds originated (March 2022). North America
  • 75.
    148 DNV Energy TransitionOutlook 2022 149 Policy and the energy transition CHAPTER 6 6.4 THE POLICY TOOLBOX Here, we outline and exemplify the policy categories shaping the likely energy future to 2050. These fall into five main categories recapped below. Of these, four are (i) national strategies, (ii) technology-push, (iii) demand- pull, and (iv) fiscal policies. A fifth, public and private partnerships, obtains its main impetus from cooperation. By combining such policy tools across sectors and supply chains — effectively a ‘mission’ effort — governments can shape energy sectors in favour of decarbonization. National strategies are the foundation for fostering energy-system transformation by setting roadmaps with technology priorities, targets, and timelines as the first step towards creating a stable planning horizon and certainty for stakeholders. Examples include China, Chile and the EU. From China we see steadfast planning behind the Working Guidance on how to reach both 2030 and 2060 goals (NDRC, 2021). The Action Plan for carbon dioxide peaking before 2030 (State Council, 2021) launches China “1+N” policy framework with overarching guiding principles for its emissions strategy (1) and supplementary policy documents (N) for specific sectors and goals (China Briefing, 2021). Chile has a comprehen- sive National Green Hydrogen Strategy (Ministerio de Energía, 2021) , which is part of a larger effort to combine climate leadership and energy transition into legislation (ICCT, 2022). All national strategies must incorporate infrastructure developments, permit requirements and designation of land or sea areas as being suitable for renewables and related technologies/infrastructures; this is seen with EU’s regional focus on ‘go-to-areas’ for faster permitting processes capped at one year (EC, 2022). Technology-push policies advance technologies along the entrepreneurial and technology development cycle from RD and piloting to scale-up. They influence construction and operation of energy assets. Examples include technology requirements on fuel economy, emission limits, carbon intensity, and energy efficiency, the latter being key to alleviation of energy poverty as the cheapest energy is the energy not used. Others are: taxonomy development, with a classification system for eligible sustainability investments; RD and government funding with investment support (grants, loans, tax credits) to capital expenditures (CAPEX) that counterbal- ance upfront costs (e.g. heat pumps during building renovation or new-build projects, carbon capture and storage (CCS), renewable hydrogen production and its derivatives). The US Inflation Reduction Act aims to promote domestic clean-energy technology manufacturing and has govern- ment spending at USD 369 over a 10-year period, such as on rebates (USD 9bn) to homeowner’s energy-efficiency investments; a CCS tax credit (USD 85/tCO2 increased from previous USD 50); a tax credit rate of USD 3/kgH2 for hydrogen produced with a carbon intensity below 0.45 kgCO2 e/kgH2 , and USD 30bn to renewable power plants, batteries and advanced nuclear reactors. At the state level, California’s latest budget proposal allocates USD 37bn in climate spending over six years (LA Times, 2022) including a clean-energy loan programme to encourage innovation (State of California, 2022). Production support mechanisms to cut operational expenditures (OPEX) over fixed timeframes can also help incentivise investment in technology. There is rising focus on contracts for differ- ence, a market-based mechanism offering OPEX support through a guaranteed strike price to producers over a fixed period. An example is Netherland’s SDE++ programme supporting the Rotterdam CCS project Porthos (https://www.porthosco2.nl/en/) by contracting the difference between the current emission trading systems (ETS) price and the CO2 price needed to make the project economically viable. Demand-pull policies have an essential role in spurring demand for renewable energy and low-carbon technolo- gies. Governments act as market makers by promoting deployment and/or switching from using unabated fossil-fuel technologies. Through accelerated uptake, existing solutions and viable technologies achieve a decline in unit costs; this has a self-reinforcing effect ensuring more build-out which, in turn, trigger further cost reductions. Examples include: clean-energy consid- erations in public procurement, biofuel-blending mandates, renewable-electricity capacity quotas coupled with competitive bidding or other quota-based or quantity-based policies (e.g. binding targets with a fixed amount/share of energy/fuels from renewables or hydrogen) to create demand among end-use sectors. Other demand-pull policies involve economic instruments such as feed-in tariffs for renewable electricity producers, TECHNOLOGY-PUSH Technical requirements — e.g. fuel, emissions, efficiencies Taxonomy — eligible sustainability investments Funding — RD and investment support FISCAL POLICIES National budgeting – aligned with the SDGs or climate goals Economic signals — e.g. carbon pricing and tax reform in the energy sector PUBLIC/PRIVATE PARTNERSHIPS Including international and national bodies and the private sector — leveraging the additional financial resources and operating efficiencies inherent to private businesses DEMAND-PULL Mandates — fuel blending Capacity quotas — renewables Economic instruments — e.g. feed-in tariffs, contracts for difference, subsidies) Mandatory disclosure – e.g. of low, zero-carbon use NATIONAL FRAMING STRATEGIES FIGURE6.2 Policy toolbox Countries and regions will undergo unique energy transitions given their different starting points regarding available resources, variation in existing energy-sector infrastructures, and the range of socio-political circumstances. However, all policymakers have both a shared technology-opportunity space and a policy toolbox of known and proven measures that is available for forming their energy-system (re)development and transitions. Decisive policy action with directed support measures for energy savings, uptake of new energy carriers and substituting high-carbon technologies and practices with low-carbon alternatives can all catalyse structural shifts. At the level of sectors or supply chains, comprising several technologies at varying levels of commercial readiness, a blend of policies — policy packages — can be used concur- rently to create predictable framework conditions that de-risk investments and provide a basis for business.
  • 76.
    150 DNV Energy TransitionOutlook 2022 151 Policy and the energy transition CHAPTER 6 tax reduction or subsidies for EV purchases and for heating and cooling systems. In addition, mandatory disclosures on climate and transition risks or proof of environmental attributes through guarantees of origin and transparent information, (e.g. the CertifHyTM certification scheme on hydrogen), aim to trigger the demand-side. Decisive policy action with directed support measures for energy savings, uptake of new energy carriers and substituting high-carbon technologies and practices with low-carbon alternatives can catalyse structural shifts. Fiscal policies can tilt the competitiveness of clean-energy alternatives against their conventional, high-carbon counterparts, thus influencing fuel-switching, replace- ments, and new builds, alike. ‘Walking the talk’ by executing climate/environmental pledges, include revision of government funding to align public-sector operations with sustainable development goals (SDG) and climate objectives, both domestically and overseas. Japan recently announced the withdrawal of international finance to coal projects in Indonesia and Bangladesh (Mongabay, 2022). Economy-wide economic signals, such as pricing carbon and other negative externalities and fossil-fuel subsidy phase-out are key to redirect funds to transition ambitions, the latter also included in the Glasgow Climate Pact. Review and reform of tax systems and budgetary expenditures also form part of a holistic policy package to transform energy systems. Energy taxation reflecting carbon efficiency/pollutants, as exemplified by the revision of the EU Energy Taxation Directive, aims for alignment of taxation with environ- mental performance and climate objectives. Tax reforms are likely to unfold at an uneven pace with high-income regions (with net-zero targets by 2050) being first movers. Public/private partnerships unite policymakers and commercial players to cooperate and coordinate transition and decarbonization efforts. In the area of progressing hydrogen, recent examples include: the Partnership Agreement between the International Renewable Energy Agency (IRENA) and the Hydrogen Council; the IRENA and World Economic Forum (WEF) Hydrogen Toolbox; and the World Business Council for Sustainable Development (WBCSD) SMI hydrogen- industry pledges initiative (H2Zero), also with proposed policies (WBCSD, 2022). These collaborative initiatives are instrumental in facilitating harmonization and exchange of best practices. Most recently at the G7 meeting, a Hydrogen Action Pact (G7-HAP) was announced to accelerate hydrogen development (G7 Germany, 2022) — not to duplicate other partnership initiatives, but to stress their importance. The policy categories are described separately here for clarity. In reality and given the urgency of the transition, a mix of these categories is commonly deployed, tailored to suit the maturity of technologies. For further examples and detail on what we term the “policy toolbox” of proven policy measures, please also refer to the detailed account provided in last year’s Outlook as well as DNV’s Hydrogen forecast (DNV, 2022a). How will carbon prices develop? Carbon pricing is crucial to accelerate mitigation and de-risk low-carbon investment. The logic is simple: carbon pricing assigns to polluters some or all of the costs that they impose on society and hence forces climate and emissions considerations into corporate balance sheets, along with decision making on energy equipment and systems. A country’s carbon pricing may be considered an acid test of the sincerity of its climate pledge. An effective carbon price — or clarity on when such a price will be implemented — incentivizes use of clean energy and deters use of unabated fossil fuels. By ‘effective’, we mean not only properly pricing the damage caused by emis- sions, but also pricing at a level that makes low-carbon technologies/value chains economically viable. To date, the introduction of pricing schemes has been stubbornly slow and politically challenging to implement. According to the World Bank’s status report (World Bank, 2022b), as of April 2022 there are 68 carbon-pricing instruments worldwide, including taxes and cap-and- trade systems/emissions trading systems (ETS). They cover 23% of total GHG emissions (12 GtCO2 e), and four new schemes have been implemented since the World Bank’s 2021 status report. A conclusion, also this year, is that carbon prices are rising but are generally too low. The potential for carbon pricing remains largely untapped. The High-Level Commission on Carbon Prices (Carbon Pricing Leadership Coalition, 2017) indicated that the carbon price needs to be in the USD 50–100/ tCO2 e range by 2030 in order to achieve the Paris target of keeping global heating well below 2ºC. In our forecast, the only region expected to be within that pricing range is Europe. Our forecast includes our best estimate of future carbon- price levels, reflected as a cost for fossil fuels (see Section 6.5). We have considered exposure to carbon-border tariffs/CBAM in the regions’ carbon-price trajectories. Overall, adoption of carbon pricing schemes is expected to expand and become more robust both in prices and coverage given the increase in net zero commitments, and with clear frontrunner regions.
  • 77.
    152 DNV Energy TransitionOutlook 2022 153 Policy and the energy transition CHAPTER 6 However, globally, pricing will be far below the necessary levels suggested above. Europe, North America, OECD Pacific, and Greater China are projected to reach carbon- price levels in the range of USD 22–95/tCO2 by 2030 and USD 70–135/tCO2 by 2050. Carbon pricing by mid-century is projected to range between USD 20/tCO2 (North East Eurasia) and USD 135/tCO2 (Europe). The average regional carbon-price trajectories to 2050, as shown in Figure 6.3, consider hybrid pricing (ETS and carbon taxation). The trajectories are neither current nor optimal policies, but are likely price levels given recent policy developments. They reflect how we expect national/regional trends to develop, considering annual status reports from The World Bank and the International Carbon Action Partnership (ICAP), as well as estimates from carbon-pricing market forecasters. Synopsis of trends and carbon-price drivers in Outlook regions: — Europe (EUR): Lead pioneer in carbon pricing with both regional (EU ETS) and supplementary national taxes. Established schemes are being tightened (e.g. EU ETS cap continuous decline and inclusion of more sectors, such as maritime (2026); separate ETS for road transport/buildings (2026); and free allocation phase- out (2027) for aviation). There is no indication that the EU will relax its focus on decarbonization and the Green Deal as these are closely linked to energy security objectives, and the EU ETS is a main tool to finance the transition costs and achieve net zero ambitions. UK’s ETS scheme mirrors the scope of the EU ETS and future linking may be expected. There is a clear upward-pricing trend underpinned by efforts to manage distributional impacts. The EU CBAM from 2026 aims to safeguard European competitiveness by levelling the playing field between EU and non-EU producers. — Greater China (CHN) and the OECD Pacific (OPA): Both regions trail Europe with a continuous rise and with expected similar price trajectories, but starting from lower levels. In CHN, China's national ETS is expected to expand gradually in coverage to include an additional seven high-emission industries during the 14th five-year plan (2021-25). These come in addition to the power sector, which emits over 4 Gt CO2 each year (~40% of China’s CO2 emissions from fuel combustion) and includes captive power genera- tors of industrial plants (IEA-Tsinghua, 2021). In OPA, carbon pricing is well established (Japan, South Korea, New Zealand) and tightening/undergoing reform. Pricing policy is likely to evolve in Australia to achieve the more ambitious 2030 commitment (43% emission reductions below 2005 levels, increasing from 26-28% target under the previous government). Trade under Article 6, clarified at COP26 on ‘international offsets’, will likely lower OPA’s domestic carbon-price level (Japan, South Korea). Net-zero ambitions in 2050 in all OPA countries, and 2060 carbon neutrality in China, will see carbon pricing as an important part of policy mixes. Strong ambitions for clean-energy industry development constitute a further carbon-price driver. There are prospects for potential linkage between CHN and OPA ETS schemes (Heggelund et al., 2021) but this is currently undecided and unlikely before mid-2030s. — North America (NAM): Carbon prices are set to rise, tracking other high-income regions, but at a lower level. Carbon pricing is not central in the federal climate change agenda of the US. However, state schemes, such as cap-and-trade systems in California and Oregon, and the Regional Greenhouse Gas Initiative are being reformed/tightened (e.g. in California to align with its 2045 carbon neutrality goal). Washington state passed policy (2021) for a compre- hensive cap-and-trade system, effective from 2023. Canada has federal carbon-pricing policy to ensure economy-wide ETS or tax schemes, requiring an annual increase of CAD 15 (USD 12)/tCO2 e until reaching CAD 170 (USD 136)/tCO2 e in 2030. Border carbon adjustments (BCA) are considered in both the US and Canada. — Latin America (LAM) and South East Asia (SEA): Both regions currently have low/limited carbon pricing and are expected to have similar carbon-price trajectories towards 2050. There are carbon taxes in LAM e.g. Argentina, Chile, Columbia, Mexico, and Uruguay, with the latter as an outlier (in terms of price level) with a 2022 tax rate at USD 137/tCO2 e. Chile’s government recommends an increase to USD 35/tCO2 e by 2030. Brazil is considering ETS implementation. In SEA, several countries (Indonesia, Malaysia,Thailand, Vietnam) are taking steps towards introducing or expanding carbon-pricing schemes by the middle of the decade and Singapore has a proposal for a progressive increase of its carbon tax, reaching USD 37-59/tCO2 e by 2030. In both regions, key drivers of carbon-pricing policy include: revenue to fund transi- tion/emissions reduction; exposure to carbon-border tariffs/CBAM affecting market access and export activities, e.g. SEA as a major manufacturing hub; and scope 3/supply-chain attention from investors and multinational corporations reinventing their supply chains for net zero. — Indian Subcontinent (IND): Currently there is no explicit carbon-pricing schemes in this region. India, the region’s dominant economy, has announced its intention for a national carbon-trading scheme (Economic Times, 2022), and the state of Gujarat intends to establish a cap-and-trade market. Pakistan has carbon-pricing under consideration. The prime drivers of carbon-price developments in the region are: India’s net zero announcement (by 2070); domestic revenue potential to support transition projects; access to global transition/climate finance and inter- national trade in climate mitigation (Article 6); and exposure to carbon-border tariffs/CBAM, e.g. EU is India’s 3rd-largest trading partner. — Middle East and North Africa (MEA): Carbon pricing is presently low/negative given subsidies to fossil fuels/products, and slow adoption is expected, with removal of subsidies as a first step. Carbon-pricing potential has been explored in a World Bank partner- ship for market readiness (e.g. Tunisia, Morocco, and Jordan) also with support of carbon-market infra- structure (GHG registry and MRV framework). Carbon-price policy drivers in the regions are: net zero announcements with 2050 time horizon; carbon-border tariffs/CBAM exposure and price signals to shift to low-carbon investment as part of diversifying economies; and climate action as part of hosting COP27 (Egypt) in 2022 and COP28 (United Arab Emirates) in 2023. — North East Eurasia (NEE): Carbon pricing is presently low/negative given subsidies to fossil fuels/products, and slow adoption is expected. The likely accession of Ukraine to the EU would — over time — means alignment of climate policy, including carbon pricing. Schemes presently exist in Kazakhstan and Ukraine, with emissions trading quotas and carbon tax, respectively, currently at around USD 1/tCO2 e. Countries in NEE are likely to adopt some form of carbon pricing to avoid the EU CBAM on emissions embedded in CBAM goods/exports. However, with Russia shifting its trade pattern away from Europe, there is less pressure towards adopting a carbon-pricing policy. — Sub-Saharan Africa (SSA): Carbon pricing is low/ absent and slow adoption is expected. South Africa’s government has announced a proposal to increase its carbon-tax rate (currently under USD 10/tCO2 e) to USD 30/tCO2 e by 2030, and to USD 120/tCO2 e by 2050. Carbon-price policy drivers include: access to global climate finance; trade under Article 6 and exposure to carbon-border tariffs/CBAM from mid-2030s. It may be expected that revenues from carbon-border tariffs/ adjustment in high-income regions will also be used to support climate action in low-income countries and/or that these are granted preferential trade access and initial exemptions (under the UNFCCC principle of common but differentiated responsibilities). Willing- ness to compete in green value-chains may spur investment in some megaprojects – for example green hydrogen or ammonia powered by dedicated renewables.
  • 78.
    154 DNV Energy TransitionOutlook 2022 155 Policy and the energy transition CHAPTER 6 Factoring in pledges and policies Pledges on emission reductions are the first steps in the direction of meaningful climate action. Where the latest Emissions Gap Report (UNEP, 2021) from October 2021 suggested that country commitments and current policies would lead to a temperature rise of 2.7o C by the end of the century, bolder pledges were submitted ahead of, and during, the Conference of the Parties, COP26 in Glasgow. Post-COP26 assessment suggested that announced pledges and targets would lead to a future global mean temperature rise of 2.1o C if countries fully implement their pledges to 2030 and beyond. An “optimistic scenario”, where all the announced net-zero commitments or targets under discussion are imple- mented, would bring the estimated temperature rise down to 1.8°C by 2100 (Climate Action Tracker, 2021a). However, a main takeaway is that only lip service is being paid to ‘net zero’, and the gaps between commitments and action need to be closed. Much more credible pathways are required for reducing global emissions by 45% by year 2030 and achieving net zero by 2050. The final agreement from COP26, the Glasgow Climate Pact (UNFCCC, 2021a), asks all countries to “revisit and strengthen” their targets and 2030 emission-reduction plans by the end of 2022, instead of waiting for five years. In our analysis, we monitor Paris Agreement-related pledges closely, but we do not pre-set our Energy Transition Outlook model to achieve them. Announce- ments are initial steps in planning, but also precursors of a possible future. Whether that future comes about depends entirely on adequate policies, and most countries have inadequate short-term policies, despite the boldest pledges (Climate Action Tracker, 2021b). What matters for DNV’s forecast is that policies are both enacted and implemented. In other words, we need pledges to be coupled with concrete sector- transition pathways enabled by real policy and support measures. It is these that will determine the future curbing of emissions, as well as the direction, scope, and pace of the transition. The policy analysis informing our Outlook maps policy documents for existing, enforceable policy/measures and indications of planned, future policy develop- ments, and assesses their likely impact. Model-specific policy factors are thus derived on the basis of policy mapping. In our analysis, we monitor Paris Agreement- related pledges closely, but we do not pre-set our Energy Transition Outlook model to achieve them. 6.5 POLICY FACTORS IN OUR OUTLOOK Our forecast factors in policy measures that span the entire policy toolbox (Section 6.4). 12 policy considerations exert influence in the following three main areas: a) Supporting technology development and activating markets, thus closing the profitability gap for low- carbon technologies competing with conventional technologies; b) Applying technology requirements or standards to restrict the use of inefficient or polluting products/ technologies; or c) Providing economic signals (e.g. a price incentive) to reduce carbon-intensive behaviour. Steps in the analysis Our policy analysis looks at multiple policy arenas, spanning global regulation (e.g. the Paris Agreement), regional/national policy developments across the 10 world regions, and public/private partnership initiatives. Guideposts for our policy mapping are to: — ensure detailed coverage on the countries within each of the 10 ETO world-regions that combined represent 80% of the total energy use of each region. — assess national/regional policy documents for existing, enforceable policy, and plans/announcements for future policy developments. — complement insights from policy documents with credible sources of research and analysis produced by leading organizations and experts worldwide. In deriving an ETO model-specific policy factor, the following steps are taken: — regional willingness/ability to implement support/ subsidies is considered and differentiated — country-level data are translated into expected policy impacts, then weighted and aggregated to produce regional figures for inclusion in our analysis. Below, we detail policy factors in the analysis.
  • 79.
    156 DNV Energy TransitionOutlook 2022 157 Policy and the energy transition CHAPTER 6 — For the demand-side, a hydrogen-policy factor reflects CAPEX support to manu- facturing and buildings but varies by region in terms of policy focus and percentage level of CAPEX, according to government-funding programmes. The full subsidy remains until 2030 and is then gradually halved to 2050. — For road transport/vehicles, the speed of hydrogen uptake is determined by a hydrogen-policy factor reflecting, among other parameters, FCEV CAPEX support including refuelling infrastructure. Examples are incentives driven by municipality- based CAPEX reduction policies for hydrogen-fuelled public buses. — For shipping and aviation, fuel-mix shifts are driven by fuel-blending mandates and carbon pricing. — CCS in low-carbon hydrogen production is mainly driven by regional carbon prices. The main trigger for CCS uptake will be where carbon prices are higher than the cost of CCS. In addition, regional policies providing specific support for CCS are reflected to enable the initial uptake and reduce costs. This policy support will be reduced when carbon prices become high enough to sustain growth. 5. Carbon capture and storage support — Historical CCS implementations, as reported by the Global CCS Institute (2021), are fully incorporated, as well as their future project pipeline of plants and storage to 2030. These projects receive investment and operational government support. — Regional carbon prices determine the uptake of CCS in power, manufacturing, and industrial processing. — Regional policy support for CCS, beyond the carbon price, is integrated based on the gap between regular CCS costs and carbon pricing to account for this gap and enable initial CCS uptake. Policy support is reduced when the gap between carbon price and CCS costs is closed. 6. Standards for energy efficiency — Standards and regulation (existing and planned) for energy use and efficiency improvements in buildings, transport, and industry sectors are incorporated. — Buildings: Standards for insulation against heat loss, heat gain and energy use for appliances and lighting are used as guides for setting the input assumptions. However, the policy effects are not quantified explicitly. — Vehicles: Efficiency and emissions standards per region are incorporated and trans- lated into normalised test-cycle values (New European Driving Cycle, NEDC). An adjustment factor per region is applied to derive real-world fuel consumption from the theoretical NEDC values. The fuel-efficiency trajectories towards 2050 follow the trends determined by these real-world-adjusted standards, corrected for EV uptake. — Shipping: IMO 2050 carbon emissions fully implemented (IMO, 2018). 1. Renewable power support — Renewable electricity build-out is advanced by governments in all regions, increasingly throughmarket-ledapproachessuchascapacityquotasandcompetitivebidding/auctions. — To reflect historical and expected future support for biomass, solar, and wind power, we assume that those technologies receive a subsidy calculated as a fraction (which varies per region) of the gap between the expected profitability of renewables (expected capture price – levelized cost of energy) and the profitability of the most-profitable conventional technology in the same region. — Subsidies vary by technology and a region’s willingness/ability to implement support. — The subsidy is removed as the profitability gap is closed. — The subsidy stays at zero even if profitability of renewables become negative, as long as the profitability of conventional generation is lower. — Carbon pricing and increase in cost of capital reduce the attractiveness of fossil-based generation. 2. Energy storage support (batteries) — Existing and planned policy support is translated to an average support as a percentage of battery unit costs for battery-storage technologies. — Support levels increase with the share of variable renewables in regional electricity generation, incentivizing investment in flexibility while reflecting regional differences in willingness/ability to implement support. 3. Zero-emission transport — We reflect an average regional EV support for both battery electric vehicles (BEVs) and fuel-cell electric vehicles (FCEVs), based on existing support at the country level. — We account for subsidies, tax exemptions, and reduced import duties, and translate this into an average CAPEX support per region per vehicle type. — We assume a slight initial growth and a decline in preferential treatment from the current levels thereafter. The support is capped by the EV cost disadvantage. — Country-level targets for public fast-charging ( 22kW) infrastructure roll-out have been mapped to identify EV uptake barriers. As charging infrastructure expands over the next decade, this is increasingly likely to be on market terms, and associated grid-infrastructure build-out will follow without constraints. 4. Hydrogen support — Support for the scaling of hydrogen infrastructure, and for the supply-side in terms of hydrogen production, is estimated on the basis of total annual government funding available for hydrogen RD and deployment (pilot projects, support for large-scale infrastructure, and industry projects) and reflected as a percentage subsidy for the capital cost of low-carbon hydrogen production routes. This also has spill-over effects for hydro- gen demand in end-uses through reductions in hydrogen price. Policy factors influencing our Outlook
  • 80.
    158 DNV Energy TransitionOutlook 2022 159 Policy and the energy transition CHAPTER 6 10. Air pollution intervention — Policy interventions are reflected by an air-pollution cost proxy that transfers costs of control measures to an operating cost per kWh, incorporated in power and manufac- turing sectors. — A regionally dependent ramp-up rate is used, going from 0 to 100% implementation of the operating cost over a certain period, indicating that regulations will be gradually enforced on more and more pollutants and plants. 11. Plastic pollution intervention — Policy interventions on plastics, such as mandated recycling, taxes on unrecycled plastic, trade restrictions, and extended producer responsibilities, are incorporated in form of recycling rates and an effect of reduction and substitution on demand. — The projected recycling rates (mechanical and chemical) and the effect of reduction and substitution builds on the “Reshaping Plastics” report for Plastics Europe (Systemiq, 2022), assuming that the most-likely future policy interventions correspond to those in the Circularity scenario (a combination of the “Recycling” and “Reduction substitution” scenarios). Among the regions, EUR is expected to be a front-runner and the other ETO regions are assumed to follow, but with delays ranging from 5 to 15 years. 12. Methane intervention — Methane intervention and abatement, such as resulting from the Global Methane Pledge (US and EU initiative in September 2021, promising at least 30% reduction from 2020 levels by 2030) are incorporated. Partial energy-sector reductions are achieved as a result of carbon prices deployed against methane abatement technologies and their marginal costs. 7. Bans, phase-out plans and mandates — Bans on ICE cars are not incorporated in the forecast, but model results are compared with announced bans. — Phase-out plans on nuclear power are incorporated but with a few short-term exceptions in Europe due to the Ukraine war. For coal-fired power generation, our forecast references the phase-out plans. However, due to market economics and reduced cost-competitiveness, shutdowns might happen earlier than phase-out plans suggest. — Regional biofuel-blend mandates currently in place are considered and we foresee further strengthening of these in frontrunner regions such as EUR and NAM. Mandates will likely be enhanced in the future to include other sustainable aviation fuels (SAFs). — Region-specific pushes both from business and from individuals that are willing to pay for sustainable aviation, will enable a gradual increase in uptake of non-cost competitive aviation fuels such as hydrogen and SAFs. 8. Carbon pricing schemes — Our region carbon-price trajectories to 2050 consider hybrid pricing (cap-and-trade schemes and carbon taxation). — Our carbon-price trajectories (Figure 6.3) are reflected as costs for fossil fuels in manu- facturing and buildings; and in power, hydrogen, ammonia, and methanol production, where progressive participation in the same regional and/or sectoral carbon-pricing schemes is assumed. Some regions (EUR, NAM, OPA, CHN) are projected to reach carbon-price levels in the range of USD 22–95/tCO2 by 2030 and USD 70–135/tCO2 by 2050. Across all 10 regions, carbon pricing by mid-century is projected to range between USD 20/tCO2 (in NEE) and USD 135/tCO2 (in EUR). 9. Taxation of fuel, energy, carbon and grid connections — Fossil fuels used in road transport are taxed at the consumer level, labelled as fuel or carbon taxes. — Effective fossil-carbon rates are incorporated in fuel prices for road transport, with taxation highest in Europe. — We assume that these taxes will increase in line with a region’s carbon-price regime, rising at a quarter of the carbon-price growth rate. — Energy tax rates incorporated for other demand sectors (buildings, manufacturing) encourage switching from fossil fuels to electricity and hydrogen. Electricity taxation declines in high-tax regions to enable electrification of end-use sectors. In order to support hydrogen uptake, it is expected to be exempt from energy taxation through to 2035 in all regions. In regions prioritizing domestic use of hydrogen, the tax exemption has a phase-out profile, with hydrogen increasingly facing tax levels similar to those applied to the region’s future industrial electricity to assure a harmonized energy taxation system. — Taxes and grid tariffs for grid-connected electrolysers are assumed to be a 25% surcharge over the wholesale electricity price.
  • 81.
    160 DNV Energy TransitionOutlook 2022 161 Emissions and climate implications CHAPTER 7 7 EMISSIONS AND CLIMATE IMPLICATIONS Highlights This chapter present a forecast of cumulative energy- related emissions to 2050. Energy production and use represents more than 70% of global greenhouse gas emissions, of which most is CO2 . We find that while energy-related emissions peaked in 2019, and fell by 7% during the pandemic, they have now returned to near-record levels. By 2025, emissions will have grown to 32.8 GtCO2 (a little below 2019 levels) before declining gradually to 17.7 GtCO2 per year, 46% less than in 2021. To estimate the warming trajectory associated with these levels, we also take into account likely developments in agriculture and land-use emissions, and IPCC estimates of other greenhouse gases (GHGs). We calculate cumulative emissions to 2050 and assume a linear reduction from then until GHG emissions reach zero in 2100. That enables us to estimate the likely warming effect of the energy transition we forecast, which indicates a warming of 2.2°C by 2100 — which holds dire implications for climate-related damage. In Chapter 8, we detail DNV’s view on how to close the gap between the energy future we forecast and one that will limit global warming to 1.5°C. 7.1 Emissions163 7.2 Climate implications169
  • 82.
    162 DNV Energy TransitionOutlook 2022 163 Emissions and climate implications CHAPTER 7 7 EMISSIONS AND CLIMATE IMPLICATIONS 7.1 EMISSIONS The energy sector is responsible for more than 70% of annual greenhouse gas (GHG) emissions associated with human activities. The combustion of fossil fuels is the main contributor to emissions from the sector. Most of the emission is carbon dioxide (CO2 ), though methane (CH4 ) is also an important GHG when considering future climate implications. Emissions from energy-related activities have grown continuously since the Industrial Revolution and it is estimated that 50% of energy-related emissions have been added to the atmosphere in the last 50 years (Buis, 2019). After staying virtually flat between 2014 and 2016, global annual energy-related CO2 emissions grew to a peak of 33.6 GtCO2 in 2019. The effects of COVID-19 resulted in energy-related CO2 emissions dropping by approximately 7% in 2020, a reversal unprecedented in recent history. But as economic activity picked up, so did energy use and emissions. The pandemic has shifted the global emissions trajectory slightly down because the global economy and energy use need some years to regain momentum while decarbo- nization continues. We still find 2019 to be the year of peak emissions in our modelling. The impact of the COVID-19 pandemic on cumulative global emissions is very limited, however. Russia’s invasion of Ukraine has further disrupted the energy transition, with the net effect of a slight increase in emissions in the coming years as countries shift focus from decarbonization to securing the supply of energy, which in many regions means increased coal use or temporarily running oil-based electricity generation (aided by the possibility of price-capped or discounted Russian oil exports). Based on global energy demand, annual energy-related CO2 emissions rose 5.5% during 2021 and will grow to 32.8 GtCO2 by 2025 before declining gradually to 31.2 GtCO2 in 2030, almost the same level as in the COVID-affected year 2020. By mid-century, energy-related emissions are expected to be 17.7 GtCO2 per year, 46% less than in 2021 (Figure 7.1.). Combustion emissions Figure 7.1 shows coal as today’s main contributor (42%) of energy-related CO2 emissions, followed by oil (30%) and natural gas (26%). Emissions of CO2 from coal will see the strongest decline (62%) between 2020 and 2050. Emissions from oil will reduce by a third in that time, whereas those from natural gas will remain at today’s levels towards 2030 then drop to a quarter less than today’s emissions by 2050. In this chapter, we estimate the global energy-related CO2 emissions until 2050 associated with the ETO forecast. Adding these to the sum of other non-energy- related CO2 emissions (e.g. industrial processes and land-use) and energy emissions estimates beyond 2050, allows us to derive the cumulative emissions that decides the CO2 concentration, as well as derive the associated global climate response in terms of global average temperature increase. We do not assess climate implications such as flooding, drought, or forest fires beyond the future average warming associated with the cumulative CO2 emissions of our forecast. We describe future CO2 emissions from energy, include a likely development of agriculture and land-use emissions (which contribute significantly to both CO2 emissions and methane emissions); and we then assess climate impli- cations. In addition, we comment on methane emissions from the energy sector and its likely emissions due to changes in the energy system.
  • 83.
    164 DNV Energy TransitionOutlook 2022 165 Emissions and climate implications CHAPTER 7 Sector emissions Manufacturing is currently the largest sectoral contributor to energy-related CO2 emissions; 11 Gt in 2020, 36% of all energy-related emissions that year. The buildings sector made up 26% (8 GtCO2 ) of the total that year while transport, the third main energy demand sector, accounted for 24% (7.5 GtCO2 ) and was the most severely impacted by COVID-19. In 2050, manufacturing will remain the biggest emitter (34%), but with annual emissions reduced to 6 GtCO2 . Transport’s share will increase to 30% by then, but in absolute terms its emissions will reduce to 5.3 GtCO2 , while the buildings sector’s emissions declines to 4 GtCO2 (22%) as seen in Figure 7.2. The dynamics behind these emission reductions are summarized as follows: — The manufacturing sector emissions will decline steadily over the whole forecast period with electrifi- cation, fuel-switching and carbon capture and storage (CCS) in combination contributing to almost halving emissions from manufacturing. — The buildings sector will see a steady decline and halving of its emissions, despite significant growth in the number of commercial and residential buildings. Continuous improvements in energy efficiency and switching to cleaner sources of fuel for heating (e.g. electricity combined with heat pumps) will be the main reasons for these reductions. — The transport sector saw a sharp decline in emissions in 2020 due to the COVID-19 pandemic. In the longer term, the main trend of electrifying road transport will result in emissions declining 30% to 2050. This is not just because EVs use energy more efficiently, but also because electricity production from renewable sources will increase, supplying ever-more emission-free electricity to the transport sector. However, it is only by the mid-2020s that transport emissions start to decline. This is because even though the growing number of EVs reduce emissions, the effect is initially countered by transport growth and a lack of emission reductions in shipping and aviation. Regional emissions Our 10 Outlook regions have different starting points and very different emission trajectories over the forecast period. Greater China, currently the largest emitter by far, will reach peak emissions before 2030; its emissions will then decline to mid-century, when they will be 71% less than in 2020. The Indian Subcontinent will continue to grow its emissions, peaking by 2040 then declining 15% by 2050 to be 40% higher in mid-century than in 2020. Sub- Saharan Africa will show an increase of 61% compared with today. All other regions will reduce their emissions Figure 7.3, led by Europe (-78%), OECD Pacific (-77%) and North America (-68%). North East Eurasia will have the highest emissions per capita at 7.5 tonnes in 2050, followed by North America and Middle East and North Africa at 3.5 t per person (see graphic on Energy, GDP and population, page 172). We describe regional emissions in more detail in Chapter 9. Process-related emissions In addition to CO2 emissions from combustion of fossil fuels, there are significant emissions from industrial processes that either consume fossil fuels as raw material for feedstock (e.g. plastics and petrochemical products) or through processes that produce CO2 through a chemical reaction (e.g. cement and other industrial processes). These process-related emissions, together with estimates of the subsequent capture of some of these process emissions, are included in our analysis as part of the manufacturing sector. In 2020, these emissions were an estimated 3.7 GtCO2 , of which approximately 44% were from calcination in the cement-production process. The remainder of the emissions were 40% from ammonia production, and small shares from coke ovens and the production of lime or other chemicals. We expect a slight rise in construction and industrial growth, which largely drives process emissions, over the next 15 years, and then a stabilization. However, while output might stabilize at a higher level than today, improvements in production and technical efficiencies, combined with increasing shares of these emissions being captured, mean that the resulting emissions level will decline towards 2040, and fall even more quickly in the decade to year 2050. In mid-century, process-related industrial emissions will be 35% less than today. Land-use emissions CO2 emissions from AFOLU (agriculture, forestry, and other land use) are not included in our forecast and modelling but are at a similar level to Europe’s emissions. They are substantial enough, then, to warrant inclusion of land-use emissions in any calculation of global emissions. Emissions from land-use have been growing slowly over the last 20 years, historically averaging 5 GtCO2 per year, but with large annual fluctuations. Most recent research has adjusted land-use emission down slightly from the historical average. Even incorporating last year’s forest fires, the latest such estimate is that there was a decline to 3.2 GtCO2 per year in 2020 (Global Carbon Budget, 2021). There is currently considerable uncertainty about changes in future land use, as some countries with large forest areas are losing them at double-digit percentage rates compared with previous years, due to deforestation and forest fires (Global Forest Watch, 2021). However, we expect that climate and sustainability concerns will eventually affect policy, creating pressure to control land-use changes. Thus, our best estimate is that annual CO2 emissions from land-use changes will slowly decline towards 3 Gt in 2030, and then reduce linearly to 2 Gt in 2050, almost 40% less than today’s annual levels.
  • 84.
    166 DNV Energy TransitionOutlook 2022 167 Emissions and climate implications CHAPTER 7 Carbon capture and removal CCS today is almost solely applied as part of enhanced oil recovery, where there is a viable business case, capturing a mere 26 MtCO2 per year. Going forward, we expect that operators of large point sources in the power and manufacturing sectors will increase the capture of carbon from their processes and waste streams. Additionally, we expect all carbon emissions from hydrogen production as an energy carrier to be captured in the steam-methane reforming (SMR) process; we also foresee capture of an increasing share of emissions associated with hydrogen production for the process industry. Some capture is also expected when flaring occurs during natural gas processing. However, for all the existing and announced policy on CCS, its uptake will be very limited in the near- to medium- term, and effectively too late and too little in the longer term. It is only in the 2040s, when carbon prices start to approach the cost of CCS, that uptake accelerates and deployment at scale begins. By 2050, we find emissions captured by CCS to be 1.3 GtCO2 . Of these 0.3 GtCO2 will be captured from SMR, 0.4 GtCO2 from process-related emission from activities consuming fossil-fuels as feed- stock, and the rest from point-source capture in power and manufacturing (Figure 7.4). By 2050, the remaining emissions for potential capture in power and manu- facturing are in regions with low carbon prices, which to a large extent explains why total carbon captured amounts to only 6% of all CO2 emissions in 2050. Direct air capture (DAC), which involves the direct capture of CO2 from the atmosphere and then sequestering the captured CO2 , is still an emerging technology. It shows great promise for decarbonization after 2050 but will not scale fast enough to make a meaningful difference to emissions before then. It is nevertheless a much needed niche and very meaningful at the scale of individual companies. We note that any pathway to net zero by 2050 will have to accelerate DAC technology development and uptake enormously (see Chapter 8). Almost 60% of CCS capacity will be in Europe, Greater China, and North America. Europe is the only region with high enough carbon prices to make a viable business case for CCS before 2040. The other regions will have considerable fossil-fuel use and relatively moderate carbon prices. CCS development is thus not happening at sufficient speed or scale to make a significant impact in reducing emissions enough to prevent future global warming. In September 2022, Climeworks and Carbfix announced the development the world's first full-chain certification methodology dedicated to CO2 removal via direct air capture and underground mineralization storage. This methodology has been validated by DNV. (Image, courtesy Climeworks) Methane (CH4 ) is a greenhouse gas which is the second largest contributor, after CO2 , to global warming. The concentration of CH4 in the atmosphere has more than doubled since pre-industrial times. Approximately half the CH4 emitted is anthropogenic. Most of these emissions are associated with the agricultural sector (40%), and approximately 35% from extraction and use of the fossil fuels oil, natural gas, and coal (UNEP, 2021). Methane has a shorter half-life (12.4 years) than carbon dioxide. However, methane is a more potent GHG than CO2 per tonne of GHG emitted; 29.8 times more potent over the 100-year Global Warming Potential (GWP) time horizon, and 82.5 times so in a 20-year GWP perspective (IPCC, 2021). Total anthropogenic CH4 emissions in 2021 were estimated at 357 Mt (IEA, 2021c). When converted to their CO2 equivalent value using 100-year GWP, that amounts to 10.6 GtCO2 eq, which is a little less than a third of the global CO2 emissions from the energy sector. This is not an insignificant amount, especially given that mitigating involuntary CH4 emissions is fiscally expedient as it may be used as energy, thus fractionally reducing the need for extraction. Global Methane Pledge One of the important commitments regarding curtailing CH4 emissions is the Global Methane Pledge (GMP) brought forward by the US and EU at COP26 in 2021 (Global Methane Pledge, 2021). At present it has around 120 participating countries, who account for 45% of total anthropogenic CH4 emissions. The GMP aims to reduce global CH4 emissions by 30% by 2030, compared with 2020 levels. Despite its very good intentions, the Pledge has obvious drawbacks. One is that some countries with large CH4 emissions, such as the Russian Federation, China, Kazakhstan, and Venezuela, among others, are conspic- uously absent from it. Second, while the GMP puts forward a global target, it does not disaggregate the easier-to-abate sectors from the total emissions; such sectors include, among others, fossil-fuel extraction and use, where abating CH4 emissions has a negative cost, or a net monetary benefit. The geopolitical climate after February 2022 is radically different from when the GMP was unveiled. With the Russian invasion of Ukraine, and the ensuing natural gas supply shock, the focus has shifted firmly away from CH4 emissions accumulating from the fossil-fuel sector, to mitigating energy-supply insecurity. To put it bluntly, countries need oil and natural gas now, and do not care how they get it. In fact, preliminary numbers suggest that CH4 emissions from oil and gas extraction have increased in 2022 compared with 2021 (Financial Times, 2022a), which our results also show. Methane emissions from fossil fuels
  • 85.
    168 DNV Energy TransitionOutlook 2022 169 Emissions and climate implications CHAPTER 7 Methane emissions from fossil fuels In our Outlook, we present the CH4 emissions from the coalmining process, and from oil and natural gas extraction, transmission, and distribution. Historical data on CH4 emissions from all fossil fuels are obtained from EDGAR, the Emissions Database for Global Atmospheric Research (EC-JRC and PBL, 2021). The resulting emissions are projected based on activity levels of oil and natural gas production by field type (conventional onshore, offshore, and unconventional), and coal production. For oil and gas CH4 emissions, we also separate the CH4 emission mechanisms, namely vented, fugitive, and incomplete flaring. Our projection indicates that the world will fail to meet the Global Methane Pledge by 2030, at least in terms of CH4 emissions from fossil fuels. The CH4 emissions from fossil fuels are 108 Mt per year in 2030, only 7% less than the 115 Mt in emitted in 2020 (Figure 7.5). We project CH4 emissions of 88 Mt per year in 2040, 24% less than in 2020. By mid-century, CH4 emissions will be half of what they were in 2020, primarily thanks to reduction in demand for coal and oil. In 2020, CH4 emissions from natural gas were 40% of the total emissions, with coal and oil having approximately equal shares of 30% (Figure 7.6). But we estimate these shares will change gradually, with coal CH4 emissions seeing a drastic reduction thanks to reduction of demand. By mid-century, half of the methane emissions from fossil fuels will be due to the extraction, transmission, and distribution of natural gas, with oil contributing 30%, and coal 20%. Why only CO2 and CH4 ? Other greenhouse gases, such as NOx, HFCs and CFCs, are more potent climate gases (measured in GWP per tonne of gas emitted) and more persistent than both CO2 and CH4 . However, we do not consider these in our analysis. There are two main reasons for this. First, the energy sector is not a significant contributor to these emissions. Second, the quantities of these GHGs are low despite their high potency. Thus, these emissions could potentially be much more easily reduced through regulation and are not correlated to our energy systems model. Our forecast gives future levels on CO2 emissions per year and enables us to determine the corresponding climate response and its associated temperature increase. We focus only on first-order effects and do not include possible tipping points and feedback loops, such as melting permafrost and peat fires, which would accelerate global warming. Other climate implications, including those directly associated with emissions (e.g. acidification of the oceans), or indirect consequences such as sea-level rise, are not dealt with in this Outlook which concentrates on the energy transition and its associated CO2 emissions. CO2 concentration The concentration of CO2 in the atmosphere is measured as parts per million (ppm). Pre-industrial levels were around 280 ppm (Global Carbon Project, 2020), and emissions related to human activities, particularly burning fossil fuels, have resulted in a significant increase. The most recent reading, in June 2022, was a record level of 417.42 ppm (NOAA GML, 2022). Over the last 60 years, there has been an increase in the concentration of over 100 ppm, which is of the same magnitude as the entirety of shifts observed over the previous 800,000 years (IPCCa, 2021). We forecast a continuation of CO2 emissions to the atmosphere linked to human activities, albeit at a decreasing rate. In contrast to methane, which on average oxidizes after approximately 10 years (IPCC, 2001), it takes hundreds to thousands of years for CO2 to disappear naturally from the atmosphere (Archer et al., 2009). Thus, with the lengthy persistence of CO2 in the atmosphere, the cumulative concentration of CO2 gives a direct indication of long-term global warming. As there is a causal link between concentration and long-term temperature increase (IPCCa, 2021), it is possible to calculate the expected temperature increase based on the cumulative net global amount of CO2 in the atmosphere. Similarly, limiting global warming to a given level with a given probability, taking into account the effect of other anthropogenic GHGs and pollution, gives the maximum amount of cumulative net global anthropo- genic CO2 emissions, often referred to as the global carbon budget. Carbon budget The carbon budget includes several uncertainties. They include the accuracy of data on historical emissions; the accuracy of the estimated warming to date; the role of other GHG emissions in current warming; Earth system feedbacks; and, the delay between emissions having reached net zero and the additional amount of warming inherent in the system. The closer we get to the temper- ature increase that we wish to avoid (e.g. increase above 1.5°C), the more these parameters contribute to uncertainty. Despite these uncertainties, the carbon budget has proved to be a reasonable method to indicate potential future warming levels based on different scenarios for energy-related emissions. For our temperature estimates, we have used the ‘likely’ (meaning 67% probability) carbon budgets from the IPCC Sixth Assessment Report (IPCC, 2021). By selecting a 67% chance to stay below the selected temperature thresh- old, we have chosen to increase the certainty of limiting warming to our selected respective temperature thres- holds. IPCC concludes that to stay below 1.5°C, we have to limit cumulative emissions from 2020 onwards to 400 GtCO2 , and to 1,150 GtCO2 to remain below 2.0°C. The IPCC carbon budgets have taken account of emis- sions from other GHGs. Methane emissions from fossil fuels or changes in agricultural practices, including fertilizer use or aerosol emissions, can have considerable influence on the size of the carbon budget. We use the IPCC scenarios in line with ‘very low’ and ‘low’ non-CO2 emissions estimates, that follow a similar path as our CO2 emission trajectory. If emissions from non-CO2 GHGs are larger, then the carbon budget will be smaller and associated temperature increase larger. 7.2 CLIMATE IMPLICATIONS
  • 86.
    170 DNV Energy TransitionOutlook 2022 171 Emissions and climate implications CHAPTER 7 Using the IPCC carbon budgets and the cumulative CO2 emissions from our forecast, we find that the 1.5°C budget will be exhausted in 2029. The carbon budget associated with the 2.0°C threshold will be exhausted in 2056, outside the forecast period. The CO2 emissions from energy-related activities as well as industrial process and land-use emissions will still be considerable post-2050 and will continue many years thereafter. Thus the question arises: ‘What temperature increase does our forecast suggest?’ Temperature increase Our forecast and associated CO2 emissions end in 2050. Therefore, in order to use the overshoot of the carbon budgets to evaluate a likely temperature increase, the emissions for the latter part of this century must be assessed. By 2050, the emissions trajectory shows a relatively steep decline, with increasing amounts of CO2 captured by CCS. Beyond 2050, our analysis assumes we will arrive at net-zero CO2 emissions before or at the end of this century. To estimate the CO2 emissions and global warming by the end of the century, we extrapolate the development of emissions and their capture towards 2100. Capture occurs only within the sectors shown in Figure 7.4; so, for sectors such as transport or buildings where there is zero or marginal capture, we extrapolate a decline in line with our forecast but ending at net zero by 2100. The approach gives us estimated cumulative emissions of 370 GtCO2 between 2050 and 2100 (Figure 7.7). This estimate does not include any large-scale negative-emissions technologies that may be able to reduce the atmospheric CO2 concentrations significantly. With the updated climate response from IPCC AR6 (IPCC, 2021) using the 67% ‘likely’ overshoot of 300 GtCO2 compared with the 2.0°C budget suggests that the world will reach a level of warming of 2.2°C above pre-industrial levels by 2100. We find that 1.5°C budget will be exhausted in 2029, and the 2.0°C budget in 2056 The UN Intergovernmental Panel on Climate Change (IPCC) is now completing the sixth assessment cycle. While preparing the Synthesis report to be published late 2023 or early 2024 the following three reports have been issued: — Climate Change 2021 — The Physical science basis — Climate change 2022 — Impact, adaptation and vulnerability — Climate change 2022 — Mitigation of climate change We do not intend to summarize the reports here but are intensely aware of the warning stemming from them. In describing climate change, they use expressions such as ‘widespread and rapid’ and ‘unprecedented over many centuries to many thousands of years’. We acknowledge this work and use the IPCC report as input for our analysis. While our Energy Transition Outlook is an energy and not a climate forecast, the IPCC reports set the scene, documenting in a more comprehensive way than any other work has ever achieved just why an energy transition is needed; what factors create climate change; and the various ways in which an energy transition — or lack thereof — will impact regions and the planet in the coming decades and centuries. It also outlines the risk and uncertainties in the scientific work. As such, it creates a very solid foundation for our assessment of emissions and climate implications of the energy transition. IPCC Sixth Assessment Reports on climate science António Guterres United Nations Secretary-General 9 August 2021 Today's IPCC Working Group 1 Report is a code red for humanity.
  • 87.
    172 173 Emissions andclimate implications CHAPTER 7 DNV Energy Transition Outlook 2022 World North America (NAM) Latin America (LAM) Europe (EUR) Sub-Saharan Africa (SSA) Middle East and North Africa (MEA) Energy-related CO2 emissions per person (Tonnes per year) North East Eurasia (NEE) Greater China (CHN) Indian Subcontinent (IND) South East Asia (SEA) OECD Pacific (OPA) 2020 2050 2020 2050 2020 2050 2050 2050 2050 2050 2020 2050 2020 2050 2020 2050 2020 2050 2020 2050 2020 2050 13.6 3.7 2.2 1.7 5.4 1.2 0.8 0.8 5.0 3.5 7.4 5.8 6.8 2.2 1.4 1.5 2.3 1.9 9.4 2.3 4.0 1.9 Energy use per person (Gigajoules per year) 266 167 49 60 121 97 24 23 90 96 140 132 105 94 170 122 75 67 25 43 44 65 GDP per person (USD2017ppp/ person-yr) 59 300 78 300 14 800 30100 38 800 57 500 3 800 9 600 20 100 39 300 17 400 30 500 21 600 49 200 39 800 56900 17 300 31 700 6 500 21 200 12 900 32 300 GDP, ENERGY USE AND EMISSIONS ACROSS OUR 10 OUTLOOK REGIONS This illustration shows, for each region considered in this Outlook, a comparison between per capita GDP, primary energy use and energy-related CO2 emissions (2020 and forecast figures for 2050) 2020-2050 Overview
  • 88.
    174 DNV Energy TransitionOutlook 2022 175 Pathway to net zero emissions CHAPTER 8 PATHWAY TO NET ZERO EMISSIONS 8 PATHWAY TO NET ZERO EMISSIONS (PNZ) Highlights This chapter presents DNV’s Pathway to Net Zero emissions, which we consider to be a technically and economically feasible — but unavoidably challenging scenario. Unlike our ETO forecast (the main focus of this report), which results in global warming of 2.2°C by 2100, our Pathway to Net Zero emissions (PNZ) is a ‘back-cast’ estimation of what is needed to achieve a net-zero energy system by 2050 with the aim of securing a 1.5°C warming future. We detail here the size of the gap between our forecast and the PNZ, and detail what needs to change in the supply and demand sectors to achieve net zero. A key principle is that not all sectors will be able to reach net zero emission by 2050. Moreover, not all regions will be able to do so — implying that some demand sectors (e.g. transport) and regions (typically high-income regions) must go below zero before 2050. Chapter 9 provides more detail on the net zero pathways for each of our 10 world regions. 8.1 Pathway to net zero emissions (PNZ)176 8.2 Net zero policies180 8.3 Net zero demand and supply182 8.4 Net zero expenditures192 8.5 CO2 and methane emissions194 8.6 Sectoral roadmaps198
  • 89.
    176 DNV Energy TransitionOutlook 2022 177 Pathway to net zero emissions CHAPTER 8 PATHWAY TO NET ZERO EMISSIONS 8.1 PATHWAY TO NET ZERO EMISSIONS (PNZ) “The best way to predict the future is to create it” — Peter Drucker (2009). This chapter describes what DNV believes to be a plausible, but challenging, pathway to a net zero emissions (PNZ) by 2050. This pathway differs markedly from DNV's 'best estimate' forecast of the most likely energy future captured in the rest of this year's Energy Transition Outlook (ETO). From here on, we use ETO forecast to refer to the most likely future, as a contrast to a PNZ future. Comparing our forecast with a pathway to net zero allows us to place a dimension on the scale of the change needed to achieve an energy transition that secures a 1.5°C future. In its contribution to the IPCC’s Sixth Assessment Report (AR6) on climate change (IPCC, 2022), Working Group III describes 230 pathways that align with a 1.5°C future. Two things common to all these pathways are net zero CO2 emissions around 2050, and the use of some sort of carbon dioxide removal technology. Accounting for greenhouse gases (GHGs) Saying that achieving net zero CO2 emissions in 2050 will limit global warming to below 1.5°C is, of course, a simplification. While CO2 represents 65% of GHG emissions, what happens to other highly potent GHGs such as methane will be important. The IPCC carbon budgets and net zero considerations take account of emissions of these. For instance, methane emissions from fossil fuels or changes in agricultural practices, including fertilizer use or aerosol emissions, have considerable influence on what net zero CO2 will mean in practice. We use the IPCC scenarios in line with ‘very low’ and ‘low’ non-CO2 GHG emissions estimates, corresponding well with the very low CO2 emissions we project; hence the approach is consistent. Gross zero and net zero While net zero emissions is a logical goal on a global scale, it should be applied with care at regional and sectoral scales. There is a big difference between net zero and gross zero, and a global net zero future does not mean all sectors and regions will meet the zero-emission threshold. It is both implausible and unjust to expect a gross zero result — i.e. that all sectors, regions, or countries achieve this challenging goal at the same time. Each region differs in its emissions status and its ability to reduce emissions. Similarly, the ready availability of abatement options varies considerably between various demand sectors. Accordingly, this report applies the net zero approach only on a global scale, while allowing for a large differen- tiation on a regional scale. Similarly, we apply the net zero approach to the entirety of energy demand, not for individual demand sectors, which will decarbonize at different rates. Applying our ‘most likely’ future from the ETO forecast allows us to see where regions and sectors are going to be, compared with where they need to go. A fair transition While the concept of a ‘just transition’ is compelling, we have not attempted to model a dramatic transfer of wealth across world regions over the next 30 years. This choice is partly because ‘energy provision and consump- tion’ is a relatively small component of total economic activity, and because such wealth transfer is not very likely to happen any time soon. Therefore, in our PNZ, we have applied the same population and GDP growth assumptions — and consequently, the same GDP per person in 2050 — as we use in our ETO forecast of the ‘most likely’ future. While this is inconsistent with the notion of a just transition, a greater injustice would arise from the expectation that all regions should move at the same decarbonization pace regardless of their different starting positions. We have therefore scaled the imple- mentation of measures to achieve net zero relative to the GDP of the region, as further described in our policy section. Arguably, our approach thus balances the fair and the plausible. The size of the emissions gap The ETO emissions forecast summarized in Chapter 7 predicts 22.2 GtCO2 of annual emission in 2050, showing there is a big gap to be closed to reach net zero emissions by then. Furthermore, as carbon emissions will overshoot the carbon budget for 1.5°C, there will be a need for CO2 removal in the post-2050 era to stabilize warming at 1.5°C. Global temperature increase is closely correlated with atmospheric CO2 concentration, which is continuously growing as annual emissions are larger than the capacity of the land and oceans to sequester the CO2 emitted. At the start of 2021, the carbon budget for reaching 1.5°C of global warming was 360 Gt of carbon dioxide. Our ETO forecast sees this budget being used up by 2029; hence, all emissions thereafter will first have to go to zero, and then below zero for 50 years to remove the overshoot of 300 GtCO2 by the end of the century, as illustrated in Figure 8.1. This is an enormous task and a huge gap compared with the emission levels we forecast in the ETO. Closing the gap So, how do we close this gap? Most of the CO2 emissions need to be avoided through implementing low-emission technologies in the energy system. There are technical solutions that need massive deployment and scale up, such as renewable energy, storage, grids, hydrogen, and CCS. Other technologies must be scaled down, such as coal, oil, gas, and combustion engines. These actions alone will be insufficient, and there will also be a need to deploy significant amounts of carbon removal technolo- gies. These could be nature-based solutions such as reducing deforestation and increasing sequestration in biomass. They could also be technical deployments like direct air capture (DAC). Cumulative removal of CO2 must reach almost 7 GtCO2 in total by the end of the century to remove the overshoot accumulated by 2050. Policy that drives or pulls through development and implementation of abatement and removal solutions is the main lever for scaling them up. If we are to close the gap and limit the global average temperature increase to 1.5°C, it will be through tightening energy, industrial, and climate policies in all regions and sectors, and by applying the entire policy toolbox. The net zero policy conside- rations included in the PNZ are described in Section 8.2. The emissions reduction potential of changing behaviour is also worth consideration. Policy nudges behaviour, and there is a fine balance in deciding whether such changes should be encouraged or enforced. For example, we have limited the increase in the number of air flights in our modelling by making flying more expensive through significant sustainable aviation fuel (SAF) uptake policies, such as taxes and mandates.
  • 90.
    178 DNV Energy TransitionOutlook 2022 179 Pathway to net zero emissions CHAPTER 8 PATHWAY TO NET ZERO EMISSIONS The ETO forecast describes the future that DNV considers ‘most-likely’. This is not a future in which CO2 emissions reach net zero in 2050 — far from it. It is logical to question, therefore, whether achieving a net zero future by 2050 is at all realistic. A ‘most likely’ future does not, of course, rule out other possible futures. In our view, net zero CO2 emission by 2050 is still possible, but only barely and will need urgent, concentrated, and simultaneous effort from all regions and countries. This chapter outlines what we believe to be a realistic, albeit very narrow, pathway to net zero emissions. It includes detailed net zero road- maps for each major demand sector. Regional net zero pathways are included in Chapter 9. Individually and collectively, the sectoral roadmaps are all possible, though very challenging. They require not only strong contributions from technology and finance, but an extraordinary step-up in energy policies, and sometimes behavioural changes. Moreover, these changes need to be achieved simultaneously. Alterna- tively, if some sectors or regions underperform in relation to the roadmaps, other sectors or regions will need to over-deliver on already-challenging roadmaps. Achieving net zero by 2050 is realistic for some sectors, some regions, and some countries; but that is not enough when we need to achieve global net zero. Assuming that some sectors and regions will not achieve net zero by 2050, others will have to strengthen their targets and achieve net zero before 2050 and net negative emissions in 2050. Nations and sectors that conceivably can move faster are going to have to do so. Each of the roadmaps we set out here is challenging; the chances of all being achieved are low. If by ‘realistic’, we mean a convincing or better-than-even chance of achieving something, then we would need to concede that net zero by 2050 is unrealistic. It is, however, possible; and given what is at stake, it is imperative to do our outmost to achieve it. It is also crucial to realize that every tenth of a degree of global warming matters disproportionately, as even relatively small additional increases in temperature give additional long-term consequences and risk hitting planetary tipping points. 1.6°C of global warming is much better than 1.7°C, and 1.9°C much better than 2.0°C, and so on. Because impacts pile up extraordinarily for levels of warming above 1.5°C, the rational response is surely to expend extraordinary effort now and in the coming years to avoid a very dangerous long-term future. DNV’s contribution lies precisely in not painting a rose-tinted view that net zero is easy to achieve, and by providing a reality orientation on exactly how difficult the goal is. Is net zero probable? No — but it is still possible. Achieving net zero by 2050 is realistic for some sectors, some regions, and some countries; but that is not enough when we need to achieve global net zero. Is net zero realistic?
  • 91.
    180 DNV Energy TransitionOutlook 2022 PATHWAY TO NET ZERO EMISSIONS 8.2 NET ZERO POLICIES World leaders of the 2020s will be remembered for either overseeing the continued expansion of unabated fossil-fuel use, or for successfully acting on science and the already overwhelming evidence of devastating climate damage. UN Secretary General António Guterres’ message at the UN General Assembly climate roundtable (UN, 2022b) was clear: “The 1.5-degrees limit is on life support — and it is fading fast. I particularly call on G20 leadership to end our fossil-fuel addiction. No new coal. Phasing out existing coal. Backing a renewables revolution. The fossil-fuel industry is killing us, and leaders are out of step with their people, who are crying out for urgent climate action.” Leaders have acted to some extent. A recent global stocktake suggests that net zero target setting and coverage have proliferated, now encompassing 91% of the global economy (Net Zero Tracker, 2022). But there is questionable robustness in governance and concrete plans to achieve targets, and lack of clarity on the extent of inclusion of all GHGs and how much reliance is being placed on futuristic offsets. Bending the emissions curve will require immense intensification of government involvement in energy systems. Requirements, bans, and economic support are inescapable to spur structural change and emission cuts in time to achieve even existing targets. Enactment of policies that ensure near-term implementation of decar- bonization options, at massive scale and speed, will be necessary, as well as a much greater level of cooperation and funding across regions. DNV's PNZ activates the policy toolbox of known and proven measures (see Section 6.4) to trigger emission reductions in energy demand and supply sectors. Our pathway aims to bring continuing emissions as close as possible to zero, and to then rely on carbon removal technologies both for any remaining emissions and to compensate for carbon budget overshoot emissions. Solutions comprise several technologies at varying levels of commercial readiness, and a blend of policies will therefore be needed. The urgency to achieve net zero will require synchronous acceleration of both technology development and uptake. The overarching principle guiding our policy measures to achieve a net-zero outcome, is that high GDP regions (Europe, North America, OECD Pacific, Greater China) move at faster pace and greater depth to achieve the Paris target, which aligns with the UNFCCC principle of common but differentiated responsibilities and respective capabilities in addressing global climate change. These regional economies have strong decarbonization goals, account for the bulk of emissions (historically and presently above 60% of global emissions) and emit far more than less affluent regions. They also possess the wealth and competence for technology development and to boost cost learning curve-based cost reductions for key abatement technologies. Here, we highlight the strengthened policy factors forging our pathway to net zero, and regional details are presented in Chapters 9. World leaders of the 2020s will be remembered for either overseeing the continued expansion of unabated fossil- fuel use, or for successfully acting on science and the already overwhelming evidence of devastating climate damage. Buildings — Bans target phase-out of fossil-based heating and limit equipment choices for space/water/cooking — Higher energy efficiency standards (new builds and renovations) reduce heating/cooling demand — Consumer-side fossil-fuel subsidies are removed, and higher cost of capital hinders fossil-based heating Transport — Fuel economy emission standards tighten in all markets, and taxes on gasoline/diesel increase — Bans on new ICE vehicle sales in developed regions from 2030 (first-mover countries and stepwise regional implementation), followed by most low-income regions in the 2040s — Zero-emission vehicle incentives promote EV adoption and support charging infrastructure — Shipping and aviation fuel-mix shifts driven by fuel-blend mandates and carbon pricing Manufacturing — Carbon pricing drives CCS uptake — Cost-of-capital increases drive down attractiveness of fossil-based equipment — CAPEX support for electrification and for hydrogen usage/ supply-chain shifts in iron and steelmaking — Energy intensity improvements driven by regionally differentiated taxation on fuels — Energy taxation encourages fuel shifts to electricity and hydrogen usage — Requirements increase material efficiency (e.g. in cement production/use) and recycling rates (e.g. plastics, scrap steel) Power generation — Cost of capital increases reduce the attractiveness of fossil-based generation — A mix of mandates and carbon pricing end unabated gas-fired generation in all regions — Bans enable oil and coal-fired generation phase-out in all regions by 2045 — All regions support renewable build-out, including for storage capacity coupled with renewables CCS Direct air capture — Higher carbon prices accelerate deployment — Mandates require CCS in natural gas-fired power generation — Ramp-up of CCS and direct air capture (DAC) capacity is enabled by policies supporting CAPEX reduction and value-chain/infrastructure development Hydrogen support — Policy measures stimulate hydrogen demand; e.g. blend mandates in aviation and maritime, and energy taxation boosting fuel shifts in manufacturing and in other hard-to- abate sectors — Policy measures stimulate hydrogen supply, such as CAPEX support for low-carbon production routes, dedicated renewables-based electrolysis, and subsidies to grid- powered, renewables-based electrolysis Energy efficiency — Targets and legislation accelerate the pace of energy- efficiency improvements; e.g. tightened standards for equipment and appliances, building codes, requirements renovation/retrofits, and energy-intensity improvements in buildings — Incentives to replenish equipment bases; e.g. from fossil to electricity-based technologies, or switching to alternative combustion-based fuel — Tax cuts, access to cheap financing, and direct subsidies for energy-efficient technologies — RD support for new technologies — Public spending for build-out of support infrastructure; e.g. EV chargers, hydrogen, and district heating networks Carbon pricing — High GDP regions accustomed to energy fees, will be frontrunners (EUR, NAM, OPA slightly above CHN) reaching price levels of 100–150 USD/tCO2 by 2030. By 2050, regional trajectories range between 50–250 USD/tCO2 — Carbon-border adjustment mechanisms drive convergence among leading regions, and pull all regions’ carbon-price trajectories upwards Government funding Cost of capital — Most region governments will redirect funding towards emissions reduction and clean energy, both domestic and overseas. Examples of the latter are Chinese, South Korean, and Japanese commitments to not build/finance new coal-fired power projects abroad, and G7 countries ending support without co-located CCS — Revision of government funding parallels a finance sector shift to align investment practices with net zero; increasingly limited pools of capital will be available for fossil-fuel projects and with higher cost of capital, coal-fired facilities will face the highest discount rates Pathway to net zero emissions CHAPTER 8 181 PATHWAY TO NET ZERO EMISSIONS
  • 92.
    182 DNV Energy TransitionOutlook 2022 Pathway to net zero emissions CHAPTER 8 PATHWAY TO NET ZERO EMISSIONS 8.3 NET ZERO DEMAND AND SUPPLY 2020 2025 2030 2035 2040 2045 2050 2100 0 10 20 -10 40 30 50 Pathway to net zero emissions Units: GtCO2 /yr Natural gas use peaks Battery pack cost $100/kWh No new oil gas field development (OECD regions) Europe energy emissions reduce 67% compared to 1990 N. America manufacturing reaches net zero Solar PV eclipses wind as the largest primary energy source 6.9 GtCO2 per year negative emissions via CCS and DAC and removal by land use changes (reforestation etc.) N. America and Europe reach net zero with DAC CCS peaks at 5.2 GtCO2 EVs outnumber ICEVs (passenger) No new oil gas field development (Rest of world) China: emissions 50% of 2019 Europe: 50% new vehicle sales EV EVs outnumber ICEVs (commercial) on the road New ICE passenger vehicle sales banned China, Europe, N. America Solar PV becomes biggest source of electricity globally Coal-fired power stations banned Hydrogen = 10% energy demand, and growing Decoupling of economic activity and energy use must intensify under the pathway to net zero (PNZ). The population and the GDP in the various regions are the same in the PNZ as in the ETO forecast, described in Appendix A2 and A3 in the report. It would have been possible to define a PNZ with another GDP, but we have chosen not to do any changes. Final energy demand in the PNZ, as illustrated in Figure 8.2 is 399 EJ in 2050, 9% less than today. Final energy demand plateaus until 2035, thereafter declining. Buildings and manufacturing both see flat energy demand, while transport sector energy demand reduces by a third by 2050. A more detailed description of PNZ energy demand is given in Section 8.6. Primary energy supply (Figure 8.3) in a PNZ future, slowly reduces to around 95% of the present level to 2050. The energy mix will change dramatically: fossil use reducing from a 79% share today to 23% in 2050, implying a fossil share decline of 2% per year. In 2050, fossil-fuel use in PNZ has less than half the share predicted in our ETO forecast. Still, a mid-century share of 23% is considerable, and will be accompanied by carbon capture for all major point-emission sources to reach net zero emissions. Fundamental to the PNZ is a massive ramping up of variable renewable energy, with solar (31%) and wind (20%) together constituting more than half the energy mix, and strong growth also seen for biomass and hydropower. Nuclear energy remains around current levels to mid-century.
  • 93.
    184 DNV Energy TransitionOutlook 2022 185 Pathway to net zero emissions CHAPTER 8 PATHWAY TO NET ZERO EMISSIONS 8.3.1 Natural Gas In the PNZ future, global gas demand will decline from 150 EJ today to 117 EJ by 2030 and 53 EJ by mid-century — a 75% reduction. The power sector will remain the primary consumer of gas, contributing 56 EJ to total demand today, 46 EJ in 2030, and 15 EJ by 2050. Never- theless, natural gas’ share in power generation will decline from 35% today to 24% by 2050. Increasing electrification of residential and commercial heating and cooking will see the buildings sector’s share of gas demand decline from 21% now to 8% (fifth position among sectors) by 2050. As is the case with oil, non-energy use of gas as a feedstock will climb, from a 9% share now (fifth among demand sectors) to 16% (second) in 2050, since feedstock use is a low source of emissions. The energy sector’s own use of gas will decline slowly from 20 EJ today to 11 EJ by 2050, while manufacturing sector energy demand halves to 13 EJ by mid-century. North America is currently the world’s leading producer of natural gas, responsible for more than a quarter of global production. It will concede this position to Middle East and North Africa, due to their less-stringent climate ambitions and lower extraction costs. By 2050, Middle East and North Africa will dominate the natural gas market, supplying close to half (47%) of global demand. North East Eurasia will follow the fuel’s decline in use, continuing to supply on average 22% of global gas over the next three decades. In the PNZ, the declining gas demand can be supplied almost without new fields, and capacity additions are therefore halted within this decade, before 2024 in OECD regions, and from 2026–2028 elsewhere. 8.3.2 Oil After the 2021/2022 rebound from the COVID-19 pandemic, global oil demand in the PNZ will grow from around 159 EJ in 2022 to 161 EJ in 2024, before rapidly declining 73% from that peak to reach 43 EJ in 2050. The lion’s share of this remaining demand will be split almost equally between the non-energy sector (45%), where oil will continue to be used for producing petrochemicals and plastics with no major associated emissions, and the transport sector (43%). Within transport, the remaining demand will be concentrated in the road sector in lower-income regions (77% of total) and in the hard-to- electrify aviation sector (22% of total). Nevertheless, overall transport demand will fall 83% from 107 EJ in 2022 to 18 EJ in 2050. Non-energy demand will decline only slightly, from 22 EJ to 20 EJ, resulting in its share in total demand rising by over three times from 14% today to 45% in 2050. A 9% share of oil demand by 2050 will be in manufacturing, within subsectors such as construction, mining, and cement. The top three regions with the highest oil demand shares in 2050 will be Middle East and North Africa (21%), the Indian Subcontinent (20%), and Latin America (15%), which together account for two thirds of global demand. Middle East and North Africa is the largest oil-producing region today, with a 37% share of total production. This share will rise dramatically over the next three decades as other major oil-producing regions (North America, North East Eurasia, and Latin America, in order of importance) see their production rapidly declining. By 2050, Middle East and North Africa, where extraction and production costs are lowest, is expected to completely dominate oil production, with a 72% share. 8.3.3 Coal Owing to its high emissions intensity, coal is the first target of decarbonization policies. Global demand in the PNZ will plummet 23% to 2030, and by 80% from current levels by 2050. Representing 92 EJ and almost two thirds of coal demand in 2020, the power sector will see a 11% decrease in demand by 2030, 50% by 2040, and 100% by 2050 under a complete global phase-out on using coal in electricity production. While coal use in power generation has alternatives that are competitive today and will increasingly be so in the future, there are other sectors that are costly to abate. For high-heat processes, coal's phase-out will therefore be slow. Coal use will decrease by 20% to 2030 and 50% to 2050 compared with 2020 levels, for both industrial heat and iron ore reduction. A strong decline of 84% over the 2020–2050 period will be observed for base materials. The Indian Subcontinent and Greater China will see coal use continue to rise for more than a decade to represent 70% of global use in mid-century manufacturing. In the PNZ, 1.4 billion tonnes of coal will still have to be extracted in 2050, exclusively as hard coal almost solely used in industry. The biggest regional producers — mostly meeting domestic demand — will at that time be Greater China (47% of global production), the Indian Subcontinent (30%), Sub-Saharan Africa (10%) and North East Eurasia (9%).
  • 94.
    186 DNV Energy TransitionOutlook 2022 187 Pathway to net zero emissions CHAPTER 8 PATHWAY TO NET ZERO EMISSIONS 8.3.4 Solar PV In the PNZ by 2050, solar will account for 45% of all grid-connected electricity to achieve net zero; a big leap compared with the technology’s small ( 3%) share in power generation in 2020. From 0.8 PWh per year in 2020, solar electricity grows seven-fold by 2030, 22-fold by 2040, and 40-fold by 2050 (reaching 35 PWh per year). Of the 35 PWh in 2050, comprehensive installations combining solar PV with storage will have a 26% share, with the rest being solar PV power plants on rooftops, utility-scale installations, and other solutions where storage is not co-located with the PV panels. In 2032, solar PV will overtake gas-fired electricity to become the largest source of electricity globally, a position it will hold to 2050. As shown in Figure 8.7, Greater China had the largest share (30%) of solar PV electricity among regions in 2020, but this reduces to 20% in 2050. The Indian Subcontinent’s share grows from 7% in 2020 to match Greater China’s in 2050. From 2022 to 2030, South East Asia and Middle East and North Africa will see the greatest regional growth (27%) in solar PV electricity generation, albeit starting from relatively low levels. In the decade to 2040, Sub-Saharan Africa and the Indian Subcontinent will catch up to Greater China, with respect to solar PV’s share in each region’s electricity generation mix. The 2040s will see slower growth of solar PV electricity generation in all regions except both Sub-Saharan Africa and North East Eurasia. There will be a small amount (0.5 PWh per year) of off-grid production, mainly in Sub-Saharan Africa and the Indian Subcontinent, supplying electricity to rural districts for lighting, mobile charging, and other smaller end uses. As we describe in Chapter 9, such off-grid installations, though marginal in energy terms, are extremely valuable in a sustainable development perspective. It is a massive task to grow solar PV at the speed envi- sioned in the PNZ. Installed capacity is set to grow from 613 GW to 24 TW, 39-fold growth. Of this 24 TW, 15 TW will be solar PV, with the rest being solar + storage. Greater China dominates capacity additions in years up to 2030, while the Indian subcontinent dwarfs Greater China from 2030 until 2050 (Figure 8.8). Nevertheless, Greater China has the largest grid-connected solar PV capacity in the world by 2050. By 2050, 5 TW of off-grid solar PV capacity dedicated to hydrogen electrolysis will be installed in addition to all the grid-connected solar capacity. Of these dedicated solar PV capacities installed, one third will be in Greater China, and a quarter will be in North America. 8.3.5 Wind In the PNZ, electricity from wind will have to grow from 6% of the electricity generation in 2020 to 13% in 2030, 20% in 2040, and 29% in 2050. We consider three categories of wind power plants: onshore wind, fixed offshore wind, and floating offshore wind. Of these, onshore wind power grows nine-fold from 2020 to 2050. In comparison, fixed offshore, which starts from a much lower base, increases its share in the electricity generation mix from 0.41% in 2020 to 9% by 2050. Of the three, floating offshore wind is the least mature and has the lowest share in electricity generation (2.4%) in 2050. Globally, by 2050, the power system capacity both on-grid and off-grid will consist of 5.6 TW of onshore wind, 2.9 TW of fixed offshore wind and 595 GW of floating offshore wind. The Greater China region is the world’s biggest generator of wind power today and will remain so through to 2050, when its share of installed grid-connected wind power generating capacity will be 39% (Figure 8.9). Europe and North America are second and third in 2050, respectively. Capacity addition in these three leading regions trigger steeper cost reductions for wind power, which also drives significant wind generation development in other regions including some not yet invested in wind power. These other regions include South East Asia and OECD Pacific. North East Eurasia will be an outlier, adding very little wind-powered electricity generation. A considerable amount of new wind power capacity will need to be installed every year (Figure 8.10) to generate these levels of power. On average, 122 GW per year of new capacity becomes operational between 2020 and 2030, 197 GW between 2030 and 2040, and 388 GW between 2040 and 2050 in the PNZ. As illustrated in Figure 8.10, from 2020 to 2030, for every GW of fixed offshore wind power, 3 GW of onshore wind power plants are built on average. However, competition for suitable land will increasingly impact onshore wind costs, while offshore wind costs will decline rapidly. Thus, regions such as North America and Greater China will
  • 95.
    188 DNV Energy TransitionOutlook 2022 189 Pathway to net zero emissions CHAPTER 8 PATHWAY TO NET ZERO EMISSIONS start investing more in offshore wind power plants. From 2035 onwards, for every GW of fixed offshore wind power plant, only 2 GW of onshore wind power plants are built worldwide. After 2040, 38% of new power installations will be offshore wind power plants. Such a massive development in fixed offshore wind translates to higher investments in new electricity grid lines, not least undersea cables. In addition to the grid-connected wind capacity described above, about 2.3 TW of wind capacity will be built for dedicated hydrogen production as off-grid capacity between now and 2050. The majority of this off-grid capacity will be in China, followed by Europe and North America. 8.3.6 Other renewable energy and nuclear In the PNZ, bioenergy will have to assume increasingly greaterimportance,giventhattherearenoeasyalternatives for thermal power plants, which are crucial for regions such as North East Eurasia and, in the medium term, in the transport sector. Bioenergy in annual primary energy supply increases from 57 EJ in 2020 to 81 EJ by 2050. Hydropower also doubles between 2020 and 2050, reaching 33 EJ in mid-century, driven by significant growth in Greater China, Indian Subcontinent, and Sub-Saharan Africa. We find that with our PNZ, the role of nuclear stays at current levels. Large cost decreases for solar and wind cause nuclear to play an ever-smaller role amid growing electricity production. We see dramatic nuclear power cost increases, both in construction, build-out, and planning and waste disposal in Europe, North America, and OECD Pacific. At the same time, nuclear power plants are far from being a reliable energy source as often claimed, with utilization rates lower than 50% in summer 2022 in several jurisdictions. Maintenance issues, climate-induced lack of cooling water, and supply-chain disruption are just some examples impacting this development. Bioenergy undergoes a sectoral shift to 2050 (Figure 8.12). In 2020, buildings was the largest demand sector for bioenergy (51%). Due to electrification and hydrogen use in buildings, this share drops to 27% by 2050. In contrast, we see heat-only power plants and manu- facturing increase their bioenergy use. In North America, for example, 34% of bioenergy demand in 2050 is in the manufacturing sector, at which time 38% of such demand in North East Eurasia is from heat-only and power plants. The absolute demand for bioenergy in the transport sector will grow from 3.8 EJ in 2020 to 5.8 EJ in 2050. This is in stark contrast to our forecast where the demand doubles to 8 EJ by 2050: to achieve net zero, more bioenergy needs to be used in hard-to-abate sectors like aviation, manufacturing, and heat-only plants. Such use in point-emission installations also make bioenergy with carbon capture and storage (BECCS) possible, enabling net negative sites. Bioenergy will be less important in decarbonizing transport, where electrification is a better solution to achieve net zero in road transport, and for making ammonia and e-fuels to maritime transport. 8.3.7 Electricity Grid-connected electricity supply grows to 78 PWh/yr in 2050. This is a three-fold increase from 2020, firmly establishing electrification as a key pillar for reaching net zero. This is 26% higher than our ETO forecast. Phase-out of coal starts in some jurisdictions before 2030, with increased demand provided chiefly by solar and wind (Figure 8.13). Solar electricity sees a 40-fold increase from 2020 to 2050, while wind electricity increases 14-fold over the same period. Solar and wind would account for 74% of the electricity by 2050, which is 6% higher than our ETO forecast. In total, non-fossil sources (renewables and nuclear) account for 90% of the generation, with the remaining electricity being provided by gas-fired power plants. This shows that despite the net zero emission constraints, natural gas has staying power in the electricity sector, providing 5% of power in 2050. By then, almost as many gas-fired power plants run instead on hydrogen, with a maximum volumetric blending ratio of 80%. Global electricity demand, including off-grid rural demand and dedicated renewables demand for H2 electrolysis, will be 91 PWh per year in 2050, three times what it was in 2020 (Figure 8.14). Moreover, the PNZ electricity demand is 44% higher than the projected — ’most likely’ — demand. The largest increase is in demand for power for electrolysis to produce hydrogen. From very low levels in 2020, electrolysis demand for power supplied through the grid
  • 96.
    190 DNV Energy TransitionOutlook 2022 191 Pathway to net zero emissions CHAPTER 8 PATHWAY TO NET ZERO EMISSIONS or from dedicated off-grid renewables will be 28% (25 PWh per year) of total demand in 2050. The transport sector sees the next highest growth in demand (27-fold) for electricity, where electrification of vehicles is an important lever, especially in road transport. Transport’s share in electricity demand grows from 2% in 2020 to 11% by 2050. The off-grid rural solar capacity in the world is 236 GW in 2050, chiefly installed in Sub-Saharan Africa and the Indian Subcontinent. Off-grid dedicated renewable capacity for electrolysis grows from very small levels in 2020 to 7.2 TW by 2050, four times higher than what we projected as most likely in previous chapters. Of this dedicated renewable capacity, one third will be split equally among offshore and onshore wind; and two thirds will be solar-based electrolysis. 8.3.8 Hydrogen Hydrogen is an integral part of net zero strategies being developed by many countries and is urgently needed for the decarbonization of hard-to-abate sectors. Our PNZ accordingly, has hydrogen satisfying a far higher share of final energy demand (14%) than in our ETO forecast (5%) by 2050. Figure 8.15 shows that one third of global hydrogen and synthetic-fuel demand by 2050 is used for industrial heating. By 2050, 23 EJ/yr of energy demand in manu- facturing will be supplied by hydrogen, which represents an 18% share of energy carriers used in manufacturing. Road transportation will account for 18% of global hydrogen demand, almost exclusively through long-haul heavy road transport. By 2050, hydrogen will account for 16% of road transport’s energy demand, despite signifi- cant subsidies assumed in our PNZ. This relatively small share is the result of the competitiveness of battery- electric propulsion in all segments of road transport. The story is different in maritime transport, which will account for 15% of global hydrogen demand by mid- century. The absence of a significant battery-electric option for most parts of maritime transport leaves synthetic fuels, biofuels, ammonia, and hydrogen as viable options for decarbonization leading to hydrogen and its derivatives supplying 75% of the maritime fuel mix by 2050 in our PNZ. Global aviation will also see a significant share (40%) of hydrogen and its derivatives in its fuel mix, accounting for 12% of global hydrogen demand. As with maritime, a lack of battery-electric alternatives leads to a higher share of hydrogen in any conceivable net zero pathway. Only 8% of global hydrogen demand will go to the buildings sector. Strong electrification of buildings' end uses such as space heating, water heating and space cooling lowers the need for other fuels for decarbonization. Figure 8.16 shows the breakdown of global hydrogen production by source, both for energy and non-energy purposes. The share of non-carbon free hydrogen will be less than 5% by 2050. By mid-century, the highest share of hydrogen production will come from dedicated off-grid capacities (46%), led by offshore wind, whilst grid-based electrolysis will be responsible for 34% of the hydrogen production by then. 15% will be supplied from natural gas with CCS. Global hydrogen production needs to significantly scale. Electrolysis capacity for dedicated off-grid hydrogen production will need to be 0.4 TW in 2030, 1.9 TW in 2040, and 3.8 TW by 2050, led by Greater China and Europe. Grid-based electrolysis will need to follow this capacity ramp-up with capacity at almost 2 TW by 2050. Here, the development is led by North America and Europe. Total hydrogen production in 2050 at 525 Mt/year under our PNZ compares with 280 Mt/year forecast by our ETO. Hydrogen is an integral part of net zero strategies being developed by many countries and is urgently needed for the decarbonization of hard-to-abate sectors.
  • 97.
    192 DNV Energy TransitionOutlook 2022 193 Pathway to net zero emissions CHAPTER 8 PATHWAY TO NET ZERO EMISSIONS The PNZ is affordable in the sense that it represents a lower share of global GDP than the present energy system. (Figure 8.17). The challenge, however, is that overall costs for our PNZ are higher than those associated with the ‘most likely’ future in our ETO forecast. Those higher costs may be used as an excuse for inaction. Yet a net zero future is entirely affordable: in a world where GDP nearly doubles, energy expenditures will reduce, implying that energy’s share of global GDP can decline from 3.5% to 2.5%. Diverting the energy expenditure Many commentators assume that the transition to a net zero future comes with an unassailable mountain of costs. AsdetailedinChapter5,whatweconsiderasexpenditures are the supplier-side costs of energy production and transport. We monitor expenditures and not costs. The difference is that capital costs are not amortized but are carried when they are paid. This means that we over- estimate costs in the PNZ compared with our ETO forecast, as the former is more capital intensive (Figure 8.17). Figure 8.18 shows the breakdown of the differences between our modelled futures. Fossil expenditures will drop, driven by an 80% decline for upstream oil and gas through to 2050. A global ban on new oil and gas exploration and development by 2028 means that, after that year, expenditures relate to the operation of the remaining production fields. The overall picture for power generation, which drives non-fossil expenditures, is that costs shift from operating expenses, dominated by the cost of fossil fuels, to capital expenditures in renewable power and related installations. Indeed, almost no fossil fuel-fired power investments will be made from 2030, and the remaining costs will be for operating and maintaining those that are still running until their phase-out in the 2040s. The decline in fossil fuel- related investment contrasts with higher expenditures in low-carbon power generation. The increase in PNZ electricity demand will lead to a near quadrupling of non- fossil power expenditures to 2050, and total investments of some USD 58trn over the next 30 years. 8.4 NET ZERO EXPENDITURES The rise is particularly important for solar PV and wind power, as discussed more fully in Section 8.3. Together, they will represent a little more than a third of global energy expenditures in 2050, an almost eight-fold increase compared with 2021. The doublingof electricity production anddecentralization of power generation,coupledwith a large amount of new VRES capacity,necessarily leads to stronginvestment in grids,totallingsome USD48trn over the next 30 years.Grid expenditures will more than triple between 2021 and2050. The cost of carbon capture Not included in the modelled expenditures shown in Figure 8.18 are the costs related to CCS and direct air capture (DAC). CCS is unavoidable for process emissions and abates the last remaining fossil-fuel combustion emission. In the PNZ, it will account for an annual spend reaching USD 23bn in 2030 and USD 273bn in 2050. DAC is less efficient than CCS and even though CCS will capture 3.7 more CO2 , DAC will account for a higher annual spend, reaching USD 751bn in 2050. Together CCS and DAC spending will represent 0.3% of global GDP in 2050. An unequal regional transition Phasing-out fossil fuels and replacing them with non-fossil alternatives on a short timescale will also mean that there will beshiftsinregionalexpenditures.Fossil-fuelproducing regions are currently energy exporters and will see their expenditures dropping compared with those in our ETO forecast (-50% for North East Eurasia, for example). Other regions installing large renewables capacity will see their expenditures increasing (+100% for Europe). A related issue is the distribution of the higher costs. As shown in Figure 8.19, the impact on household energy expenditures will depend on the region. Front-runner regions in the energy transition (e.g. Europe and OECD Pacific) will actually see a decrease in such expenditures compared with in our ‘most likely’ future. This is because they are already seeing and will increasingly benefit, even before 2040, from the global acceleration in cost-learning curves for low and zero-carbon technologies. The faster declining costs will give an additional boost to these front-running regions in our PNZ. However, other regions, often low-income, will see upfront costs remain higher until after the modelled period. Even if the difference between the two futures declines with time, the transition period will be economically and politically sensitive, highlighting that wealth transfer from high- to low-income regions is an integral part of the presented pathway.
  • 98.
    194 DNV Energy TransitionOutlook 2022 195 Pathway to net zero emissions CHAPTER 8 PATHWAY TO NET ZERO EMISSIONS In addition to energy- and process-based emissions there are significant CO2 emissions from agriculture, forestry and other land use (AFOLU). The historical levels of these emissions have recently been amended (Global Carbon Project, 2022) to 3.2 Gt today. To reach net zero and limit a large overshoot of the carbon budget, these emissions need to decline quickly. By 2050 emissions from AFOLU need to remove 1.1 Gt of CO2 to balance out remaining emissions from remaining energy and process emissions. A net zero future requires a reversal of today's land use practices, in other words, deforestation is halted and significant effort is put into restoration, reforestation and regrowth of biomass. The PNZ sees an increase in annual capture of 1.1 Gt, growing post-2050 to remove up to 3 Gt annually by 2100. The cumulative CO2 emissions from energy, processes, and land use overshoot the 1.5°C carbon budget by 300 GtCO2 by 2050. Therefore, land use, as well as other negative emissions technologies (e.g. direct air capture), must contribute well beyond 2050 and continue to remove CO2 from the atmosphere to ensure stabilization at 1.5°C. By 2050, the remaining annual emissions from energy and industrial processes after DAC are 1.1 GtCO2 ; this means that land-use emissions must decrease from today’s level, reach negative -1.1 GtCO2 in 2050, and then, together with other CO2 reduction measures, continue to remove CO2 emissions for the remaining part of the century. Assuming a continued scaling up of DAC, as well as further improvements in land use after 2050, the PNZ requires total negative emissions of -6.9 GtCO2 /yr from 2080, and then continue towards 2100. Cumulatively from 2050, this amounts to -300 GtCO2 , eliminating the 1.5°C carbon overshoot by 2100. Methane emissions Methane (CH4 ) emissions from fossil-fuels, i.e. coal, oil, and natural gas, reduces to 23 Mt/yr by 2050, a reduction to one fifth of the 2020 levels in the PNZ. Figure 8.22 presents the CH4 emissions from fossil-fuels for both the ETO and PNZ. Compared with those in the ETO forecast, the CH4 emissions in PNZ are 57% lower in 2050. In our PNZ, in 2023, CH4 emissions are marginally higher than the ETO forecast. This is because of the transition away from coal to natural gas in this year, brought on by phase-out policy measures for coal in the demand sectors reducing the production of coal while increasing production levels in natural gas, as well as higher carbon prices in all regions in the PNZ, when compared to the ETO forecast. CO2 emissions The pathway to net zero emissions is produced as a back cast so that global CO2 emissions in 2050 reach net zero from 2020 emissions of 38 Gt CO2 . This number includes CO2 from the energy system as well as process-related emissions, such as during production of cement, and the effects of land-use changes. Our ETO forecast projects 22.2 Gt CO2 emissions in 2050, which needs to be reduced through interventions and policy measures, such as those described in Section 8.2 on net zero policies. As illustrated in Figure 8.20, the sector with the largest emissions in the PNZ future by 2050 is the transport sector, even though the sector reduces almost 80% of its emissions, from 7.4 Gt today to 1.6 Gt in 2050. The transport sector uses most of the world’s unabated oil since carbon capture is challenging. Continued use of fossil-fuelled vehicles in road transport in the low-income regions, and in aviation, make up the bigger share of the remaining 2050 transport emissions. Today, electricity generation is the sector with the largest emissions, but is quickly transforming in the PNZ to reduce emissions through increased renewable and CCS on remaining emissions. By 2050 the remaining power plants will need CCS and many of them run on bioenergy and thus our pathway expects -750 Mn t CO2 to be captured through BECCS technology. Today, 42% of energy-related emissions come from coal, 30% from oil, 26% from gas, and 2% from non-renewable bioenergy. By 2050, the pathway has 63% from oil, 26% from gas, 10% from coal, and a net removal from bio- energy sources. The development of emissions is well correlated with future energy use from fossil-fuel carriers, but CCS also plays a decisive role. Coal and oil use falls rapidly in our PNZ, while gas has a more moderate decline. Capture rates are higher for coal and gas, where much of the CO2 is emitted at large point sources compared with oil, with its typically small point sources. The PNZ sees coal emissions reducing by 98%, gas emissions by 92% and oil emissions by 82% to mid- century (Figure 8.21). 8.5 CO2 AND METHANE EMISSIONS
  • 99.
    196 DNV Energy TransitionOutlook 2022 197 Pathway to net zero emissions CHAPTER 8 PATHWAY TO NET ZERO EMISSIONS While natural gas has a lower carbon intensity than coal, natural gas has a much higher CH4 emission intensity than coal. For example, the highest CH4 emission intensity for coal is in North East Eurasia and it is about 7.5 kilotonnes (0.0075 million tonnes) of CH4 per million tonne of coal produced in 2020. On the other hand, the average CH4 emission intensity of natural gas production in 2020 was 20 kilotonnes per million tonne of natural gas produced, or 2.5 times the CH4 emission intensity of coal production. Nevertheless, the before-mentioned increase in the PNZ is temporary, and from 2024 there is a drastic reduction of CH4 emissions from fossil-fuels, brought on by phasing out coal, and to a lesser degree natural gas from the energy system. The abatement in CH4 emissions in our PNZ is the result of three effects, namely the carbon prices, the reduction in activitylevels(productionoffossilfuels),and theinteraction between the two. The carbon price of CH4 is calculated as a unit of CH4 being converted to its CH4 equivalent using 100-year Global Warming Potential (GWP) time horizon. Thus calculated CH4 equivalent carbon prices for CH4 are compared against the marginal cost of CH4 abatement. The CH4 abatement measures in the oil and gas sector included are: upstream and downstream leak detection and repair, blowdown capture and use of recovered gas with vapour recovery units, replacing pressurized gas pumps and controllers with electric air systems, and finally capping unused oil and gas wells, among others. The CH4 abatement measures in coal mining include pre-mining degasification, air methane oxidation with improved ventilation and flooding abandoned mines (IEA, 2021c). Outside the energy system and land-use Among GHG emissions caused by human activity, 75% stem from the energy system (WRI, 2022b). For the 25% of emissions that do not originate from the energy system, 15% comes from AFOLU and most of the rest from waste and industrial processes. The energy system is the main focus of our pathway to net zero, and, as explained in the previous section, we have also detailed CO2 emissions from the AFOLU sector to obtain a more-complete net zero scenario, including all major CO2 emissions. Non-CO2 GHG emissions outside the energy system are indirectly accounted for in our PNZ. It is well established that representative pathways to 1.5°C are close to net zero CO2 emissions in 2050 (IPCC, 2021). However, the total sum of GHGs ultimately determines the global average temperature increase, and thus leads to some logical implications: — A more aggressive reduction of GHGs in other sectors, would provide slightly more leeway in the energy sector, and still enable reaching 1.5°C. — If less action on reducing emissions in the other sectors, achieving 1.5°C will require cutting emissions even faster and more severely in the energy sector. It is beyond the scope of this report to describe how CH4 and N2 O agricultural emissions or emissions from waste and landfill should be reduced; for example, through a shift in dietary choices. Nevertheless, we assume a reduction in these non-CO2 emissions in line with IPCC representative pathways for 1.5°C. It is, however, clear that reaching 1.5°C is extremely difficult, and to reach this goal all sectors, both within and outside the energy system, need to act together and with urgency. Methane molecules
  • 100.
    198 DNV Energy TransitionOutlook 2022 199 Pathway to net zero emissions CHAPTER 8 PATHWAY TO NET ZERO EMISSIONS PNZ — Policy levers — Fossil-fuelled vehicles will be subject to much stricter fuel economy standards than currently implemented to reduce their fuel use to a minimum. — North East Eurasia and Latin America, both have high shares of natural gas-driven vehicles today and their pro-gas policies will continue. — Additional taxes on gasoline and diesel will accelerate the uptake of BEVs. Taxation levels increase by between +75% (Sub-Saharan Africa) and +200% (North East Eurasia and Middle East and North Africa) compared with current levels. — New sales of fossil-fuelled vehicles will eventually be banned in all regions except Sub-Saharan Africa. OECD regions and Greater China will impose a phased ban on fossil-fuelled passenger vehicles from 2030 onwards, with other regions following. The sales prohibition will be extended to commercial vehicles just a few years after passenger ICE vehicle sales are stopped. But we foresee no ‘cash-for-clunkers' programme. — The purchase of EVs will be further supported by governments and manufacturers with direct and indirect purchase-price reductions in the next few years, supported by quotas for EV shares in manu- facturers’ fleets. Investments EV sales are already subsidized in many regions. Reduced toll roads and parking fees are also frequently used to incentivize EV uptake, and other financial and user incentives will intensify in a net zero scenario. These support measures come with significant fiscal costs. In contrast, fossil-fuel subsidies — used in many regions — will decline, relieving governmental budgets. From its peak in 2025, PNZ energy demand from global road transport declines 45% by 2050. 8.6.1 Road transport From its peak in 2025, PNZ energy demand from global road transport declines 45% by 2050. We assume no change in transport modality and so the number of vehicles is not reduced compared with our ETO forecast's ‘most likely’ future, and thus grows from 2.2bn today to 3.6bn in 2050. However, the strong decline in fuel use in PNZ results from a new fuel mix — compared with the ‘most likely’ future, oil use falls 66%, while use of both electricity (+27%) and hydrogen (+50%) grows. Technologies The basic technologies used to achieve this pathway already exist. For passenger vehicles, the main tool to reduce emissions is replacement of ICEs by BEVs. Once manufactured, EVs are about three times more efficient than ICEs. Moreover, EVs become progressively less emissions-intensive with ever-more renewables in the power mix. New EV models are proliferating, driving further improvements in vehicle performance measures such as range. This applies also to commercial EVs. Average charging speed will benefit from improved lithium-ion battery configurations and solid-state batteries, needed for heavy commercial vehicles with battery sizes exceeding 400 kWh. At the same time, the availability and average charging speed of charging stations will follow the development of battery charging speed. Fuel-cell electric vehicle (FCEV) technology is likely to prevail only in long-haul trucking, whereas the advantages of electric propulsion will edge out both fossil fuel and hydrogen in passenger vehicles as well as in short- to medium-haul trucking. Some fossil fuel-propelled road transport will remain. However, conditions for ICE manufacturers are likely to be very tough: ever tighter fuel economy standards will require very large investments in engine efficiency improvements concurrent with ICE sales declining. 8.6 SECTORAL ROADMAPS
  • 101.
    200 DNV Energy TransitionOutlook 2022 201 Pathway to net zero emissions CHAPTER 8 PATHWAY TO NET ZERO EMISSIONS income regions from around 2040. As for most synthetic fuels, the efficiencies in the entire production process are low, but lack of alternatives still make the developments likely. PNZ — Policy levers — Increasing fees and taxes, and more costly fuels, make airfares expensive, and effective in limiting growth in the number of flights. Flying can be perceived as a luxury and restricting the number of flights per person is a possible auxiliary policy. — Mandates on fuel targets and blend-in drive decar- bonization of the fuel mix. In the foreseeable future, oil-based aviation fuel will remain cheaper than alternative fuels and technologies, including biomass-derived or electricity-based sustainable aviation fuels, pure hydrogen, or batteries. Conse- quently, fuel blending mandates will be the main policy tool enforcing uptake of low-carbon fuels in a PNZ future, and we have applied the following scale-up, depending on region and length of flight. — North America and Europe: gradual scale-up to 15% SAF blended into aviation kerosene in 2030, 40% in 2040, and 75% in 2050 — OECD Pacific and Greater China: scale-up of SAF blend-in, at about 75% of the level in North America and Europe — Latin America, North East Eurasia, Middle East and North Africa, South East Asia, Indian Subcontinent: scale-up of SAF blend-in, at about 50% of the level in North America and Europe — Sub-Saharan Africa: scale-up of SAF blend-in, at about 25% of the level in North America and Europe — Flights between leading and lagging regions will follow the leading region’s uptake — Technology mandates for electric short-haul flights are likely and have been applied up to 80% for short- haul flights by 2050 in leading regions. — Energy-efficiency improvements, in addition to fuel blending mandates and taxation, are expected to continue, but more as a factor of cost reduction than policy, as elaborated below. Investments In our ETO forecast we already included a quite significant SAF share. This comes with additional costs; and we believe the aviation subsector can finance this through higher airfares, enabled by a willingness to pay for sustainable solutions like SAF, both by companies and individuals that want to reduce carbon footprints. In PNZ, the further enforcement of fuel blending mandates comes with additional costs. However, more expensive flights, potentially paired with behavioural measures discouraging unnecessary air travel, will reduce the number of flights. The absolute investment for society in aviation is therefore lower rather than higher in this PNZ compared with in the ETO forecast. 8.6.2 Aviation In our PNZ, global aviation will see modest growth compared with our ETO forecast, with the number of passenger flights increasing globally from 4.6bn in 2019 to 7.7bn in 2050. Due to the introduction of decarbonized fuels, emissions from the subsector decline 68% between pre-covid 2019 numbers and 2050, when they will be 340 MtCO2 per year. Technologies Aviation is a hard-to-abate sector with opportunities for electrification limited to short-haul flights, representing only a small fraction of aviation fuel use. Decarbonization therefore needs to focus on the decarbonization of the fuel itself. Efficiency, as measured in energy use per passenger-km, will continue to improve due to better engine technology, improved aircraft design, larger planes, and better flightpath logistics. Annual efficiency improvements will, however, decrease from 1.9% per year today to 1.2% in 2050. Deployment of electric aircraft is likely to start before 2030 for very small, short-haul planes, and in the 2030s for slightly larger short-haul planes in leading regions. Batteries have very low energy density, and only hybrid-electric solutions are relevant for medium- and long-haul. Since only a minor part of aviation fuel is consumed on short-haul flights, electricity will represent only 3% of the aviation fuel mix in 2050. The aviation industry has started to direct extensive research into hydrogen as a future aviation fuel, with early indications pointing to hydrogen being most promising for medium-haul aircraft. There are technology, cost, and regulatory challenges aplenty, and realistically, we will see hydrogen-powered airplanes starting at small scale around 2040 in a first few regions, with limited wider uptake before mid-century. Sustainable aviation fuel (SAF) can replace the existing kerosene with relatively little adjustment of fuel tanks and engines (depending on blending ratio). In the short and medium term, SAF is likely to consist mainly of biofuels produced from feedstocks such as used cooking oil, municipal solid waste, grassy crops and algae, and through conversion technologies such as hydroprocessed esters and fatty acids synthetic paraffinic kerosene (HEFA-SPK), Fischer–Tropsch, pyrolysis, and alcohol to jet. In the longer term, other SAF solutions will be developed, and liquid synthetic fuel originating from hydrogen is likely to represent more than half of the SAF in the high-
  • 102.
    202 DNV Energy TransitionOutlook 2022 203 Pathway to net zero emissions CHAPTER 8 PATHWAY TO NET ZERO EMISSIONS 8.6.3 Maritime Technologies Currently, the world fleet is mostly powered by diesel engines running on marine fuel oils. Decarbonizing shipping by 2050 will require higher energy efficiency and improved logistics. It will also need a different fuel mix including new fuels derived from low-carbon sources, irrespective of energy-efficiency improvements that are implemented. There has been an increase in the uptake of alternative fuel technologies in ships. One sixteenth (6%) of ships on order in May 2019 were designed to be able to run on alternative fuels, a share that had risen to nearly 12% in June 2021. Except for the electrification underway in the short-haul and ferry segment, the alternative fuels are currently still mainly fossil-based, dominated by liquefied natural gas (LNG). All ships will probably not transition to the same fuel in the longer term. Our PNZ has a diverse future energy mix comprising both fossil and low-carbon fuels, where fossil fuels are gradually phased out. The fuel mix includes fossil marine fuel oils; LNG and liquefied petroleum gas (LPG); electro-based hydrogen, ammonia, and LPG; bio- and electro-based methanol, LNG, and marine gasoil (MGO); and last but definitely not least, biofuels in various blends or as single fuel. Key onboard technologies for using hydrogen and ammonia will be available in four to eight years, while other technologies are already available. While in a PNZ future we expect that the combustion engine will continue to be the dominant energy converter in the fleet, future integration of marine fuel cells in power systems has potential to provide greater efficiency and thereby lower fuel consumption. The technical applicability and commercial viability of alternative fuels will vary greatly for different ship types and trades. Deep-sea vessels have fewer options compared with the short-sea segment. For the latter, the shorter distances and highly variable power demands often make electric or hybrid-electric power and propul- sion systems more efficient than traditional mechanical drives. For the deep-sea segment, most of the energy consumption relates to propulsion at steady speed over longdistances,whichfavoursenergy-efficientmechanical, direct- or geared-driven, two-stroke combustion engines. The ships require fuel that is globally available, and the fuel energy-density is important to maximize the space available for the transport of cargo over long distances. The future fuel and technology shifts in a PNZ future must go together with greater energy efficiency of ships, requiring intensified uptake of both technical and operational energy-efficiency measures. Abatement measures such as wind powering, air lubrication systems, and various hull and machinery measures, are now emerging. The drive for decarbonization in global industrial value chains will also drive logistics optimization including measures such as increased fleet utilization and speed reductions – facilitated by digitalization. PNZ — Policy levers Three fundamental key drivers will push decarbonization in shipping in the coming decade: — Regulations and policies — Access to investors and capital — Cargo owner and consumer expectations A clear and long-term predictable regulatory framework for emissionreductions willbe the key driver for technology development and investments in deployment of carbon-neutral fuels and solutions. Initial policies need to focus on lowering critical barriers. These include technical maturity and feasibility of onboard technology, including safety and rules, as well as barriers related to market demand. In light of fuel-switching ambitions, it is vital to ensure that demand for low- and zero-carbon fuels can be met, which is also partially influenced by governmental strategies and policies. Organizational barriers such as managerial practices, legal constraints, and lack of information, will also form substantial obsta- cles to implementation of carbon-neutral fuels. When the main technical and organizational barriers are removed, the solutions need to be implemented in the fleet, leading to large-scale uptake of carbon-neutral fuels. This requires massive investment, especially in infra- structure related to production and distribution of carbon-neutral fuels and onboard engine and fuel systems. Enforceable regulations will play an important role in mandating the uptake and creating incentives for investing in production and infrastructure. This could, for example, be through technical or operational require- ments on GHG emissions, or a carbon price ensuring a level playing field for ships that run on more expensive carbon-neutral fuels. Investments For the PNZ, we estimate that the total onboard investment cost for the period up to 2050 will be in the range USD 200–450bn, depending on whether the future fuels can be used on existing fuel systems and machinery. In addition, the energy transition in shipping will require major investment in infrastructure and production capacity for supply of carbon-neutral fuels. The onshore investment costs and the higher cost of producing zero-carbon or carbon-neutral fuels will lead to significant higher fuel costs for ships.
  • 103.
    204 DNV Energy TransitionOutlook 2022 205 Pathway to net zero emissions CHAPTER 8 PATHWAY TO NET ZERO EMISSIONS 8.6.4 Buildings heating The building space and water heating subsector can electrify, but it is challenging. By 2050 in the net zero future, the annual total CO2 emissions from buildings heating is 0.2 Gt (Figure 8.30). In our PNZ, we see an emissions reduction of 95% between 2020 and 2050 in buildings heating, and energy use 23% lower in mid- century, compared with our ETO forecast. Such a drastic reduction in energy use is only possible through the dual catalysation of energy efficiency and electrification to drive decarbonization. Electricity’s share in buildings heating is 36% in 2050 in our PNZ, and 21% in the ETO forecast's 'most likely' future (Figure 8.29). Additionally, hydrogen in the form of both direct use and blended with natural gas, has a share of 26% in final energy demand for buildings heating in 2050 in PNZ. North America, Europe, and OECD Pacific all achieve negative emissions in buildings heating by 2049, due to their electricity sectors achieving negative emissions due to BECCS. These power sector emissions are then allocated to buildings heating based on its share in electricity demand. North East Eurasia will have the highest emissions (83 MtCO2 ) from buildings heating in 2050. That is 45% of total emissions from the entire buildings sector in mid-century, due to the presence of direct natural gas boilers and natural gas-generated direct heat. Technologies The technologies for achieving net zero emissions in buildings heating already exist. It is the rates at which such technologies are taken up in the various world regions that make all the difference in terms of emissions reduction. Examples include: Electrification of buildings heating with both conven- tional electric heaters and heat pumps. Technological leapfrogging to electric heating in regions such as Sub-Saharan Africa and Indian Subcontinent, where electricity rather than coal, oil, or natural gas replaces conventional biomass use. This is possible due to faster technology transfer to these regions from OECD regions. Hydrogen is used directly and blended with natural gas for buildings heating in Europe, North America and the OECD Pacific, in tandem with electrification. Energy-efficiency improvements such as innovative building materials and thermal envelopes reduce the specific heating demand. This is not just technology dependent; uptake of these options can be nudged by lower specific heating demand requirements through policy, such as regulations on maximum possible specific heating demand in multifamily housing buildings in Europe. PNZ — Policy levers The policies in our PNZ consist of three broad categories: mandates,costofcapital,andenergy-efficiency standards. The policy adjustments listed below should not be considered in isolation, but rather in tandem with the available technologies: Regulation prohibiting fossil-based heating with a partial ban, translating to a limited and regionally differentiated percentage of new buildings allowed to use fossil fuels: — In North America, Europe, Greater China and OECD Pacific, fossil-fuel heating is constrained to 50% of new buildings in 2050; elsewhere, only 75% may be heated this way. — The lifetime of fossil-fuel heating equipment is halved from 15 years to 7.5 years, also enabling faster phase- out of fossil-fuel equipment and hence phase-in of electrification of buildings heating. Such a halving also has the effect of increasing the levelized cost of heat provided by fossil-fuel equipment. Coupled with leapfrogging (mentioned in the previous Technologies subsection), this has the effect of low-income regions such as Sub-Saharan Africa and the Indian Subcontinent effectivelyelectrifyingbuildingsheatingtoalargeextent. Higher cost of capital for fossil-fuel boilers in commercial buildings: — Investors in commercial building projects will find it hard to secure funding for buildings heated with fossil fuels. Oil and natural gas boilers have a cost of capital of 17%, except in Middle East and North Africa and North East Eurasia, where it is 11%. Coal-fired boilers have a cost of capital of 20% in 2050. In contrast, cost of capital of electric and renewables equipment decreases from 7% in 2022 to 6% in 2025 and thereafter. Higher energy-efficiency standards for existing and new buildings leading to lower specific heating demand: — The specific space heating demand of buildings in North America, Europe, and OECD Pacific reduces 0.8% per year on average from 2020, or by 1% per year in Greater China. The rest of the world sees a reduction of 1.2% per year on average. Additionally, fossil-fuel subsidies for buildings heating in Middle East and North Africa and OECD Pacific are removed from 2022. Investments The pathway to achieve net zero emissions in buildings heating requires enormous private and public investment in the manufacturing value chain for heating equipment. Joint ventures between private entities from OECD regions and public entities in low-income regions are needed, especially given the massive amount of new floor space expected in the coming decades due to the restructuring of the economy in these regions. Indirectly, electrification of buildings heating will also lead to investment in strengthening electric grid infrastructure, including in countries that currently do not have reliable grid connections.
  • 104.
    206 DNV Energy TransitionOutlook 2022 207 Pathway to net zero emissions CHAPTER 8 PATHWAY TO NET ZERO EMISSIONS 8.6.5 Iron and steel In our PNZ, global steel production is expected to start declining within this decade thanks to material efficiency and recycling measures. By 2050, the vast majority of steel will be produced in electric arc furnaces. As a result of these and other measures, the PNZ sees an emissions reduction of 94% and a slight increase in energy consumption of 2% between 2021 and 2050 in iron and steel production. Due to the high use of coal, the CO2 intensity of iron and steel production is currently significant, with each tonne of crude steel produced resulting in 1.4 tCO2 of direct emissions, or 2.0 tCO2 if indirect electricity and heat emissions are included. Iron and steel accounted for 23% of emissions from manufacturing energy use in 2021. Around 40% of energy demand in iron and steelmaking comes from the reduction of iron ore, a process currently relying predominantly on coal used in blast furnaces. Major barriers to lowering emissions include the high share of coal in the sector’s energy inputs; the long lifetime of incumbent assets; and the typically low margins in a mature, competitive, and commoditized market. Furthermore, many technologies that are essential in a net zero pathway – such as rail infrastructure, wind turbines, and CCS equipment – require large amounts of steel. As a result of material efficiency and recycling measures, steel demand and production are expected to start to gradually decrease within this decade in our PNZ. Technologies The technologies required for decarbonizing iron and steel production are already available. These mainly include the already widely used scrap-based electric arc furnace (EAF) for steel production, and the promising direct reduction method. The latter involves the solid-state reduction of iron oxide into iron, where pre-heated iron ore is converted into direct reduced iron (DRI) with hydrogen acting as the reducing agent and energy source. The DRI can then be fed directly into an EAF to produce steel. Low-carbon direct reduction can be either hydrogen- based or natural gas-based with CCS. These two similar technologies are currently either not economically viable due to the high costs and/or low availability of feedstock (e.g. in the case of green hydrogen-based DRI). The direct reduction can also be designed to operate with methane, hydrogen, or a mixture of these gases as the reducing agent. Therefore, blending of hydrogen into natural gas is seen as a transition strategy before there is technological readiness for pure hydrogen use. In summary, the technical solutions needed to decarbo- nize iron and steel exist. The main barriers to be overcome in our PNZ are economic (competing with existing fossil-based basic oxygen furnace technology) and policy-related. PNZ — Policy levers — Carbon pricing is the most important policy for the commercialization and scaling up of low-carbon iron and steel production. Sufficiently high pricing of carbon emissions, internalizing the cost of negative externalities, is needed for low-carbon technologies to make sense commercially. — Recycling policy enables a faster transition to steel production via EAF. In our PNZ, by 2050, all steel production in the OECD and 90% of production in other regions is assumed to be via EAF, and the steel recycling rate climbs to 95% globally. — Incentives for fuel shifts and CCS. The DRI-EAF technology relies on natural gas or hydrogen for direct reduction of iron, and fuel switching to hydrogen will benefit from 5% to 25% lower hydrogen prices. These price reductions result from energy taxation and significantly faster expansion of global hydrogen production capacity also, supported by higher hydrogen uptake in other demand sectors. Further- more, successful decarbonization of natural gas-based DRI will be dependent on support for the scaling up of CCS technologies. — Substantial regionalized capital expenditure support of between 35% to 50% is required in the PNZ for hydrogen and electricity use in iron ore reduction, aimed at minimizing the use of coal. — Further PNZ assumptions towards reducing emissions include a gradual decrease in the steel intensity of new buildings(20%lowerby2050)andafasterimprovement (1.2% per year compared with 1% per year in the ETO forecast) of energy intensity in steel production itself. The decarbonization routes outlined above are consistent with those outlined by the Energy Transitions Commission (ETC, 2020) and the International Energy Agency (IEA, 2020). Investments The added value of the global steel industry is around USD 500bn (World Steel, 2019). Low-carbon steel production is around 10–50% more expensive than the fossil-based counterparts, with uncertain future CAPEX and OPEX costs and future energy costs highly sensitive to the cost of natural gas and electricity (IEA, 2020). Assuming that the cost difference of innovative techno- logies would be at the lower end (10%) by 2050, this would translate to an additional annual cost of around USD 35bn for the global steel industry. Currently, sustainability certification initiatives such as Responsible Steel, and industry associations that make public commitments to procure 100% net zero steel by 2050, are paving the way towards steel decarbonization in pioneering countries. In the PNZ, we envision invest- ment in infrastructure for sustainable steel and for EAF capacities to ramp up faster beyond the OECD regions in which they currently exist. Similarly, to achieve high recycling rates, the infrastructure for collection and processing will need to be embedded in low-income regions.
  • 105.
    208 DNV Energy TransitionOutlook 2022 209 Pathway to net zero emissions CHAPTER 8 PATHWAY TO NET ZERO EMISSIONS 8.6.6 Cement Although controversial and energy-intensive, cement’s unique properties make it unlikely to be replaced in the coming decades, even in our pathway to net zero. Massive deployment of CCS and a new material composition will be required in a PNZ future to decrease the annual CO2 emissions from 2.6 Gt today to 0.4 Gt in 2050. Technologies Reaching 4.1 billion tonnes in 2019, cement production accounted for around 7% of global CO2 emissions. While production will only decrease by 13% from 2020 to 2050, emission intensity will need to decrease 10% by 2030 and 83% by 2050 in our PNZ. Clinker, the main component of cement, is the most energy-intensive and carbon-emitting component of cement production, for two reasons: — Combustion-related emissions from energy use (1.0 GtCO2 in 2020), where the high-heat process around 1500°C in clinker production predominantly relies on high carbon-emitting fossil fuels such as coal and pet coke and has limited electrification potential. — Process-related emissions (1.6 GtCO2 in 2020), where the use of carbonated minerals (mostly limestone) as a raw material releases CO2 as part of the production process. Our PNZ sees three main decarbonization routes: CCS is the main and most effective abatement solution, because of unavoidable process emissions, and will capture 76% of direct emissions by 2050. Technology remains in an early phase of deployment, with only a handful of projects being announced for the moment. A serious ramp-up will be necessary to unleash the snow- ball effect of technology cost learning to achieve its full potential. Fuel switching is challenging given compatibility limi- tations with the dry kiln. Coal will remain the main heat source for clinker production, though hydrogen will have an important role. Hydrogen will cover 12% of PNZ energy demand, being used mainly in Europe, Middle East and Northern Africa, and OECD Pacific. Waste co-processing (plastics, tyres, etc.) will also continue to grow, as it diverts waste from landfill or incineration, and is a source of income for the industry. Improvements in energy intensity of cement will be made through lowering the clinker-to-cement ratio and the use of alternative materials for clinker or cement, which simultaneously impact process emissions intensity, reducing it by a seventh (14%) to 0.60 in 2050. Minor gains are expected from reusing concrete because, unlike other raw materials, there is currently no viable technology to perform cradle-to-cradle recycling for cement. Although a lot has already been achieved by phasing-out older technologies, such as wet kilns, a further 10% gain in energy-efficiency is assumed in the PNZ. Current cement installations are quite young, especially in developing regions, and have a long lifespan: most of 2050 production will be performed in plants that already exist, and where retrofitting will be the favourable abatement option. A future potential abatement solution is the impact of recarbonation. This is a natural process in which finely ground concrete partly reabsorbs the atmospheric CO2 released during production. It could significantly reduce the overall process emissions, but the potential requires further study and has not been assessed in the PNZ. PNZ — Policy levers Decarbonization of cement with high reliance on CCS will not be cost-competitive without policy measures nudging emissions reduction and implementation of solutions. — Carbon pricing is the strongest policy mechanisms in our PNZ. The effect is observable today in the Europe region, where carbon prices are high enough to increase the share of alternative fuels. To prevent traditionally local cement production from moving to low-cost regions,we expect that carbon price disparities will be handled through implementing carbon-border adjustment mechanisms that reduce the risk of carbon leakage. This is specifically relevant for cement, being a low value-added product generating 6.9 kgCO2 /USD revenue, far above steel’s 1.4 kgCO2 /USD (McKinsey, 2020). — Increased taxation on fossil fuels triggers fuel switching away from coal and boosts the use of less energy- intensive cement. — Regulation and government promotion supports new and alternative materials, enforces public procurement for low-carbon cement, and eases regulation on cement composition for different use. The superior qualities of concrete make the construction sector reluctant to transition away from the current composition of cement, hence the need for active promotion from governments to reduce the carbon footprint of cement. Overall, PNZ cement production is expected to decrease 25% by 2050 compared with in our ETO forecast, due to the combined effect of policies and decarbonization costs that are passed on to the consumers and make cement less competitive. Two regions, Greater China and the Indian Subcontinent, will be the focus of decarbonization efforts, because together they account for more than half of cement production over the 2020–2050 period. In low-income regions, policies will walk a fine line between climate objectives and a need for housing and infrastructure for fast-growing populations, highlighting the urgency with which global climate financing for abatement options needs to be deployed. Investments Given the predominantly upfront capital costs of carbon capture, CO2 abatement for cement holds potentially significant economic impact for a sector in which margins have historically been tight. Moreover, cement plants are usually located near quarries, scattered across the landscape, and may require considerable investment for connection to future CO2 infrastructure and transport networks. As an example, the Energy Transitions Commission estimates that decarbonizing cement would double its unit cost (ETC, 2020), which illustrates the coming revolution in this manufacturing subsector.
  • 106.
    210 DNV Energy TransitionOutlook 2022 211 Pathway to net zero emissions CHAPTER 8 PATHWAY TO NET ZERO EMISSIONS 8.6.7 Petrochemicals Making chemicals and petrochemicals, which also relies on fossil fuels as feedstock, will remain a key driver of oil and gas demand. However, phasing out coal together with deployment of carbon capture, utilization and storage (CCUS) will lead to a 86% reduction in the sector’s energy and process CO2 emissions by 2050 in our pathway to net zero. Technologies The industry makes many of the chemical building blocks for products widely used in our everyday lives: plastic packaging, fertilizers, pharmaceuticals, tyres, and so on. This diversity implies that a broad range of solutions are needed. However, certain key decarbonization options will reduce the direct and indirect emissions of this manufacturing subsector. One such option is fuel-switching from coal to natural gas for coal-based methanol and ammonia production, mostly in Greater China. This both increases energy efficiency and reduces emissions intensity. Hydrogen is generated during the reforming process and is an essential part of the reaction. The PNZ sees a partial fuel shift to hydrogen. However, CO2 is either recombined directly (methanol) or later (to produce urea from ammonia) in the value chain, and chemical plants must in that case find other sources of carbon. This hinders the competitiveness of non-fossil hydrogen pathways and explains the remaining share of natural gas. These various measures lead to a 30% decrease in process emission intensity by 2050 in the PNZ. Primary building blocks for plastics, or monomers, will continue to be primarily sourced from oil and gas, as processes and current plants are tailored and optimized for these fuels. Energy-efficiency gains of 25% on heat intensity will, however, be achieved through the global uptake of catalytic processes like naphtha catalytic cracking. Gains through electrification will be limited, due to high-temperature processes and to the dual use of fossil fuels as a feedstock and energy source. PNZ energy demand and thus emissions for plastics production will decrease as recycled plastics will cover 28% of plastics demand by 2050. Eco-design of consumer products, with an increased focus on product recyclability will have to follow. This also includes a decrease in plastic waste in the manufacturing process. Mechanical recycling has limitations, and most improve- ments for non-recyclable polymers can be achieved through waste-to-energy (including co-processing) and waste-to-fuel technologies for better use of the embed- ded energy. About 2.1 EJ of waste-derived oil will be produced by 2050 in the PNZ, representing 5% of global oil primary energy demand. CCUS will abate the remaining emissions. For some processes, such as ammonia production from natural gas, carbon capture has a clear benefit because of the further need for CO2 , often in the same plant. Carbon capture is also cost-effective in that case because of the pure CO2 output, and several industrial plants already have the technology in place, explaining the rapid future ramp-up. PNZ — Policy levers Policies in our PNZ will target the chemical and petro- chemical sector broadly, both on its direct and indirect emissions. — Carbon pricing encourages fuel-switching and the retrofitting of CCUS for existing plants, especially for hydrogen production from natural gas. — Policy intervention on plastics includes mandated recycling, with a generalization of extended producer responsibility, and taxes on unrecycled plastics, in combination with increasing recycling rates. Indeed, for plastics, around half of the carbon is embedded into the material itself, and not accounted for in the direct emissions of the sector; therefore, the disposal phase has a strong impact on the final carbon footprint. — Landfill bans for plastics, accompanied by regulations on product design for higher recyclability, will also avoid long-term GHG emissions and promote use of non-recyclable plastics as a source for alternative fuels. Reduction and substitution of the demand via measures like banning substitutable single-use plastics will also impact global emissions. — Support to decarbonized hydrogen, an essential chemical for making ammonia. Emissions from producing this key building block of nitrogen fertilizers are currently around 500 MtCO2 per year and must be addressed while also ensuring the security of food supply. This will thus remain one of the main concerns for governments. — Stringent regulation of local nitrate pollution, and interventions on food waste, reduce ammonia deriva- tives demand. Although ammonia production is decarbonized, final use of its derivatives, and their subsequent decomposition in soil, are sources of CO2 and nitrous oxide emissions. Investments Energy-efficiency investments on new plants (process, fuel shifts from coal to natural gas) could in fact lead to cost savings (IEA, 2018), though initial capital expenditures could be high. The most important upfront capital costs will be the installation or retrofit of carbon capture, or for water electrolysis in the case of hydrogen production. This could lead to cost increases between 15% and 111% for ammonia (Material Economics, 2019) and 50% for ethylene (ETC, 2020).
  • 107.
    212 DNV Energy TransitionOutlook 2022 213 Pathway to net zero emissions CHAPTER 8 PATHWAY TO NET ZERO EMISSIONS 8.6.8 Power There are two very good reasons why decarbonizing the power sector early and aggressively is crucial for reaching net zero. First, because the sector is responsible for one third of energy-related emissions. Second, because having access to low-carbon electricity is the only way to decarbonize sectors such as heating or transport through electrification. By taking early action on reducing power sector emissions, policymakers will signal to markets and consumers that they will be part of the solution by switching to electricity. As the cost of solar and wind continue to decline, most new investments in the power sector already target green alternatives that have little or no support in most regions. However, focusing new investment exclusively on low-carbon power will not decarbonize the electricity mix quickly enough. A PNZ future also requires investment for decarbonizing existing power generation capacity. The power sector reaches net zero in 2046 in our PNZ; annual CO2 emissions reduce from 12.6 Gt in 2020 to – 0.6 Gt in 2050. Electricity generation becomes coal-free in 2047 as a result of early retirements of coal-fired power plants. All gas-fired power stations are either equipped with CCS and/or use a hydrogen blend as fuel (Figure 8.37). Biomass-fired power stations coupled with CCS provide net negative emissions. Overall, electricity’s share in final energy demand in PNZ increases from 20% in 2020 to 48% in 2050, whereas our ETO forecasts 36% for this by mid-century. North East Eurasia remains the largest regional contributor to power sector emissions in 2050, and is by then the only region without net negative power sector emissions (Figure 8.38). In PNZ, the emission-intensity of the global power system reduces from a little more than 400 gCO2 / kWh in 2020 to 200 gCO2 /kWh in the early 2030s, and less than 100 gCO2 /kWh in the late 2030s. Europe, Latin America, North America and OECD Pacific maintain a low emission-intensity relative to the rest of the world until 2050. Technologies All technologies considered in the power sector of our PNZ exist, and renewable electricity generation techno- logies are already proven at scale. Carbon capture and removal − CCS is critical to eliminate emissions from the remaining fossil-fuel (mostly natural gas) power plants, especially combined-heat-and-power (CHP) and heat-only power stations that generate heat for district heating systems. The only renewable alternatives to heat generation are hydrogen, biomass, and waste. Therefore, a combination of fuel transition and CCS will be needed to decarbonize heat supply (see Section 8.6.9 for further information on CCS). Flexibility and digital infrastructure to ensure security of power supply — The possibility that a very large share of variable renewable energy sources (VRES) in a power system could cause grid instability is a frequently heard concern today. A combination of digital grid infrastructure solutions, battery storage, and backup dispatchable capacity can help ensure frequency stability, even at 100% VRES penetration. In balancing hourly and daily fluctuations,pumpedhydro,batterystorage,dispatchable generation, demand-side response and interconnections will be the key flexibility providers. Low-CAPEX natural gas combined-cycle power stations will play a critical role in providing backup capacity to power systems in extreme cases where high demand meets low wind and solar generation. For continued investment in VRES, it is essential that flexibility is built-in and that there is sufficient dispatchable power (IRENA, 2019a,b). Power-to-hydrogen will play a vital role in utilizing excess renewable electricity and avoiding long intervals with zero prices. Extension of lifetime of nuclear power plants — Despite its high cost and waste issues, nuclear power still provides carbon-free electricity and has a role in our PNZ. Despite new, small modular reactors possibly offering lower costs and shorter lead times for nuclear development projects, large-scale nuclear power will struggle to compete with low-cost solar and wind. One sensible policy for nuclear in a net zero pathway is to delay decommissioning of existing nuclear plants and allow them to run more flexibly by refurbishing key components, despite the additional cost associated with such refurbishments (IAEA, 2020). Given this, in our PNZ, the lifetime of new nuclear power plants is increased from 75 years to 100 years. PNZ — Policy levers The policies to achieve a PNZ in the power sector consist of influencing the cost of capital for power sector investment; subsidies and other support; mandates; and bans. These policies should be considered in conjunction with the technologies highlighted above. Cost of capital — In our PNZ, which also involves a revision of government funding, it will be increasingly difficult for project developers to raise equity financing for fossil-fuel power plants, or for that matter to access advantageously priced debt financing. This is reflected as higher cost of capital for investment for fossil-fuel power plants, differentiated by fossil-fuel type and region. In contrast, renewable power investments have reduced cost of capital, from 7% in 2022 to 6% in 2025 and thereafter. — Oil and natural gas power plants have a cost of capital of 11% in Middle East and North Africa and North East Eurasia, and 17% elsewhere. — Coal power plants will have a cost of capital of 20% without any regional differentiation. Investment support for storage capacity — Increased subsidies are given to investment for storage capacities that are coupled to VRES. Reduced lifetimes of fossil power plants — In our PNZ, new fossil-fuel capacity additions from 2022 have reduced lifetimes mandated by policy. This affects all three types of fossil-fuel power plant, whose lifetimes are reduced from 40 years to 25 years. From 2045 on, residual oil-fired and coal-fired power generation capacity is forcibly retired in all regions. Support and market design to ensure continued invest- ment in renewable power — With high shares of solar and wind in power systems, electricity prices will become increasingly volatile, with extended periods of very low or negative pricing if electricity markets continue to operate like today. New market designs or financial support mechanisms to keep capture prices above costs will help to sustain continued power investments.
  • 108.
    214 DNV Energy TransitionOutlook 2022 215 Pathway to net zero emissions CHAPTER 8 Investments The world’s transmission and distribution network capacity in PNZ increases by 320% between 2020 and 2050. In our ETO forecast of the 'most likely' future, the increase is 180% over the same period. In line with the required investment, world power grid expenditure rises from about 0.5% of world GDP in 2020 to 1% in 2050. Higher investment in grids will be necessary to support a near-100% VRES power system in a net zero future. These investments will expand networks in regions with low electricity penetration. They will also significantly strengthen grids in higher-income regions. This will: enable consumers to use electricity for applications such as EV charging and heating; allow new connections to solar and wind sites; and create new interconnections within and between continents to bring flexibility through cross-border power trading. 8.6.9 Hydrogen A large amount of hydrogen (525 Mt/year by 2050) from both renewables and from fossil fuels combined with carbon capture and storage (CCS) supports a net zero energy system in 2050. It is applied strategically to decarbonize hard-to-abate sectors such as aviation, long-haul trucking, iron and steel production, and high heat processes. Technologies Alkaline electrolysers are more mature than polymer electrolyte membrane (PEM) electrolysers and thus dominate the market at present, but PEM`s advantage in operating more flexibly will increase its share substantially. To prevent possible future fluctuations of electricity prices, investors will gravitate towards dedicated off-grid renewable generation for hydrogen production. But grid-based hydrogen production will exploit these fluctuations and make use of cheap electricity available for long hours, avoiding curtailment of solar and wind. Alongside electrolysis-based hydrogen production, our PNZ sees a continuation of hydrogen produced from CCS-treated natural gas via steam methane reforming, but its share of a much larger hydrogen-for-energy ecosystem will reduce (Figure 8.39). An inter-regional trade of hydrogen does not develop significantly in our ETO forecast but given the sheer scale of hydrogen demand in our PNZ, there would be a substantial inter-regional trade via ships and pipelines, in combination with hydrogen transformed to larger molecules. Depending on the end use, we will see hydrogen blended with natural gas in existing grids (e.g. for buildings gas supply) or dedicated hydrogen pipelines (e.g. in transport). To conclude, the basic technologies to realize global hydrogen trade exist today. Ongoing RD effort will need to aim at, inter alia, improving PEM fuel cells and electrolysers as well as storage and transport options through improved tank design and metal hydrides. PNZ — Policy levers To channel hydrogen use to where it is best suited, the PNZ sees sectoral hydrogen support and incentives to create hydrogen demand: — Energy taxation — Hydrogen consumption in manu- facturing will see energy taxation favouring hydrogen to boost e.g. carbon neutral steel or zero emission process heat. — Mandates on fuel-mix shifts and emission trajectories in aviation and maritime transport will create a signifi- cant demand market for hydrogen. — Requirements — Refineries will be required to increase their hydrogen share for energy provision. On the production side,explicit CAPEX reducingmeasures are needed to boost cost learning curve-based cost reductions for hydrogen. — CAPEX support to integrated renewable electricity and electrolyser projects, and subsidies to grid- powered, renewables-based electrolysis. Both support mechanisms will be strongest in OECD regions and lower in low-income regions. — Steel production will be backed by support to shift to a hydrogen supply chain. Investments In our PNZ, accumulated investment in grid-based electrolysis to provide hydrogen for energy purposes will amount to about USD 1,700bn by 2050 and an additional USD 1,350bn for dedicated hydrogen pipelines. With actions starting soon, this would mean an average global annual investment of about USD 60bn per year for grid-based electrolysis and less than USD 50bn per year for dedicated hydrogen pipelines. Further investments will need to be made for dedicated hydrogen production in combination with renewable power plants as well as for the build-outoftheassociatedinfrastructureforintegration into hydrogen supply chains. Hydrogen production as energy carrier by production type FIGURE 3.17 Units: PJ/yr Natural gas with CCS Electricity 54,000 3,600 60 2020 2030 2050 FIGURE 8.39 PATHWAY TO NET ZERO EMISSIONS
  • 109.
    216 DNV Energy TransitionOutlook 2022 217 Pathway to net zero emissions CHAPTER 8 PATHWAY TO NET ZERO EMISSIONS 8.6.10 Carbon capture and storage (CCS) and direct air capture (DAC) In our PNZ, deployment of CCS grows rapidly from a mere 34 MtCO2 per year captured today to nearly 460 MtCO2 in 2030, peaking around 6.4 GtCO2 in 2047, then slowly declining to some 5.8 GtCO2 in 2050, along with emissions reductions in all sectors (Figure 8.40). That said, CCS captures just 0.1% of total CO2 emissions today, and only 1.7% in 2030. It then ramps up to capture 21.8% by 2040 and 90.7% in 2050 (Figure 8.41), leaving less than 10% of CO2 emissions uncaptured in mid-century. Reaching net zero will be virtually impossible without CCS to capture emissions that are technically difficult or economically unfeasible to eliminate. Technology per se is not an inhibitor; CCS facilities have operated for several decades in areas such as natural gas processing and fertilizer production, where high-concentration CO2 can be captured at relatively low cost. In these applications, the captured CO2 is often used in enhanced oil recovery or for producing value-added products. For example, CO2 produced as a by-product in ammonia production is often used in downstream industrial processes to make products such as glues and resins. This is referred to as carbon capture and utilization (CCU). Cost is the main inhibitor of wider CCS deployment. Industries weigh the still prohibitive cost of CCS against relatively inexpensive — in some regions non-existent — carbon prices. For industrial processes emitting high-concentration CO2 streams — e.g. in natural gas processing — CCS currently costs USD 25–40 per tonne of carbon dioxide. For processes with lower-concentration CO2 emissions — e.g. power generation and cement production — the capture cost today is USD 65–150 per tonne. Today, there are 27 or so commercial CCS facilities operating worldwide (and 135 in the pipeline), concen- trated in North America, Europe, China and OECD Pacific (GCCSI, 2021). Their combined capture capacity is nowhere near the level required to move towards net zero emissions. However, there is growing realization that a rapid ramp-up of CCS is required within the current decade to unleash technology cost-learning dynamics associated with cumulative increases in installed capacity. Without such a ramp-up, achieving net zero emissions by mid-century will be impossible (See Figure 8.41). In our PNZ, carbon capture by CCS begins to grow exponentially in the 2030s, rising rapidly from less than 0.5 GtCO2 per year in 2030 to a peak around 6.4 GtCO2 in 2047. It then eases to around 5.8 GtCO2 in 2050 in line with a decline in the amount of global emissions to capture. The main drivers of CCS uptake are the need to reduce emissions from the manufacturing and power sectors. By 2050, the annual capture rates for these purposes are 2.1 GtCO2 from manufacturing heating, 1.5 GtCO2 from processing, and 1.8 GtCO2 from power generation — adding up to 91% of emissions captured. On average, in the PNZ, just over 90% of all emissions in various sectors are captured via CCS (Figure 8.38). In PNZ, capture ratios in 2050 vary widely from about half of industrial heat emissions (where CO2 is lower-concen- tration and CCS more costly) to 100% of emissions from the refinery sector with its history of existing CCS appli- cations. Efficiency is the limiter for reaching a 100% capture rate; the closer a CCS system gets to 100% capture, the harder and more expensive it becomes to capture additional carbon dioxide. Infrastructure Infrastructure to transport and store CO2 safely and reliably is essential for CCS expansion worldwide. CCS facilities can either be standalone ‘point-to-point’ projects or ‘hub and cluster’ networks that bring together multiple CO2 emitters and/or storage locations using shared transportation infrastructure. Establishing such CCS hubs will help accelerate deployment by reducing costs. At least four CCS hubs are currently operational and 20 more in advanced development stage globally — including in Australia, China, Europe, and the US — with many of them linked to low-carbon (blue) hydrogen production (GCCSI, 2021). IEA’s analysis of CO2 emissions from power and industrial facilities in China, Europe and the US finds that 70% of the emissions are within 100 km of potential storage (IEA, 2021b). But shorter distances can reduce costs further and decrease infrastructure development times. Direct Air Capture Direct air capture (DAC) technologies play an important role in the transition to net zero. DAC technologies extract CO2 directly from the atmosphere for permanent storage, or for uses such as carbonating beverages, stimulating plant growth in greenhouses, or producing synthetic hydrocarbon fuels. DAC is a carbon-removal strategy, while CCS is a mitigation strategy (Batres et al., 2021). An advantage of DAC is the potential for flexibility in siting, reducing the need for CO2 transport. DAC facilities can also be co-located with CCS facilities, such as CCS-equipped power or industrial plants, to facilitate access to existing CO2 transport infrastructure, and enabling these facilities to reach net zero or even negative emissions. DAC plants are already operating on a small scale, but their costs are currently prohibitively high, requiring significant levels of support. There are currently 19 DAC facilities in operation around the world, with a total annual capture capacity of up to 0.01 MtCO2 (IEA, 2021a). In Iceland, Swiss start-up Climeworks AG is building what will then be the world’s largest DAC facility, with a capture capacity of 36,000 tCO2 per year. The company says its vision is to ‘increase permanent removal capacity to a megaton scale by 2030 and a gigaton scale by 2050’. DAC is currently too expensive and energy-intensive to present a viable business case, and is only possible given significant public or government support. For example, Climeworks AG has investors but is also appealing to the
  • 110.
    218 DNV Energy TransitionOutlook 2022 219 Pathway to net zero emissions CHAPTER 8 PATHWAY TO NET ZERO EMISSIONS public to offset carbon footprints via donations towards supporting DAC technology development. Our PNZ sees DAC to be needed on top of CCS because of the unavoidable emissions that will remain in 2050, particu- larly from lower-income regions. Government support and subsidies can make DAC competitive as a carbon offset method over time by progressing the industry’s cost-learning curves. By sponsoring DAC, higher-income regions can enable net zero by mid-century even if lower-income regions have still not reached net zero nationally. Given the much larger share of higher-in- come regions in historical emissions, it can be argued that this is only fair from a climate justice perspective (Batres et al., 2021). When net zero emissions are reached in our PNZ, 2.4 GtCO2 of energy and process emissions still remain, notably in the transport sector. We expect that around 1.6 Gt of these lingering emissions would be captured via DAC technologies and stored (Figure 8.42). Remov- ing this amount of CO2 from the atmosphere via DAC could require up to 4,200 TWh of electricity, equivalent to 5% of total electricity generation in 2050 under the PNZ. PNZ — Policy levers Cost is the key barrier to CCS uptake and its fitting or retrofitting to power or industrial plants will happen, initially at least, only with government-driven deployment policies. In our analysis, we see regional carbon-price trajectories as the key determinant of CCS, in combination with other measures such as infrastructure and investment support (incentives per tCO2 captured), and mandates. We expect government support to be particularly driven by high GDP regions (Europe, Greater China, North America, and OECD Pacific). Our PNZ assumes faster ramp-up rates and a higher maximum CO2 capture rate for CCS compared with our ETO forecast. In summary, the following are the additional policy assumptions for our PNZ which affect CCS and DAC uptake: — Higher carbon prices incentivizing deployment. — Mandates requiring CCS in natural gas-fired and biomass-fired power generation. — CAPEX/OPEX support and policies promoting value-chain and infrastructure development enable ramp-up of CCS and DAC capacity. Investments In line with the growth in CCS, associated CAPEX and OPEX are expected to grow to a peak of just below USD 330bn per year by 2047, and then to decline slowly to a little less than USD 300bn per year by 2050, thanks to lower emission levels. DAC technology is expected to take off around a decade later than CCS, during the late 2030s, with expenditures growing exponentially to reach USD 860bn per year globally in 2050. This indicates that by mid-century, DAC’s unit CO2 capture cost is still more than 10 times higher than that of conventional CCS. This is consequence of atmospheric concentrations of CO2 being far lower than from industrial facilities, and there- fore costlier to capture. Because DAC technology is still in its infancy, it will require higher levels of government support. To reach the required PNZ level by 2050, government support of nearly USD 40bn on a cumulative basis by 2050 is assumed across the Europe, Greater China, North America, and OECD Pacific regions. Climeworks Orca direct air capture plant in Iceland. Image courtesy Climeworks.
  • 111.
    220 DNV Energy TransitionOutlook 2022 221 Regional transitions CHAPTER 9 9 Highlights The energy transition unfolds differently in each of the 10 world regions included in our forecast. Its speed and scale are influenced by a number of factors, such as: geographical and resource issues; legacy technology- and energy systems; stages of economic development; and government policy. Thus, every region has a unique starting point and a different transition trajectory — from OECD countries targeting post-industrial prosperity, to emerging and fast-growing economies, to regions entering an era of development. Our ETO model generates insights and captures this granularity, and, in the following sections, the forecast transition for each of the 10 Outlook regions is presented, including: — Regional characteristics and the current position — Pointers to the future — The regional transition results explained, also covering the emissions profile and forecast — A net zero pathway for each region, emphasizing key policy levers, the emissions reduction and main energy shifts. REGIONAL TRANSITIONS 9.1 North America 124 9.2 Latin America 136 9.3 Europe 146 9.4 Sub-Saharan Africa 260 9.5 Middle East and North Africa 274 9.6 North East Eurasia 284 9.7 Greater China 292 9.8 Indian Subcontinent 304 9.9 South East Asia 314 9.10 OECD Pacific 324 9.11 Comparison regional energy transitions 332
  • 112.
    222 DNV Energy TransitionOutlook 2022 223 Regional transitions CHAPTER 9 KEY Share of fossil primary energy sources 2050 Share of non-fossil primary energy sources 2050 NORTH AMERICA Natural gas dominates manufacturing energy mix through to 2050, while buildings shift to electricity for 70% of demand. Electricity meets 40% of final energy demand by 2050 Electricity generation will not be carbon-free in 2035 – 34% still coming from hydrocarbons Emissions decline 67% to 2050 but transport becomes the largest emitter LATIN AMERICA Fossil fuels will have a 47% share of final energy demand, dominated by oil (31%) Solar PV and wind power grow to account for 82% of power generation in 2050 25 Mt/yr of hydrogen and derivatives are exported by 2050, building on the lowest levelized cost for solar- powered hydrogen production MIDDLE EAST AND NORTH AFRICA Electricity’s share of final energy demand more than doubles to 38% in 2050 Wind and solar provide 69% of electricity, solar contributing almost 50% and a quarter of this in solar + storage plants Annual hydrogen production grows 10-fold from less than 1 Mt in 2030 to nearly 10 Mt in 2050 INDIAN SUBCONTINENT By 2050, 53% of primary energy will come from fossil fuels, coal having a 22% share Demand for electricity grows 10-fold with electricity meeting 33% of final energy demand in 2050 Solar and wind will have 67% of power generation combined, adding 3.4 TW capacity between 2030 and 2050 GREATER CHINA Electricity's share of energy demand doubles to 47% in 2050, the highest of all regions with 90% from renewable energy sources The share of coal in power generation (current 62%) reduces to 4% in 2050 CO2 emissions peak before 2030 and carbon intensity (tCO2 per unit GDP) reduces 66% to 2030 SOUTH EAST ASIA Greatest exporter of coal at 400 Mt in 2020, and the coal sector is entrenched in region economies Electricity doubles its share in final energy demand to 36% by 2050 Solar PV and solar + storage plants rise from the late 2030s to account for 74% of electricity in 2050 OECD PACIFIC By 2030, all capacity additions in power generation are from renewable energy or nuclear 72% of grid-connected electricity is based on renewable energy sources in 2050 Hydrogen and its derivatives are 8% of final energy demand by 2050, the second highest share after Europe NORTH EAST EURASIA Little change in energy demand and mix, majority still met by natural gas in 2050 Economies’ dependence on fossil extraction continues, but is eventually reduced by energy transition elsewhere Russia's invasion of Ukraine will reduce the region's gas and coal production and lower oil export revenue EUROPE Final energy demand decreases by 21% to 2050 from energy-efficiency gains and electrification Electricity meets 43% of demand in 2050 from an almost decarbonized power mix with wind accounting for half of generation Hydrogen and derivatives meet 9% of final energy demand by 2050, the highest of all regions SUB-SAHARAN AFRICA Energy demand increases by 90% from the population almost doubling, and also driven by manufacturing Off-grid solar PV meets 45% of energy demand from appliances and lighting by mid-century Fossil-fuelled power will provide 20% of on-grid generation by 2050 with hydropower and other renewables accounting for 79% WE ANALYSE 10 GLOBAL REGIONS
  • 113.
    224 DNV Energy TransitionOutlook 2022 225 Regional transitions CHAPTER 9 The Canadian and US energy mixes are fossil fuel domi- nated but both governments have net zero GHG targets for 2050. Intermediate goals for 2030 are 50-52% of 2005 levels (US) and 40-45% (Canada). A just transition is high on NAM's policy agenda to deal with transition impacts. Transition plans have progressed with Canada’s 2030 Emissions Reduction Plan: Canada’s Next Steps for Clean Air and a Strong Economy (Government of Canada, 2022) and the US Inflation Reduction Act (2022), coming on the back of last year’s Infrastructure Investment Jobs Act, which create the policy runways to spur action paths to net zero. Both federal governments are pursuing cooperative transition efforts, such as through the Mission Innovation, the Net-Zero Producers Forum, the Global Methane Pledge, and the Climate Club of the G7. High gasoline prices and energy security concerns in the wake of Russia’s invasion of Ukraine have augmented focus on the transition to EVs, but also triggered calls to increase the regions' oil output, suggesting a stasis in decarbonization focus, at least short term. For LNG exports to Europe, capacity is a limiting factor, and expansion of infrastructure weighs against medium/ long-term goals of reducing fossil fuels. Some view clean hydrogen supply chains as possibly a better opportunity. Offshore wind has seen a swell of interest with major developers, private equity, and oil and gas majors securing lease areas on the US Atlantic coast. US wind andsolarforthefirsttimeexceednuclearpowerproduction (Electrek, 2022). However, its solar industry has been disrupted (ACP, 2022), by customs enforcement of the Uyghur Forced Labor Prevention Act and the possibility of retroactive duties from the Commerce Department Anti-Circumvention investigation of Chinese solar-module makers, that has also inflated prices in the corporate power purchase agreement (PPA) market. − The Inflation Reduction Act brings more stability to transition policy, in contrast to executive orders that risk future revocation. There are questions concerning the ability of the IRA to truly scale down fossil sources/ emissions given its reliance on incentives and clean-energy spending, as opposed to carbon pricing. − The region’s manufacturing agenda will see regulation aiming to kickstart capabilities /production /employ- ment in renewable and low-carbon technologies. Examples include President Biden’s executive orders (SolarReviews, 2022), and the Infrastructure Investment Jobs Act providing USD 8bn for the US Department of Energy to invest in regional hydrogen hubs, accele- rating uptake in end-use sectors. − Canada’s Clean Fuel Regulations provide the oil and gas sector, the largest source of GHG emissions, with incentives to produce low-carbon-intensity fuels, helping to sustain the competitiveness of fuel producers in the expanding global clean-fuels market. Its transport sector will see EV uptake pushed by a policy package of mandates, infrastructure (CAD 900mn) funding and CAD 1.5bn in purchase incentives. − Canadian 2022 budget earmarked CAD 2.6bn in new spending over the next five years on CCS, and then CAD 1.5bn annually until 2030 to spur CCUS projects permanently storing GHGs. The tax-credit scheme aims for emissions reduction of 15 million tonnes per year by 2030 and will cover 50 and 60% of CCUS and DAC expenses, respectively, as well as 37.5% for storage, transportation and use. − Governmental policy push will be complemented by growing corporate net-zero commitments, with corresponding expansion of corporate PPAs. A deepening ESG investment trend, presently manifest in oversubscribed sustainability and green energy- focused funds, will also be underscored by mandatory climate disclosures in both Canada and the US. Characteristics and current position Pointers to the future 9.1 NORTH AMERICA (NAM) This region consists of Canada and the United States Population (MN) GDP/person (USD) GDP* (USD TRN) Energy-related emissions/person (T) Energy-related emissions (GT) 2020 2050 Energy use/person (GJ) Energy use (EJ) 368 59 000 21.8 13.6 5 266 98 436 78 000 34.1 3.7 1.6 167 73 *All GDP Figures in the report are based on 2011 purchasing power parity and in 2017 international USD
  • 114.
    226 DNV Energy TransitionOutlook 2022 227 Regional transitions CHAPTER 9 On August 16, 2022, President Biden signed into law the Inflation Reduction Act (IRA). A slimmed down and reworked version of the Build Back Better plan, it aims to curb inflation by reducing the deficit through changes to the tax code, lowering prescription drug prices, and investments in domestic energy production, specifically clean energy production, which will lower costs and reduce emissions. This is by far the most expansive energy bill passed by Congress, and it has been met with enthusiasm from those working in the renewables industry in the US. It provides a host of incentives, funding, and investments in renewable energy, on all levels — from consumers to producers and manufacturers of renewable technology — all adding up to 369 billion USD in spending on domestic energy and climate change. Through the many provisions in this bill,the US aims to reduce greenhouse gas emissions by 40% by 2030, a step in the right direction towards meeting Biden’s Paris Agreement targets and reducing GHG emissions to zero by 2050. Some of the highlights which are pertinent to the future of renewable energy and emissions reduction in the United States include: — Tax credit of up to USD 7,500 for the purchase of new clean vehicles manufactured in the US with US made parts, and a new credit of USD 4,000 for used EVs for households with a maximum income of USD 150,000 a year. — USD 10bn in investment tax credits to build manu- facturing facilities that make EVs and renewable energy technologies. — USD 9bn in rebates for individuals buying and retrofitting homes with energy-efficient and electric appliances. — USD 30bn for solar panels, wind turbines, batteries, geothermal plants, and advanced nuclear reactors, including tax credits over 10 years. — CCS tax credit of USD 85 per metric ton, up from USD 50 — Methane penalty: USD 900 per metric ton of methane emissions that exceed federal limits in 2024, rising to USD 1,500 per metric ton in 2026 — USD 20bn to cut emissions in the agriculture sector — USD 27bn for ‘green bank’ to support clean energy projects particularly in disadvantaged communities. — USD 60bn to support low-income communities and communities of colour, includes grants for zero- emissions technology and vehicles, highway pollution mitigation, bus depots and other infrastructure located near disadvantaged communities The bill simultaneously supports the deployment of low carbon energy technologies while also promoting an increase in domestic manufacturing, which in turn will create domestic jobs. Some of these energy tax incentives are retroactive, while many others go on for ten years, starting as early as 2023. Reactions to the bill have been largely positive, with the legislation being called groundbreaking, and seen as a major climate and energy achievement, with expectations that it will produce long lasting change. Critics generally acknowledge that the IRA is a step forward but stress that it does not go far and fast enough in tackling the climate crisis. The Inflation Reduction Act Energy transition: doldrums or winds of change? The energy transition is moving forward in North America more slowly than it could. Oil and gas have always been cheap and abundant in this region and there is a deep- seated reluctance to change its fossil fuel advantage, though this is starting to shift. Renewables have become the most economically competitive power sources, and the recent passage of the Inflation Reduction Act (IRA), described overleaf, makes large investments in renewable energy with the duration of the support lasting into the 2030s. However, getting the IRA through the legislature was tortuous; it is a much slimmed down version of the Build Back Better Bill, which contained more climate legislation, and it is obvious that the transition is not advancing without question in a polarized political climate. Recent steps backwards for the transition include the anti-dumping investigations targeting Chinese solar cells/modules, and limits placed by the Supreme Court on the powers of the Environmental Protection Agency (EPA). It remains to be seen whether the push for energy security and producing more energy domestically, following Russia’s invasion of Ukraine, helps or hinders the transition. In Canada, the transition has been driven by federal policies. Most of its electricity has long been produced renewably through hydropower, and the government has committed to an emissions reduction plan, setting goals for 2030 and 2050. However, there is still political resist- ance to stepping away from fossil fuels, especially in oil-producing provinces Alberta and Saskatchewan, and in areas where energy resources are scarcer, such as in the north of Canada. In 2050, North America will have about 5% of the world’s population and the highest GDP per person of our 10 regions; 78,000 USD per year. Though its share of world GDP declines from 16% today to 11% in 2050, mainly due to faster GDP growth in China and India, North America 9.1 NORTH AMERICA
  • 115.
    228 DNV Energy TransitionOutlook 2022 229 Regional transitions CHAPTER 9 will still be the third-largest contributor to world GDP. As a highly economically developed region, it has many advantages that could enable it to lead the energy transition — for example, energy resources and space, technological prowess, financial capital, and fewer demo- graphicchallengesthanlow-incomeregions.Experiencing more extreme weather events every year, North America is not immune to the effects of climate change. However, while we forecast a comprehensive energy transition in the US, given its history of ‘pushme-pullyou’ climate politics, it lags Europe in setting the lead on the transition. Energy demand North America’s final energy demand (Figure 9.1.1) has been relatively flat for two decades and will decline 17.7% by 2050, most notably in transport, the sector with the largest energy demand, for which the decrease will be 43% between 2020 and 2050. This decline is due to the phase-outofICEs,causingoiluseinthissectortoplummet, and the use of the more efficient electric vehicles which will replace them. Energy use in manufacturing remains relatively stable through the forecast period. It grows only slightly by 2050 despite an initial decline and subsequent rise in the share of the secondary sector in GDP, pointing to significant efficiency gains in this sector. Here the energy carriers remain relatively stable, with natural gas as the largest. However, there is a slight increase in electricity use, making up 10% more of the mix in 2050 than in 2020, and the emergence of hydrogen to make up 7% of the mix in mid-century. In buildings, natural gas use declines significantly, with electricity growing to dominate energy demand and make up 70% of the mix in 2050. Improved energy efficiency through electrification and heat pumps also counteracts the increase in residential and commercial space — up 25% and 51% respectively — causing energy use in buildings to remain relatively stable. The share of electricity in the overall final energy demand will continue to rise (Figure 9.1.2), almost doubling from 21% in 2020 to 40% in 2050. Oil use will decline steeply, down 64% by 2050 to represent 18% of final energy demand, but even with the continued decline in coal use, this will not be fast enough for the region’s net-zero ambitions. Natural gas remains in second place (27%) in mid-century, due to its low cost and policy factors. Other sources of energy will remain minor, with coal, hydrogen, and bioenergy combined comprising only 12% of the 2050 final energy mix — outcompeted by the cheaper renewables and natural gas. Steps forward: Renewables and capacity additions to the grid Renewables are making inroads in many US states, now supported by the federal provisions set out in the IRA (see IRA p.227). The extent varies between states, partly due to them having their own policies and incentives, and is also influenced by cities and companies. Market forces are also at play with underlying renewable energy technolo- gies costs in decline and therefore the expansion of renewables is to some extent isolated from political swings. On a federal level, the recent passing of the Inflation Reduction Act authorizes 369bn USD in spending on domestic energy and climate change. President Biden also recently issued an Executive Order to spur domestic clean energy manufacturing as part of the ambition to leverage industrial and employment benefits from the clean energy expansion. This order includes invoking the Defense ProductionAct to accelerate domesticproduction of clean energy technologies including solar panel parts, building insulation, heat pumps, transformers and other equipment for making and using clean electricity-gener- ated fuels. The US Federal Government has also imposed a two-year freeze on potential anti-dumping/anti-circum- vention duties on imports of solar panels from South East Asia (Cambodia, Malaysia, Thailand and Vietnam) to allow US manufacturing time to ramp up their domestic production of such products. The US also aims to have 30 GW of offshore wind by 2030, and up to 110 GW by 2050. Canada’s 2030 Emissions Reduction Plan pledges 90% emission-free electricity by 2030. The Canadian govern- ment recently announced the ambitious World Energy GH2 project — a 1.5 GW-capacity electrolyser powered by 3GW of offshore wind — which is slated to produce green hydrogen by 2024. Our Outlook shows the result of support for renewable power policies in the capacity additions to the grid from renewable sources. More than 72% of gross capacity additions in North American power stations currently are represented by renewable electricity — 37% solar, 35% wind — with only 27% coming from fossil fueled power stations (see Figure 9.1.3). Fossil fueled power additions will further decline, and by 2050 nearly all capacity additions in the region will be in renewable energy power stations — 32% from solar PV, 30% from onshore wind, 17% from solar + storage and 15% from offshore wind. The levelized cost per kWh of these renewables will also decline by mid-century to 2.5 US cents (US¢) for solar PV, 2.6 US¢ for onshore wind, 2.9 US¢ for fixed offshore wind, and 3.8 US¢ for floating offshore wind. Regarding the US North America grid-connected capacity additions becoming operational by year FIGURE 9.1.3 2020 2030 2050 Gas-fired, 26% Solar PV, 37% Onshore wind, 35% 52 GW Hydropower, 6% Offshore wind, 7% Solar PV, 46% Solar+storage, 6% 46 GW Onshore wind, 33% Solar+storage,17% Solar PV, 32% 97 GW Onshore wind, 30% Offshore wind,15% Onshore wind Hydropower Solar PV Solar + storage Gas-fired Other Offshore wind
  • 116.
    230 DNV Energy TransitionOutlook 2022 231 Regional transitions CHAPTER 9 goal in offshore wind (30 GW/2030, 110 GW/2050), our Outlook shows this to be an achievable goal — by 2030 North America will have 29 GW of installed capacity for fixed offshore wind and 2 GW of installed capacity for floating. In 2050, fixed offshore wind capacity will rise to 148 GW, with floating at 31 GW. We foresee growth of 62% between 2020 and 2050 in the amount of on-grid electricity generation, indicating not only a massive build-out of power stations, but also of the grid in North America. Most of this future generation will come from renewables, indicating not just a build-out of the grid but also a massive change in the type of infra- structure being built, as historically electricity generation in this region has come from coal, natural gas, and some nuclear and hydropower. Onshore wind will generate the most (32%) electric power in 2050, followed by solar PV (27%). Solar + storage and offshore wind (fixed and floating) will also generate 5% and 9% of the electricity mix in 2050. To enable this generation, installed capacity will amount to 2,800 GW in 2050, with solar leading at 45%, followed by wind at 30%. This build out of the grid bodes well for the future adoption of EVs,which is also beingdriven currently by high gasoline prices in the post-pandemic economic rebound and because of sanctions on Russian energy exports after the invasion of Ukraine. Their sales will grow in North America, with EVs comprising 50% of new vehicle sales by 2033, and 97% of new vehicle sales in 2050 (Figure 9.1.4). The 2030 forecast of 37% trails the US’s goal for EVs to comprise half of all new vehicle sales by 2030, and Canada’s goal of 60%. These sales numbers mean that by 2050, 74% of vehicles on the road in North America will be EVs, overtaking the number of ICE vehicles on the road in 2044. Cars will continue to be large and have long ranges, with North America having the largest battery size at 117 kWh (10% larger than second place OECD Pacific) and an average range of 844 km, the highest of all regions (Figure 9.1.5). The shift to EVs will reflect a strong build-out of the power grid, which is again aided by the strong growth of grid electricity. By 2050, passenger vehicles in North America will have over 23,000 GWh of combined battery storage capacity, offering considerable potential for vehicle-to- grid services. Holding back: Oil and natural gas The large amount of support for the fossil fuel industry in North America is currently hindering the transition. The recent ruling of the US Supreme Court that the EPA does not have the authority to regulate GHG emissions unless Congress has clearly authorized the Agency to act complicates the government’s ability to regulate emissions from coal plants and oil refineries and there have been delays in closing US coal plants. In addition, with Russian oil imports currently banned, the US is looking to the previously sanctioned Venezuela to fill the gap in oil supply. In a bid to bring down high gasoline prices, the Biden administration has drawn down from the US Strategic Petroleum Reserve and urged US refineries to ramp up production to ease fuel costs. How long these measures will last is uncertain. It is possible that they are more likely to be bumps in the road to an energy transition rather than a change in direction. Governments will also need to address the loss of jobs in the oil and gas sectors if they do not want the transition to electricity to become unpopular among people and communities affected by such losses.
  • 117.
    232 DNV Energy TransitionOutlook 2022 233 Regional transitions CHAPTER 9 What is not a bump in the road however is that North America will still be heavily reliant on natural gas in 2050 (Figure 9.1.6), with renewables comprising only 34% of primary energy consumption. In terms of world primary energysupply,NorthAmericacomesinsecond,consuming 17% of the world’s natural gas in 2050, behind the Middle East and North Africa. Compared with a similarly devel- oped region like Europe, which will have one of the lowest levels of natural gas consumption in 2050, North America is on a very different path. The main reasons for natural gas’s dominance in this region is its affordability; modest carbon pricing allow natural gas to remain cheap and it does not start to be outcompeted price wise by renewables until the 2030s. Higher carbon prices in some states and Canada does not change this general picture. In the wake of the war in Ukraine, LNG exports to Europe will grow to make up for energy shortfalls resulting from Russia stopping its gas exports to Europe. While natural gas use in buildings will decline, the manufacturing sector will remain dependent on its use, maintaining share of between 47% and 38% until 2050. Manufacturing is one of those hard-to-abate sectors, and the best way forward in greening it is through CCS and hydrogen. In 2050, North America will capture 27 MtCO2 of manufactur- ing’s emissions of 412 MtCO2 emissions, and hydrogen will increase its share to 7% of manufacturing’s energy demand. Natural gas will overtake oil as the largest primary energy source within the next few years, following a marked decrease in oil use, especially in the transport sector, where the share of oil decreases from 90% in 2020 to 46% by 2050. In President Biden’s climate agenda, one of the key goals is for the US to have carbon-free electricity by 2035 and it is a goal American policy makers look towards. Canada already has over 80% of its power from non-emitting sources, and aims to transition the remaining generation to clean sources by 2030. These are ambitious goals and our Outlook forecasts that they will not be achieved; the aforementioned ruling by the US Supreme Court on the power of the EPA supports our projections. While the amount of electricity generated by fossil fuels will certainly decline (Figure 9.1.7), 34% of generation in 2035 will still come from such sources, natural gas (31%) and coal (3%). Entirely carbon-free electricity will not even materialize by 2050; while coal will have decreased to less than 1% of generation, 8% of electricity will still be generated from natural gas. There will, however, be no new power capacity additions from coal in the forecast period (last investments were in 2016), and natural gas power sector additions will remain minimal after 2026. Emissions We project the average carbon-price level to rise to USD 25/tCO2 in 2030 and 70/tCO2 by 2050 (see Section 6.4). The Canadian government is directing a Pan-Canadian approach and steadily increasing the economy-wide carbon price. In the US, there is no federal policy and pricing will be dominated by development in US state cap-and-trade schemes. Emissions in North America will decline 68% by 2050, driven mostly by renewables uptake in the power sector and a fall-off in oil use (Figure 9.1.8). By end use, buildings’ emissions especially decrease 76%, leaving transport as the largest emitter at 0.64 GtCO2 in 2050. By 2050, North America will capture 205 MtCO2 per year, which is in the same range mid-century as Europe, and up from 42 MtCO2 in 2030. Most of this capture will be in the production of gas-based hydrogen at 66 MtCO2 in 2050, followed by process industries and then the power sector. Manufacturing’s 27 MtCO2 annual capture rate in mid-century will be especially important, as it is the sector which uses the most energy from fossil fuels. North America's emission level of 3.7 tCO2 per person in 2050 will be around one quarter of the present level, but will still be the second highest of all the regions, behind North East Eurasia. In the context of global climate policy, country pledges in nationally determined contributions (NDCs) under the Paris Agreement indicate that North America, viewed as a region, is targeting total reductions of 36.1% in energy- related emissions by 2030. Note that we calculate the North America target compared with 1990 to have a common reference point for all regions. The average target is lower than stated NDC pledges, as 1990 emis- sions were less than in 2005. We estimate emissions will reduce by 19% by 2030 compared with 1990, meaning the region target will not be easily achieved. By 2050, our estimates indicate that the region will have reduced its energy-related emissions by 67% compared with 2020 and will still be emitting 1.6 GtCO2 per year in 2050 in contrast to the region’s net-zero pledges.
  • 118.
    235 234 Regional transitions CHAPTER9 DNV Energy Transition Outlook 2022 PNZ – North America The pathway to net zero (PNZ) for North America sees energy-related CO2 emissions reduce from 5 Gt in 2020 to net zero by 2043 and -0.92 Gt by 2050 (Figure 9.1.9), with a rapid reduction in natural gas and oil, supplanted by electricity and hydrogen, in the energy system (Figure 9.1.10). In 2050, direct air capture will capture 0,838 GT CO2 emissions. Even in the PNZ, transport-sector emissions are the hardest to abate in North America, though they will reduce by over 95% from 2020 to 2050. Both buildings and manufacturing CO2 emissions will fall by over 100% towards 2050. Because of the region's outsize role in the world economy, it will absolutely have to go below zero well before 2050 for the world as a whole to achieve the ambitions of the Paris Agreement. Given the character of climate politics, particularly in the US, that below zero obligation is likely to be a bitter pill for the region to swallow. At the moment, only the State of California is explicitly targeting net zero by 2045, with as yet no firm commitment on how far below zero the State is setting its sights. Because of the region's outsize role in the world economy, it will absolutely have to go below zero well before 2050 for the world as a whole to achieve the ambitions of the Paris Agreement. PNZ – Policy levers Economy-wide economic signals — The rise in average region carbon prices, to USD 100/tCO2 in 2030 and USD 250/tCO2 in 2050, is reflected as costs for fossil fuels. Transport − The decrease in transport emissions is achieved by a two-pronged strategy for electrification of road transport: through subsidies for electricity for EVs and banning sales of fossil-fuel vehicles from 2030 for passenger vehicles and from 2040 for commercial vehicles. Buildings − Three policy levers contribute to buildings emissions decreases: better energy efficiency standards for new commercial and residential buildings’ specific energy use, partial banning of fossil-fuel equipment in buildings, and accelerated phase-out of fossil-fuel equipment by halving lifetimes of new equipment. Manufacturing − The PNZ reduction in manufacturing emissions is achieved by investment support to electrifi- cation of heat supply in the manufacturing sector, starting from 2022, of the investment cost of industrial electric heat boilers and heat pumps. Similarly, support of electric and hydrogen capacity investments in the steel production are given from 2022. Energy supply − CO2 emissions from energy supply are reduced by bans on fossil fuel power plants from 2040. Similarly, a 20% cost of capital for coal power plants from 2025, and a 17% cost of capital for oil and gas power plants also eliminate these power plants from the electricity grid.
  • 119.
    236 DNV Energy TransitionOutlook 2022 237 Regional transitions CHAPTER 9 Latin America is well positioned for the energy transition with mineral wealth, low-carbon fuels, renewable electricity, and carbon offsets, exemplified by Chile’s northern Atacama Desert holding the world’s largest reserves of copper and lithium; by Uruguay proving the feasibility of renewables integration (95%) in electricity systems; and by Brazil’s long-established production of biofuels and rapidly growing wind and solar. With its wind, biomass, geothermal, hydro, and solar resources, the region’s carbon intensity is among the lowest of all regions. Hydropower has great potential (approx. 60% of power generation in Brazil), but gene- ration is challenged by climate variability increasing. The region has seen impressive growth in renewable generation, mainly relying on market-led approaches with government tenders and competitive bidding, and with record-low prices undercutting fossil-fuelled power. While an attractive destination for investment, there are regulatory risks. Several countries aspire to become green hydrogen export hubs. Chile’s National Green Hydrogen Strategy (2020) and Colombia’s Hydrogen Roadmap (2021) are the most concrete to date. Brazil, Mexico, and Venezuela lead regional oil and gas production, and the region holds world-class unconventional resources. Several of the region’s nations produce mostly heavy crude with high sulphur content (Venezuela, Ecuador, Mexico, Colombia), but initiatives to reduce the carbon intensity are starting to gain traction. The region’s 6 biggest economies — Argentina, Brazil, Colombia, Chile, Mexico and Peru — account for about 85% of regional GHG emissions, and among global emitters, Mexico ranks # 11 and Brazil # 16 in the world (Climate Policy Watcher, 2022). Reducing unabated fossil-fuel use in industry, greening road transport, and improving energy efficiency are key transition challenges. − Uruguay is targeting carbon neutrality as early as 2030. There are 2050 targets in Argentina, Chile, and Colombia, Costa Rica, Panama, and for Brazil in 2060. Chile’s Climate Change Framework Law (2022) sets a binding target in law. − Argentina targets 20% of power from non-hydro renewables in 2025 (up from 9% in 2020) and 35% in 2030, with a dominant role for onshore wind. Reducing natural gas imports (LNG) will motivate further invest- ment in the Vaca Muerta shale formation and related infrastructure. − Brazil aims to maintain hydropower, boost solar and wind output, and almost double oil and gas production by 2030. Hydrogen will become part of its energy mix (National Energy Plan 2050) coupled to offshore wind ambitions. Further development of regulatory frame- works will be key. A carbon credit market is planned – while incipient, it evidences the country’s ambition. − Chile aims for a 70% renewable power mix by 2030. Its hydrogen strategy sets high ambitions: 5 GW of electrolysis capacity under development by 2025, and 25 GW with committed funding by 2030. Mining, Chile’s largest industry, sees decarbonization potential through green hydrogen. − Colombia aims for 1-3 GW electrolysis capacity and 50 kt/yr blue hydrogen by 2030. Transition efforts focus on EV rollout and new renewable electricity capacity (4 GW by 2030) along with infrastructure development e.g. in the La Guarija region. A fossil-fuel phase-down will be supported by carbon credit revenue from avoided emissions. − Mexico’s Electricity Law 2021, favouring its state-owned utility CFE, was voted down; but political risks continue to hinder renewable energy investments. Government focus on increasing oil and gas production, refining capacity and fuel oil production for CFE´s generation plants is bucking global decarbonization trends. Characteristics and current position Pointers to the future 9.2 LATIN AMERICA (LAM) This region stretches from Mexico to the southern tip of South America, including the Caribbean island nations Population (MN) GDP/person (USD) GDP* (USD TRN) Energy-related emissions/person (T) Energy-related emissions (GT) 2020 2050 Energy use/person (GJ) Energy use (EJ) 660 14 700 9.8 2.2 1.5 49 32 759 30 100 22.8 1.7 1.3 60 45 *All GDP Figures in the report are based on 2011 purchasing power parity and in 2017 international USD
  • 120.
    238 DNV Energy TransitionOutlook 2022 239 Regional transitions CHAPTER 9 Energy transition: a bright future for renewable gases domestically and abroad Latin America’s final energy demand reflects only marginal improvement in standards of living during the last decade. It is only after 2025 that standards of living will rise again. The more than doubling of final energy demand in the region between 2020 and 2050 will be met by a significant growth of electricity (Figure 9.2.1). Coal and nuclear fuels will remain insignificant energy sources. Renewables, led by biomass and hydropower, will be overtaken by strong solar PV and wind growth, supplying 53% of primary energy by 2050. Despite the significant growth in electricity generation, almost doubling from 18% in 2020 to 32% in 2050, final energy demand will still see a 47% fossil energy share by mid-century. The 47% is dominated by oil (31%) and natural gas (15%), with coal of minor importance. Energy demand Looking more closely at Latin America’s energy demand sectors, we see that transport energy demand will reflect both population growth and a higher income per capita, with a greater use of vehicles; however, increasing electrification will counteract the vehicle fleet expansion, so energy use will only lift marginally. Thus, transport energy demand will peak in the early 2040s, then decrease slightly to 2050. Energy demand in manu- facturing will grow modestly (37% to 2050), also due to efficiency gains and greater use of electricity. Rising living standards and a growing population will see heating and cooling services spreading to new segments, resulting in a 67% increase in buildings' energy use (Figure 9.2.2). This growth is predominantly going to be powered by electricity. 9.2 LATIN AMERICA
  • 121.
    240 DNV Energy TransitionOutlook 2022 241 Regional transitions CHAPTER 9 Renewables Today, Latin America has already one of the highest shares of renewable power generation among the regions, with hydropower, the largest such source, supplying 46% of total power production. However, by 2050, hydropower will have lost its present ranking, with its 20% share in mid-century surpassed by both wind (32%) and solar (38%). While in 2020, 56% of electricity generation was through renewables dominated by hydropower, 42% was through fossil fuels, with a major share from natural gas-fired plants. Wind was responsible for about 6% and solar provided less than 2% of electricity generation. We forecast that solar power will grow significantly in the coming decades, providing almost 15% of power genera- tion in 2030, and almost 40% by 2050 (Figure 9.2.3). Wind power will increase at a similar pace, with a share of 25% by 2030 and 42% by 2050, it is going to provide a substantial proportion of Latin America’s future electricity needs along with solar. At the end of our forecast period, fossil fuel-based electricity production in the region will have reduced to 7% of the total. Given the near-perfect conditions for solar power in the Atacama and Chihuahua deserts in Latin America, countries such as Chile, Argentina and, in part, Brazil are investing in solar power to decarbonize energy and other sectors. Wind is strong in Brazil, the country being third for wind installations in 2021 in terms of installed capacity, indicating the huge potential in this part of Latin America for wind power to support the region’s decarbonization pathway. Hydrogen Mindful of the region’s energy transition being mainly driven by strong electrification through solar and wind power growth, Latin American countries are also heavily investing in renewable hydrogen. Today, Latin America needs about 5% of the world’s hydrogen output for its manufacturing sector, but produces only about 2% of the global figure, almost entirely from unabated fossil fuels. This will change significantly in the next three decades. Electricity will drive decarbonization of sectors fit for electrification. However, with abundant renewable resources, hydrogen is seen as an opportunity for Latin America to become an exporter of hydrogen to Europe, North America, and Asia; and, to a lesser extent, a producer of hydrogen for domestic decarbonization. Latin American countries are developing plans and starting investment to scale up production and prepare for export of low-carbon hydrogen from solar and wind power. Electricity from solar and wind, together with hydrogen as low-carbon fuel, are seen as Latin America’s transition pathway away from oil and gas while also offering significant export potential. However, significant uptake of hydrogen production is only envisaged to start in the next decade, as costs will need to continue their decline, and governments need time to establish the many frameworks enabling hydrogen production, export and potential domestic use. From the late 2020s, hydrogen produced by electrolysis powered by dedicated renewables will start dominating hydrogen production. In 2040, almost 31% of the total hydrogen produced will be green hydrogen, and 46% in 2050. Thanks to high capacity factors, Latin America will have the lowest levelized cost for solar-powered hydrogen production. In fact, the region’s solar-based hydrogen is cheaper than most of its competitors, such as wind-based hydrogen (Figure 9.2.4). From 2040 on, solar-based hydrogen production will be competitive with natural gas-based hydrogen production at around 2 USD/kg. The same applies to grid-based hydrogen production. Wind-based hydrogen production will remain slightly costlier then solar based on average in Latin America. However, at promising wind sites, the levelized cost of hydrogen might be even lower than for solar-based hydrogen. Given the low levelized cost of hydrogen production and the vast potential for solar power exploitation and promising wind resources, Latin America will become a major hydrogen exporter. We forecast that about 25 MtH2 of hydrogen and its derivatives will be exported from Latin America by 2050. A substantial majority will be exported as ammonia and for energy purposes (75%). Almost half of this will be shipped to North America supporting regional hydrogen ambitions of increased use there. The remainder will go to Asia and Europe. To realize these projections, the region must properly plan the challenging part of this undertaking: hydrogen transport. And it appears that it will do so, including pipelines for intraregional distribution of hydrogen, and export terminals for hydrogen conversion to ammonia. Latin America’s strong natural gas pipeline network will be repurposed for hydrogen to support the ambitions. Biofuels Those export plans will also be supported by a lower uptake of hydrogen domestically as Latin America not only holds the potential to supply other regions with green hydrogen from solar and wind, it also has great potential to further displace imported fuels with biofuels like bioethanol, biodiesel and biogas/biomethane. Brazil`s sugarcane ethanol programme, launched in 1975, Argentina’s soya biodiesel, and Colombian palm oil biodiesel are prime examples of the region’s success in providing renewable alternatives to fossil fuels. Today, only Venezuela has no biofuel mandate in Latin America, partially due to its domestic oil production. Latin American countries are promoting biofuel use through strong mandates with high blend rates of ethanol and biodiesel. The region’s share in upgrading its biogas to biomethane, which has a better overall supply-chain footprint, is very high. Currently, about 30% of Latin Americas biogas production is further refined to biomethane (IEA, 2020). By 2050, the region will produce about 8 Gm3 of
  • 122.
    242 DNV Energy TransitionOutlook 2022 243 Regional transitions CHAPTER 9 biomethane and thus replace 2.5% of its total domestic methane demand. As a result of those ambitions and the associated energy transition going forward in Latin America, use of oil for energy, the region’s largest such source today, will decline by a quarter. In addition, growth in the use of natural gas for energy will stall soon and will not overtake oil as the largest primary energy source within the forecast period (Figure 9.2.5). Biomass, in the form of liquid biofuels in transport, as a gaseous energy carrier substituting natural gas, and as solid biomass in the buildings sector, will increase in importance towards 2050 and support Latin America’s energy transition. Latin America has great potential to displace imported fuels with solar, wind, and biofuels like bioethanol, biodiesel and biogas/ biomethane. Emissions The region’s average carbon-price level is projected to increase to USD 25/tCO2 in 2030, and USD 50/tCO2 by 2050. There are carbon-pricing schemes, such as taxation in Argentina, Chile, Colombia, and Mexico. Pricing is presently low but additional pricing instruments are under consideration, such as in Brazil (see section 6.4). Higher pricing could also come to avoid carbon-border adjustment mechanisms from large trading partners — e.g. China and Europe, both of which have carbon pricing in place and are seen as possible trade partners for, among other products, low-carbon hydrogen. Latin America’s energy-related CO2 emissions peaked around 2015. They will decline further through the 2020s, stabilize in the 2030s, then fall to 14% less than today in 2050 (Figure 9.2.6). The decline will occur in all main demand sectors, driven by efficiency gains, a changing energy mix, and to a smaller extent by carbon capture. Today and in the future, oil contributes most to emissions, and is mainly used in Latin America’s transport sector. The natural-gas dominated manufacturing and buildings sectors together contribute another third to Latin Americas emissions in 2050. By then, CCS will reduce CO2 emissions by 51 Mt in mid-century, equivalent to around 3% of the region’s emissions by then. In the context of global climate policy, country NDC pledges indicate an increase in the regional target of limiting increases in emissions to about 88% by 2030, relative to 1990. Our Outlook shows energy-related emissions rising 56% over the same 40-year period. This suggests that the regional target will be achieved by a good margin, indicating a low level of ambition. Note that there are uncertainties in comparing targets and forecasts. Some countries are unclear about whether targets in NDCs also include non-energy related CO2 emissions. Especially in Latin America, there is a large difference between targets including and excluding LULUCF (Land Use, Land-Use Change and Forestry) due to the influence of rainforest on the total emissions. By 2050, the region is expected to reduce energy-related emissions by 11% compared with levels in 2020, and will be emitting 1.3 GtCO2 per year at that time. Latin America's 1.9 tCO2 per person emissions level in 2050 is comparable to those in India and South East Asia, and is 15% lower than the region's current level. Also note that some Latin Americancountries,includingBrazil,Argentina, Colombia, and Chile, have indicated — or have already adopted — carbon-neutrality targets by 2050 or 2060. However, these targets often take into account the land and forestry sector, which means CO2 uptake from rainforest areas are included.
  • 123.
    245 244 Regional transitions CHAPTER9 DNV Energy Transition Outlook 2022 Economy-wide economic signals — the rise in average region carbon prices to USD 50/tCO2 in 2030 and USD 100/tCO2 in 2050 – are reflected as costs for fossil fuels. Transport — A steep reduction in Latin America’s road transport emissions is partly achieved by completely banning the sale of ICE passenger vehicles in 2044, with restrictions on the sale of ICE commercial vehicles beginning in 2043. Simultaneously, electricity for vehicle propulsion is subsidized by 10% of its average price from 2022, thus incentivizing investments in EVs. Buildings − A partial ban of new fossil-fuel equipment for buildings, along with a subsidy of 10% of the electricity price for buildings, drives emissions reductions in this sector. Additionally, 17% higher capital costs for oil and natural gas-fuelled equipment of commercial buildings, and 20% more for coal-burning equipment, also deters investment and locking-in of these technologies, while reducing emissions. Manufacturing − Electricity and hydrogen as energy carriers are subsidized by 10% compared with their average price, and biomass by 30%. Similarly, the capacity cost of electric heaters (including heat pumps) is reduced by 4% from 2022. Energy supply − The increasing cost of capital for coal, oil, and natural gas power plants, among other policy levers, leads to elimination of CO2 emissions from the power sector by 2050. A gradual reduction in the cost of capital of non-fossil power plants catalyses investment in renewable power plants. More importantly, support for investing in power storage capacity also rises, which encourages investment in VRES. Investing in oil and gas capacity additions in the region is banned from 2028. PNZ – Policy levers PNZ – Latin America The pathway to net zero (PNZ) for Latin America sees CO2 emissions reducing from 1.5 Gt in 2020 to 0.3 Gt in 2050 (Figure 9.2.7). By 2050, final energy demand increases 30% compared with a 50% growth in the ETO. By then, the manufacturing sector will have moved into negative emission territory by using biomass and CCS. Latin America will capture about 370 MtCO2 in 2050. This compares with the 70 MtCO2 we forecast in our ‘most likely’ future (ETO forecast) for Latin America in 2050, clearly showing how CCS can boost emissions reduction. Transport will remain the sector with the highest net emissions, and road transport in particular despite the high share of biofuels in Latin America. Oil use in Latin America’s transport sector reduces from 85% now to 32% in the coming three decades. The gap is filled by electricity, providing 44% of 2050 energy demand in transport, and pure hydrogen (3%) and e-fuels (5%). Electricity’s share in final energy demand increases from 19% in 2020 to 50% in 2050; hydrogen’s share rises from almost zero to 5% by then. Half of the primary energy is supplied by solar and wind in mid-century (Figure 9.2.8). Hydrogen export is accelerating in our PNZ as well. Export volumes to North America and Europe are doubling compared with our ETO-forecast. The PNZ sees Latin America producing 50% more hydrogen than in our ETO forecast. There is no more unabated hydrogen production from fossil fuels, but a significant increase in dedicated renewable-based hydrogen. Half of the primary energy is supplied by solar and wind in mid-century.
  • 124.
    246 DNV Energy TransitionOutlook 2022 247 Regional transitions CHAPTER 9 Policymakers in Europe are struggling to stay united and balance the needs of the energy transition with the supply and energy price crises arising from Russia’s invasion of Ukraine. Energy systems resilience is a significant concern given reliance on Russian oil and gas, while other commodities needed for the energy transition, such as primary and rare earth metals, are also dependent on international supply chains. The European Commission’s REPowerEU Plan outlines a host of initiatives aimed at ending the dependence on imported Russian fossil fuels by 2027. It builds on the full implementation of the Fit-for-55 proposals, and proposes going further, with higher renewable energy and energy- efficiency targets. The Commission’s analysis indicates that REPowerEU entails additional investment of EUR 210 billion between now and 2027. The EU’s emergency gas rationing plan had Member States agreeing to a best-efforts reduction of 15% in natural gas demand by end of March 2023, compared with average consumption over the previous five years. This target is intertwined with the objective to fill EU gas storage to 80% of capacity before 1 November 2022, which has been achieved. Near-term energy security imperatives are leading several European policymakers to revisit energy policies related to the phase-out of nuclear and coal-fired power. For nuclear power, life-time extensions are being mooted to plug energy deficits, while ramping up coal power generation to keep lights on over the winter is on the table. Rising fuel and electricity costs across Europe are leading to increased subsidies for both industrial and domestic consumers. This requirement is likely to feature as a key element of the European energy transition moving forward to ensure it can be conducted in a just manner across society. − The Ukraine conflict will trigger measures to increase energy efficiency and plans to increase the share of renewables, hydrogen and nuclear in the energy mix. This will result in an accelerated decarbonization trajectory overall. − The EU is developing new hydrocarbon and base/rare metal alliances with suppliers in the US, Middle East, Africa, and South America. Gas imports by pipeline and as LNG will make up the bulk of the shortfall in Russian gas, e.g. the EU aiming for about 50bcm of additional US LNG until at least 2030 (compared with 22bcm in 2021). − To help displace Russian gas, the Commission has set 2030 targets of 10 Mt/yr of domestic renewable hydrogen production and 10 Mt/yr of renewable hydrogen imports. The Commission plans to support the development of three major hydrogen import corridors (via the Mediterranean, the North Sea area, and eventually with Ukraine). − REPowerEU proposes to raise the collective EU Renewables Directive 2030 target for the share of renewable energy to 45%, up from the previous 40%. To speed up deployment, the region will establish dedicated ‘go-to' areas for renewables with shortened and simplified permitting processes in areas with lower environmental and social risks. − The EU Solar Energy Strategy targets over 320 GW of solar PV capacity by 2025 and almost 600 GW by 2030. The EU aims for 50% of its electricity from wind by 2050, expanding onshore wind from 173 GW today to 1,000 GW; and its Offshore Energy Strategy targets 60 GW wind by 2030 and 300 GW by 2050. More variable renewables will require significant grid reinforcement and energy storage solutions such as batteries, power-to-x and hydrogen. Characteristics and current position Pointers to the future 9.3 EUROPE (EUR) This region comprises all European countries, including the Baltics, but excluding Russia, all the other former Soviet Union Republics, and Turkey Population (MN) GDP/person (USD) GDP* (USD TRN) Energy-related emissions/person (T) Energy-related emissions (GT) 2020 2050 Energy use/person (GJ) Energy use (EJ) 541 38 800 21.5 5.4 2.9 121 66 538 57 500 31.5 1.2 0.6 97 52 *All GDP Figures in the report are based on 2011 purchasing power parity and in 2017 international USD
  • 125.
    248 DNV Energy TransitionOutlook 2022 249 Regional transitions CHAPTER 9 Energy transition: a frontrunner striving for energy independence Europe was the home of the Industrial Revolution which led to the extensive use of fossil fuels. Although the region accounted for only 11% of global energy use and 9% of global CO2 emission in 2020, its share of total accumulated emissions since 1750 has been estimated at around 23% (Global Carbon Project, 2022). Europe is and will be at the forefront of the energy transition. The region is aware of its historical responsibility for climate change and has decided to act accordingly to contain the impact of climate change. The transition is also driven by the need and will for more energy independence, an issue that has recently intensified with the impacts of the war in Ukraine, but has long been a key driver of energy- efficiency targets. The transformation will be mainly driven by resolute policies from the EU. Russia’s invasion of Ukraine creates short-term uncertainty for the transition but will likely lead to a faster transition in Europe. In the coming decades the European energy system will undergo an energy transformation more profound than that of any other region, affecting every sector of the region’s economies and the daily life of every citizen. Primary energy use Figure 9.3.1 shows the evolution of primary energy consumption in Europe. Its energy transition is already incontrovertibly underway; in the three last decades, the fossil-fuel share in primary energy consumption declined from92%to70%,mainlyduetoreducedcoalconsumption. We forecast that the three next decades will bring even greater transformation, and fossil fuels will represent only 28% of the primary energy mix by 2050. The progressive phase-out of fossil fuels, mainly due to massive electrification and renewables uptake will lead to a significant decrease of primary energy consumption, from 66 EJ in 2020 to 52 EJ in 2050. As the Ukraine war has highlighted, Europe is far from being an energy independent region. As shown in Figure 9.3.2, neither regional natural gas nor oil production, mostly in Norway and the UK, cover European needs. In 2020, Europe was 68% dependent on oil and 61% on natural gas, corresponding to 39% of its primary energy consumption. This situation is expected to remain similar in the near-term future. It should be noted that the Ukraine war has strongly impacted our forecast for natural gas consumption in Europe. It is now 170 Gm3 in 2050, versus 310 Gm3 in our last year’s edition, reflecting our analysis that the war will have an accelerating effect on the energy transition in Europe (see Chapter 1). The strong decrease in demand will mean that total imports will decrease by 61% for oil and 64% for natural gas from 2020 to 2050. Coal consumption is supplied more by local production, Europe producing the equivalent of 80% of its needs (2010-2020 average). But there is variation in the qualities of coal from different sources, and the EU has a noticeable import dependency for hard coal used in iron and steel production; 57.4% of this was imported in 2020, more than half of it coming from Russia (Eurostat, 2022). As a result of fossil fuel imports, Europe's energy trade balance has been and is very negative, as shown in Figure 9.3.3, especially when Norway is excluded. But as Europe progressively relocates energy production and decreases its dependence on fossil fuels, the total cost of fossil-fuel imports will eventually decline and remain stable from the late 2030s. The positive effect on the energy-trade balance reduction will be dampened by imports of hardware like solar panels or lithium batteries (not quantified here) from other regions, such as China, which has invested 10 times more than Europe over the last decade in new solar PV equipment supply capacity (IEA, 2022c) and is the source of 75% of EU solar PV imports (Eurostat, 2022). However, the value of imports of solar PV equipment was only EUR 8 bn in 2020, far less than the EUR 200 bn for fossil fuels, and future policies are expected to mitigate the import bill by supporting relocation of production in Europe. 9.3 EUROPE
  • 126.
    250 DNV Energy TransitionOutlook 2022 251 Regional transitions CHAPTER 9 Final energy demand Final energy demand in Europe will change profoundly in the next three decades, as illustrated in Figure 9.3.4. Population in Europe will remain stable, around 540 million inhabitants, and GDP per capita will increase by 37%. In contrast, final energy demand will decrease by 21%, influenced by energy-efficiency gains and rapid electrification. Fossil-fuel use will be increasingly confined to a few sectors. Oil demand will decrease from 19 EJ in 2020 to 8 EJ in 2050 and will mainly come from non-energy use in the petrochemical industry (40%) and transport (37%). In the meantime, demand for natural gas will decrease from 12 EJ to 5 EJ, with a strong remaining demand for space and water heating (64%) and manu- facturing (15%) to a lesser extent. Electrification Electrification is key to decarbonization, energy inde- pendence and energy efficiency. European electricity demand will almost double from 3.1 PWh in 2020 to 5.8 PWh in 2050. Road transport electrification will have one of the most visible effects on everyday life. With strong policies, like the EU ban on new ICE passenger vehicle sales by 2035, the battery-electric vehicle share in the total fleet is expected to increase from 1% in 2020 to 20% in 2030 and 96% in 2050. Some countries like Norway will transition even faster in this regard, with EVs reaching a 42% share there in 2030. Use of electricity for commercial vehicles is more challenging, and almost non-existent today, but their share will reach 11% by 2030 and 74% in 2050. Road transport will account for an increase of 900 TWh in annual electricity demand in the next three decades, equivalent to a third of today’s total electricity demand in Europe. The remaining increase in electricity demand is shown in Figure 9.3.5. In the coming decade, most of this growth will come from the traditional end-uses (buildings, road transport and manufacturing). Hydrogen production from on-grid electricity will pick up in the late 2030s and represent the second biggest increase in electricity demand after 2030. The generation of electricity from renewable sources will be the key enabler of both electrification and decarboni- zation, and with acceleration policy, such as set by the REPowerEU, 2030 renewable generation capacities are envisioned at 1,236 GW compared with 1,067 GW under the Fit-for-55 proposal. We forecast a lower total of 1000 GW of renewable capacity by 2030 for the whole region, corresponding to a 370 GW additional capacity compared to 2020 level, with similar increases around 170 GW for solar PV and wind. Managing this increase will be a challenge from both the power generation and grid perspectives. Although common regional guidelines and financing regulation like the EU green taxonomy and carbon pricing are in place to achieve decarbonization objectives, different national strategies will be imple- mented, depending on natural resource potential, local incentives, and industrial policies. The Iberian Peninsula has for example an ambition to use its solar and wind potential to become a renewable hub for Europe, with increased electricity connection to the rest of the continent. Northern Europe will invest more in wind power due to local potential and having less potential for solar. The North Sea is a prime location for offshore wind, and investments will continue to flow into the region, both for fixed and floating wind turbines. Nuclear energy, though controversial, will remain strong in historical users like France, the UK and Eastern European countries, but is unlikely to develop at large scale in new countries. As a result, the power mix shown in Figure 9.3.6 is diverse, but will be almost decarbonized by 2050. However, we forecast wind power to be the most important renewable power source by mid-century, representing almost half (48%) of total electricity generation in 2050, indicating that Europe almost achieves its target. This is the largest share of all regions, clearly above global average (31%). Europe has one of the most interconnected power networks, but grid build-out will also continue to accom- modate this growth and keep on balancing the grid. Total power line length with double by 2050, and inter- connection withneighbouring regionswillgrowfourfold, enabling both grid balancing and reliable power supply. Climate change will affect energy demand for space cooling and heating in buildings in Europe, and ironically help the region in decreasing its reliance on oil and natural gas in the sector. Milder winters will mean less need for heating, and stricter insulation standards will further reduce the demand. As shown in Figure 9.3.7, space cooling is powered by electricity only, while space heating was traditionally fossil dominated. As detailed in Chapter 1, space heating is now also electrifying. Uptake of heat pumps, further incentivized by RePowerEU, and their increasing efficiency will be major factors in reducing energy demand from space heating. On the other hand, heatwaves as in the summer of 2022, and a more general- ized rise in temperatures, will drive a doubling in demand for space cooling between now and 2050. Thus, overall,
  • 127.
    252 DNV Energy TransitionOutlook 2022 253 Regional transitions CHAPTER 9 demand for fossil energy will decline from 8.3 EJ in 2020 to 4.5 EJ in mid-century, and electricity will rapidly overtake natural gas as the main source of energy, representing 55% of the buildings sector's energy demand in 2050 versus 34% today. Decarbonizing industry In the manufacturing sector, Europe will also be the main laboratory for the necessary decarbonization in heavy industries like iron and steel, cement, and petrochemi- cals. These hard-to-abate industries need reinventing to achieve the deep reduction in CO2 emissions that we forecast for the sector — from 663 MtCO2 in 2020 to 60 MtCO2 in 2050. The region will deploy a range of measures to support and enforce this transition. Main drivers of the transition will be the EU-ETS, phase-out of free allowances, and supplementary carbon fees in region countries. Carbon pricing will be the key economic instrument to incentivise emissions reduction, however, it will be coupled with support from the EU innovation fund to cover EU-producer's decarbonization costs. European industry is subject to global competition, which means that policies must be carefully designed to avoid a decrease of competitiveness and job losses. We assume the implementation of an efficient carbon-border adjustment mechanism (CBAM), which is currently in advanced negotiations in the EU, to avoid carbon leakage. Decarbonization is already a challenge for manufacturing inEurope,whichiswalkingafinelinetoremaincompetitive. The current high energy prices due to the war in Ukraine is a hard blow to the sector, which today covers 32% of its energy demand with natural gas and 31% with electricity. In our current assumptions, the war will have a minimal impact on the sector’s total output. But long-term effects of high energy prices are still hard to foresee, and the duration of this period will be decisive for whether the downturn is short or will inflict more permanent damage. Fossil fuels will be replaced where possible, typically when low and medium heat requirements allow for the use of competitive heat pumps. The manufactured goods subsector, 45% reliant on fossil fuels in 2020, is well-suited for this transition. Fossil fuels will be less than 4% of the subsector’s fuel mix in Europe by 2040 compared with 36% in the rest of the world. Other subsectors have different constraints, and even though most European industrial sites are ageing, the retrofitting of existing fossil-fuel based installations is often preferred. For instance, cement kilns operate at 1450°C, and have traditionally relied on coal and petcoke. But over the past decades, the European cement industry has progressively replaced them with alternative fuels, namely plastic waste and discarded tyres. Cement plants get paid as any regular waste energy recovery plant for that service, usually between 0 and 100€/ton. The share of alternative fuels in the energy mix for cement making was 31% in 2019 (GCCA, 2022) and will continue to increase as they usually represent a substantial source of revenue for cement producers. With the additional burden of unavoidable process emissions, the European cement industry will mainly turn to carbon capture and storage (CCS) for decarbonization. Manufacturing will drive the deployment of carbon capture, which will also be adopted for powering production of ammonia, iron and steel. The EU Innovation Fund finances up to 60% of the additional investment and operational costs of large-scale carbon capture projects, focusing on Projects of Common Interest (PCIs) and supporting chains to benefit several industrial installations — for example, the Northern Lights and Porthos projects in Norway and the Netherlands, respectively. Several EU and non-EU countries (e.g. Denmark, Germany, the Netherlands, the UK) have carbon capture policies to help achieve net-zero ambitions. The Longship project in Norway, the most advanced large-scale commercial capture project, will start operating in 2025. Captured emissions from a cement plant and a waste incinerator in Norway, and from a fertilizer plant in the Netherlands, will be stored under the Norwegian continental shelf. Dozens of other projects are ongoing in Europe, and as shown in Figure 9.3.8, carbon capture in manufacturing will quickly grow to 60 MtCO2 per year in 2030, covering 3% of the sector’s energy-related and process emissions. Continued growth thereafter will see nearly 200 MtCO2 per year being captured in 2050. Hydrogen, a future major energy carrier Compared with in other regions, Europe’s manufacturing sector will also favour using hydrogen for energy. 6.1 Mt of hydrogen will supply 11% of its energy by 2050 versus 6% in the rest of the world. Hydrogen will be used as a decarbonized heat source both in pure form and mixed with natural gas, and in iron and steel production. Making iron and steel is today heavily reliant on coal as a reducing agent. The subsector’s share of coal demand in Europe will grow from 22% in 2020 to 36% in 2050. However, total coal demand for steel production will decrease by two thirds due to increased use of electric arc furnaces and the uptake of decarbonized hydrogen as a substitute for reducing iron ore. This method, referred to as direct reduced iron (DRI), will represent a large share of the new investment in European steelmaking. The first commercial- scale production by Hybrit in Sweden in 2021 will rapidly be followed by larger-scale projects. Arcelor has for instance announced the replacement by 2027 of its traditional blast furnaces by DRI in Dunkerque, France. The plant will produce 2.5 million tonnes of so-called ‘green steel’ per year. As a result, hydrogen will cover 20% of Europe’s steel industry energy demand by 2050, double the equivalent share in the rest of the world. Hydrogen will not only be used as an energy carrier in manufacturing. It will be used in similar quantities in buildings for heating space and water, growing to 0.6 Mt in 2030 and 6.3 Mt in 2050. Indeed, most countries in Europe have an extensive natural gas distribution network that can be retrofitted to accommodate hydrogen transport. Hydrogen will initially be blended with natural gas for maximum compatibility, and hydrogen’s use in pure form in buildings will develop from 2030. From the late 2030s, demand for hydrogen for road transport will also pick up to decarbonize long-distance trucking and represents 3.6 Mt in 2050. Some countries in the region (e.g. Germany) are expected to develop into large-scale importers of hydrogen, with others becoming exporters or transit hubs. Several countries in the region have their own strategies and targets for installed hydrogen production capacity by 2030 to support the EU goals: for example, Denmark (4–6 GW), France (6.5 GW), Italy (5 GW), Germany (5 GW), and Spain (4 GW). Targets are supported by government CAPEX funding as well as measures to stimulate offtake, such as evolving Carbon Contracts for Difference. However,theregionisforecasttofallshortofEUambitions, which has a strategy for at least 40 GW electrolyser capacity installed by 2030 (6 GW by 2024), 10 Mt of domestic renewable hydrogen production, and 10 Mt of renewable imports by 2030 in REPowerEU. As represented in Figure 9.3.9, total production of pure hydrogen as an energy carrier will reach 3.5 Mt in 2030 and 23 Mt in 2050.
  • 128.
    254 DNV Energy TransitionOutlook 2022 255 Regional transitions CHAPTER 9 An additional 1 Mt will be imported yearly by pipeline by 2050, mostly (90%) from Middle East and North Africa. DedicatedinstallationsusingsolarPVorwind willdominate initially in the production of decarbonized hydrogen. Over the forecasting period, wind will account for around 60% of the dedicated production from renewables and solar for 40%. As for power generation, the choice will depend on national specificities. From 2040, new added capacity will be mainly grid-connected electrolysis. By that time, the European power mix will be dominated by non-fossil sources. Bigger variations in electricity prices, with periods with low and even negative prices due to high renewables power generation, will make grid- connected electrolysis a viable alternative. As for hydrogen produced from steam methane reforming (SMR) of natural gas with carbon capture, although it will be an attractive option in the early phase of hydrogen uptake because of the maturity of the technology, this technology will struggle to be cost-competitive in Europe. Hydrogen derivatives (ammonia, methanol and e-fuels) will also be produced to serve as energy carriers in the maritime and aviation subsectors. Ammonia production currently relies on SMR, and and SMR with CCS is likely to account for 84% of the production in 2050. A last stronghold for fossil fuels The only sector where demand for fossil fuels will remain strong in the coming decades is non-energy, referring to the use of fossil fuels as feedstock for plastics, chemicals, fertilizers, and so on. It will increase to from 4.1 EJ in 2020 to 4.8 EJ in 2030, plateau in the 2030s and then slowly decrease to 3.7EJ in 2050. This sector will be especially important for oil, representing 35% of European oil demand in 2050, versus 13% in 2020. Plastics production has represented the biggest increase in non-energy demand over the last decades. With 79 Mt of plastics demand in 2020, plastics production represents the largest share of energy demand in the sector. And despite strong reduction and substitution of demand, production will continue to increase to 93 Mt per year in 2030, before returning to 2020 levels in 2050. Used plastics represent an important source for recycled plastics or fuels. Recycling schemes are well-developed, supported by the EU Waste Framework Directive which provides guidance and sets objectives to improve waste management. But cradle-to-cradle recycling is still limited and 8 Mt of secondary plastics were produced in 2020, covering only 10% of plastics demand. The recycling sector is however booming, boosted by high oil and gas prices as well as the implementation of increasingly extended producer responsibility schemes and their corresponding improvements in collecting and sorting. Europe will maintain its leading role in plastics-to-plastics recycling, mainly mechanical recycling, and output of secondary plastics will progressively reach 27 Mt per year in 2050. Chemical recycling via pyrolysis or similar technologies is able to provide a solution for a wider range of waste plastic feedstock, including waste of lower quality, while delivering high quality (e.g. food grade) output. The industry is, however, still in its teething stages and will have to innovate to ensure cleaner sources for the thermal energy required as well as with the safe handling and valorization of hazardous chemicals. Nevertheless, we conservatively estimate that, by 2050, chemical recycling will produce 200 PJ of petrochemicals that could replace fossil fuel-based virgin resin or be put to other uses.
  • 129.
    256 DNV Energy TransitionOutlook 2022 257 Regional transitions CHAPTER 9 In Chapter 1, we described how Russia’s invasion of Ukraine is impacting the energy transition. In addition to Ukraine and Russia itself, Europe is by far the region most affected, economically and politically. At the outset of the war, Europe’s energy system was highly dependent on imports of energy from Russia, the largest exporter to the EU of natural gas, oil, and coal. Halting and finding alternatives to these imports is both a top EU and wider European priority. But the task is fraught with difficulties. Replacing Russian natural gas is the greatest challenge, as there is currently insufficient infrastructure (such as LNG terminals) to replace piped Russian gas with supply from other countries. DNV (2022b) gives an overview of how the gas is likely to be replaced, and the impact this will have on the energy transition in Europe. Before and independent of the war, EU decarbonization targets — 55% less emissions by 2030, and net-zero in 2050 (e.g. see summary in DNV, 2021a, p 184) — had already set out the EU priorities and actions. The war catapulted energy security to the top of the EU’s energy priorities, but without sustainability and afforda- bility being downgraded in importance. Energy security and sustainability often pull in the same direction. However, the EU is willing to make short-term sacrifices on sustainability — such as firing up more coal plants — to reduce and end dependence on Russian gas. The main EU policy response is the REPowerEU Plan to rapidly reduce dependence on Russian fossil fuels and fast-forward the green transition. The main focus is on “energy savings, diversification of energy supplies, and accelerated roll-out of renewable energy to replace fossil fuels in homes, industry and power generation”. This includes a faster and larger build-out of solar PV and wind, increased production of biomethane, massive installation of heat pumps, policies to nudge demand- reducing behavioural changes, construction of new LNG import terminals, and domestic production and import of hydrogen. Our analysis (DNV, 2022b) is that this plan will succeed to a relatively large degree, and RePowerEU is an important part of the policies we have factored into our assessment of the energy transition in Europe. The war in Ukraine looks set to be a protracted struggle, but sanctions on Russia will last much longer still. Although the eventual outcome of the war is unknown, one certainty is that Europe will become much more energy independent and will do so by decarbonizing more rapidly. Energy security and Europe’s energy policy response to Russia’s war on Ukraine Emissions Our projection for the regional average carbon-price level is USD 95/tCO2 in 2030 and USD 135/tCO2 by 2050. Europe has established carbon pricing nationally and regionally, with clear upward pricing trends, and the EU ETS is a main tool to finance the transition cost (see Section 6.4). EU and UK NDC pledges target 55% and 68% reductions, respectively, in CO2 emissions by 2030 relative to 1990. Our forecast does not include country-specific, non- energy-related CO2 emissions, and Europe is larger than the EU. With that caveat, we see Europe’s energy-related emissions down 48% by 2030 relative to 1990, more than the EU’s initial Paris Agreement pledge of 40%, but certainly less than 55%. We forecast that Europe will have reduced its energy-related emissions by 79% between 2020 and 2050, at which point it will be emitting 0.6 GtCO2 per year, therefore falling short of net-zero pledges prevalent among region countries. Figure 9.3.11 shows transport and manufacturing reducing emissions the quickest. In manufacturing, this is mainly due to declining use of coal and gas, as the role of cheaper green electricity increases. Emissions from oil will be the largest, and represent a constant yearly share of around half of CO2 emissions in the next three decades. Emissions from coal use will decline rapidly, almost disappearing as coal use will dwindle. Those from oil will gradually decline by 2050 to about a quarter of today’s level, primarily because of lower oil use. Overall energy-related emissions in 2050 are 646 MtCO2 after CCS has captured and stored 179 MtCO2 , which captures 22% of Europe’s energy-related emissions in 2050. CCS — though limited in Europe — is still capturing the largest such share among all regions. CCS will not be a big enough industry to counter carbon emissions, even with a 135 USD/t carbon price. In relative CO2 emissions, Europe’s 1.2 tCO2 /person is well below world average.
  • 130.
    - 259 258 Regional transitions CHAPTER9 DNV Energy Transition Outlook 2022 Economy-wide economic signals − The rise in average region carbon prices, to USD 150/tCO2 in 2030 and USD 250/tCO2 in 2050, is reflected as costs for fossil fuels. Transport − The sale of ICE vehicles in both passenger and commercial segments is banned from 2035, and Europe together with OECD Pacific have the most stringent policy measures in road transport, in tandem with subsidized electricity prices for EV propulsion. Buildings − The reductions in CO2 are achieved because of a mandated partial ban of 50% on fossil-fuel equipment in buildings by 2050. The lifetime of new fossil-fuel equipment halves (from 15 to 7.5 years), which also enables a faster phase-out of fossil fuel. Commercial buildings face higher cost of capital if they have fossil-fuel equipment. Manufacturing − Electricity and hydrogen both have CAPEX investment support of 50% for iron ore reduction, along with a mandated, 100% share of EAF in steel production in 2050. Electricity-based heating is incenti- vized by a subsidy of 10% of the electricity price, while a tax of 25% is added on top of fossil-fuel price, assisting the transition to biomass. Energy supply − New oil and gas exploration and development are banned from 2024. Grid electricity is subsidized when used for hydrogen production, in addition to CAPEX support of 25% for dedicated renewables-based electrolysis. PNZ – Europe Our pathway to net zero (PNZ) sees Europe's CO2 emissions dropping from 2.9 Gt in 2020 to -0.1 Gt by 2050 (Figure 9.3.12), and to -0.4 Gt with direct air capture (DAC). Europe achieves its net zero ambition in 2043. Europe backs up pledges with real policy, translating into the highest carbon-price level among regions, and enabling CCS to have a faster ramp up rate to capture 376 MtCO2 in 2050, contrasted with 269 MtCO2 in the ETO forecast. Final energy demand decreases by 35% compared with 21% in the ETO forecast (Figure 9.3.13). Emissions from buildings and manufacturing are negative from early 2040s, while some transport emissions remain also in 2050 (0.03 GtCO2 /yr). Electricity and hydrogen meet 73% of final energy demand by 2050, with region hydrogen demand at 122 MtH2 /yr contrasted with 37 MtH2 /yr in the ETO. The power system has a 4.1 PW capacity in 2050, generating 9.8 PWh, with wind and solar PV accounting for almost three-quarters of the production, compared with 2.5 PW and 6.2 PWh in the ETO forecast. By 2050, oil use for transport purposes has an 8% share, compared with 29% in the ‘most likely’ future; and fossil- fuel use continues as industrial feedstock (non-energy sector). However, while Europe is projected to rely on fossil fuels for 35% of its energy needs in the ETO forecast, its net zero pathway sees the share declining to 7%. Electricity and hydrogen meet 73% of final energy demand by 2050. PNZ – Policy levers
  • 131.
    260 DNV Energy TransitionOutlook 2022 261 Regional transitions CHAPTER 9 South Africa is the region’s largest coal producer. Nigeria and Angola are among the world’s 20 largest oil producers, and Nigeria is a top 10 LNG exporter. With major natural gas reserves, East Africa (Tanzania, Mozambique) is preparing for LNG projects with significant export potential. Recent giant offshore gas discoveries have been made in West Africa (Mauritania, Senegal) and in the southwest (Angola, Namibia). Ghana, Kenya and Rwanda are on track for full electricity access by 2030. But the region as whole remains the least electrified; two thirds of the population cook in inefficient and polluting ways. Lack of energy infrastructure, and power outages / load shedding, are major socio- economic constraints. The region has been made more vulnerable by inflationary pressures, high energy and commodity prices distressing food security, and climate change impacts. COVID-19 has reduced foreign finance flows into non-hydro renewable investments (IRENA and AfDB, 2022). The region has rich, untapped wind, hydro, geothermal and solar resources. Yet its share of global renewable energy investment has been less than 2% between 2000 and 2020. IRENA (2019) estimates that average annual investment in renewables must expand from some USD 5 bn in recent years to USD 70 bn until 2030 for a clean energy transformation to take place. With the region’s infrastructure gap, rising public sector debt, and state utilities’ poor financial performance, new energy players play an increasingly important role. Chinese-funded projects account for 60% of the region’s hydropower investments (Ayele et al., 2021). The off-grid sector had all-time high investment in 2021 (GOGLA, 2021). Independent power projects (IPPs) — privately operated/financed power projects — are the fastest growing energy sector investment structure (African Business, 2022). − Decarbonization will gain momentum in line with the African Development Bank’s (AfDB) 2030 vision to power and 'light up' Africa and the African Union's Agenda 2063, but the pace of change is likely to lag ambitions. − Resource holders in the region remain committed to natural gas, but funding flows from official development assistance and development finance institutions are likely to prioritize clean energy and energy efficiency, suggesting that IPPs will shift towards renewables. − The AfDB’s public-private partnerships (PPPs) strategic framework and Development Fund will contribute to private sector investment in the scale up of transport and energy solutions, helping to close the infrastructure financing gap. − For new utility-scale power generation, the regulatory environment offering long-term investment certainty for IPPs will improve, exemplified by South Africa’s Renewable Energy Independent Power Producer Procurement Programme, doubling capacity (from 2600 MW to 5200 MW in Bid Window Six). − The African Group of Negotiators on Climate Change seek a just green transition via increases in grant funding, concessional loans (without commercial interest rates), and retraining and re-skilling of affected communities and workers to benefit from transition- related value chains. The Just Energy Transition Partnership, with USD 8.5bn in funding from the EU, France, Germany, the UK, and the US towards South Africa’s transition from coal, will be a test case for high-income countries delivering on funding pledges. − Some countries will see green hydrogen production, particularly for exports. Examples include Mauritania’s 10 GW Project Nour by 2030; Angola’s hydropower- based renewable ammonia production; South Africa targeting a 4% global market share by 2050 with 15 GW electrolysis capacity installed (2030–2040). The region will rely on funding from international partner- shipsandofftakeagreementstoadvancedevelopments. Characteristics and current position Pointers to the future 9.4 SUB-SAHARAN AFRICA (SSA) This region consists of all African countries except Morocco, Algeria, Tunisia, Libya and Egypt, which are included in the Middle East and North Africa region *All GDP Figures in the report are based on 2011 purchasing power parity and in 2017 international USD Population (BN) GDP/person (USD) GDP* (USD TRN) Energy-related emissions/person (T) Energy-related emissions (GT) 2020 2050 Energy use/person (GJ) Energy use (EJ) 1.13 3 800 4.3 0.8 0.9 24 27 1.96 9 600 18.9 0.7 1.5 23 46
  • 132.
    262 DNV Energy TransitionOutlook 2022 263 Regional transitions CHAPTER 9 9.4 SUB-SAHARAN AFRICA Energy transition: from broad progress to leapfrogging Sub-Saharan Africa is home to approximately 15% of the world’s population but presently accounts for about 5% of global final energy consumption. The region is not on track to bring affordable, reliable, sustainable modern energy to all by the end of the decade (Goal #7 of the UN’s 2030 Agenda for Sustainable Development).Relianceonexpensiveoil-basedgeneration makes the cost of electricity generation two to three times higher than the global average (AfDB, 2017), and energy shortages, an impediment to businesses and people, are assessed to cost some 2-4% of GDP annually. The International Renewable Energy Agency recently summarized common objectives of the region’s energy transition as follows: reaching economic diversification; the creation of decent jobs; environmental stewardship and climate resilience; and universal access to affordable, reliable, sustainable, and modern energy (IRENA, 2022). Renewable energy technologies offer promising least- cost generation opportunities for achieving these objectives. In some cases, so-called technology leap- frogging may be possible. Affordable and reliable energy is indispensable for a region with the largest youth demographic in the world. With a population approaching two billion people by the end of the forecast period, Sub- Saharan Africa will have a large, young and tech-savvy consumer and labour base, but the transition will be long-haul and will play to individual country strengths and diversity in resources. Developments in energy demand sectors The population will almost double while the region’s economy quadruples over the forecast period. By 2050, 21% of the global population will be in Sub-Saharan Africa and the region’s energy demand growth is projected to increase by 90% from today’s level (Figure 9.4.1), while still representing only 8% of global energy demand in mid-century. Buildings With a growing population, buildings will remain the biggest source of final energy demand. They presently constitute 68% of demand, and we foresee this declining to account for 49% in 2050. Much of the buildings stock existing by the end of the forecast period has yet to be built, and we project the floor area of residential and commercial buildings to expand by 131% and 261%, respectively. Energy demand in the sector will be driven by a combi- nation of more residential/commercial space, a more prosperous population, and improved standards of living/ comfort (e.g. air conditioning). Greater energy efficiency will partially counteract this as the technologies meeting the expanding energy needs will change so that energy use of buildings increases by only 37%. Energy from mostly inefficient traditional biomass, supplying 92% of energy for use in buildings today, will decline to around 70% by mid-century. Electric power (on-grid electricity and off- grid solar PV) will expand to account for 17% of the energy for buildings, as shown in Figure 9.4.2. An expansion in off-grid solar PV solutions will fuel growth in the use of appliances and lighting, accounting for 24% of this segment's demand in 2030 and 45% by mid-century. Manufacturing The level of activity in the region’s manufacturing sector is presently small with low levels of industrialization and dominated by extractive industries and export of raw materials with little further value added. The region is the most commodity-dependent region in the world (UNCTAD, 2021) and in 2019, Africa’s manufacturing value added (MVA) per capita of about USD 207 was about 12% of the global average (IRENA, 2022). Expanding the manufacturing sector is essential for diversifying economies, employment, and for reducing vulnerability to swings in commodity prices and unbal- anced trade. Primary goods (agricultural products, minerals, metals, fossil fuels) dominate the region's exports while manufactured goods make up the bulk of Sub-Saharan Africa's imports. China and East Asia have been capturing rising shares of the import content. China has expanded economic relations to become the region’s largest trade partner, accounting for 20% of total trade value (IMF, 2019). 70% of region exports to China are commodities while 20% of region imports are from China in monetary terms, dominated by consumer goods imports (45%). The Chinese government has built strong ties with the region through foreign direct investment
  • 133.
    264 DNV Energy TransitionOutlook 2022 265 Regional transitions CHAPTER 9 and infrastructure projects. The Chinese Loans to Africa (CLA) database catalogues Chinese lending with signed loan commitments worth USD 160 bn with African governments and state-owned enterprises between 2000 and 2020 (Boston University, 2022). Manufacturing will grow strongly and its energy demand will double from its present 12% share of energy end use to reach 24% by 2050. Among the main demand sectors, we project rises of 285% for manufacturing, 142% for transport, and 37% for buildings. The increasing role of the region’s manufacturing is illustrated by its share in global manufactured output (measured in tonnes) more than doubling from 3% in 2020 to 7% in 2050. The manufactured goods subsector will experience a 227% growth in energy demand over the forecast period, underpinned by electricity’s share in the energy-demand mix growing to reach 25% in 2050, ahead of natural gas (11%) and hydrogen (10%) combined in mid-century. Coal’s share declines from 16% to 6%, as shown in Figure 9.4.3. Strong growth in manufactured goods does not equate to ‘carbonization’. Our findings support pay-off from value-adding initiatives and blueprints — such as the manufacturing-based industrialization central to the African Union’s Agenda 2063 — and national strategies like Kenya’s Vision 2030, Ghana’s Industrial Policy, Emerging Senegal Plan, and Tanzania’s Sustainable Industrial Development Policy. Our forecast is consistent with a boost to policy efforts to strengthen intra-African trade and economic cooperation. The African Continental Free Trade Area (AfCFTA) agreement (signed 2018 and operational July 2019) created a free trade area including 54 of the 55 African Union nations. Free access to commodities, goods and services across the continent will benefit manufacturing of goods in particular, by nations removing tariffs for 90% of goods. Transport Transport energy demand presently accounts for 16% of energy end-use and is 99% reliant on oil. In road transport, the number of vehicles will increase almost three-fold over the forecast period. Internal combustion engine passenger vehicles (ICEVs) still account for more than 90% of sales of new vehicles in 2040, and though the sales share declines to 26% in 2050, the fleet is still 68% oil dependent then. Energy demand for transport purposes will increase by 221%. Specifically, oil use in road transport will increase by 127% because of the three-fold growth in vehicle numbers. Road transport will remain dominated by oil use with an 87% share of the subsector’s energy mix, and electricity accounting for just 12%. While there are some initiatives in electric mobility, there is a lack of supporting policies, and the region’s electricity deficit also hinders electrification of road transport. Overall, our forecast for energy demand (Figure 9.4.4) in Sub-SaharanAfricaindicatessomepositivetrends:asteady use of biomass hides its declining share in the energy mix (reducing from 66% to 40%), and a more than 300% rise in electricity use to 2050 as its share increases from 7% to 15%. However, use of coal and especially oil expands, both retaining much higher shares than natural gas, with oil’s persistence reflecting a lack of gas infrastructure. Energy use expanding — but no coal renaissance Sub-Saharan Africa has the largest share of renewable sources in its primary energy consumption (63%) of any region, with heavy reliance on (mostly traditional) biomass (60%) as seen in Figure 9.4.5. Over the forecast period, coal consumption will increase slightly but oil use is set to more than double (117%). The share of solar and wind expands but will combined still only account for 9% of primary energy consumption in 2050. Hydrocarbons There is a longstanding presence of international oil and gas companies with Sub-Saharan Africa countries relying on these players in the development of hydrocarbon resources. The lived experience of the region’s oil- producing countries tells a story where oil wealth has not been successfully converted into diversified economies; in both Angola and Nigeria, the region’s largest economy, earnings from petroleum production make up 50% of government revenue. The region now has 5% of global oil production. By 2050, this share will dip to 2%, underlining the need for diversi- fication of revenue streams. The share of global natural gas production will increase from less than 2% today to 4% mid-century. However, in the absence of significant domestic natural gas demand growth, exports will determine the commercial viability of developments in Sub-Saharan Africa. Over the forecast period, the region’s gas production will double, predominantly for exports, which will take almost as much gas as is consumed in the region (Figure 9.4.6).
  • 134.
    266 DNV Energy TransitionOutlook 2022 267 Regional transitions CHAPTER 9 Power generation — a leapfrog opportunity While accounting for 15% of world population, the Sub- Saharan Africa region today has less than 2% of global installed electricity capacity. Some countries, for instance France (136 GW), had more installed electricity capacity than the entire Sub-Saharan region (132 GW) in 2020. South Africa alone is home to 58 GW generation capacity from all sources, with coal-fired capacity holding by far the largest share in the national power mix (86% of all Africa’s coal-fired generation capacity is found in South Africa). An important issue is whether Sub-Saharan economies can close the electricity access gap without going through the high-carbon phase that industrialized regions have experienced. In other words, can and will the region leapfrog straight onto a greener pathway with low-carbon energy technologies? Drivers of such a shift would primarily come from global flows of capital seeking decarbonization, both from public (multilateral development agencies and donor government investments) and private investors. Renewable energy targets are generally lacking in terms of uptake requirements in demand sectors such as transport. There are, however, targets focusing on the power sector that aim for renewable power shares around 30% to 40% by 2030, commonly supported by feed-in tariffs. South Africa is a frontrunner in its auction programme (tenders and competitive bidding) and recently removed the cap on private power generation to galvanize funding and a faster deployment of renewables to provide relief from its failing and over-indebted coal-fired power generation capacity. Reflecting these important policy initiatives, but also improving the competitiveness of variable renewable energy sources (VRES), their share in the region’s on-grid power mix will most likely be 9% in 2030, as reflected in Figure 9.4.7. Green hydrogen production is still in its infancy in Sub-Saharan Africa and will be supported by bilateral government funding and offtake agreements. Germany has taken a leading role in this regard, creating links with the region, such as providing EUR 12.5mn to promote production in South Africa, forming a green hydrogen partnership with Namibia, and developing the H2Atlas-Africa project with Sub-Saharan partner nations. As seen in Figure 9.4.7 only a small share ofrenewable electricityisforecasttogotogreenhydrogen production. There will be trade to Europe, but at a very low level, given competition and build-up of infrastructure, i.e. electro- lyser capacity, in other regions also aiming to become green hydrogen production hubs (see Section 9.2 on Latin America). A dramatic shift is predicted for the region’s power systems. South Africa will be decommissioning coal- fired plants and both coal and oil-fired generation are set to decline across the entire region. Today, 65% of on-grid generation is fossil-fired, hydropower accounts for 27%, and other renewables have minor shares. Over the forecast period, this picture will flip. By 2050, fossil-fuelled power will make up 20% of on-grid generation, in which coal-fired plants will account for 9%, overtaken by natural gas accounting for 10%, and oil-fired generation representing 1%. Hydropower will account for 46% and other renewables will have 33% of the on-grid power mix, with solar PV and solar+storage combined accounting for 24%. The changing on-grid electricity mix is summarized in Figure 9.4.8. It provides evidence of leapfrogging in the electricity sector: Growth in renewables will push power system expansion. Coal’s share of capacity declines from 36% to 4%, while solar PV grows from 5% to 47%. As electricity production capacity grows sixfold in this period, half the coal power capacity from 2020 is still there in 2050, as it only reduces from 48 TW to 30 TW, and coal-fired generation declines only 24% to 161 TWh per year. Thus, leapfrogging happens, but it does not result in the full decarbonization of electricity systems. Utility-scale grid-connected non-hydro renewables (like solar PV and wind) will especially scale from the late 2030s onwards, but prior to the utility-scale expansion, there will be significant off-grid capacity additions, as shown in Figure 9.4.9 and discussed in the next section on off-grids and microgrids. Can and will the region leapfrog straight onto a greener pathway with low-carbon energy technologies? Sub-Saharan Africa installed grid-connected power capacity in 2020 and 2050 FIGURE 9.4.8 Fossil, 64% Fossil, 11% Hydropower, 25% Hydropower, 31% Solar, 5% Solar, 47% 2020 132 GW 548 GW 2050 Wind, 3% Wind, 9% Other, 3% Other, 1%
  • 135.
    268 DNV Energy TransitionOutlook 2022 269 Regional transitions CHAPTER 9 Only two of our Outlook regions, India and Sub-Saharan Africa, will display significant household electricity shares enabled by off-grid solutions. In advanced economies, transmission and distribution network grids provide access to power stations that are typically large and centralized. But such infrastructure is costly and has usually represented up to half of the electricity bill. For users with very limited use of electricity — e.g. LED lightning, small refrigerators, and charging small appliances – grid systems would represent an outsize fraction of electricity cost, which is why many urban areas in poorer parts of the world remain unconnected. Photovoltaic (PV) electricity production can however be made cost effective via very small power-production units. Costing only a few dollars, such systems allow for mobile phone recharging; slightly more expensive systems (up to 500 W) can power household refrigerators and freezers when combined with batteries. Our analysis sees such off-grid installations competing increasingly favourably with small, fossil-fuelled off-grid power generators as demand for small appliances increases with improving living standards. In Sub-Saharan Africa, off-grid solutions will increase their share of electricity production from 1% today to a plateau of 13% in 2042 until the end of the forecast period. Microgrids are grids that also benefit from the modularity of small-scale PV and batteries. Typically connecting a few (up to a couple of hundred) electricity users and producers, such solutions afford the advantage of a grid (when some users have low demand, others have high) without the high grid costs. In principle, microgrids can be self-contained, i.e. not connected to other microgrids or to larger grids with central power stations. In practice, our previous analysis shows that microgrids will typically be connected to higher level grids. We see (DNV, 2019) such gridded microgrids representing 19% of PV power production globally in 2050, but only 8% in Sub-Saharan Africa. In contrast, off-grid PV is hardly visible (much less than 1%) on a global basis, but off-grid PV solutions will represent more than 80% of total PV installed capacity in Sub-Saharan Africa when its share peaks in 2037. Note, however, that in this region too, the global trend towards utility-scale PV installation dominance will be visible, just less so than globally (40% in SSA vs 52% globally) in 2050. In energy terms, off-grid solutions can be classified as marginal, which is also the case in Sub-Saharan Africa. When plateauing in 2042, the energy share of off-grid solutions will be about 2%, as electricity represents only 15% of the region’s energy use then (with more than half of energy still supplied by very inefficient biomass use). However, from an SDG #7 perspective (access to affordable, reliable, sustainable and modern energy for all), the miniscule energy amounts represented by off-grid solutions have an outsize effect in reducing the region’s current population lacking electricity access from 57% today to 4% in 2050, as seen in Figure 9.4.10. ‘Modern’ energy implies actions like replacing kerosene lamps with LED bulbs. Such clean energy will also reduce health hazards, as will electric heating replacing open-fire indoor food preparation. The importance of this improvement in global terms cannot be overstated, as the region’s population increasing from 1.1bn to almost 2bn is the main reason why the world’s headcount rises from 7.8bn to 9.3bn in 2050. Even though the fraction of the region’s population that lives without modern comforts will decline significantly, modern cooking facilities will be unavailable for two thirds of the region’s population in 2030, and one third in 2050. This implies that a target in SDG #7 for 2030 (full access to modern cooking) will not even be reached 20 years later, as is seen in Figure 9.4.11. Modern cooking facilities will be unavailable for two thirds of the population in 2030, and one third in 2050. Off-grid, microgrids and energy access FIGURE 9.4.9 Sub-Saharan Africa solar PV capacity FIGURE 9.4.10 FIGURE 9.4.11
  • 136.
    270 DNV Energy TransitionOutlook 2022 271 Regional transitions CHAPTER 9 Emissions Sub-Saharan Africa is already facing devastating climate change impacts, such as drought, delayed rainfall season, or flooding due to excessive rains impacting crop production. The region’s contribution to GHGs historically has been negligible, less than 3% of the world’s energy- related CO2 emissions. Excluding South Africa and Nigeria, the region’s countries are among the lowest emitters in the world. Our projection for the regional average carbon-price level is USD 5/tCO2 in 2030 and 25/tCO2 by 2050. We expect slow adoption and limited explicit carbon pricing instru- ments in the region due to the predominant development focus, where future schemes will be motivated by access to climate finance and to avoid carbon-border adjustment mechanisms (see section 6.4). The region’s energy-related CO2 emissions will rise 61% by 2050 amidst a quadrupling of the economy, as emissions decouple from GDP. Still, emissions growth willcomefrom alldemandsectors,withthehighestgrowth originating fromtransport(103%)asshowninFigure9.4.12. Emissions from coal are the largest today, accounting for about 40% of energy-related emissions, followed by oil (33%). These carriers will swap places over the forecast period in terms of contribution to the region’s emissions footprint. As mentioned above, oil consumption expands, particularly in road transport, while coal consumption, and hence emissions, lingers in extractive manufacturing, and CCS uptake will be negligible at 40 MtCO2 per year, about 3% of total CO2 emissions. However, despite population growth and rising standards of living, Sub-Saharan Africa’s 0.7 tCO2 per person emissions in 2050 are 12% lower than today; in contrast, in the North America region 3.8 tCO2 per person will be emitted in mid-century. In the context of global climate policy, Sub-Saharan African country pledges in NDCs suggest the regional target is for emissions to grow no more than 67% by 2030 relative to 1990. These are unconditional targets, and some countries expect further reductions provided there is international support. Our Outlook indicates energy- related emissions rise 107% over that period, suggesting that the ambitions are not met. Looking ahead to 2050, very few Sub-Saharan African countries have adopted targets to reduce CO2 emissions. Our Outlook estimates emissions a little under 1.5 GtCO2 per year in mid-century, 61% greater than in 2020. One of 13 coal-fired power plants in South Africa owned and operated by the country’s highly indebted utility, Eskom. A rapid, large-scale renewable energy build-out is vital in South Africa to replace the ageing and poorly maintained fleet of coal plants. A lack of generation capacity caused by persistent breakdowns has led to thousands of hours of load shedding in 2022 alone, causing significant hardship and damaging an already-challenged economy.
  • 137.
    273 272 Regional transitions CHAPTER9 DNV Energy Transition Outlook 2022 PNZ– Sub-Saharan Africa Our pathway to net zero (PNZ) sees Sub-Saharan Africa's energy-related CO2 emissions fall by 41% from 2020 to 2050, but still be significant at 0.53 Gt, the highest among regions. As shown in Figure 9.4.14, all sectoral emissions will decline by a similar fraction. Sub-Saharan Africa is far from ‘net zero’ in our global pathway by 2050 and illustrates precisely why wealthier regions will have to go below zero before then. In our ETO forecast, the region has the highest increase (61%) in carbon emissions from 2020 to 2050, and the highest percentage growth in energy demand — a consequence of the steepest popu- lation growth among the regions that starts with a low energy intensity, and is set to develop and provide more energy services to its energy-deprived population. Final energy demand in a net zero future will increase by 50% to 2050. In buildings, the use of traditional biomass declines, but still constitutes 41% of the region’s final energy, and a full 75% of buildings’ energy use in 2050. Manufacturing is the sector where energy use increases the most — almost triples to over 7 EJ mid-century. And while the region lags others in vehicle electrification, by 2048 electricity use would surpass oil in road transport. By mid-century, over 80% of the vehicle fleet is electrified in a net zero future. This is both a consequence of strong grid growth, but also a cause of grid expansion. On the supply-side, coal use doubles to 2050 (Figure 9.4.13). However, all power and hydrogen production processes with carbon emissions see full CCS coverage. Electricity use will increase, almost quintupling its share of final energy demand to 33%, playing an increasing role in all sectors. Hydrogen as an energy carrier will emerge to account for a 4% energy share. The electricity mix will have expanded shares for solar and wind, with coal being forced out in 2045. The region’s energy rich waterways will undergo damnation to a greater extent than any other region, with hydropower providing 37% in 2050 — a slightly higher share than solar PV. Economy-wide economic signals − The rise in average region carbon prices, to USD 15/tCO2 in 2030 and USD 50/tCO2 in 2050, is reflected as costs for fossil fuels. Transport − Taxation levels on gasoline and diesel increase (+75%), however transport policies adopted in SSA are the least stringent, with no bans on the sale of ICE vehicles. Charging infrastructure for electrification of road transport will take longer time to come into existence. Buildings − CO2 emissions reduction is achieved through partial bans (25%) on fossil fuel equipment in buildings by 2050. The lifetime of new fossil-fuel equipment halves (from 15-7.5 years), and traditional biomass equipment similarly has only half the previous lifetime; in combina- tion enabling faster electrification. Commercial buildings face a higher cost of capital for fossil-fuel equipment. Manufacturing − The cost of capital for oil and gas equipment increases from 8% in 2022 to 17%, and for coal equipment increases to 20%. This considerably reduces the attractiveness of fossil-fuel equipment, enabling the faster phase-out. Energy supply − New oil and gas capacity additions are banned from 2028. Grid electricity is subsidized when used for hydrogen production, in addition to the capacity investment support of 10% for dedicated renewables for hydrogen production. PNZ – Policy levers Sub-Saharan Africa is far from ‘net zero’ in our global pathway by 2050 and illustrates precisely why wealthier regions will have to go below zero before then.
  • 138.
    274 DNV Energy TransitionOutlook 2022 275 Regional transitions CHAPTER 9 A diverse region, economically and politically, with vast petroleum resources, the largest being in the Kingdom of Saudi Arabia (KSA), Iran, Iraq, United Arab Emirates (UAE), and Kuwait. There is ample solar radiation year- round, and desert winds and open spaces are available for renewables projects. Middle East and North Africa is the cornerstone of and the global trade in oil and gas. The OPEC members in the region are trying to maintain a delicate balance between production and prices in the wake of the pandemic and the uncertainty caused by Russia’s invasion of Ukraine. In producing countries, hydrocarbon revenues face pressures from global decarbonization ambitions and the unpredictability of returns. However, recent significant increases in natural gas/LNG price and demand, especially from Europe, have region producers positioning them- selves to fill the supply gap. Oil and gas investment projects are being sanctioned to maintain/increase production capacity for exports (e.g. Qatar KSA, UAE). MEA countries are taking serious steps to realize their vast renewables potential to meet growing domestic electricity demand, including that from desalination, and to diversify energy sources as an economic growth strategy. Egypt, KSA, Morocco and UAE have some of the region’s largest renewable energy programmes, and Turkey has made solid progress in securing supply through renewables expansion. State funding and state-owned companies (e.g. in oil and petrochemicals) are involved in hydrogen projects with hydrogen production building on existing fossil-fuel capacities; large natural gas resources available for conversion; excellent conditions for low-cost renewables; and nuclear-powered electrolysis as in KSA and UAE. Morocco, Oman and the UAE have published their hydrogen strategies, and Algeria, Egypt, KSA and Turkey are developing theirs. For EV deployment, policy frameworks are incipient in UAE and KSA. − Renewables will expand in power generation. Both KSA and UAE target 40-50% of their energy from renewables in 2030. Morocco aims for 52% renewable power by 2030, Egypt 42% by 2035, and Turkey’s 50% target by 2023 is likely raised as 66% was already achieved in 2020. More of the region’s countries are adopting public tenders/auctions to promote renewables. − Rising electricity demand will place focus in the medium term on energy efficiency and demand-side manage- ment measures. A regional power trade will gain more rationale, as will battery utility-scale storage. − The region is expected to exploit its lowest per-barrel extraction costs with continued investment in upstream oil and gas production and liquefaction capacity. Maintaining oil-supply shares to maximize government revenue will be in focus and succeeding. − Hydrogen ambitions play off the region’s cost advan- tage in renewable electricity, as well as through CCUS. The UAE and KSA governments pursue joint funding in hydrogen industrial partnerships. Morocco expects cumulative hydrogen investments of USD 8bn by 2030 and USD 75bn by 2050. Oman targets USD 34bn in renewable-hydrogen investments by 2040. Egypt is emerging as an export hub for LNG, electricity, and green ammonia. UAE and KSA also target domestic use in industry and road transport. − UAE has a net zero ambition in 2050, Turkey by 2053, KSA by 2060. With two consecutive COP events (COP27 Egypt, COP28 UAE), decarbonization and energy transition focus is prevalent. There will be heightened value-chain attention to lower emissions/carbon intensity of oil and gas production (e.g. through large- scale electrification such as started in UAE) given increased carbon footprint quantification emerging in targeted export markets, and in anticipation of carbon-border adjustments. Characteristics and current position Pointers to the future 9.5 MIDDLE EAST AND NORTH AFRICA (MEA) This region stretches from Morocco to Iran, including Turkey and the Arabian Peninsula Population (MN) GDP/person (USD) GDP* (USD TRN) Energy-related emissions/person (T) Energy-related emissions (GT) 2020 2050 Energy use/person (GJ) Energy use (EJ) 542 19 900 10.9 5 2.7 90 49 720 39 200 28.3 3.5 2.5 96 69 *All GDP Figures in the report are based on 2011 purchasing power parity and in 2017 international USD
  • 139.
    276 DNV Energy TransitionOutlook 2022 277 Regional transitions CHAPTER 9 9.5 MIDDLE EAST AND NORTH AFRICA Energy transition: from hydrocarbon to hydrogen? As one of the most fossil fuel-rich regions of the world, the Middle East and North Africa has not been at the forefront of the energy transition so far. Things are starting to change, however, with global zero-carbon targets pushing the region’s countries towards developing their own carbon-neutrality targets and low-carbon fuel strategies. Egypt, for example, is very much in focus, with COP27 set to be hosted in Sharm-el-Sheikh. The country is aiming to provide the lowest-emissions natural gas and is emerging as an exporter of low-carbon LNG, electric power and green ammonia to Europe and beyond. Other countries in the Gulf region, such as Saudi Arabia, the UAE and Oman, have issued ambitious hydrogen strategies, and are set to exploit abundant access to solar and wind power, natural gas reserves for blue hydrogen, sea water, and established energy infrastructure and trading partnerships (Dubai Future Foundation, 2022). Figure 9.5.1 shows developments in primary energy consumption for the Middle East and North Africa region. Primary energy consumption is expected to grow by 42% over the next three decades, from 49 EJ in 2020 to 69 EJ in 2050. Most of this growth happens up to 2040, with primary energy levelling off between 2040 and 2050 as a result of the global shift towards renewables. In this transition, the decline in natural gas and, especially, oil supply from the region is expected to be as steep as the concurrent rise in solar and wind, leading to total energy supply staying stable around 69 EJ from 2040 to 2050. In terms of shares, that of fossil fuels in primary energy is expected to fall from the current 97% to 71% by mid- century, with solar and wind taking 18% and 6% of the share of total, respectively. Therefore, by 2050, this oil and gas-rich region will still rely predominantly on fossil fuels to provide its energy, with natural gas and oil holding strong 47% and 21% shares, 9 and 15 percentage points lower than today, respectively. The overall picture can be described as oil giving way to solar to a significant degree, natural gas persisting as a ‘transition’ fuel in the region, and wind being fairly slow to take off despite the region’s vast areas of flat barren land ideal for potential wind turbine farms. Electricity Figure 9.5.2 visualizes trends in on-grid electricity generation by power station type for the region. In this picture, the transition is much starker than for overall primary energy. Here, we see a tremendous 3.6-fold increase in electricity generation in the region over the next 30 years, from roughly 1,900 TWh to 6,800 TWh. Virtually all of this growth (94% of the total 4,900 TWh to be precise) will be from renewable sources. Albeit absent from the mix today, wind and solar will together provide 69% of the region’s electricity by 2050, with solar alone contributing nearly 50%. Just over a quarter of this solar electricity generation is expected to be in solar + storage power stations, a technology that is expected to start taking off only in the 2040s. The vast majority of wind power will be onshore in our forecast, with fixed offshore wind farms constituting only a fifth of total wind generating capacity, and floating offshore expected to remain negligible in our forecast period. Final energy demand Figure 9.5.3 depicts the growth in total energy demand broken down by demand sector from 1990 to 2050. Total energy demand goes up by 64% over the next three decades, from 33 EJ in 2020 to 54 EJ in 2050. After the COVID-related dip in energy demand in 2020 and a brief period of faster-than-normal recovery, demand is expected to fall back along its previous almost linear growth trajectory around 2025, eventually slowing down to a plateau around 54 EJ in the second half of the 2040s. This plateauing is mainly due to the transport sector, with demand from road transport expected to peak around 2040 with the uptake of the much more efficient electric road transport starting in the 2030s and really taking off only in the 2040s. In the Middle East and North Africa region, electricity is going to reach 10% of the energy carrier mix in road transport only in 2041, 11 years after the same threshold is reached in the frontrunner region, Greater China. Middle East and North Africa is moving forward with implementing policies and regulations around EV charging infrastructure. The UAE’s capital Abu Dhabi has recently published its regulatory policy for EV charging infrastructure towards its target of carbon neutrality by 2050. Saudi Arabia is moving to build its first EV assembly plant (licensed by US-based EV maker Lucid Motors), likely to be the first of three planned factories (Lucid Motors, 2022), to produce EVs for domestic sales
  • 140.
    278 DNV Energy TransitionOutlook 2022 279 Regional transitions CHAPTER 9 and regional exports. Although currently there is a very tepid take up in the region, things are starting to happen. The fastest growing demand sector is buildings, with space cooling being the fastest growing subsector (Figure 9.5.4). Out of the total 21 EJ growth in total energy demand in all sectors, 5 EJ (24%) originates from a surge in demand for space cooling, which grows nearly tenfold from 0.6 EJ to 5.7 EJ. This is despite a 30% improvement in average cooling equipment efficiency, meaning that useful energy demand for space cooling is expected to grow even more rapidly. This spectacular rise in demand for space cooling is due in part to the warming climate, leading to a 30% rise in the number of cooling degree days by 2050. The other drivers for space cooling are a doubling of GDP per capita in the region, and a more than doubling of building floor area reflecting population growth and a rising standard of living. A key question is which energy carriers are going to meet the 54 EJ of energy demand in the region by 2050, and how the carrier mix will be different from today. Figure 9.5.5 depicts developments in energy demand by carrier in the Middle East and North Africa. The most salient trend observed in this graphic is the almost exponential riseinelectricenergy,alongwithaconcurrentdeclineinoil. From 2020 to 2050, the share of oil drops from 37% to 22% while electricity’s share rises from 17% to 38%, replacing natural gas as the primary energy carrier in the region. The demand for natural gas, while increasing from 14 EJ to 17 EJ, drops in share from 42% to 32%. This is somewhat similar to the overall picture of primary energy consumption seen earlier (Figure 9.5.1). Small but still visible is the sliver of demand responded to by hydrogen, which claims a modest share of around 2.3% by 2050. In the next section, we take a closer look at this burgeoning energy carrier in the region. The rise of hydrogen Figure 9.5.6 shows the take-off in hydrogen production in the Middle East and North Africa starting in the 2030s. Hydrogen production for energy purposes will grow tenfold in two decades, from less than 1 Mt in 2030 to nearly 10 Mt in 2050. In the beginning, this will consist almost solely of blue hydrogen produced via methane reforming of natural gas with CCS. Blue hydrogen will remain dominant throughout the forecast period. Gradually though, green hydrogen produced in electro- lysis plants using dedicated solar electricity, and yellow hydrogen, produced via electrolysis using electricity from the grid, are expected to take off in the 2040s. They will constitute 14% (green) and 25% (yellow) of total hydrogen production by 2050. This split among various hydrogen production routes is a direct result of develop- ments in the levelized cost of hydrogen production, which is demonstrated in Figure 9.5.7 for selected production routes. It can be seen that, thanks to low prices for locally extracted natural gas, blue hydrogen remains as the most economically viable route through- out the forecast period. However, with the rapid growth in solar electricity generation (shown previously in Figure 9.5.2) and the associated reduction in costs thanks to cost-learning curves, dedicated solar and grid- connected electrolysis become competitive production routes during the 2040s. Recent market and policy developments in the region indicate a clear push for green and blue hydrogen and derivatives like ammonia and e-methanol. The prerequi- sites of high-yield renewable resources and large areas of unused flat land for renewables and electrolysis plants needed for green hydrogen, and cheap natural gas resources for blue hydrogen, are all abundantly available in the region. As electricity and natural gas are cheap, local demand for expensive green hydrogen is expected to be relatively low, at least in the near term. Considering the potential for cost-effective production of low-carbon hydrogen and derivatives alongside the region’s ideal position at the nexus of growth markets across the East and the West, Middle East and North African countries are set to become key global suppliers in the emerging global hydrogen market. By 2050, around 1.5 Mt/yr of hydrogen is expected to be transported via pipeline and seaborne trade (mainly pipeline), mainly to Europe and the Indian Subcontinent, as well as around 12 Mt of ammonia (for both energy and feedstock use) via shipping to various other regions. The Middle East and North Africaisexpectedtobethesoleexporterofpurehydrogen to Europe, responding to a small share of demand in the latter region. Therefore, it comes as no surprise to see that export is the core focus of national hydrogen strategies announced so far by Algeria, Egypt, Oman, Saudi Arabia, and the UAE. In particular, the UAE is targeting a 25% share in the global low-carbon hydrogen market by 2030 (SP Global, 2021c) while Saudi Arabia has stated intentions of becoming a leading global supplier of hydrogen (Reuters, 2022). Oman is also competing to become a regional player in green hydrogen/ammonia; reflected by its national strategy which highlights incremental targets of dedicated renewables capacity deployment: 1 GW by 2025, 10 GW by 2030, and 30 GW by 2040 (Sundar, 2021). The race between different countries to become the main low-carbon hydrogen hub in the region is pushing governments to accelerate and increase efforts in establishing regulatory frameworks to support these ambitions. However, the UAE is currently considered to be the only country that has reached an advanced stage of development in its regulatory framework, and clearer direction is expected before the end of the year (ADGMO, 2022). As requirements for green hydrogen differ from one region to another, Middle East and North African countries are also actively exploring private and public certification schemes that would allow them to satisfy the requirements of importing countries. International partnerships and foreign direct investment are complementary pillars in the achievement of export targets set out in these strategies. Several international agreements have already been established across the hydrogen supply chain, primarily between Gulf
  • 141.
    280 DNV Energy TransitionOutlook 2022 281 Regional transitions CHAPTER 9 Cooperation Council (GCC) countries (e.g. UAE, Saudi Arabia, and Oman) and nations in Europe and Asia — particularly those that anticipate imports bridging the gap between future domestic production and demand (e.g. Germany, the Netherlands, Japan, and South Korea, to name a few). Concurrently, collaboration between state-linked energy companies (e.g. ADNOC, Masdar, ACWA Power, Aramco, and OQ) and major multinational industrial players (e.g. Siemens, Air Products, Interconti- nental Energy) continues to be seen in flagship low-car- bon hydrogen projects, like the NEOM Helios Green Fuels project in Saudi Arabia (Nereim, 2022), Green Energy Oman (SP Global, 2021b), and the TA’ZIZ Blue Ammonia project in the UAE (ADNOC, 2021). Other places in North Africa are signing agreements for multi-gigawatt renewable developments for the green hydrogen industry, such as plans by Masdar and Hassan Allam Utilities for developing 4 GW of electrolyser capacity in Egypt by 2030, corresponding to an output of 480 ktH2 per year (Masdar, 2022). While these projects are primarily export-oriented, some countries in the region have established national hydrogen alliances (e.g. the Abu Dhabi Hydrogen Alliance in the UAE and Hy-Fly in Oman) that are also concerned with promoting domestic use of hydrogen in industry, utilities, and road, air, and maritime transport. The UAE in particular sees opportunities to leverage its status as an inter- national shipping and aviation hub through the 2 GW green hydrogen to ammonia project at KIZAD, Abu Dhabi, which targets the ship bunker fuels market (TAQA, 2021a) and the green hydrogen demonstrator plant at Masdar City which will explore the production of sustain- able aviation fuels (SP Global, 2021a). Interest is also visible in the use of hydrogen in green steel production through collaborations announced between TAQA and Emirates Steel in the UAE (TAQA, 2021b) and between Hydrogen Rise and Jindal Shadeed Iron Steel in Oman (Hydrogen Rise, 2022). Potential Iran nuclear deal and world energy markets Since early 2021, Iran has been in negotiation with P5+1 (permanent members of the UN Security Council plus Germany) to revive the 2015 Nuclear Deal, which has been inactive since former US President Donald Trump withdrew from it in 2018. The two sides seem to be inching closer to an agreement. At the time of writing, the Biden-Harris Administration in the US is considering Iran’s latest offer to resume its compliance with the 2015 deal. Although progress has been made in these negotiations and a revival of the 2015 deal appears to be not unlikely, the US has cautioned that gaps still remain between Washington and Tehran over the latest draft agreement (Financial Times, 2022b). Iran has some of the largest oil and gas reserves in the world. Its oil represents up to 25% of the Middle East’s and 12% of the world’s proven reserves. Similarly, Iran’s gas reserves are second only to Russia’s, and account for 17% of global reserves. A revival of the 2015 deal could lift sanctions against Iranian oil and gas exports, and let the market be flooded by the millions of stored barrels of oil and billions of cubic metres of natural gas waiting to be shipped. Due to sanctions, Iran’s stored oil in floating facilities reached more than 100mn barrels in February 2022 from 30mn in December 2021 (Bloomberg, 2022a). Iranian officials say they have capacity to increase oil production from 2.4mn barrels per day now to 3.8Mb/d as soon as sanctions are lifted, and 5.7Mb/d in the long term (Gulf Int’l Forum, 2022). Similarly, the country plans to expand its gas production capacity by 130mn cubic metres per day and extend gas export to Turkey. All this means that if oil and gas sanctions against Iran are lifted as a result of a new deal being struck between Iran and world powers, the energy market will face a significant spike in oil and gas supply, putting downward pressure on energy prices. In the short term, this could temper unusually high energy prices brought about by the Russian invasion of Ukraine. In the longer term, however, the impact is more difficult to anticipate. Since the energy transition is by and large a demand-driven one, supported by policies such as carbon pricing and fossil-fuel bans, it is likely that a new Iran nuclear deal would have little impact on the transition at a global scale. On a more regional scale, however, it is conceivable that more abundant supply of oil and gas as a result of such a deal would delay the transition towards low-carbon fuels in the Middle East and North Africa, shrinking the share of solar and wind in primary energy consumption in the region, which is currently forecast to be 25% by 2050. Emissions Our projection for the regional average carbon-price level is USD 10/tCO2 in 2030 and 30/tCO2 by 2050. Carbonpricingis presently low or negative givenfossil-fuel subsidies and slow adoption is expected (see Section 6.4). In the context of global climate policy, country pledges in nationally determined contributions (NDCs) indicate that Middle East and North America, viewed as a region, has a regional target for emissions to increase by no more than 258% by 2030 relative to 1990. Our Outlook suggests that energy-related emissions will be limited to a 239% increase by then, demonstrating that emission-target ambitions could be higher. There are however some uncertainties in the comparisons of targets and forecasts, as some countries are unclear about whether the targets reported in NDCs also include non-energy related CO2 emissions. Most Middle Eastern emission targets are given in relation to a business-as-usual trajectory. By 2050, emissions in the Middle East and North Africa region are expected to have declined by 5% compared with 2020. Emissions will equal to energy-related emissions of 2.5 GtCO2 per year. Emissions are expected to keep rising until the mid-2030s, when they peak at around 3.3 GtCO2 , approximately 18% above today’s level, then slowly decline to 2.5 GtCO2 by 2050, a level last seen around 2012 (Figure 9.5.8). Recent (2021) announcements have a 2050-time horizon. The UAE led the way among the region’s petrostates in announcing a strategic initiative committing to achieve net-zero GHG emissions by 2050. Israel aims to cut GHG emissions by 85% in 2050 relative to 2015. Turkey, the last G20 country to ratify the Paris Agreement (October 2021), also announced a net-zero goal by 2053. Saudi Arabia has a target to reach net-zero by 2060.
  • 142.
    Regional transitions CHAPTER9 DNV Energy Transition Outlook 2022 283 282 PNZ – Middle East and North Africa In the pathway to net zero (PNZ), CO2 emissions decline from 2.7 Gt in 2020 to 0.5 Gt in 2050 (Figure 9.5.9). The pathway sees the region transitioning away from using its vast domestic oil and gas resources without emissions abatement but will continue to use some of these resources with CCS. The region is also expected to depart from keeping fuel prices low, especially in the transport sector, partly because of an increasing carbon price, but also in response to mounting pressure to abate, given high emissions in the past. Intransport,CO2 emissionsfallby57%from2020to2050. ThiscontrastswiththemostlikelyETOforecastofan increaseof11%overthecorrespondingperiod.Inbuildings, CO2 emissionsfallfromabout0.9GtCO2 in2020downto almostzeroby2050whereasinourETOtheequivalent reductionwasonly7%. Inthemanufacturingsector,CO2 emissionsfallfrom0.7GtCO2 in2020to0.1GtCO2 by2050. On the supply-side, CO2 emissions from the power sector reduce from 1 GtCO2 in 2020 to -0.1 GtCO2 (thanks to biomethane-fired power generation with CCS) by 2050. This occurs while the share of electricity in final energy demand simultaneously grows from 17% in 2020 to 52% by 2050. Hydrogen’s share grows from nearly zero to 7% by 2050. Nevertheless, considerable natural gas remains in the system, especially in manufacturing. While some grey hydrogen remains for use as feedstock in a net zero future, hydrogen as an energy carrier in a net zero future is renewables-based produced from electrolysis or low- carbon via methane reforming with CCS. The pathway sees the region transitioning away from using its vast domestic oil and gas resources without emissions abatement. PNZ – Policy levers Economy-wide economic signals − The rise in average region carbon prices, to USD 30/tCO2 in 2030 and USD 100/tCO2 in 2050, is reflected as costs for fossil fuels. Transport − We assume a ban on the sale of new ICE vehicles from 2045 for passenger vehicles and 2050 for commercial vehicles. Concurrently, the tax on oil price for transport rises by 200% over the period to 2050, albeit from a low base. Buildings − All oil and natural gas subsidies for buildings are eliminated from 2022. Simultaneously, a partial ban of 25% on all new fossil-fuel equipment in buildings is implemented by 2050. The lifetime of new fossil-fuel equipment halves (from 15 to 7.5 years), signifying faster retirement of such equipment and enabling electrification. Manufacturing − The cost of capital of oil and gas equipment increases from 8% in 2022 to 11% in 2050, and to 20% for coal equipment. Simultaneously, an investment support of 4% is given to electric heat production, which considerably reduces the attractiveness of fossil-fuel equipment and enables faster phase-out. In cement production, it is assumed that specific heat demand for clinker production declines twice as fast as in our ETO forecast (0.4%/yr improvement in energy efficiency instead of 0.2%/yr); and similarly, the clinker to cement ratio declines by 0.6%/yr instead of 0.3%/yr in the ETO forecast. The cement intensity of construction is assumed to be 25% lower than ETO by 2050. In virgin plastics production, it is assumed that the region will catch up twice as fast with Europe (the front-runner region) in terms of recycling rates and reduction in demand via efficiency and substitution by plastic alternatives. Energy supply − New greenfield oil and gas capacity additions are banned from 2028. Concurrently, grid electricity is subsidized when used for hydrogen production, in addition to the capacity investment support of 10% for dedicated renewables for hydrogen production.
  • 143.
    284 DNV Energy TransitionOutlook 2022 285 Regional transitions CHAPTER 9 North-East Eurasia produced 23% of the world’s natural gas and 15% of its crude oil in 2021. Coal is also abundant. The region’s dependence on hydrocarbon export revenues is strong. In this region, Russia is dominant in size, population, and economic output. It is the world’s second-largest producer of hydrocarbons (17% of global gas and second only to Saudi Arabia in oil exports). Although Russia is currently finding buyers for its oil, its war on Ukraine raises considerable risks for the economic future of the region. Europe (EU) and East Asian economies have been the main markets for North-East Eurasia's hydrocarbon resources. Energy relations are now changing, with European countries planning to phase-out energy imports from Russia. Japan is also committed to reducing its energy reliance on Russia. The region is at risk of falling behind in technology needed for decarbonization. Its reliance on fossil energy is both a cause and a consequence of the region’s transition laggard status. For Russia, this risk is magnified by the effect of sanctions and withdrawal of international capital. Central Asian states are latecomers to the energy transition with renewables starting to be prioritized only since the late 2010s (CADGAT, 2022) All the region’s countries have high energy intensity of GDP and thus significant potential for energy-efficiency measures across all sectors. There are signs of growing energy transition efforts — for example, Azerbaijan’s agreement with Abu Dhabi developer Masdar on offshore wind and green hydrogen (Recharge, 2022); Uzbekistan joining the Methane Pledge and aiming for 30 GW new low-carbon power by 2030; Kazakhstan approving its green taxonomy (EICON, 2021); and Ukraine’s readiness to contribute to the European Green Deal (Holovo, 2021). Characteristics and current position Pointers to the future 9.6 NORTH EAST EURASIA (NEE) This region consists of Russia, Mongolia, North Korea, and all the former Soviet Union states — including Ukraine, except the Baltics − The Eastern Partnershipwill extendthe EU’s cooperation in the region, supported by a seven-year EUR 17bn (USD 20.1bn) investment package (Council EU, 2021). The Energy Strategy 2030 of the Central Asia Regional Economic Cooperation (CAREC) aims for efficiency and clean energy deployment backed by development partners (e.g. Asian Development Bank, European Bank of Reconstruction and Development). − Ukraine was granted EU candidate status by the European Commission, and its reconstruction plan will emphasize low-emission development. Even before Russia invaded, Ukraine’s draft 2030 strategy targeted 10 GW renewable hydrogen capacity, 7.5 GW for exports to the EU. − Kazakhstan pledges carbon neutrality by 2060 but low-cost coal abundance suggests coal power domi- nance until 2040. Its emissions trading scheme, with prices averaging USD 1/tCO2 e is insufficient to drive decarbonization, but a draft government decree suggests a rise to USD 50.8/tCO2 e before 2030 (Conventus Law, 2022). − Russia will turn to Eastern markets to maintain energy export revenues. However, insufficient infrastructure for natural gas exports, and the time and massive investment needed for new pipelines and terminals will cause North East Eurasia gas production to decline. − High energy prices are benefitting Russia short term, but sanctions will impact trade, foreign direct invest- ment, flows of knowledge, and lead to a flight of skilled professionals from Russia. No further concretization of Russia’s net-zero target for 2060 is expected beyond the present focus on hydropower, nuclear, and negative emissions from land-use changes and forestry. − With demand likely peaking in Western and Eastern markets due to decarbonization, the Central Asian oil and gas resources risk becoming stranded assets, only partially offset by the extraction of critical materials for clean energy technologies (Vakulchuk et al., 2021). Population (MN) GDP/person (USD) GDP* (USD TRN) Energy-related emissions/person (T) Energy-related emissions (GT) 2020 2050 Energy use/person (GJ) Energy use (EJ) 318 17 400 5.6 7.4 2.4 140 45 315 30 500 9.6 5.8 1.8 132 42 *All GDP Figures in the report are based on 2011 purchasing power parity and in 2017 international USD
  • 144.
    286 DNV Energy TransitionOutlook 2022 287 Regional transitions CHAPTER 9 9.6 NORTH EAST EURASIA Energy transition: Ukraine invasion will see Russia produce less gas, but only marginally less oil and coal As the saying goes: 'Where you stand depends on where you sit'. Our previous Outlooks have underlined that exporters of fossil fuels will invariably be the laggards of the energy transition. This applies to North-East Eurasia’s nations, which are generally autocratic, have unem- powered electorates, and are not willing to invest in fundamental change. In our forecast, the region’s energy system retains today’s characteristics through to mid-century. Demand remains at current levels, with a similar sectoral split and little change in the mix of energy carriers. Fossil energy remains at current levels, though electricity creeps up at the expense primarily of coal as buildings owners' and users take advantage of electricity’s added convenience. We see the same picture through the primary energy lens. Natural gas continues to dominate. On the non-combustion side, solar and wind will grow strongly in relative terms, but provide only respectively 4% and 3% of primary energy in 2050. Electrification The 59% increase in electricity production to 2050 will mostly benefit renewables, but gas will still provide one third of power in 2050. Low domestic gas prices, also benefitting from lost export opportunities as a result of the Ukraine war and continued sanctions even after the war eventually ends, make coal less competitive, and it disappears from power production in 2040. By mid- century, hydropower output will have increased 164% to generate a quarter of the region’s electricity. Growing from virtually nothing today, solar and wind power will together generate just as much as hydropower in 2050. Hydrocarbons The region’s exports and energy production future hinge on the future of its oil, gas and coal exports. More than one third of the fossil energy production is exported to other regions — 43% of the coal, 39% of the oil, and 26% of the gas. Gas exports mainly take place through pipelines to Europe. Russia halted these exports indefinitely in autumn 2022; Europe is determined to pivot away from Russian gas, and thus imports are assumed to be replaced by other suppliers going forward. Other countries in the region will, however, continue some exports but not in sufficient quantities to influence a 50% reduction in the region’s global gas exports over the next 30 months (totalling 153 Gm3 in 2024). By 2050 it will have declined further to 128 Gm3 . In the longer term, Russia is likely to be more interested in selling its gas to the highest bidder, and this will not be Europe. An increased build-up of transport infrastructure — pipelines to the east and LNG terminals in the north — will only partially replace current piping to Europe, and so the region’s gas exports will decline. Domestic demand will not take up the slack. Regional gas production peaked in 2021 at 1,046 Gm3 . Production will fall 28% to 752 Gm3 in 2027 while global gas production is increasing by 1%. This trend is already evident in North East Eurasia. Gazprom’s gas exports to China increased by 61% in the first seven months of 2022, but the company’s total gas exports still declined by 35%, resulting in its total gas production falling 12% over the same period for that regional company. The North-East Eurasian nations are generally autocratic, and are not willing to invest in fundamental change. Oil and coal exports are much easier to redirect than natural gas, as they can be transported on keel more readily. Though much oil transport is through pipelines, trains and trucks can also be used cost effectively over land without the need to convert to or from solid form (IEA, 2022a). However, enabling long distance transport from the region requires significant infrastructure. Overseas it requires ships and the complication here is that western shipowners are subject to sanction rulings
  • 145.
    288 DNV Energy TransitionOutlook 2022 289 Regional transitions CHAPTER 9 against Russia. Moreover, insurers are typically required to follow sanctions against Russia, and given the dominant role of western insurers, even non-western ships will find it hard to operate in this trade. When seaborne oil and coal exports from the region continue, this can be explained by non-western insurers increasing their underwriting market share, or ships travelling without insurance. The region’s crude oil production decreases 12% between 2021 to 2027, while the world witnesses a global increase of 6%. Oil from Russia will be sold at a heavy discount to Brent prices. Coal production will reduce by 16% over the same period, faster than the global 7% decline. Emissions Our projection for the regional average carbon-price level is USD 6/tCO2 in 2030 and USD 20/tCO2 by 2050. Slow adoption and low carbon-price levels are expected (see Section 6.4). Energy-related emissions will fall by 30% to mid-century, by a similar fraction in all main demand sectors as shown in figure 9.6.6 (buildings by 26%, transport 20% and manufacturing 18%). The region’s total emissions will be 1.8 Gt CO2 in 2050, affording the highest emissions per person of any region. While other regions both experience a strong electrifi- cation, and a greening of electricity, neither is true for this region. Electricity does grow compared to other energy carriers, but only from 13% to 18% of total energy demand. This helps little as gas use in power production increases by 25%, even though coal use in that sector disappears in 2040 — largely replaced by non-emitting renewables. The low carbon prices hinder the uptake of CCS, and so less than 1% of manufacturing or power sector emissions are captured in 2050. In the context of global climate policy, our interpretation of country NDC pledges in the region is that the region targets reducing energy-related emissions 26% in 2030, relative to 1990. As energy-related CO2 emissions are forecast to be down 30%, the region as a whole reaches its climate goals before that target date. However, as the Soviet Union collapsed in 1991, emission statistics are problematic: Statistics indicate emissions falling a full 40% 1990 to 1997. Though industrial production fell by half in the same period, emissions reduction statistics may well overstate the extent of the decline. But emissions rising from 1997 to 2020 appears robust. The 30% emissions reduction is the weakest of any industrialized region. Because North East Eurasia sees the lowest reduction in emissions of any industrialized region, reaching net zero goals, as Russia has claimed for 2060, and Kazakhstan and Ukraine having carbon-neutrality goals for 2060, have a very low probability of being achieved. Russia is likely to be more interested in selling its gas to the highest bidder, and this will not be Europe. An increased build-up of transport infrastructure will only partially replace current piping to Europe, and so the region’s gas exports will decline.
  • 146.
    291 Regional transitions CHAPTER9 290 DNV Energy Transition Outlook 2022 PNZ – North East Eurasia Our pathway to net zero (PNZ) in North East Eurasia sees CO2 emissions declining from 2.3 Gt in 2021 to 0.4 Gt in 2050.Final energy demand will fall by 20% to 2030 and by 29% to 2050 as seen in Figure 9.6.7. Of the main demand sectors, transport energy demand will fall by a full 42%, reflecting the sector’s electrification and consequent energy efficiency improvements. Consequently, CO2 transport emissions are reduced by 65% from 2020 to 2050. This contrasts with the ETO forecast of the 'most likely' future, where a reduction of 2% was seen for the corresponding period. In 2050, oil use in the sector will have declined more than three quarters from current levels, and electricity account for more than half of vehicles’ energy use. CO2 emissions in the manufacturing sector reduce from 0.9 Gt in 2019 to 50 Mt by 2050. CO2 emissions in buildings decline from 0.7 Gt in 2020 to 0.1 Gt by 2050; in the ETO forecast the emissions were 0.9 Gt. In energy supply CO2 emissions decline from 1.1 Gt in 2020 to 0.1 Gt by 2050. Theenergymixwillbecomegreener.Electricityuse increases, more than doubling in share to 29% by mid-century to play an increasing role in all sectors. Moreover, new energy fuels, notably hydrogen, will emerge to claim a 5% energy share by mid-century. The main loser in this dynamic towards a net zero future will be methane as seen in Figure 9.6.7. Both coal and gas use will mostly be subject to CCS by mid-century. Except in post-combustion power facilities where CCS use will cover less than 10% of emissions, fossil fuels and processes will be subject to almost 100% capture rates. The electricity PNZ mix will similarly be greening. From the current position where gas and coal dominate power production (about 40% and 20% share respectively), the mid-century’s mix will see a similar dominance of solar and wind power, after coal is forced out from 2045. Gas generation will almost equal today’s in absolute terms in 2050, yet because generation more than doubles, gas will represent less than 15% of genera- tion in 2050. By then, hydropower has seen its generation more than tripling from today’s level, to become bigger than that of gas. Energy-related CO2 emissions will fall by 84% from 2020 to 2050,but still be significant at 0.4 Gt then.Manufacturing emissions will decline strongly, as they are subject to CCS, while the use of gas in buildings, thoughdeclining, will still be present in 2050 andof course cannot be subject toCCS.Buildings'emissionswillbe36%andmanufacturing emissions 30%ofthe mid-century total. CO2 price — The rise in average regional carbon prices to USD 30/tCO2 in 2030 and USD 100/tCO2 is reflected as higher prices for fossil fuels. Transport − Despite its vast domestic hydrocarbon resources, and lower fuel prices, the sale of new ICE vehicles is banned from 2045 for passenger vehicles and 2050 for commercial vehicles. Concurrently, the tax on oil price for transport is 200% in 2050, albeit from a low base. Buildings − A partial ban of 25% on all fossil-fuel equipment in buildings is implemented by 2050, and the lifetime of new fossil-fuel equipment is halved (from 15 to 7.5 years). These two policy levers contribute to the reduction in emissions by enabling faster phase-out of fossil fuel infrastructure. Similarly, through biomass coupled with CCS, NEE also achieves negative emissions from direct heat for its buildings. Manufacturing − The cost of capital of oil and gas equipment in the manufacturing sector increases from 8% in 2022 to 11% in 2050, and the cost of capital of coal equipment increases to 20%. Simultaneously, investment support of 4% is given to electric heat production. This considerably reduces the attractiveness of fossil-fuel equipment, enabling the faster phase-out. Energy supply — New oil and gas exploration and development are banned in 2028. In addition, electricity is subsidized for hydrogen production, as capacity investment support of 10% is given for dedicated renew- able hydrogen production. This occurs simultaneously with growth in the share of electricity in final energy, rising from 13% in 2020 to 18% in 2050 (Figure 9.6.8). Fossil fuel power capacity are scrapped at age 25, before their normal – 40-year technical lifetimes, thus enabling a faster uptake of VRES in power generation. PNZ – Policy levers New energy fuels, notably hydrogen, will emerge to claim a 5% energy share by mid-century.
  • 147.
    292 DNV Energy TransitionOutlook 2022 293 Regional transitions CHAPTER 9 China’s Action Plan for CO2 peaking before 2030 aims to increase non-fossil energy consumption from around 17.3% of the mix now to 20% by 2025 and 25% by 2030. Other goals are to decrease carbon-emission intensity (tCO2 per unit GDP) by more than 65% from its level in 2005; for renewables to be generating at least 35% of power compared with about 29.8% now; to achieve peak carbon by 2030; and to prepare for carbon neutrality by 2060 (NEA, 2022). China is the largest investor in renewable energy. By 2021, its wind capacity was 328 GW, and solar PV 306 GW. The total installed capacity of offshore wind power has reached 26 GW, ranking first in the world. The rapid growth of distributed PV led to it becoming, for the first time, more than half (55%) of China’s new solar PV capacity (NEA, 2022) In 2021, China overtook Japan as the largest importer of LNG (IHS Markit, 2022), and new LNG terminals, natural gas pipelines and storage build-out are accelerating coal-to-gas switching. A significant wave of new infrastructure development is expected in China to boost domestic economic resilience to global market dynamics. It features new-generation infrastructure such as new energy, charging networks, UHV networks, smart cities, and IT-related investments. Sales of new EVs numbered around 3.2mn in China in 2021, 50% of the world total (Canalys, 2022). China’s carbon-emissions trading scheme (ETS) successfully completed its first performance period in 2021, with an average trading price less than USD 7/ tCO2 . Following the power sector, covering around 40% of GHG emissions, the scheme will expand to the other seven high-emission industries, along with the potential re-launch of Chinese Certified Emission Reduction (CCER), within the 14th Five-Year Plan Period (2021–2025). Characteristics and current position Pointers to the future 9.7 GREATER CHINA (CHN) This region consists of Mainland China, Hong Kong, Macau, and Taiwan − China’s decarbonization journey is a careful balancing act. In the short term to ensure energy supplies, China will maintain its oil production and slightly increase coal and natural gas output. But it will strive to limit coal consumption, promote cleaner ways of using it , halt the export of coal-fired power-generation technology and equipment,andphase down coal use in the longer term. − Provincial subsidies will continue, after national subsidies end, to promote renewables development towards the target of combined wind/solar capacity above 1.2 TW by 2030 (NEA, 2021). − China targets 10% of final energy consumption from hydrogen by 2050 (5% by 2030). By 2035, China aims for comprehensive hydrogen energy industry formation (NDRC NEA, 2021) − CCS adoption on a large scale is expected after 2030 when a rising carbon price makes it economic. Nuclear power will continue to be developed steadily, with the operating installed capacity planned to rise from 53 GW in 2021 to 70 GW by 2025 (14th FYP, 2021). − In shipbuilding, various decarbonization pathways and abatement technologies are under early development, including onboard CCS and alternative ship fuels — e.g. ammonia, battery, hydrogen, and LNG. − ‘Made in China 2025’, promoting innovation in core sectors, will trigger industry electrification and upgrades in processing technology. The use of green power, energy efficiency and low-carbon technologies such as heat pumps, with the aid of digitalization, will reduce energy intensity in transportation, manu- facturing, and buildings. − Strengthening green technology cooperation and investment will be the focus of China and other countries to jointly build clean-energy-related international infrastructure under the Belt and Road initiative. International cooperation on carbon trading markets and carbon-border adjustment mechanisms is also key for China’s climate change mitigation ambitions. Population (BN) GDP/person (USD) GDP* (USD TRN) Energy-related emissions/person (T) Energy-related emissions (GT) 2020 2050 Energy use/person (GJ) Energy use (EJ) 1.45 21 600 31.3 6.8 9.9 105 152 1.33 49 300 65.3 2.1 2.9 93 124 *All GDP Figures in the report are based on 2011 purchasing power parity and in 2017 international USD
  • 148.
    294 DNV Energy TransitionOutlook 2022 295 Regional transitions CHAPTER 9 9.7 GREATER CHINA Energy transition: a delicate balancing act The population boom in China from 1950 to 2000 has been followed by an economic boom that is slowing but continuing. China today has 19% of world population and 23% of global GDP. Energy use, closely correlated with both population and economic growth, has soared — China now accounts for 26% of global primary energy use. It is more like a continent than a country, and comparisons like China being the world’s biggest producer or consumer of something are therefore of less relevance than when making many other country-vs-country comparisons. What is important is that China is responsible for 28% of global energy-related CO2 emissions; so, developments there are crucial to whether the world will meet its emissions and climate targets. The central government of China is very strong and sets a direction that the country is largely following. The stability of the government also makes for more uniform developments than in many countries where there are constant changes of leadership, and the region is hence more predictable from a forecasting perspective. Still, even Chinese long-term planning has limitations; one good example is the current demographic shift that looks to be resulting in a much faster population and workforce reduction than foreseen in Chinese government plans. China’s primary energy demand has nearly tripled over the last two decades, as illustrated in Figure 9.7.1. The strong increase first and foremost came from coal, its 59%shareofprimaryenergyuseinChinaalsorepresenting 57% of global coal use. Since 2013, China’s energy use has also started to diversify into almost all other energy sources, with strong growth currently in natural gas, hydropower, nuclear, solar PV and wind, and relatively stable use of coal and oil forecast through the coming decade. The forecast energy supply and demand trends in the coming decades are closely linked to the demographic and economic developments of the region, and are also strongly influenced by government energy and environ- mental policy. China’s population will most likely peak in 2021 or 2022 (Business Standard, 2022a), and is expected to be about 120mn less in 2050 than today. The reduction in workforce is even greater, and this influences productivity and economic growth. With a smaller workforce, salaries are likely to grow more than in neighbouring countries. Even with increased automation, a significant share of China’s manufacturing will move to countries with cheaper production. A strong domestic market and a focus on ‘Made in China’ protecting domestic manufacturers may counter some of these trends. Average annual economic growth has been more than 8% for 30 years. We expect it to slow significantly, with an average growth of 2.3% for the next 30 years due to population reduction and demographic shifts, and to China becoming a more mature economy, with less productivity gains in industry. Over time, its long-term economic growth rate will more closely resemble that of other medium and high-income countries. The expected GDP per person of USD 49,000 in 2050 is less than 20% behind forecast levels for Europe and OECD Pacific. Energy demand The demographic shift and economic growth influences not only manufacturing, but also transport and buildings. Passenger vehicle density will grow significantly, probably peaking in the late 2030s about 90% greater than today. However, a high level of urbanization and extensive build-out of public transport will mean vehicle density remains lower than in OECD countries. In the 2040s, a reduction in population alongside greater automation and car sharing will reduce vehicle numbers. Aviation is likely to triple through to 2050 as an increasing number of Chinese become middle class, including many pensioners that would like to travel. The urbanization rate in China is growing rapidly; today, almost two thirds of the Chinese population live in cities. Most of them also live in new high-rise buildings, a situation very different from urbanization in North America, for example. Small family sizes and an increased standard of living will by 2050 see building stock in China grow34%forresidentialbuildingsand190%forcommercial buildings. Strong focus on energy efficiency will limit growth in buildings’ energy use, which is relatively stable from 2030 onwards. While energy needs for heating, water heating, and cooking will be relatively stable, energy needs for cooling increase more than sixfold over the next 20 years, and by 2050 represent one third of Chinese buildings’ energy use. Overall final energy use will grow 12% from today to peak in 2032 at 122 EJ, and will then decline 19% by 2050, as shown in Figure 9.7.2. A rapid demographic shift aids this reduction, which is otherwise mainly driven by the rate of energy-efficiency gains being greater than that of economic growth. By 2050, manufacturing will still be the largest sector of energy demand with a 43% share in the total, down from 51% today, while buildings’ share will grow from 19% to 24%. Transport’s share will initially grow from16%to19%by2026,andthendeclineaselectrification of road transport scales from the late 2020s. While the energy consumption is to a large extent influenced by demographics and economics, Chinese policy is the most important factor influencing the energy mix. Technology and cost development also play a major role in the transition from a fossil to a renewable energy system, but energy and climate policy are interwoven in every change. Energy and climate policies are also linked
  • 149.
    296 DNV Energy TransitionOutlook 2022 297 Regional transitions CHAPTER 9 to all other priorities of the government, including economic growth, geopolitics and national security, national and social stability, and energy security. As China uses more than half of the world’s coal, and emits 28% of energy-related CO2 , there is pressure from other countries for its emissions to reduce faster. From the Chinese authorities’ point of view, the balance of these priorities, however, must find its way among all the other priorities in the country, and as for all other countries, sometimes the forces pull in the same direction, and sometimes they are opposing forces. The Chinese government’s stability enables priority-based long-term planning to a greater extent than in other regions. However, geopolitical, economic and technology trends that China’s government is unable to foresee will always influence and alter the long-term plans. China’s most pronounced climate policy is its commitment for emissions to peak before 2030, and to reach climate neutrality in 2060. On the 2030 goal, there is an array of supporting targets, goals, and measures, both in the present 14th FYP to 2025 and in specific 2030 targets. We describe some of this earlier in this section on Greater China. On the 2060 goals, there are very few supporting measures yet. Although not explicitly stated in official documents, recent information from China's special envoy for climate change, Xie Zhenhua, says that 2060 carbon neutrality includes all types of GHGs, is a very important specification (Ecology China Network, 2021). Electricity Electrification is the key means to reduce emissions because it is effective and relatively easily decarbonized. As illustrated in Figure 9.7.3, electricity currently meets 24% of final energy demand in China. We forecast this will nearly double to 46% in 2050, which would be the highest share among all the Outlook’s regions. Electricity use will grow in all main demand sectors — buildings, manu- facturing, and transport. Extensive programmes are underway in all these sectors to speed up this transition. The most visible impact of electrification is in road transport. China dominates global EV production, for which it had a 44% share in 2021. It is also a leader in domestic EV uptake, though the typical Chinese EV has a much smaller battery size on average than European and US counterparts. The majority of batteries for EVs produced outside China are also Chinese, illustrating that for China, EVs are not just a consideration within energy and climate policies. It is also industrial policy to enter the global market for vehicles, which Europe, Japan and the US have dominated for decades. DNV expects uptake of EVs in China to be the fastest among all regions, with half the new passenger vehicles sold in China being battery- electric vehicles (BEVs) by 2026 and half the fleet of entire vehicles being BEVs by 2035. The country is also leading the transition to EVs for commercial vehicles and two and three-wheelers. China also has goals on hydrogen-powered passenger and commercial vehicles. As detailed in Chapter 1 of our Outlook, our modelling currently indicates that hydrogen vehicles are unable to compete for passenger vehicles. We therefore consider it unlikely that China will continue to push for this long term and believe that hydrogen vehicles’ share of this market will remain negligible. Hydrogen is likely to play a modest role in the commercial vehicles segment, but here too we forecast uptake lower than China’s ambitions. Another advantage of electricity is that it will be produced domestically. Hence, just like coal, but not oil and gas, advancing electricity use is positive for energy security in China. The electricity mix is explained in further detail below. Direct use of coal represents one third of Chinese energy demand today, but will roughly halve to cover 15% of demand in 2050. One significant driver of this reduction will be coal use in manufacturing declining by half as heavy industries like iron, steel, and cement production both decline in size and change production methods. The reduction of coal use in electricity generation will be even greater, as described below. Oil’s share of the energy mix will reduce from 25% to 15% as road transport (the biggest user of oil products) electrifies. Non-energy use of oil ultimately reduces in the 2040s; but from 2042, oil use in feedstock (e.g. for chemicals and fertilizer production) will overtake oil use in transport as the largest user of oil. Coal-to-gas switching is a prominent policy in China for buildings and manufacturing. Direct use of gas grows over the next decade before starting to decline from the mid-2030s as hydrogen, for example, begins to replace it. As coal is a domestic energy source and natural gas is mostly imported, geopolitical developments over the past year might slow down governmental focus on coal-to-gas switching, which is more about local air quality than emissions and cost. Hydrogen is negligible as an energy carrier today, but from the 2030s will start to replace some coal and gas use in manufacturing. In the 2040s, we will see uptake of ammonia in shipping and e-fuels in aviation. In total, hydrogen and its derivatives will have a 6% share in 2050. ProductioninChinawillbepredominantlygreenhydrogen produced via electrolysis powered from dedicated renewables. There will also be a large shift in how hydrogen is produced for use as industrial feedstock, from coal gasification today to green hydrogen from electrolysers in the future. China’s annual electricity production will almost double from 8.4 PWh to reach 15.4 PWh 2050. As illustrated in Figure 9.7.4, coal’s share of the mix has already reduced from 75% a decade ago to 62% today, and will further decline to 40% in 2030 and only 4% in 2050. Gas main- tains a minor share in 2050, and oil is negligible by then, meaning that only 5% of China’s electricity will be gene- rated from fossil fuels in mid-century. Nuclear in China is interesting, presently at 5% of the electricity mix. China is building almost as much nuclear generating capacity as the rest of the world combined. Over the next decades, China’s nuclear capacity and production will almost double, keeping its share of the electricity mix. China’s nuclear production of 660 TWh in 2050 will be bigger than in North America. It is building nuclear power stations at much lower cost than OECD countries, and nuclear is part of its industrial policy, with a focus on exporting the technology. In spite of this, nuclear will remain a modest energy source in China too. The huge growth will come in renewables, as included in climate, energy and industrial policies. China already dominates global solar PV production and uptake and has recently assumed the same role in wind. The share of gridded wind-generated electricity in China is 8% in 2022 and will grow to 15% in 2030 and 39% in 2050. Solar PV has presently an even higher growth rate, with 5% in 2022, 17% in 2030, and will be at 38% in 2050.
  • 150.
    298 DNV Energy TransitionOutlook 2022 299 Regional transitions CHAPTER 9 The 2025 targets for renewable installations in the 14th FYP are likely to be exceeded for both wind and solar. Including both on-grid and off-grid, we expect 1.8 TW of solar PV by 2030. The fast growth continues, reaching 5 TW in 2050. For wind, we expect 0.9 TW installed by 2030 of which 120 GW is fixed offshore and 2 GW floating offshore. The growth will continue; we expect 2.8 TW onshore by mid-century, 580 GW of it fixed offshore and 100 GW floating offshore. Hydropower is also large in China, producing 1.3 PWh today, a Figure that will grow 60% over the next decade and thereafter stabilize. With a share of about 15% of the total electricity mix, this dispatchable renewable energy source is crucial to balance the variable renewable production from solar PV and wind. Peak coal Peak coal in China, both in direct use and in electricity, is worth a detailed look. In April 2021, President Xi announced that China will reach peak coal by 2025. As China’s coal use represented more than 22% of global CO2 emissions in 2019, this has real implications for the world reaching its Paris Agree- ment ambitions. China’s coal use increased steeply until 2013, and has since hovered around that level, and the developments also for 2022 are still uncertain. By 2025, however, we expect that coal use is on a steady decline, achieving the peak 2025 announcement. The power generation and manufacturing sectors are the major coal consumers in China. According to our Outlook (Figure 9.7.5), coal consumption in both will decline from 2022 onwards. In China’s manufacturing sector rapid electrification will result in coal demand in the sector rapidly reducing, from 27 EJ in 2020 to 13 EJ in 2050. As described above, in electricity, the coal share will reduce from 62% today to 4% in 2050. In 2044, manufacturing will overtake the power sector as the largest consumer of coal in China. Coal use in buildings, which is relatively small, will fall in the coming years and will be largely replaced by natural gas. Last year, China also announced it will stop financing and supporting technology for coal plants overseas. This is an important step that increases costs of new coal-fired generation in other regions and helps the transition to cleaner technologies. If Chinese coal use follows the path in our forecast, the resulting emissions will fall from 7.4 GtCO2 today to 1.7 GtCO2 in 2050, making a crucial contribution to reducing global emissions, but will still be too high for the world to reach net zero. The carbon intensity of Chinese energy use, measured as gCO2 /MJ, reduces from 65 to 23 over the coming three decadesandisfirstandforemostcoupledtothereduction in Chinese coal consumption. Energy Efficiency Energy efficiency is another key lever for the relatively fast energy transition in China. Urbanization and general technology improvement both contribute to the shift. However, the doubling of electricity’s share in the energy mix is by far the biggest contributor, and even more important when the electricity also becomes renewable. The efficiency improvements come in all sectors, as all electrify, but there are many other initiatives to improve energy efficiency. Energy intensity, measured as MJ of primary energy per unit of GDP, is a key metric being focused on in Chinese policymaking. We find that the present energy intensity of 4.9 MJ/USD will reduce to 3.3 MJ/USD in 2030 and 1.9 MJ/USD in 2050. The annual reduction rates will fall from around 4% per year today towards around 2% per year towards 2050, as shown in five-year intervals in Figure 9.7.6. The main reason for the slowdown is that the electrification growth rate — in road transport, for example — will slow down, though the overall electrification rate still rises. Figure 9.7.6 also explains the trends in primary energy shown in Figure 9.7.1, showing an interesting transition in a country that has strong energy-efficiency growth, declining GDP/capita growth, and declining population. Energy security Energy security is a high priority for China. Coal is predominantly domestically supplied today, but 45% of natural gas and 74% of oil is imported. The non-fossil energy — nuclear, bioenergy, and renewables — is also developed mainly domestically with little foreign resources except some minerals and metals needed for making wind turbines and solar panels. We do not expect any dramatic change in this picture within the forecast period. There are ample coal supplies domestically, but it will not be possible for China to increase oil and gas production to levels at which the country is self-supplied. In our results, the share of imported natural gas stays roughly the same as now, while the share of imported oil grows. China is constantly positioning itself towards the large oil and gas exporting nations in the Middle East to have supplies available. Recent Western sanctions against Russia following the war in Ukraine has given China an opportunity to further strengthen energy cooperation with Russia. Russian oil and gas not being sold to Europe is available for China, including through new pipelines that will be constructed to cement a long-term import. Nevertheless, China’s long-term aim is to be energy independent. The switch to renewables will over the coming decades make China less and less reliant on imported energy from any other country, though full energy independence is not achieved in our forecast period.
  • 151.
    300 DNV Energy TransitionOutlook 2022 301 Regional transitions CHAPTER 9 Emissions 28% of global energy-related CO2 emissions come from Greater China, a share that increased steadily to 2013 and has been relatively stable since. This level is expected to persist through the 2020s, after which China’s emissions will fall much more rapidly than the global average, China accounting for 24% of global emissions in 2040 and 16% in 2050. In absolute terms, China’s emissions, shown below in Figure 9.7.7, are the biggest in the world, at around 10.4 GtCO2 of energy-related emission in 2021, a new record high. They are currently dominated by those from manufacturing, a 55% share in total Chinese emissions that will be maintained through to 2050, albeit with strongly reducing absolute levels. The 16% and 13% shares of buildings and transport, respectively, will also remain relatively unchanged through to 2050, demon- strating that all sectors will reduce emissions at about the same pace. The energy carrier that reduces its share of emissions fastest, and which impacts emissions from all the demand sectors above, is electricity. It will be nearly fully decar- bonized by mid-century, as shown in Figure 9.7.4. Coal emissions dominate today, accounting for 76% of the total, a share that will reduce to 60% by 2050. We forecast that 320 MtCO2 per year will be captured by CCS in Greater China in 2050, the highest absolute level among all regions. However, the 10% share of Greater China emissions that this represents is still much lower than the equivalent percentages for CO2 capture in all the three OECD regions. Figure 9.7.8 shows that the ramp-up of CCS will be steep in the 2040s, with 2040 capture levels being only a fifth of those in 2050. CCS will be largest in manufacturing and from process emissions, around 140 MtCO2 per year in each, while capture from power generation will dominate in 2040, slowly reducing towards 2050 as the power industry largely phases out fossil fuel. Our projection for China’s average carbon-price level is USD 22/tCO2 in 2030 followed by rapid growth, especially in the 2040s, to USD 90/tCO2 by 2050, a level exceeded only by Europe and on a par with the OECD Pacific. The upward pricing trend is underpinned by inclusion of more sectors and expanding coverage in China’s national emissions trading scheme (see Section 6.4). Comparing the DNV forecast with official Chinese goals and other Chinese forecasts — from CNPC, for example — we find that the main goal of peaking CO2 emissions before 2030 is easily met unless we see a high level of Chinese AFOLU emissions, which is not likely. Regarding the Chinese target to reduce carbon intensity by 65% from 2005 levels by 2030, our Outlook suggests a reduction of 66% by then, indicating that this target will also be achieved. China’s high-level goal of carbon neutrality by 2060 cannot be read from our forecast, which stops in 2050. The direction in 2050 is clear, but the present trajectory makes it unlikely that full carbon neutrality will be achieved in 2060. However, emissions in 2060 will be small, most likely less than 90% of their present level, i.e. less than 1 GtCO2 of energy-related emissions.
  • 152.
    303 Regional transitions CHAPTER9 302 DNV Energy Transition Outlook 2022 PNZ – Greater China Our pathway to net zero (PNZ) for Greater China sees CO2 emissions reduce from 10.2 Gt in 2021 to 0 Gt in 2050, one decade before the Chinese long-term ambitions (which admittingly is for all GHG and not CO2 only). CCS of 1.3Gt and DAC of 0.2 Gt in 2050 are removing in total 1.5Gt of emissions, which equals the remaining emissions from fossil fuels, making the total in 2050 being zero. As shown in figure 9.7.9, primary energy use in 2050 is only slightly lower than in the main forecast (121 vs 125 EJ), but the energy mix is dramatically different, with a much more rapid reduction in all fossil fuels. Solar and wind will be at 30 and 31% of the primary energy mix in 2050, respectively, and absolute wind and solar energy production 50% higher than in our main forecast. To achieve the ambitious 2050 figures, changes towards 2030 also need to be significant. We need to see a decline in Chinese coal use of more than 20% in the coming decade, and a more than 10% decrease in oil use in the same period, and solar, wind and bioenergy having a correspondingly much faster growth. As shown in figure 9.7.10, emission reduction will be 20% by 2030 and 70% by 2040. Electricity and hydrogen use grow fast to reach 50% and 13%, respectively, of final energy demand in 2050. CO2 price — The rise in average regional carbon prices to USD 100/tCO2 in 2030 and USD 200/tCO2 is reflected as costs for fossil fuels. Transport — China institutes a ban on the sale of ICE passenger and commercial vehicles from 2035, while subsidizing the electricity price for EV charging by 20% from 2022. Buildings — A partial ban of 50% on all new fossil-fuel equipment in buildings is implemented by 2050, while the lifetime of new fossil-fuel equipment is halved (from 15 to 7.5 years), contributing to faster phase-out of fossil fuel infrastructure. Manufacturing — To reduce attractiveness and speed up phase-out of fossil equipment, the cost of capital of oil and gas equipment increases from 8% in 2022 to 17% in 2050, and to 20% for coal equipment. Investment support of 20% is given to electric heat production. Energy supply — Enforced shorter lifetime for all fossil- fuel power. New oil and gas capacity additions are banned from 2028. Grid electricity is subsidized for hydrogen production, and capacity investment support of 10% is given for dedicated renewable hydrogen production. PNZ – Policy levers
  • 153.
    304 DNV Energy TransitionOutlook 2022 305 Regional transitions CHAPTER 9 Characteristics and current position Pointers to the future 9.8 INDIAN SUBCONTINENT (IND) This region consists of India, Pakistan, Afghanistan, Bangladesh, Sri Lanka, Nepal, Bhutan, and the Maldives Population (BN) GDP/person (USD) GDP* (USD TRN) Energy-related emissions/person (T) Energy-related emissions (GT) 2020 2050 Energy use/person (GJ) Energy use (EJ) 1.84 6 450 11.9 1.4 2.5 25 46 2.28 21 200 48.3 2.0 3.5 43 97 Economic and population growth in the Indian Sub- continent are driving up energy demand. Energy security, cheaper renewables and tackling air pollution are prime motivations for the transition, and policies supporting low-carbon energy developments are common. Pakistan, Bangladesh, and India are among the countries with the worst air pollution globally; in India, air pollution is back at pre-COVID lockdown levels (IQAir, 2022). More than 75% of electricity is fossil-derived, and India’s energy choices will largely determine the region’s transition pace. India has warned that high energy costs could threaten emissions targets (Reuters, 2022), but it remains committed to a renewable energy expansion. Renewables capacity additions have outstripped growth in coal-based power in the last five years. With over 10 GW of solar installation in 2021, India is ranked fifth globally in solar power deployment and has one of the cheapest solar tariffs. Government programmes promoting access to electricity and clean cooking have made significant progress. Fossil fuels and imports dominate the energy mixes of Bangladesh, Pakistan, and Sri Lanka. While thermal generation is complemented by hydropower, production is affected by climate change impacts. Governance and security issues have deterred private investments. Financial assistance and investments in renewables are part of India’s ‘Neighbourhood First’ policy to alleviate Sri Lanka’s fuel and economic crisis (NewsFirst, 2022) Nepal and Bhutan are hydropower rich but reliant on imported fossil fuels for their other energy requirements. In Afghanistan, less than 50% of the population has access to electricity; the country is largely dependent on hydropower and power imports. Maldives is heavily dependent on imported fossil fuels and approximately half of the fuel imports are used for electricity generation. − Record capacity additions ( 15 GW non-hydro renewables) in 2022 puts India on track for 111 GW (April 2022), falling short of the 175 GW targeted. A 500 GW non-fossil capacity target by 2030, with more than 400 GW wind and solar, will depend on an incentivized manufacturing scale up in advanced cell batteries and solar panels, and how quickly these become competitive globally. − India’s 2070 net zero ambition (COP26) brings added focus on energy efficiency, offshore wind, and green hydrogen. Its National Hydrogen Mission will be supported by the Green Hydrogen Policy and associ- ated demand and supply measures framed in 2022. − India will discourage greenfield coal-power projects but will use existing capacity for base load, although 81 old and expensive plants will run at reduced capacity to accommodate cheaper renewables. Major reforms, including a real-time electricity market and future fixed-minimum percentages for renewables and green hydrogen, will assist the transition. National initiatives are in place for e-mobility and battery storage, along with a programme aiming to reduce airborne particulate matter by 20-30% by 2024, with supporting initiatives on transport fuels, and some limits on coal-plant emissions. − Bangladesh plans for 40% renewable electricity in 2041, aiming for 4,100 MW renewable capacity by 2030 with solar accounting for more than half. The government cancelled 10 coal-fired plants and a reset of gas expansion plans is expected given the volatile LNG market. − Pakistan’s super-floods epitomize consequences of climate disaster. Its focus will shift from coal to renewables and hydropower where Pakistan aims for 30% renewable electricity by 2030. Sri Lanka’s current financial crisis is similarly emphasizing transition with the government targeting 70% electricity from renewables by 2030 from current 20%. *All GDP Figures in the report are based on 2011 purchasing power parity and in 2017 international USD
  • 154.
    306 DNV Energy TransitionOutlook 2022 307 Regional transitions CHAPTER 9 9.8 INDIAN SUBCONTINENT Energy transition: feeling the heat The Indian Subcontinent experienced sweltering heat in April, some places in India and Pakistan reaching 50°C. To tackle and survive the heat, huge swathes of the population consumed electricity in the form of cooling fans or air-conditioning units, which led to record demand for power across the region. India, the biggest economy in the region, transported massive amounts of coal from domestic mines to power stations via trains, to ramp up power production, thus also disrupting passenger rail services (New York Times, 2018 2022). This is just one example of the pernicious effect of fossil-fuel use and its feedback effects coming full circle for this region. In fact, the subcontinent is on the frontline of extreme-weather events and slowly rising sea levels. In the past decade, Afghanistan, Bangladesh, India and Pakistan have all ranked among the top-10 countries most affected by extreme-weather events on the Global Climate Risk Index (Germanwatch, 2021). Power sector transition Despite living the real-world consequences of a warming world caused by a carbon-based energy system, the region is slow to change. We forecast that in 2030, 51% of electricity generated in the region will be from coal power plants (Figure 9.8.1). Our Outlook foresees 1.2 GW of coal power plants being installed as late as 2040, implying that coal is going to be locked into the power grid. Primary energy consumption and delayed shift to renewables The region continues using coal well into the 2040s, as seen in Figure 9.8.2. Even in 2050, 22% of primary energy consumption will be coal. The majority of this coal will continue to be used in power plants and the manu- facturing sector. In fact, our forecast indicates that 53% of primary energy will come from coal, oil and natural gas in 2050. Not only is this higher than the global average, in terms of the 49% share of fossil fuels in primary energy, the region even now is a net importer of all three: coal, oil and natural gas. This has huge implications for energy expenditure, along with a drain on its revenue. Further- more, such dependence on imported fossil fuels is detrimental to the region’s energy security and leaves its economies vulnerable to the vagaries of market shocks and upheavals. Until 2040, the role of solar and wind in the primary energy mix will be very limited. In 2030, the combined share of both solar and wind is less than 5%, which is expected to grow to 12% in 2040 and 24% in 2050. We foresee this trend being reflected in their share in electricity genera- tion. We expect solar and wind to generate an increasing amount of electricity starting from the 2030s, and that by 2050, their combined share in total electricity generation will be 67%. We forecast that 1.4 TW of new solar and wind capacity will be added in the region from 2030 to 2040, followed by an additional 2 TW between 2040 and 2050. Final energy demand Such enormous amounts of solar and wind are needed, along with maintaining coal and gas generation, because of the region’s burgeoning demand for electricity, which grows five-fold from 1.6 PWh (51. EJ) in 2020 to 8.3 PWh (26 EJ) in 2050. Correspondingly, electricity’s share in final energy demand increases from 15% to 33%, as shown in Figure 9.8.3. All energy carriers except biomass see an absolute increase in demand between 2020 and mid-century, though electricity sees the most dramatic demand growth in both absolute and relative terms. The main contributors to this explosive electricity
  • 155.
    308 DNV Energy TransitionOutlook 2022 309 Regional transitions CHAPTER 9 demand growth are the manufacturing and buildings sectors. In 2020, electricity’s share in manufacturing energy demand was 19% and this increases to 27% by 2050. Most of the increase is for use in machines, motors and appliances. In buildings, electricity’s share increases from 17% to 48%, mostly in the transition away from traditional cooking appliances to electric cooking, higher penetration of appliances and lighting, and greater demand for space cooling. In buildings, electricity demand for space cooling increases eight-fold, albeit from a small level in 2020; quadruples for appliances and lighting; and, doubles for cooking — all between 2020 and 2050 (Figure 9.8.5). Off-grid solar PV generation also grows in the region, the majority of which is used in buildings (Figure 9.8.1). This sustained growth in electricity demand ensures huge investments in renewables for power, while coal and natural gas also persist in the region’s future power system. Rising electricity consumption in buildings The forecast electrification of buildings energy use has myriad impacts on the region. At a household level, we forecast that more and more households will have access to electric cooking stoves, appliances and lighting, along with space cooling in a fast-warming world which leads to households consuming more electricity. The fraction of households without access to modern cooking reduces from 30% in 2020 to less than 3% in 2050. This has a huge impact on the standard of living and respiratory health of the population, as less and less harmful solid fuels and kerosene are used for cooking. At the same time, this will also put upward pressure on household energy expendi- ture in the region. We foresee the effects of wider penetration of household electrical equipment in Figure 9.8.5. The electrification of household energy services also has the effect of increasing energy efficiency, especially for cooking. We forecast that less electric energy will be consumed to provide the same level of cooking than if using oil or traditional biomass for energy, even though the useful energy needed for cooking increases in the region. In addition, the Indian Subcontinent will continue to be a net importer of coal, oil and natural gas. Figure 9.8.6 presents the import-to-demand ratios of these three fossil fuels. While the ratios dip in 2020 due to COVID-19, both oil and natural gas have increasingly to be imported to satisfy domestic demand. In fact, we forecast that the region will be the biggest importer of natural gas in the world by 2040. Hence, despite the massive numbers for future solar and wind-based electricity generation, the persistence of coal (in power and manufacturing), oil (in transport) and natural gas (in power) in the energy system implies that the region will spend increasing amounts of money on fossil-fuel imports. Such high import levels will leave it vulnerable to supply and price shocks. For example, the Ukraine war has seen Europe willing to pay higher prices for LNG, leaving countries such as India and Pakistan having to pay even more to source that LNG or face supply disruptions detrimental to their development goals (Business Standard, 2022b). Tethered to fossil-sourced energy Furthermore, and as mentioned before, the large imports of critical energy needed for the region imply that it will have a large bill to source energy, as well as increasing household expenditure due to higher electricity consumption. Figure 9.8.7 presents the fossil-fuel import bill and household energy expenditure of the region from 2010 to 2050, indexed to the 2010 value. The fossil-fuel import bill consists of the expenditure to import coal, oil and natural gas for all energy purposes. The household energy expenditure consists of the costs for each household per year for both residential and passenger transport energy demand. The import bill is highly susceptible to price shocks, as can be observed in the sharp rise in 2022 corresponding to the Ukraine war and rising prices for natural gas, and to a lesser extent for coal and oil. Such disruptions to natural gas supply also tip the region towards more cheap coal, thus locking in coal infrastructure even further along the timeline. While the household expenditure is somewhat insulated from the same sharp rises as the import bill, we still forecast a rising trend for the region. This is because of the increasing consumption of energy due to higher demand of household energy services, and to increasing imports of natural gas and oil, with part of the expense for these being transferred to households. Despite the rising energy import expenditure, and its implications for energy security and the timetable for phasing out fossil fuels, it is not all doom and gloom. We do foresee a sharp increase in energy use per capita, rising from 25 GJ in 2020 to 34 GJ by 2030, and 43 GJ by 2050 (Figure 9.8.8). In 2020, this energy use per capita is split 30:70 in fossil-based energy’s favour. But from 2030,
  • 156.
    310 DNV Energy TransitionOutlook 2022 311 Regional transitions CHAPTER 9 there is a change in how much renewable energy and fossil-based energy use per capita is prevalent in the region. Until 2030, we forecast similar growth rates (28%) for both renewable and fossil-based energy use per capita. But from 2030 to 2050, there is a divergence, with renewables dominating per capita energy use growth. Overall, per capita use of renewable energy almost triples between 2020 and 2050 while the equivalent fossil-based measure grows 28%. Historically this region has had very low levels of energy use per capita, implying extreme energy deprivation for a large portion of the population, with a plethora of corresponding negative impacts on income, quality of life, lifespan, and economic growth. That this is improving, and with increasing contribution from renewables and electricity, is a very welcome development. This region's low levels of energy use per capita is improving, with increasing contribution from renewables. Emissions Historically,theIndianSubcontinenthas hadvery low emissions,despitehavinga highershare of fossil-fuel use in itsprimaryenergy.Thisismostlydueto its economic activitybeinglowerthantheotherregions,andto the low energyintensityofitseconomy.Incontrast,some other regions–e.g.NorthAmerica,EuropeandOECDPacific – havehad carbon-intensivegrowthtrajectories in the past. Despite being the most populous region in 2020, the Indian Subcontinent’s 2.5 Gt of energy-related CO2 emissions were less than those of either Greater China, North America, Europe, or Middle East and North Africa. We foresee the Indian Subcontinent’s emissions increasing to peak in 2039 at 4.1 GtCO2 per year (Figure 9.8.9). Worryingly, beyond that peak, we expect these emissions to decrease by only 15%, to 3.5 GtCO2 per year by 2050. We expect the region to overtake Greater China by 2047 to become the largest emitter of energy-related carbon dioxide. Unsurprisingly, given the persistence of coal in the Indian Subcontinent’s energy system, coal will remain the main contributor to energy-related emissions, followed by oil and natural gas. While tracking and forecasting a region’s absolute emissions is important to mitigate global warming, it does not always accurately represent the true picture on energy-related emissions, especially when it comes to CO2 emissions related to productivity and energy use. Figure 9.8.10 presents the changes in five key intensity indicators for the Indian Subcontinent: carbon intensity of energy; carbon intensity of the economy; carbon emis- sions per capita; energy intensity; and GDP per capita. The changes are indexed relative to the year 2010, thus eliminating the need to reconcile the units and scale of these indicators. As seen from the Figure, the region’s GDP per capita is increasing while its energy intensity is decreasing, implying a decoupling of energy from its economic growth over time. This is to be expected as the region’s economy matures and shifts towards a more service- based economy. Similarly, the carbon intensity of its economy is also decreasing. What is perhaps significant to note is that both its carbon emissions per capita and carbon intensity of energy increase in the short term. This indicates, as discussed previously, that the energy system is not decarbonizing fast enough. Rather, in the short term, the region is increasing its use of coal and natural gas. Given that, historically, the region has had very low per capita energy use, it is not surprising that we see increasing carbon emissions per capita because of increasing energy use per capita. We forecast that the carbon emissions per capita will peak in 2033 at 2 tonnes, six years before the peak for absolute emissions. This is not due to a slowdown in energy use per capita, but rather the larger slowdown in population growth in the region. In summary, better technology transfer and support to phase-out fossil fuels faster will have a positive impact on the emissions trajectory of the Indian Subcontinent. Mechanisms such as carbon prices will place downward pressure on energy-related emissions. Our projection for the regional average carbon-price level is USD 10/tCO2 in 2030 and USD 25/tCO2 in 2050. But there is currently no explicit carbon pricing in the region. Pakistan is considering carbon pricing and an announcement from India suggests a planned carbon-trading scheme (see Section 6.4). NDC pledges indicate that the region aims to limit growth in emissions to no more than 376% by 2030 relative to 1990. Our Outlook indicates energy-related emissions increasing by 482% over this period, which at first glance indicates that the region will not achieve its implied overall goal. Therew are some uncertainties in comparing our forecast with these pledges, as some major countries in the region also include non-energy- related CO2 emissions in their targets. India announced its net-zero carbon emissions target by 2070 at COP26 and has submitted an updated NDC in August 2022. The update includes a target to reduce carbon intensity of GDP by 45% between 2005 and 2030, similar to how China sets its reduction target. This commitment is not easily measured in our forecast since we predominantly focus on energy-related emissions, and because our model does not regionalize non- energy-related CO2 emissions. Our results suggest a reduction of 31% in carbon intensity by 2030 for the Indian Subcontinent.
  • 157.
    313 Regional transitions CHAPTER9 312 DNV Energy Transition Outlook 2022 PNZ – Indian Subcontinent The pathway to net zero (PNZ) for the Indian Subcontinent sees CO2 emissions reduce from 2.9 Gt in 2021 to 0.5 Gt in 2050 (Figure 9.8.11), driven by rapid penetration of renewables, such as solar and wind in primary energy. Overall energy demand in 2050 is also markedly lower (26%) in the pathway to net zero than in our ETO forecast — i.e. total final energy demand of 62 EJ instead of 78 EJ, as illustrated in Figure 9.8.12. Electricity and hydrogen use grow fast to reach 49% and 11%, respectively, of final energy demand in 2050 (Figure 9.8.12). Despite this rapid electrification substantial shares of natural gas (7%), coal (10%) and oil (11%) persist in the energy system in 2050. The Indian Subcontinent has the second largest CO2 emissions in 2050, behind Sub-Saharan Africa. Given its historically low emissions from the energy sector, it is vital that a PNZ helps the region phase out fossil fuels and avoid being locked-in to new fossil infrastructure. The role of CCS will be critical to achieving net zero in the Indian Subcontinent, where 0.4 Gt will be captured in 2040, rising to 1 Gt by 2050. The pathway to net zero for the Indian Subcontinent sees a rapid penetration of solar and wind, and electrification of all demand sectors. CO2 price – The rise in average regional carbon prices to USD 30/tCO2 in 2030 and USD 75/tCO2 is reflected as costs for fossil fuels. Transport — The region institutes a ban on the sale of ICE passenger and commercial vehicles from 2041 and 2047, respectively, while subsidizing the electricity price by 8% from 2022. Buildings — A partial ban of 25% on all new fossil-fuel equipment in buildings is implemented by 2050, while the lifetime of new fossil-fuel equipment is halved (from 15 to 7.5 years), contributing to faster phase-out of fossil fuel infrastructure and electrification of buildings. Manufacturing — To reduce attractiveness and speed up phase-out of fossil equipment, the cost of capital of oil and gas equipment increases from 8% in 2022 to 17% in 2050, and to 20% for coal equipment. Investment support of 3% is given to electric and hydrogen-based heat production. Energy supply — Shortened lifetime for all new fossil-fuel power capacity additions. New oil and gas capacity developments are banned from 2028. Grid electricity is subsidized for hydrogen production, and capacity investment support of 7.5% is given for dedicated renewable hydrogen production PNZ – Policy levers
  • 158.
    314 DNV Energy TransitionOutlook 2022 315 Regional transitions CHAPTER 9 Indonesia, the Philippines, and Thailand are the largest economies in the region, and Singapore has the highest GDP per person. In the current energy system, hydro- carbons dominate the primary energy mix (81%); oil for transport, coal and gas for electricity. To fuel growth in economies, state-owned coal-fired power has been the preferred option. An expanding urban middle class is the main driver of electricity demand in residential and service sectors, and a flourishing manufac- turing sector pushes up industrial energy demand. At COP26, Indonesia, Philippines, and Vietnam signed a pledge to stop using coal over the 2040s. Vietnam promises no new coal after 2035, the Philippines banned new coal in 2020, and Indonesia’s government directs state-owned utility (PLN) to retire three plants by 2030 and phase-out by 2055. But the region accounts for almost the entire global pipeline of new coal power plants, with support from governments, hence a coal fleet is set to operate in years to come. Energy access (population, geographic coverage, stability of power provision) remains a priority, wherefore energy transition policy focuses on expanding power from renewables, and once high shares are reached, green hydrogen production is envisioned (Nakano, 2022). Renewable power targets are common, and recently, renewables have had a greater role in power develop- ments, representing about 82% of 22 GW of new capacity in 2020 (ASEAN, 2021). Of the ASEAN members, Vietnam has the highest renewable invest- ments and the fastest growth in wind and solar, with 4 GW and 16.6 GW respectively, installed in the last couple of years, motivated by declining hydrocarbon sources. In 2022, the Philippines’ Green Energy Auction programme allocated 2 GW renewable capacity, with solar getting the largest share at 1.5 GW. There are net zero goals in the region: Laos, Malaysia, Vietnam for 2050, Indonesia for 2060, Thailand for 2065. − CCSandlow-carbonhydrogenwillbehamperedbylack of carbon pricing. Indonesia has plans for CC(U)S in tandem with the development of gas fields, yet its Carbon Pricing Roadmap has been delayed, wherefore otherincentives/internationalsupportwouldberequired. − The Asian Development Bank has chosen Indonesia, the Philippines, and Vietnam for its Energy Transition Mechanism(ETM)pilot.Itaimstosetupfundspurchasing and accelerating coal-plant retirement. It is this type of scheme that will decide the realism of phase-out pledges by helping governments financially if they are to shed coal assets. ETM is not reflected in this year’s forecast but will be monitored for future Outlooks. − Renewable power will do the heavy lifting in region decarbonization. ASEAN member states are targeting the following goals for 2025: 23% renewables in primary energy supply (~17% in 2019); 30% lower energy intensity than in 2005; 35% renewables in installed power capacity (~29% in 2019). The power goal looks achievable. We project 21.5%, a 27% reduction and 41%, respectively. − Hydropower, solar and wind will grow massively. Also, offshore wind, e.g. Vietnam and the Philippines having technical potential of 475 GW and 178 GW (ESMAP, 2019), will start to be realized from the mid-2030s. Across the region, grid infrastructure and fragmented electricity networks will need handling to accommo- date renewables. − Singapore’s goal of 4 GW low-carbon electricity imports by 2035 for 30% of its power (EMA, 2021) will drive power interconnections, the first multilateral power trade and import (hydropower from Laos via Thailand and Malaysia) happening this year. Singapore will also front-run hydrogen use with imports from Australia, Chile and New Zealand. − Sustainable finance will expand aided by the ASEAN Taxonomy under development. Carbon-border adjustments and net-zero ambitions among conglom- erates will pressure decarbonization efforts, the region being at the start of many supply chains. Characteristics and current position Pointers to the future 9.9 SOUTH EAST ASIA (SEA) This region stretches from Myanmar to Papua New Guinea, and includes the Pacific Ocean States Population (MN) GDP/person (USD) GDP* (USD TRN) Energy-related emissions/person (T) Energy-related emissions (GT) 2020 2050 Energy use/person (GJ) Energy use (EJ) 676 12 800 8.7 2.3 1.5 44 30 778 32 300 25.2 2.4 1.5 65 50 *All GDP Figures in the report are based on 2011 purchasing power parity and in 2017 international USD
  • 159.
    316 DNV Energy TransitionOutlook 2022 317 Regional transitions CHAPTER 9 9.9 SOUTH EAST ASIA Energy transition: Light at the end of the fossil tunnel On paper, South East Asia is a paradise for renewables- based energy transition; in reality, that transition has not materialized (Weatherby, 2020). Despite good technical potential for solar and wind (NREL, 2020), the region has struggled with the build-out of renewables. The region is rich in coal and natural gas and has found it difficult to wean itself off dependence on these fuels both for energy and power generation. Additionally, South East Asia is the greatest exporter of coal, 400 Mt of it in 2020, with North East Eurasia coming a distant second at 290 Mt. The coal sector intersects with the mining, processing, energy, and steel industries, and is entrenched in the region’s economies. For example, in Indonesia, the most populous country in the region, phasing out coal is extremely unpopular, especially among the resource holders who wield disproportionate influence among the political decision makers. Other countries and regions, alarmed at South East Asia’s plan for continuous coal use, are hoping to incentivize breaking the coal dependence with generous financing deals for ‘greening’ the energy and power sectors (Bloomberg 2022). But the Ukraine war has put a damp- ener on this shift away from coal. The supply choke of natural gas from North East Eurasia implies that more of the region’s coal is demanded, at least in the short term. This demand makes it attractive and lucrative to invest in coal, bringing the risk of further entrenchment of coal in the energy system. Primary energy consumption The dependence on coal and fossil fuels is of course apparent in the region’s primary energy consumption. As shown in Figure 9.9.1, 80% of the primary energy consumption is from fossil fuels. It reduces to 51% by 2050, but this is still above the global average projected to be 49% in mid-century. Of the 80% share of fossil fuel in primary energy in 2020, oil’s share is 30%, followed by coal (27%) and natural gas (23%). Coal’s share is forecast to reduce to less than 10% by 2050, and natural gas's share to 17%. More troublingly, oil’s importance reduces only marginally from 30% in 2020 to 25% in 2050; and in absoluteterms,oilconsumptionincreases 40% in that time. In contrast, solar and wind have very little share in primary energy in 2020, less than 5% combined in 2030, but grow- ing to 28% in 2050. The major economies of the region — e.g. Indonesia, Malayasia, Singapore, Thailand and Vietnam – have struggled to have stable, longlasting and consistent policies supporting renewables; but there are signs that this is changing. For example, renewable policies (feed-in tariffs) in Vietnam have played an important role in the uptake of renewables (solar, wind) and developing the industry (DNV, 2021a), and have seen investments burgeoning in onshore and offshore wind power despite grid constraints holding back integration of variable renewables. Final energy demand Figure 9.9.2 shows the breakdown of the region’s final energy demand by energy carrier. Electricity doubles its share of 18% in final energy demand in 2020 to 36% by 2050. This also corresponds to nearly five-fold growth in electricity generation in the region over that period (Figure 9.9.3). In terms of electricity generation in South East Asia, the evolution to a more renewable grid is stark, as seen in Figure 9.9.3. From 90% fossil fuel-based generation in 2020, the region’s grid generates only 10% of its electricity from fossil fuels in 2050. Of this 10%, the majority is from natural gas. Both solar PV and solar coupled with storage play a significant role in the region’s electricity generation
  • 160.
    318 DNV Energy TransitionOutlook 2022 319 Regional transitions CHAPTER 9 share, rising sharply from the late 2030s to generating 74% of the electricity by 2050. Besides electricity, oil plays a dominant role in meeting demand for energy in South East Asia. While oil’s share in final energy demand reduces from 41% in 2020 to 28% in 2050, oil demand in absolute numbers increases from 8 EJ to 12 EJ per year over the same period. The over- whelming majority of this oil demand goes towards sustaining the region’s transport energy demand. Buildings will be the largest growth sector for electricity demand in South East Asia, accounting for 2 EJ (556 TWh) in 2020 and 9 EJ (2,500 TWh) in 2050, according to our forecast. Of all the end uses in buildings, space cooling creates the largest growth in demand for electricity in the region. The cooling challenge The energy demand for space cooling depends on the cooling degree days (CDD), which increase in South East Asia in the future due to climate change. CDD is a measure of the cumulative positive difference between daily average outdoor temperature and reference indoor temperature of 21.1°C. The space cooling energy demand increases with penetration of air-conditioners, which is set to rise with higher GDP per capita. Total building area and energy-efficiency standards also impact buildings’ energy demand for space cooling. The greater the building area to be cooled, the more the cooling energy demand, while better energy-efficiency standards and insulation lead to lower cooling energy demand. Figure 9.9.4 presents the space cooling energy consump- tion in South East Asia from 2020 to 2050, indexed to 2020 values. Specific cooling demand with CDD and GDP effects shows that if everything else remains the same, the need for energy for space cooling in residential buildings would increase 20-fold between 2020 and 2050. We foresee building regulatory standards and the willingness to invest in passive and net-zero energy buildings as consistent trends in the region. South East Asia has so far tended to take a myopic view when it comes to investment in state-of-the-art equipment for space cooling – with short-term cost considerations winning over long-term savings (UNEP and IEA, 2020). Despite the forecast energy-efficiency gains from better building insulation and retrofitting, the penetration of air-conditioners drastically increases, which coupled with increasing building area to be cooled, results in a 28-fold increase in cooling energy demand in residences between years 2020 and 2050 (Figure 9.9.4). There is already significant penetration of space cooling in commercial buildings in the region, and we forecast such demand to increase nine-fold. Improvements in energy efficiency in buildings, with both voluntary and regulatory building-efficiency standards, will dampen the increase. So, all else being equal, we foresee a nine-fold increase in this demand between 2020 to 2050, or seven-fold with better building insulation, retrofitting, and investment in the best available technologies (Figure 9.9.4). However, with structural changes to the economy and impetus shifting toward the tertiary sector, we also foresee total buildings floor space multiplying almost three-fold, which results in cooling energy demand increasing 27-fold between 2020 and 2050. A difficult shift to green transport Unlike buildings, the transport sector will see little evolution in terms of energy carrier shift. We forecast that most of the oil demand in South East Asia will continue to be for transport purposes, specifically the 72% going to road transport needs (Figure 9.9.5). From a COVID-19 impacted 5.7 EJ per year oil demand in 2020, we forecast an increase to 6.6 EJ per year in 2050 in the region. South East Asia also has a large fleet of two and three-wheelers alongside its four-wheel passenger vehicles. The region’s two and three-wheeler fleet will expand 43% from 227mn vehicles in 2020 to 324mn in 2050. Of this 324mn, we expect less than 2.5mn to be ICEVs by 2050, which implies that 99% are electric two or three-wheelers. Similarly, with the increase in GDP per capita, more and more people will opt for passenger vehicles, forsaking their two-wheelers for added comfort and range. As a consequence, we project the passenger vehicle fleet to grow from 56mn in 2020 to 174mn, which is a tripling of the fleet size. Of the total fleet of passenger vehicles, we foresee less than half being electric vehicles, and the rest being combustion vehicles. The uptake of EVs is expected to be sluggish in the region when compared with Greater China, despite South East Asia’s proximity to China and being an automobile manufacturing powerhouse. Reasons touted for the region’s lacklustre uptake of EVs include higher upfront cost than for ICEVs; lack of policy/support measures such as EV uptake targets and consumer point-of-sales incentives; regulatory delay and indecision by governments; and a still undeveloped charging infrastructure. Cities in South East Asia, such as Bangkok and Jakarta to name two, face many problems due to congestion mostly caused by passenger vehicles – e.g. heavy local air pollution, productivity lost while waiting in traffic, GHG emissions while idling (AECOM 2022). Given that EVs are not going to solve the traffic volume and congestion problems, metropolitan governments in the region have turned their attention to mass transit, especially within urban and densely populated regions. Here, we use the term mass transit to denote all the different modes of city and suburban railway systems (Future Southeast Asia, 2022). Cities where construction of mass transit systems is currently underway include, among others, Ho Chi Minh City and Hanoi (Vietnam), Vientiane (Laos), and Bangkok urban rail transit expansion (Thailand). In our forecast, we do not categorize mass transit as a separate entity but include it in rail transport. For South
  • 161.
    320 DNV Energy TransitionOutlook 2022 321 Regional transitions CHAPTER 9 East Asia, we predict that 28 PJ per year of energy demand for rail transport in 2020 will increase to 49 PJ per year in 2050. More importantly, we also expect the rail transport segment to become increasingly electrified, which also improves energy efficiency. In 2020, only half the energy used for rail transport was electricity. By 2050, almost all the rail transport energy will be electricity. While rail’s share in transport energy demand does not change between 2020 and 2050 in South East Asia, it is important to stress that the absolute rise in energy demand for rail transport corresponds to a higher than equivalent reduction in road energy demand. Rail is a less energy-intensive transport mode; an increase of 21 PJ per year between 2020 and 2050 in rail transport energy translates to a considerably greater reduction in road passenger energy demand. Furthermore, the co-benefits of reduced road traffic congestion, less air pollution, and avoidance of productivity loss, all contribute to increase the preference for rail transport, especially in densely populated or far-flung locations in South East Asia. In summary, measures are being taken to haul the region out of the long fossil tunnel, but these measures need to be wide-ranging with cohesive and sustained policy support. Emissions Our projection for the regional average carbon-price level is USD 25/tCO2 in 2030 and 50/tCO2 by 2050. There is currently limited explicit carbon pricing in the region, but several countries are taking steps toward introducing or expanding pricing schemes by the middle of the decade (see Section 6.4). We forecast that annual energy-related CO2 emission from South East Asia will peak at 2 Gt in 2032 and then reduce to 1.5 Gt in 2050, which is equivalent to the region’s emissions in 2018. The emissions in 2020 were 1.6 Gt, but there was a reduction of almost 0.2 Gt from 2019 to 2020 due to the economic slowdown because of COVID-19. Coal use is the largest contributor to emissions at pres- ent, but we forecast that oil will overtake coal emissions in 2027 and remain the largest emitter through to 2050 (Figure 9.9.6). As explained before, this is mostly due to the transport sector continuing to be dependent on oil. While manufacturing is currently the end-use sector with the largest emissions footprint, transport will catch up, each accounting for almost equal shares in total CO2 emissions by 2050 (Figure 9.9.7). We project faster electrification in manufacturing than in transport, which results in faster decarbonization of manufacturing, when compared to transport. In the context of global climate policy, South East Asia's country pledges in NDCs imply a regional target of limiting increases in energy-related emissions to no more than 521% by 2030 relative to 1990. There are some uncertainties in the comparisons of targets and forecasts, as some countries are unclear about whether the targets also include non-energy-related CO2 emissions. Our Outlook has energy-related emissions increasing by 382% by 2030 in the region, suggesting that these pledges are rather unambitious and will be easily met. Among South East Asian nations, few have emission reduction targets beyond mid-century. Laos, Malaysia, Vietnam for 2050, Indonesia for 2060, and Thailand for 2065, but real policy has yet to be developed. Energy- related emissions for the region are expected to be 1.5 GtCO2 per year in 2050, 3% less than in 2020.
  • 162.
    323 Regional transitions CHAPTER9 322 DNV Energy Transition Outlook 2022 PNZ – South East Asia The pathway to net zero (PNZ) for South East Asia sees CO2 emissions reduce from 1.8 Gt in 2021 to 0.3 Gt in 2050 (Figure 9.9.8), with a strong growth in solar and wind in primary energy, coupled with electrification. Overall final energy demand in 2050 is also markedly lower (21%) in the pathway to net zero than in our most likely forecast. Total final energy demand is 34 EJ instead of 42 EJ, as illustrated in Figure 9.9.9. Electricity and hydrogen use grow fast to reach 45% and 8%, respectively, of final energy demand in 2050. However, significant amounts of fossil fuels remain even in 2050, especially natural gas in power, coal in manufacturing, and oil in transport (accountable for 50% of emissions in 2050). Power sector emissions in South East Asia will reach negative levels by 2047 because of the use of bioenergy, but this is not sufficient to reach net zero by 2050. Carbon capture and storage capacity will peak in the region at 0.5 MtCO2 per year in 2047, the majority of which will be in the power sector. The pathway to net zero for South East Asia sees a rapid reduction in all fossil fuels, and strong solar and wind growth. CO2 price — The rise in average regional carbon prices to USD 50/tCO2 in 2030 and USD 100/tCO2 is reflected as costs for fossil fuels. Transport — South East Asia implements a ban on the sale of passenger ICE vehicles from 2040 and on commercial ICE vehicles from 2047, while subsidizing the electricity price for transport by 10% from 2022. Buildings —A partial ban of 25% on all new fossil-fuel equipment in buildings is implementedby 2050,while the lifetime of new fossil-fuel equipment is halved(from15 to 7.5 years),contributingto faster phase-out of fossil fuel infrastructure.Additionally,higher rate of retrofittingwhen comparedto our most like future is implemented,to increaseenergyefficiencyofbuildings,whileelectrification is incentivisedbythepartialbanoffossil-fuelequipment. Manufacturing — To reduce attractiveness and speed up phase-out of fossil equipment, the cost of capital of oil and gas equipment increases from 8% in 2022 to 17% in 2050, and to 20% for coal equipment. Investment support of 4% is given to electric and hydrogen heat production. Energy supply — All new fossil fuel power capacity has reduced lifetimes (from 40 to 25 years). New oil and gas exploration and developments are banned from 2028. Grid electricity is subsidized for hydrogen production, and capacity investment support of 10% is given for dedicated renewable hydrogen production. PNZ – Policy levers
  • 163.
    324 DNV Energy TransitionOutlook 2022 325 Regional transitions CHAPTER 9 The mature economies in this region have diverse energy use and resources. Australia is a net exporter of energy, and in late 2021 the outgoing Federal Government committed to a technology-driven net zero plan by 2050. New Zealand, Japan and South Korea depend on energy imports and have all committed to net zero by 2050. In Australia, with its vast coal and gas resources for domestic energy use and for export, carbon emissions are declining slowly. Its national 2020 renewables target, was met with rapid growth in wind, rooftop and utility- scale solar. Renewables now contribute over 30% of electricity supply, and there is significant interest in hydrogen. New Zealand relies heavily on renewables for electricity, particularly hydropower and geothermal, and to a lesser extent wind and solar; fossil fuels still dominate energy supply but there is accelerated interest in hydrogen. A longstanding ETS system is in place. Japan imports coal, LNG, and almost all its oil. Most of its geothermal and hydropower potential is already deployed. Geographic factors constrain solar, onshore wind, and grid connectivity. Nuclear power remains contentious, and shortfalls in power supply have been balanced with imported fossil fuels and greater coal-fired generation. Japan plans to increase offshore wind capacity and innovate decarbonization technologies. South Korea’s energy mix is dominated by fossil fuels ( 80%) relying on imports of coal, oil, and LNG. Reduction of air pollutants, carbon emissions and energy inde- pendence are prime energy policy motivations, and newly elected president Yoon Suk-yeol has promised a U-turn in nuclear power phase-out plans. Wind and solar account for about 4% of electricity (2020). The export- oriented manufacturing base is carbon-intensive. Efforts to become a global hydrogen powerhouse have grown since 2017. − After a prolonged period of uncertain energy policy, Australia’s new Federal government has ambitious energy transition plans. These include spending on grid development, promotion of EVs, and investment in green metals. A 45% reduction in emissions by 2030 is targeted. The world’s largest exporter of LNG, Australia is exploring hydrogen for domestic use and export, aided by its excellent gas and renewables supply base, and state/territory level aspirations. − New Zealand targets net zero by 2050 for non- agricultural emissions, and a 50% reduction by 2030. In May 2022, a comprehensive Emissions Reduction Plan was launched which details a package of social, financial, and technical initiatives, including alignment of the existing emissions trading scheme with the established emissions budgets. − Japan carbon neutrality is enshrined into law, condi- tional on innovation. Its Green Growth Strategy holds sectoral plans and envisioned policy tools (METI, 2021). Expanding renewables and storage, near-term coal to gas-switching, CCUS and hydrogen are in focus. Existing nuclear power plants will be used if safety is secured. Its hydrogen strategy includes funding to develop international supply chains and applications in aviation, shipping, steelmaking, and ammonia production. There are capacity targets for hydrogen- based power plants and road vehicle targets. − South Korean’s 2050 Carbon Neutral Strategy (Government of the Republic of Korea, 2020) outlines comprehensive energy decarbonization, favouring LNG, renewables, and electrification of transport. Electricity plans target above 40% renewables with a major role for offshore wind by 2034, and 10% nuclear, the latter likely to see a boost. Coal-to-gas conversion and CCUS in power and manufacturing will be pursued. There are targeted annual funds for hydrogen projects and firms (RD, loans, tax exemptions) for both production and applications to become a leading hydrogen economy by 2040. Characteristics and current position Pointers to the future 9.10 OECD PACIFIC (OPA) This region consists of Australia, New Zealand, Japan and South Korea Population (MN) GDP/person (USD) GDP* (USD TRN) Energy-related emissions/person (T) Energy-related emissions (GT) 2020 2050 Energy use/person (GJ) Energy use (EJ) 207 39 800 8.3 9.4 1.9 170 35 193 57 000 11 2.3 0.4 122 24 *All GDP Figures in the report are based on 2011 purchasing power parity and in 2017 international USD
  • 164.
    326 DNV Energy TransitionOutlook 2022 327 Regional transitions CHAPTER 9 9.10 OECD PACIFIC Energy transition: innovating carbon out of the system OECD Pacific is different compared to other regions in that the countries are all industrialized but do not have common borders and connected grids. Population density, energy resources and infrastructure vary greatly fromJapan’snorthtoNewZeeland’ssouth.Commonalities are access to great wind resources and plenty of coast- lines to capitalize on the growing offshore wind market. However, to complement variable solar and wind, the region's North Asian countries Japan and South Korea will increase the share of electricity using nuclear or hydrogen. Both forms of power generation have their challenges and emission advantages. OECD Pacific countries are expected to be at the forefront of hydrogen uptake as an energy carrier. Hydrogen and its derivatives will represent 8% of the final energy demand in the region by 2050, the second highest share after Europe. Initially, it is primarily in refineries that hydrogen will play a role in the region. By 2050 buildings, power generation, e-fuel production and the manufac- turing sector will be equally big. While we do not model intraregional trade it is fair to assume much of the hydrogen produced (Figure 9.10.1) will be from dedicated onshore wind and solar PV-based electrolysis plants in Australia and then transported to South Korea and Japan for electricity generation, as well as use in manufacturing and buildings. Transport The region will transform its transport system from being based purely on oil and gas to being only 50% fossil-fuel based with the rest running on electricity and 15% on hydrogen and its derivatives. In aviation, most of the fuel is still oil based (60%) in 2050, and the rest will be based on bioenergy and e-fuels. All countries in the region have lengthy coastlines and are dependent on shipping for imports and exports. In 2050, the maritime fuel mix will only be 30% fossil-based whereas ammonia will take centre stage and represent 35% of all shipping fuel, however, uptake will be most prevalent after 2040, see Figure 9.10.2. Road, representing 56% of final energy demand for transport purposes, will transform to have an almost equal split between fossil and non-fossil. Here electricity (46%) and some hydrogen (7%) will be the main fuel to decarbonize road transport. Power sector The region will see significant growth in renewable energy capacity. Much of this capacity is utility scale solar PV sometimes including storage, which mainly will be installed in Australia. Rooftop solar will find applications in all countries in the region, but in Australia and New Zealand the floor area per household is larger than compared to Japan and South Korea which limits rooftop availability for the North Asian countries. Wind, initially onshore and starting mid 2020s offshore will be growing considerably. Much of the capacity will be installed to supply the grid, but a considerable share of the capacity (120GW) will be dedicated to produce hydrogen, ammonia and e-fuels. By 2030 — all capacity additions for power generation in the region are from renewable energy or nuclear, as shown in Figure 9.10.3. By 2050, 72% of on-grid electricity is based on renewable energy and another 15% comes from nuclear power generation. The region will see continuous additions of nuclear capacity coming online during the forecast period, both existing nuclear that has been temporarily shut down, but also new capacity will be built. Together a total of 35 GW capacity will be added by 2050, which amounts to around 15 new plants in the next 30 years compared to the existing 40 (of which 10 are in operation) in Japan and 6 in South Korea. Nuclear supplies the region (Japan and South Korea) with 200 TWh of nuclear electricity in 2020 which will grow to 350 TWh by 2050. Hydrogen and ammonia imports Hydrogen demand more than doubles from less than 8 Mt in 2020 to 15 Mt in 2050. Hydrogen demand and supply largely match for the region with a small amount (1.5 Mt/yr) imported mainly by pipeline from Greater China. Ammonia and methanol will see a growth trajec- tory equivalent to hydrogen and will represent about 12 Mt each in demand by 2050. Most of the demand is to be used as an energy carrier. However, production capacity will be limited and thus OECD Pacific will turn to imports to satisfy growing demand. For ammonia, this would mean 8 Mt/yr imported by 2050, as seen in Figure 9.10.4. By 2030 — all capacity additions for power generation in the region are from renewable energy or nuclear.
  • 165.
    328 DNV Energy TransitionOutlook 2022 329 Regional transitions CHAPTER 9 Primary energy use Primary energy demand is declining with a shrinking population, even if GDP is continuing to grow. However, the GDP growth will be slower towards 2050. Primary energy use is 34% lower in 2050 compared to 2020 levels which is equal to about 1.4% decline per year, as shown in Figure 9.10.5. Energy intensity, which measures primary energy use per GDP, is declining with even greater numbers than the decline in primary energy use. This development is pointing towards an economy less dependent on primary energy and transforming into services and higher value goods. Emissions Declining primary energy use combined with declining population will lead to emissions falling continuously during the forecast period. CO2 emissions will decline by 77% by 2050 in contrast to 2020 figures. All sectors as well as all fossil fuels will decline with the fastest rate seen in coal use and buildings (and manufacturing). All countries in the region have an ambition of reaching net-zero emissions in 2050. However, in our forecast there will be around 440mn tonnes of CO2 still in 2050. These emissions will be equally split between the three main sectors, but over half of the emissions are from oil, Figure 9.10.6. Our projection for the regional average carbon-price level is USD 35/tCO2 in 2030 and USD 90/tCO2 by 2050. Carbon pricing will play an important part of the policy mix to achieve net-zero 2050 targets adopted by all countries in the region (see Section 6.4). The amount of captured emissions amounts 109 million tonnes or 8% of globally captured CO2 emissions. In the context of global climate policy, OECD Pacific country pledges in NDCs indicate a regional target of reducing energy-related emission by 12% by 2030, relative to 1990. Japan, South Korea, New Zealand and Australia strengthened their ambitions in NDC updates the past year. The region is showing an increased ambition level, but still falling short of Paris targets. Our forecast indicates OECD Pacific energy-related emissions decreasing 22% by 2030 compared to 2020 levels, however declines only 7% compared to 1990 levels. New Zealand was first in the region to enshrine in law its 2050 net-zero emission target (non-agricultural activities), in 2019. South Korea and Japan have pledged carbon neutrality by 2050 (October 2020), with the latter creating a law obliging it to “strive to reach net-zero emissions by 2050, conditional on disruptive innovations”. Australia unveiled its net-zero 2050 ambition ahead of COP26. For the region, energy-related emissions are expected to be 0.4 GtCO2 per year in 2050, 77% less than in 2020. Figure 9.10.7.
  • 166.
    331 Regional transitions CHAPTER9 330 DNV Energy Transition Outlook 2022 PNZ – OECD Pacific The pathway to net zero (PNZ) sees OECD Pacific CO2 emissions reduce from 1.9 Gt in 2020 to -0.25 Gt in 2050 (Figure 9.10.8). This reduction is achieved through electrification, transitioning to hydrogen, and deployment of CCS and DAC. In transport, CO2 emissions reduce from 468 Mt in 2020 to 5 Mt by 2050; in buildings, CO2 emissions fall from 621 Mt in 2020 to -49 Mt by 2050; and in manufacturing, CO2 emissions reduce from 690 Mt in 2020 to -36 Mt in 2050. CO2 emissions from the power sector reduce from 858 Mt in 2020 to -93 Mt in 2050. Simultaneously the share of electricity in final energy grows, rising from 25% in 2020 to 52% in 2050. Similarly, the share of hydrogen grows from very low levels in 2020 to 29% by 2050. Despite the slightly negative emissions, the region has considerable oil (10%) and natural gas (2%) remaining in the energy mix (Figure 9.10.9), mostly used in the non- energy sector. Nevertheless, about 70% of the primary energy is obtained from solar and wind in 2050. About 70% of the primary energy is obtained from solar and wind in 2050. Economy-wide economic signals − The rise in average region carbon prices, to USD 100/tCO2 in 2030 and USD 250/tCO2 in 2050, is reflected as costs for fossil fuels. Transport − Bans are instituted on the sale of passenger ICE vehicles from 2036 and of commercial ICE vehicles from 2035, while subsidizing the transport electricity price by 25% from 2022. Buildings − A partial ban of 50% on all new fossil fuel equipment in buildings is instituted by 2050, while the lifetime of new fossil-fuel equipment is halved (from 15 to 7.5 years) from 2022. Additionally, all subsidies on natural gas consumption are eliminated from 2022. These policies enable faster phase-out of fossil-fuel infrastructure and promoting electrification of buildings. Manufacturing − Cost of capital of oil and natural gas equipment in the manufacturing sector increases from 8% in 2022 to 17% in 2050 while cost of capital of coal equip- ment increases to 20%. An investment subsidy of 10% is given to electric and hydrogen heat production. These considerably reduce the attractiveness of fossil-fuel equipment, enabling faster phase-out of fossil-fuel technologies. Energy supply − All new fossil-fuel power capacity additions have reduced lifetimes (from 40 to 25 years), thus enabling faster phase-out of fossil-fuel use for power generation. New oil and gas exploration and development are banned from 2024 and grid electricity is subsidized when used for hydrogen production. In addition, capacity investment support of 25% for dedicated renewables for hydrogen production is implemented. PNZ – Policy levers
  • 167.
    332 DNV Energy TransitionOutlook 2022 333 Regional transitions CHAPTER 9 Energy intensity is measured as primary energy consumption per unit of GDP. All regions experience a decline in this measure due mainly to efficiency gains associated with the steady electrification of energy end-use, but also to the increasing share of renewables in electricity generation, reducing losses to heat. Despite a 54% decline in energy intensity between 2020 and 2050, North East Eurasia remains the region with highest energy intensity. Europe continues to require the least amount of energy per dollar of economic activity, followed by South East Asia, and Greater China. By 2050, regional differences are, however, minor as regional energy intensities trend towards 2 MJ/ USD, with the exception of North East Eurasia. Carbon intensity is measured as grammes of CO2 per megajoule of primary energy consumption. Decarbonization is most rapid in Europe and Greater China with their carbon intensities declining by 72%, and 64%, respectively. North East Eurasia and Sub-Saharan Africa have the least improvement in carbon intensity (18% and 6%). North East Eurasia will become the most carbon-intensive energy system in 2050. The spread between the leading and lagging region remains fairly consistent between 2020 and 2050 at some 30 gCO2 /MJ. Electrification is measured as the share of electricity in the final energy demand mix. This share is increasing everywhere and is fastest in Sub-Saharan Africa, where electrification will almost triple, from 7% in 2020 to 15% in 2050. By 2035, Greater China will overtake OECD Pacific as the most-electrified region with electricity meeting 35% of final energy. In 2050, Greater China leads with electrification at 46%, followed closely by Europe, North America and OECD Pacific. By then, North East Eurasia and Sub Saharan Africa lag the rest of the world by a large margin. Renewables include biomass, solar, wind, geothermal, and hydropower. Because of its high share of traditional biomass, Sub-Saharan Africa remainstheregionwiththehighestshareofrenewables.MiddleEastandNorthAfricawillseethefastestrelativegrowthratein this measure, from 3% in 2020 to 27% in 2050, but because fossil fuels will still be dominant in 2050, it will have the second-lowest renewables share by then. OECD Pacific will see the second-largest relative increase, with its share of renewables growing from 7% to 47%. Most of the world cluster between 40% and60%ofrenewableinprimaryenergyconsumptionby2050,withonlyNorthEastEurasiaandMiddleEastandNorthAfricahavinglowershares. 9.11 COMPARISON OF REGIONAL ENERGY TRANSITIONS
  • 168.
    334 DNV Energy TransitionOutlook 2022 335 ANNEX A1. TEN REGIONS A2. POPULATION In this Outlook, we have divided the world into 10 geographical regions. These regions are chosen based on geographical location, extent of economic develop- ment, and energy characteristics. Each region’s input and results are the sum of all coun- tries in the region. Where relevant, weighted averages are used, such that countries are assigned weights relative to population, energy use, or other relevant parameters. Distinctive characteristics of certain countries – for example, nuclear dominance in France — are thus averaged over the entire region. In a few places, we refer to ‘OECD regions’; that comprises the three regions North America, Europe and OECD Pacific. We also use the terms ‘high income’, ‘medium income’ and ‘low income’ countries and regions, broadly in line with the definition established by the World Bank (2019). Detailed discussions, results, and characteristics of the regional energy transitions are included in Chapter 9 of this Outlook, presenting regional analyses and forecast energy transitions for each of the ten world regions. North America (NAM) Latin America (LAM) Europe (EUR) Sub-Saharan Africa (SSA) Middle East and North Africa (MEA) North East Eurasia (NEE) Greater China (CHN) Indian Subcontinent (IND) South East Asia (SEA) OECD Pacific (OPA) FIGURE A.1 A typical energy forecast starts by considering the number of people that need energy. Although energy consumption per person varies considerably, and will continue to do so, everyone requires access to energy in one form or another. The source most frequently used for population data and projections is the UN Department of Economic and Social Affairs, which publishes its World Population Prospects, normally every other year. The forecast in the latest update, published in July 2022, runs to 2100. Other entities that separately produce population forecasts include the US Census Bureau and the Wittgenstein Centre for Demography and Global Human Capital in Austria. The Wittgenstein Centre places more emphasis than the UN does on considering how future education levels, particularly among women, will influence fertility. As noted by Lutz (2014), urbanization in developing countries will result in fertility rates falling; having many children is a greater economic burden and less of a necessity in cities than in traditional, rural settings. Furthermore, evidence indicates that higher levels of education among women are associated with a lower fertility rate (Canning et al., 2015). Sustainable Develop- ment Goal (SDG) #4 Quality Education and SDG #5 Gender Equality are providing further impetus to improving female education. Fertility is low in both the OECD and China, and in non-OECD regions it is falling considerably. In Sub- Saharan Africa , the reduction in fertility has been slower than in other parts of the world, and the total fertility rate is still at about 4.5 births per woman, falling by about 0.6 births per woman per decade. SSA, where many of the low-income countries are located, also lags behind other regions in the expansion of education. However, we assume that urbanization and improved education levels among women will, eventually, also accelerate the decline in fertility rates in Africa. The pandemic has been influencing fertility figures, and the number of births in most developed countries has fallen. The pandemic's effect on education has been worst in developing countries, with schools being closed for 12 to 18 months, and many young teenagers falling out of school, giving potential higher fertility rates. We noted the conclusion of a recent study of the impact of COVID-19 across 29 countries in Europe and the Americas which concluded that “The … pandemic triggered significant mortality increases in 2020 of a magnitude not witnessed since World War II in Western Europe or the breakup of the Soviet Union in Eastern Europe.” (Aburto et al., 2020). It is noteworthy that this demographic effect coincides with world regions with the highest per capita energy consumption. Research on the long-term impact of these developments will be followed closely, but at the moment, no change in our forecast figures has been included. The Wittgenstein Centre uses several scenarios related to the five different ‘storylines’ that were developed in the context of the Inter-governmental Panel on Climate Change, IPCC (van Vuuren et al., 2011). The IPCC calls these storylines “Shared Socioeconomic Pathways (SSPs)”. In this Outlook, we follow the central scenario (SSP2) for population and use it as a source of inspiration for other forecast inputs. Using the Wittgenstein population projections for SSP2, we arrive at our 2050 population forecast of 9.3 billion, which is an increase of 18% from the most recent UN (2021) population estimate of 7.9 billion. By mid-century, the global population will still be growing, but the rate is reduced to 0.3% per year, and with SSA as the only region with notable growth. Our 2050 figure of 9.3 billion is 4% lower than the latest UN median estimate of 9.7 billion. Had we used the UN median population projection, most of our energy demand figures would have increased commensurately, but with regional variations. The difference would, however, have been minor. The main uncertainty lies in the long term (2100 and beyond) forecast, where most mainstream forecasts, including the UN’s, now indicate a peak in global population before 2100.
  • 169.
    336 DNV Energy TransitionOutlook 2022 337 ANNEX A3. PRODUCTIVITY AND GDP GDP per capita is a measure of the standard of living in a country and is a major driver of energy consumption in our model. From a production point of view, it is also a good proxy for labour productivity, as it reflects the amount of economic output per person. We base our GDP per capita growth forecast on the inverse relationship between GDP per capita level and its growth rate. This relationship is a result of sectoral transitions that an economy experiences as it becomes more affluent. An increase in the standard of living in a low-income country initially arises from productivity improvements in the primary sector, and, thereafter, from productivity improvements in the secondary sector. In both sectors, the move from manual to industrial processes carries vast potential for productivity improve- ments. Mature economies employ increasing shares of their GDP in the tertiary (service) sector. Although services such as financial services and healthcare also benefit from technology uptake, productivity improve- ments tend to increase the quality, rather than the quantity, of output. This implies that productivity growth will slow down as economies approach maturity, and, indeed, this has been demonstrated empirically time and again. Measured in purchasing power-adjusted constant (2017) USD, historical GDP per capita developments from 1990 to today, along with forecast developments towards 2050, can be seen in Figure A.2. On a world-average level, a compound annual growth rate (CAGR) of only 1.3%/yr is estimated in the 2019-2021 period, due to COVID-19. COVID-19 will leave a permanent impact on the economy. In 2023, the global economy will be 4.6% smaller compared to the pre-pandemic projections. The post COVID-19 boost in 2023 will result in some regional economies growing slightly faster than they otherwise would have, and in 2050 the loss declines to 2%. Compared to our forecast last year, the only region which has undergone a significant revision in terms of future GDP forecast is North East Eurasia, due to the ongoing war in Ukraine. The war has tremendously and irreversibly affected the economies of both Russia (not least because of Western sanctions) and Ukraine, two major countries in the region. Compared to last year, our forecast for the region’s GDP is 19.3% and 16.1% lower in 2030 and in 2050, respectively. The fastest growth in GDP per capita, between 2021 and 2030, will be in Asia. The Indian Subcontinent (IND) will have the highest growth rate, at an average of 6.4%/yr, followed by South East Asia (SEA) at 5.0%/yr and Greater China (CHN) at 4.5%/yr, as shown in Figure A.2. As the Asian economies mature, growth in GDP per capita will slow down after 2030. The period between 2030-2050 will be characterized by a more-even spread of prosperity improvements globally, with highest growth in the low-income regions. The region with the fastest GDP per capita growth will therefore be SSA, with a CAGR 5.2%/yr. Improvements in the standard of living in economically developed regions will reduce to under 1%/ yr in the 2030-2050 period. The forecast beyond 2030 does not include any larger changes in the relative positions among the productivity of the different regions. World GDP is expected to grow from USD 134 trn/yr in 2020 to USD 295 trn/yr in 2050. This more than doubling over the 30-year period is a result of a 20% increase in population and a 83% increase in average GDP per capita, with large regional differences. Figure A.3 illustrates the combined effect of population change (x-axis) and GDP per capita growth (y-axis); the decadal growth figures are included in Table A.1. As Table A.1 shows, the world experienced a 3.3% compound annual GDP growth from 2000 to 2020. In the 2040s, this will gradually slow to 1.9%/yr, combining the effect of slowdown in population growth with the economies of more and more countries becoming service orientated. Nonetheless, most economies around the world will continue to grow, albeit at varying rates, with likely exceptions only in mature economies that are experiencing marked population decline, such as Japan. TABLE A.1 Compound annual GDP growth rate by region 2000-2020 2020-2030 2030-2040 2040-2050 2020-2050 NAM North America 1.7% 2.4% 1.2% 1.0% 1.5% LAM Latin America 1.9% 2.9% 3.0% 2.7% 2.9% EUR Europe 1.1% 2.1% 1.1% 0.7% 1.3% SSA Sub-Saharan Africa 4.3% 4.7% 5.3% 5.2% 5.1% MEA Middle East and North Africa 3.4% 3.9% 3.2% 2.6% 3.3% NEE North East Eurasia 3.3% 0.7% 2.5% 2.4% 1.8% CHN Greater China 8.1% 4.8% 2.0% 0.7% 2.5% IND Indian Subcontinent 5.8% 6.6% 4.3% 3.4% 4.8% SEA South East Asia 4.8% 4.8% 3.5% 2.6% 3.6% OPA OECD Pacific 1.4% 1.6% 0.9% 0.4% 1.0% World 3.3% 3.7% 2.5% 1.9% 2.7%
  • 170.
    338 DNV Energy TransitionOutlook 2022 339 ANNEX A4. RESOURCE LIMITATIONS Our forecast describes the production and use of energy towards 2050. During the coming three decades there will be a profound shift in world energy use, which has relied on fossil sources since the Industrial Revolution, and which is now headed for an energy mix where renewables take a slightly-larger-than 50% share by 2050. This shift will not only impact the structure of the energy system but also the type of raw materials and land and surface areas needed to support the transition. Coal mines will shutter, and nickel and lithium mining boom; instead of extracting oil and gas from offshore platforms there will be turbines harvesting wind resources for energy. One central feature of our forecast is the increasing rate of electrification of the world’s energy system. Road transport will increasingly be powered by electricity and energy stored in batteries. In 2050, there will be 1.3bn passenger EVs on the road and transitions on this scale require sufficient raw materials to build the infrastructure and end-use technology and equipment. Supply of natural resources must be capable of expanding at rates that can support demand, both sustainably and cumula- tively, between now and the future. Although we expect there will be local resource demand challenges and price volatility in the future, the overall picture is that there are enough raw materials and land to support the transition. Expansion of existing extractive industries combined with agility, technology and materials choices, and greater recycling and re-use of resources will be important for ensuring that major disruptions are avoided. Our Pathway to Net Zero (Chapter 8) is a ‘back cast’ designing a future compliant with the Paris Agreement and limiting global warming to 1.5°C. The pathway is prescriptive in that it describes one possible pathway that is not necessarily optimally designed using multi-variant selection criteria. Success in implementing this or other pathways to net zero requires war-footing policies which includes the extensive use of land and surface areas as well as intensified raw material demand extraction. Land, sea and mining permits, financing, and distribution of existing resources would need to be managed through multilateral collaboration that takes into account the complex challenges facing reaching 1.5°C, and which would have to be far more effective in resolving resource access and limitations than market forces alone. How such a scenario could play out is the subject of future research. At present, our investigation of resource limitations has been confined to our ‘most likely’ forecast – the main subject of this report. Land and sea-areas to support renewable growth We forecast a 20-fold increase in solar PV capacity by 2050, with sufficient land and building area as a prereq- uisite to support such expansion. In our model, solar PV is installed at utility scale, in microgrids, on the roofs of residential or commercial buildings or off-grid as capacity to produce hydrogen. The first two of these categories combined with off-grid capacity compete with other uses of land. In our Outlook, we forecast 20% of all solar to be installed on rooftops and commercial buildings globally. 6% of total capacity (1TW) is further installed to support hydrogen production. Applying an estimated average 60 MW/ km2 for non-rooftop solar-PV installations indicates a requirement of less than 1% of total land area globally in 2050. Even for regions with large shares of solar PV in their power mix, the land-area requirement is not unmanageable. For example, 2% of agricultural land in South East Asia and 1.6% of the Indian Subcontinent agricultural land will be used for solar PV installations in 2050. Co-use of land for grazing or for certain types of agriculture is also possible, and therefore it seems unlikely that the expansion of solar PV will encounter land-area limitations overall. We are also seeing a growing interest in and developments involv- ing floating solar PV where the available land issue is less of a concern. We predict a 10-fold capacity rise in wind energy, and the question arises as to whether there will be sufficient land and ocean-surface area. Onshore wind has a relatively small footprint, effectively just the base of the tower, so there will be no lack of land area. However, the siting of tall, rotating structures in densely populated areas is a growing societal concern. In our analysis, we have reviewed the overall technical potential and only included areas with sufficient wind speeds, while avoiding densely populated or ultra-remote locations. With these limitations and using an estimated area demand of 5 MW/km2 giving almost 1 km of space between each turbine, then all wind farms cover 900,000 square-km. This equates globally to less than 1% of available land, or in comparison about 2% of agricultural land. The expected capacity represents 1.6% with regional variations between 1-14%, of the technical potential. Thus, it is not availability of land that will be the limiting factor, but rather peoples’ collective acceptance of visual, noise and other environmental impacts associated with land-based wind power. The overall picture is that there are enough raw materials and land to support the transition. In contrast, offshore wind is located far from popula- tions and provides plentiful energy in our Outlook. Our analysis and modelling include both fixed offshore wind and, in water depths exceeding 50 m, floating offshore wind. Globally, there will be sea area and coastline to accommodate the forecast amount of offshore wind. Europe and Greater China will account for 56% of global installed offshore wind capacity. Europe and the North-Sea basin are expected to install mostly fixed (86%) but also floating offshore wind. Greater China will install the largest amount of offshore wind. The mean water depth of 44 m off the region’s coastline and in the Yellow Sea is well suited for this purpose, so there, 86% will be bottom fixed. When considering the technical capacity, only a fraction of the installations will be floating offshore wind, but Greater China as well as the Indian Subcontinent will install 50% and 75% respec- tively of the technical potential of fixed offshore wind by 2050. This would mean that Greater China (including Taiwan) coastal areas would utilize almost 40% of its coastline for installing offshore wind. Growing concerns concerning biodiversity and other uses of the ocean will need to be managed to successfully install such large amounts of offshore wind. Offshore energy extraction, fishing as well as the growing area of ocean-based food farming will need to collaborate successfully — and explore synergies — to ensure enough areas for all parties to thrive. Water scarcity and the energy transition Water is a scarce resource and water stress is a global challenge, more stressful is some regions than in others, which is expected to be further exacerbated by climate change. Access to and additional cost for water can have an impact on the energy transition. As part of under- standing the effect, we have identified three areas of the energy system where water is of importance. Cooling in power plants, electrolysis of water to produce hydrogen, and increased use of water as part of CCS implementation. Thermal power plants use water for cooling. Already today, heat waves create a double challenge as use of air conditioning peaks when both ambient air and water temperature makes cooling less effective. In such situations, curtailments may be required to prevent overheating. Additionally, warmer temperature leads to dry spells and less available water. Such phenomena will worsen in the future where air conditioning will be more extensive and cooling water will experience shortages and less cooling effect. Coffel and Mankin (2021) find that for every degree Celsius of warmer weather, curtailment increases by 1 percentage point. On peak days in a 2°C degree future, they find that curtailment (for this reason) in thermal power plants will increase by 4.5%. They cite that the 2019 heat wave in France forced 8% of French power plant capacity (mainly nuclear) to be curtailed. On the cost side, Lubega and Stillwell (2019) find that cooling water costs are so low that using higher water costs as an incentive for improving energy efficiency (thus automatically impacting water use) will not work. Water costs are such a small fraction of total costs that to impact plant economics, water costs would have to be multiples of municipal water costs which has little chance of happening.
  • 171.
    340 DNV Energy TransitionOutlook 2022 341 ANNEX Electrolysis-based hydrogen production in 2050 represents over 50% of all hydrogen produced. However, when reviewing the costs of such production, water costs are negligible in contrast to the cost of power for electrolysers. Even when water is assumed to be obtained through desalination, the cost for water will be around 2% of total cost (Blanco, 2021). In energy terms, water use is about 1% of total energy consumption when operating an electrolyser plant. CCS uses water in pre-combustion (in power plants) and post-combustion (for SMR) processes. In both instances, increases of water use compared to the non-CCS case, an increase of 100% has been observed. Thus, in regions with growing power generation or manufacturing sectors utilizing CCS, a doubling of water demand could impact such projects. For this reason, future CCS processes are projected to add less than half, typically a quarter, of a CCS process’ water consumption. Yet, even an increase by one quarter will come on top of increased water consumption from expanded thermal energy use in manufacturing as well as combusting power instal- lations. Thus, precaution should be observed in regions with expected growth of CCS combined with manufac- turing or power generation, such as in the case of the Indian Subcontinent or South East Asia. In conclusion, a warmer future will make thermal power plants marginally less fit than today as water shortages and increased water temperatures will be more prevalent. Yet, the combined effect of less thermal power output, and the marginal cost component provided by thermal plants’ water usage leads us to conclude that the power sector will not be significantly impacted by water-related challenges. There is no reason to make water scarcity an economic risk for electrolysis. On the other hand, just as for thermal power plants, electrolyser location will need to take water availability into consideration: There may be locations where lower power costs come at the expense of water availability. But even ‘energy islands’ will be able to solve this through desalination of surrounding salt water, as both the costs and the energy use of providing such water will be dwarfed by power consumption and non-water infrastructure costs. CCS typically increases water use in a power plant or an SMR facility by 25 to 50 %, depending on the technology used. Yet, since the uptake of CCS coincides with decreasing use of combusted energy, post-combustion power plants will not lead to increased water stress in most regions. However, in the Indian Subcontinent and South East Asia, where thermal combustion will expand at the same time as CCS is added, stresses might hamper the roll-out of CCS and/or increase water costs. Especially in the context of a ‘Pathway to Net Zero’, CCS installations and electrolyser capacity are significantly higher, and thus locations should be investigated for water availability today and in the future. The forecast growth in battery capacity is by far the largest driver of demand for minerals containing lithium, nickel, and cobalt used in battery anodes and cathodes and is where we expect the biggest supply challenges. Demand for raw material We have considered the energy transition’s footprint on demand for materials. For example, solar PV panels are expected to consist mainly of crystalline silicon cells (DNV, 2022c), where the main component is silicon, which is considered an abundant material (USGS, 2020), even though there are some limitations to processing facilities to enrich the silicon to a high enough grade needed for the photovoltaic panels. New, thin-film technologies, which are not yet prevalent but are showing potential, will further reduce the overall demand for material. Wind turbines use common building materials, but the vast amounts of steel and cement necessary will put pressure on those hard-to- abate sectors to reduce their embedded carbon footprint during production to ensure low lifecycle emissions from wind. There could be supply-chain challenges for rare earth elements, which are abundant, but expensive and resource-intensive to extract, especially in the case of neodymium used for permanent magnets in the turbines. Growth in the number of EVs and vehicle battery sizes will drive a 300-fold increase in global battery capacity in 2050. This will spur the demand for minerals currently used in Lithium-ion batteries unless new battery chemistries are developed. The forecast growth in battery capacity is by far the largest driver of demand for minerals, containing, lithium, nickel, and cobalt used in battery anodes and cathodes and is where we expect the biggest supply challenges. Battery manufacturing capacity is growing exponentially and there are several initiatives to increase supply for lithium and nickel, while for cobalt the supply chain is less geared for demand surges and we therefore identify cobalt as a critical resource for the energy transition. See our ETO (DNV, 2020a) for a detailed analysis of cobalt supply and demand. The price of cobalt has fluctuated with a doubling in cost and before reducing over the last year (LME, 2022); there are clear signs that auto manufacturers are diversifying their use of battery chemistries. BYD, a big Chinese manufacturer focuses solely on LFP; 95% of commercial vehicles in China, and many of those exported, use LFP chemistry (Campbell, 2019). For its standard range model 3 vehicle, Tesla has decided to use LFP batteries without cobalt, while for their long range and performance vehicles they use a cobalt- based battery but are working on developing a cobalt- free high-performance battery. In our view, the energy transition we forecast will not be significantly constrained globally by the availability of either land/sea area, water or raw materials. Narrowing the perspective, some regions may struggle to find raw materials and some land/sea area will be contending with competing uses, while others will enjoy an abun- dance. Historically, such imbalances would be solved by global collaboration and trade. The intensified focus on energy security also includes security of supply of critical resources, so many regions are reviewing their strategy and dependence on other regions providing the raw materials necessary for securing their energy supply or transition. The effect will further augment existing imbalances and could affect costs in the short, to medium term and warrants further investigation. Also, when considering a more ambitious energy transition focusing on reducing emissions in line with a Paris compliant 1.5°C future, as described in Chapter 8, there will be a further strain on resource demands. Every national plan for reaching net zero, should include a plan for the needed natural resources and how to secure such supply. Many of the minerals and metals required are in low-income countries benefitting climate finance support, which could be an important aspect of negoti- ations around accessing such resources. We aim to revisit the topic of resource availability and understand the possible limitations a net zero future would entail in future research.
  • 172.
    342 DNV Energy TransitionOutlook 2022 343 ANNEX A5. MODEL DESCRIPTION The basis for our forecast is our Energy Transition Outlook Model – an integrated system-dynamics simulation model that reflects relationships between demand and supply in several interconnected modules. Each sector of the energy system (see Figure A.4) is modelled by modules representing: — final energy demand (buildings, manufacturing, transport, non-energy, and other) — energy supply (coal, gas, and oil production) — transformations (power generation, oil refineries, hydrogen production, biomethane production) and other relevant developments (economy, grids, pipelines, CCS, energy markets, trade volumes, emissions) These modules exchange information regarding demand, cost, trade volumes, and other parameters to provide a coherent forecast. Modelling process The equations and parameters in the model are based on academic papers, external databases, commercial reports, and expert judgement from both within and outside DNV. Examples of external databases used include IEA World Energy Balances, IRENA Capacity Generation Database, GlobalData Power Database, Marklines Automotive Industry Portal, Rystad Upstream Database, UN Comtrade Database, and Clarksons Shipping Intelligence Network. For reliable forecasting, we have run dozens of work- shops and discussions with DNV industry experts. Nearly 100 people have been involved in this work, acting as conduits to historical data sources in the many domains, as quality assurers of model sectors and interrelation- ships, and as expert assessors of end results. Timescale The Energy Transition Outlook model covers the period 1980–2050. Historical simulation outputs have been used to test the model’s ability to replicate historical develop- ments, and hence validate our forecast. The model is a continuous-time model, with years as the base time unit: it is designed to reflect dynamics that are happening only at the yearly scale or longer. Shorter scale dynamics, such as within-year seasonality of oil demand, are implied in annual parameters and are not directly reflected in the model. An exception is the power-market module, which balances supply and demand at an hourly resolution. With the model deliberately ignoring short-term fluct- uations occurring over months or even a few years, the Outlook has less reliability over shorter time periods. For example, although the average growth rate of gas demand over 10-year intervals can be compared with confidence, analysing the rate for a particular year in isolation would not necessarily yield meaningful insights. We depart from this approach to incorporate the expected short-term, as well as long-term, impact from the COVID-19 pandemic as well as from Russia`s invasion in Ukraine on social behaviour, economic activity, and energy consumption. Geographical scale The spatial resolution of the model is limited to 10 world regions. Regions interact directly, through trade in energy carriers, and, indirectly, by affecting, and being influenced by, global parameters, such as the cost of wind turbines, which is a function of global capacity additions. Although we do not explicitly model each country or state within regions, we account for variability through statistical distributions of the parameters. For example, the investment cost of a particular power-station type is modelled as a normally distributed parameter to reflect differences between countries and sub- technologies. This allows the model to reflect that capacity additions might occur in some countries, despite the possibility that the average cost of a given technology may be uncompetitively high. Modelling principles Our main priorities when designing the Energy Transition Outlook model were to include three key characteristics of the world energy system: interconnectedness, inertia, and non-linearity. The whole energy supply chain, from demand to supply, is one huge interconnected system. What happens in solar PV technology influences power-generation demand for coal, which, in turn, affects shipping volumes for bulk carriers, and oil demand for the maritime subsector. Inertia is present in all parts of the energy system, from household appliances to oil refineries, and slows energy transitions. Also, many processes are non-linear: a unit increase in one factor does not always have the same effect on another variable. Our model reflects these key characteristics. Whereas many energy models are econometric and assume equilibrium conditions, our model is not. Instead, it simulates the consequences of its assumed goals, parameters, and interrelationships. The model explicitly reflects the delays in reaching a desired state and, consequently, is able to forecast the path and speed of energy transitions. Our model does not assume optimality or rationality as a prerequisite. Its methodology is strongly influenced by behavioural economics, where, given the particularities of a given situation, decision making can be predicted (Thaler, 2015). However, the decisions themselves are not necessarily rational, in the utility-maximizing sense of the term. For example, we reflect the fact that more emphasis is placed on the initial purchase price of a vehicle by private buyers than by commercial purchasers. Thus, private buyers may choose a technology that has a lower upfront cost, although it may be more expensive from the perspective of total cost of ownership. Our Energy Transition Outlook model is not stochastic, but deterministic. We have used past data and our best judgment to provide expected values for all input parameters, and each run of the model gives an exact output as there is no randomness in the model. However, there are, of course, multiple sources of uncertainty in the outputs, and the model cannot provide confidence levels for these. In order to address this to some extent, sensitiv- ity tests have been run to help us understand how the model results change when selected input parameters are adjusted. Our aim is to present a transparent model, not a black box. This is because we believe that this makes it easier to discuss the results. Furthermore, if it is of interest to test the consequences of an alternative assumption or to try a different value, perhaps due to disagreement with a value chosen, then that is easily accomplished. Although the exact calculations that emerge from a complex model are therefore not amenable to simple checking with a pocket calculator, we are clear about the parameters that have been used and how they are related. Detailed documentation of the model is provided elsewhere (DNV, 2022d). Continuous improvement The structure and input data of the model are continually updated in order to: — provide a more complete and accurate representation of the world energy system; — generate new outputs relevant to our stakeholders; — reflect recent changes in the energy sector. — The most significant changes to the model since our 2021 Outlook are: — revision of the hydrogen demand and supply sector including hydrogen trade — introduction of ammonia and e-fuels as new energy carriers; — revision of the manufacturing sector. There is a new breakdown to cement production and the petrochemical sector — a revised formulation for the effect of insulation and retrofitting on the space heating and cooling energy demand of buildings — a revised formulation for the uptake of hydrogen in commercial vehicles — introduction of inter-regional power trade — impact assessment of material shortages and long-term impacts of Ukraine-Russia War on the energy system — updated parameters for heat pumps — revision of nuclear parameters to reflect cost overruns and the impact of SMRs
  • 173.
    344 DNV Energy TransitionOutlook 2022 345 ANNEX Energy demand We use policy and behavioural effects, either explicitly, as in the effect of increased recycling on plastics demand, or implicitly, such as the impact of expected electricity prices on electrification of heating. Generally, we estimate sectoral energy demand in two stages. First, we estimate the energy services provided, such as passenger- kilometres of transport, tonnes of manufacturing, or useful heat for water heating. Then we use parameters on energy efficiency and energy-mix dynamics to forecast the final energy demand by sector and by energy carrier. We use non-linear econometric models to estimate regional demand for energy services. Population and GDP per capita are the main drivers, but we also incorporate other technological, economic, social, and natural drivers, as necessary. In road transport, the number of vehicles required rises as regional GDP increases. This is a non-linear effect that reaches saturation at different levels for each region. Vehicle demand is also affected by driving distance and vehicle lifetime, both of which are influenced by the uptake of autonomous and shared vehicles. The link between maritime trade and production/ consumption balance of energy and non-energy commodities is explicitly modelled. For non-cargo vessels, air travel and rail passengers, and freight demand, GDP is used as the driving factor. In the buildings sector, we estimate the energy required for residential and commercial buildings for five end uses. Together with insulation and climate, the floor area of buildings is the major determinant for regional space-heating and cooling demand. Hot-water demand is linked to standard of living and population. For cooking, we use the useful heat delivered as the energy service, and estimate it by household size and population. GDP from the tertiary sector, which increases with GDP per capita, is a major factor for commercial buildings, driving both the floor area and the demand for various energy services. The energy service we use for manufacturing is the value added in USD, estimated separately for base materials, manufactured goods, and construction and mining. For iron and steel, we measure the output in tonnes. Total manufacturing value added in each of our world regions is driven by the secondary sector GDP. Total value added is split into subsectors using historical shares. Demand for iron and steel is linked to building construction, vehicle production, shipbuilding, and economic activity. In terms of energy services, we distinguish between process and non-process heating, machines and appli- ances, iron ore reduction, and on-site vehicles. The choice of energy carrier is based on levelized costs in buildings, manufacturing and EV uptake. For the energy mix of other end uses, our forecasts are derived from extrapolating past-usage trends into the future. These trends have been subject to expert judgement in our workshops, and adjustments have been made where deemed appropriate. Energy carriers Among the 12 energy carriers that we model, seven are also primary energy sources; i.e. they can be used without any conversion or transformation process. The others are secondary forms of energy obtained from primary sources. Primary energy sources are coal (including peat and derived fuels), oil, natural gas (including methane, ethane, propane, butane and bio- methane), geothermal, bioenergy (including wood, charcoal, waste, biogases, and biofuels), solar thermal (thermal energy from solar water heaters), and off-grid PV (electricity from solar panels not connected to the grid). Secondary energy sources are electricity, direct heat (thermal energy produced by power stations), ammonia, e-fuels and hydrogen. Energy transformations We place special emphasis on electricity generation. We have calculated the regional equilibrium price, supply, and demand for 12 power-station types, four storage technologies, 12 load segments, and power-to-hydrogen conversion for hourly intervals over the whole year. Hourly profiles for load segments and variable renewable generation are deterministic but vary over years. Certain load segments, and all but variable renewable generation and storage technologies, respond to price. For power station and storage investments, we employ a profitability- based algorithm. Our estimate of the required additional generation capacity is based on increased electricity demand and estimated capacity retirements. We determine the mix of capacity additions based on a probabilistic model that makes use of the expected received price and the levelized cost of electricity. We explicitly estimate the effect of renewable support, carbon price, and the cost of CCS. The investment for storage is driven by expected received price and levelized cost of storage, both of which are informed from the hourly power-market module. The role of direct heat is a diminishing one. Consequently, we use a simple extra- polation to estimate regional mixes of direct heat supply. Hydrogen is supplied either by electrolysis or from fossil fuels, through steam methane reforming (SMR) or coal gasification. We make a distinction between hydrogen supplied via electrolysis from grid electricity and via off-grid dedicated renewable-based electrolysers. Annual operating hours and expected electricity price for electrolysis are calculated dynamically in the hourly power-market module. The levelized cost of hydrogen from competing technologies determines the investment mix in hydrogen production capacity. Fossil-fuel extraction When it comes to the supply of energy from primary sources, the model focuses on the production of oil, natural gas, and coal. For oil and gas, we use a cost-based approach to determine regional production dynamics. On the oil-supply side, we model production capacity as a cost-driven global competition between regions and in three field types: offshore, onshore conventional, and unconventional. Since transportation is typically less than 10% of the final crude-oil cost, we use total breakeven prices of prospective fields to estimate the location and type of future oil production. We model regional gas production slightly differently from that of crude oil. First, we estimate the fraction of gas demand to be supplied from the region’s own sources, based on production and transportation costs. Then, to determine the development of new fields constrained by resource limitations, we set three field types to compete on breakeven prices on a regional scale. Regional refinery capacities and gas liquefaction / LNG regasification capacities are also part of the model. Coal production is modelled by differentiating between hard coal and brown coal. Each region’s hard-coal supply reflects its mining capacity, which expands as demand increases and is limited by its geologically available reserves. For brown coal, we assume that most regions are self-sufficient. Trade Trade, especially seaborne trade, of energy carriers, is a vital component of the model. For crude oil, the gap between a region’s production and refinery input determines the surplus for export or the deficit to be met by imports, which is mainly transported on keel. For natural gas, any shortfall in meeting demand from regional production is allocated to exporting regions according to their current shares as gas trading partners and future changes in gas import costs between trade partners. Intra-regional trade is determined as a constant multiplier of regional gas demand. For coal, as for natural gas, we assume a stable mix and shares of trade partners. Coal from exporting regions is imported by those regions with domestic shortfalls. Our manufacturing sector provides a baseline for non-energy commodity trade of raw materials and manufactured goods. All the forecast data in DNV’s suite of Energy Transition Outlook reports, and further detail from our model, is accessible on Veracity – DNV’s secure industry data platform. eto.dnv.com/forecast-data Download our forecast data
  • 174.
    346 DNV Energy TransitionOutlook 2022 347 Energy prices Population GDP per capita Battery price Autonomous and communal driving Retirements Unit energy use of new vehicles Lifetime Variability in electricity demand Vehicle fleet Levelized cost of electricity Profitability of storage Energy use of fleet Travel distance per vehicle Storage additions Power grid strength Accumulated storage additions Vehicle sales by type Fuelling and repair availability Government support Tax Vehicle demand Available storage Grid investments Energy demand by energy carrier Energy use of vehicle additions Electricity demand Fossil fuel demand Battery size Resources Refuelling speed Fossil fuel supply by type and region Range Maritime energy demand Aviation energy demand Investment cost Rail energy demand Electricity price Fossil fuel production cost Installed capacity Operating cost Power station additions by type Capacity Retirements Firm capacity demand Use of fast recharging Firm capacity availability Share of variable renewables in capacity Fast recharging density Accumulated additions Capital cost Cumulative EV sales Variable cost Generation hours Received electricity price Vehicle utility Profitability Subsidy Variability in electricity price Cost of ownership TRANSPO R T ROAD F O S S I L F U EL EXTRACTION POW ER SUPPLY M A NUFACTURI N G Demand feedback process details not shown BUILDINGS Demand feedback process details not shown 1 FIGURE A.4 Energy Transition Outlook model showing the interconnectivity of energy systems and technologies Novel shipping technologies Pipelines for low-carbon gases Meshed HVDC grids New battery technologies Developments in solar PV Green hydrogen Floating Wind EVs and grid integration Waste to fuel Carbon capture and storage REFERENCES Abu Dhabi Government Media Office (2022) Abu Dhabi Depart- ment of Energy’s Low-Carbon Hydrogen Policy and Regulatory Framework to Accelerate UAE’s National Hydrogen Strategy. https://www.mediaoffice.abudhabi/ar/ Aburto, J.M. et al. (2022) ”Quantifying impacts of the COVID-19 pandemic through life-expectancy losses: a population-level study of 29 countries”. International Journal of Epidemiology, Vol. 51, Issue 1, February. https://doi.org/10.1093/ije/dyab207 ADNOC (2021) Mitsui and GS Energy to Join TA'ZIZ in World-Scale Low-Carbon Blue Ammonia Project. Press release 16. November. Available at: https://www.adnoc.ae/en/news-and-media/press-re- leases/2021/mitsui-and-gs-energy-to-join-taziz-in-world-scale- low-carbon-blue-ammonia-project AECOM (2020) Going the extra kilometre: Moving Southeast Asia’s cities forward — The future of infrastructure. By Scott Dunn. Available at: https://infrastructure.aecom.com/2020/going-the-extra-kilo- metre-moving-southeast-asias-cities-forward African Business (2022) Independent power projects conquer new territory in Africa. By James Gavin, 8. July. Available at: https:// african.business/2022/07/energy-resources/independent-pow- er-projects-conquer-new-territory-in-africa/ AfDB — African Development Bank (2017) The Bank Group’s Strategy for The New Deal on Energy for Africa 2016 – 2025. ©African Development Bank Allianz (2022) Global claims review 2022 – Trends and developments in corporate insurance losses. ©2022 Allianz Global Corporate Specialty SE. ACP – American Clean Power (2022) New Data Confirms Depart- ment of Commerce Inquiry Severely Disrupts U.S. Utility-Scale Solar Market. By Heather Zichal, 19. April. https://cleanpower.org/blog/ new-data-confirms-department-of-commerce-inquiry-severe- ly-disrupts-u-s-utility-scale-solar-market/ Archer, D. et al. (2009) “Atmospheric Lifetime of Fossil Fuel Carbon Dioxide”. Annual Review of Earth and Planetary Sciences, Vol. 37:117–34. https://doi.org/10.1146/annurev.earth.031208.100206 ASEAN (2021) ASEAN Power Updates 2021. https://aseanenergy. org/asean-power-updates-2021/ Ayele, S. and Mutyaba, V. (2021) Chinese-Funded Electricity Generation in Sub-Saharan Africa and Implications for Public Debt and Transition to Renewable Energy. IDS Working Paper 557, Brighton: Institute of Development Studies Batres, M. et al. (2021) “Environmental and climate justice and technological carbon removal”. The Electricity Journal, Vol. 34, Issue 7. https://doi.org/10.1016/j.tej.2021.107002 Blanco, Herib (2021) Hydrogen production in 2050: how much water will 74EJ need? 22. July. Available at: https://energypost.eu/ hydrogen-production-in-2050-how-much-water-will-74ej-need/ Bloomberg (2022a) Breaking Indonesia’s Coal Habit May Cost Rich Nations Billions. Available at: https://www.bloomberg.com/news/ features/2022-06-07/breaking-indonesia-s-coal-habit-may-cost- rich-nations-billions Bloomberg (2022b) Iran Moves More Oil Onto Ships in Preparation for a Nuclear Deal. Available at: https://www.bloomberg.com/ news/articles/2022-02-23/iran-moves-more-oil-onto-ships-in- preparation-for-a-nuclear-deal Bloomberg (2022c) Saudi Arabia to Start Building Green Hydrogen Plant in Neom. By Vivian Nereim, March 17. Available at: https:// www.bloomberg.com/news/articles/2022-03-17/saudi-arabia-to- start-building-green-hydrogen-plant-in-neom BNEF (2022) Corporate clean energy buying tops 30GW mark in record year. 31. January. Available at: https://about.bnef.com/blog/ corporate-clean-energy-buying-tops-30gw-mark-in-record-year/ Bordoff, J. and O’Sullivan, M.L. (2022) “The new energy order – How governments will transform energy markets”, Foreign Affairs, July/ August. https://www.foreignaffairs.com/articles/energy/2022-06- 07/markets-new-energy-order Boston University Global Development Policy Center (2022) Chinese Loans to Africa Database. Available at: https://www.bu. edu/gdp/chinese-loans-to-africa-database/. Accessed 30. August. Business Standard (2022a) China population to shrink for the first time in 60 years. By Xiujian Peng, 30. May. Available at: https://www. business-standard.com/article/international/china-population-to- shrink-for-1st-time-in-60-yrs-what-it-means-for- world-122053000429_1.html Business Standard (2022b) India's bet on gas-based economy runs into Ukraine war challenges. By S. Dinakar, 18. July. Available at: https://www.business-standard.com/article/specials/india-s-bet- on-gas-based-economy-runs-into-ukraine-war-chal- lenges-122071801004_1.html References
  • 175.
    348 DNV Energy TransitionOutlook 2022 349 CADGAT (2022) Fossil Fuels in Central Asia: Trends and Energy Transition Risks. https://osce-academy.net/upload/file/CADGAT_ data_article_28.pdf Campbell M. and Tian Y. (2019) The World’s Biggest Electric Vehicle Company Looks Nothing Like Tesla. Bloomberg Europe Edition. Available at: https://www.bloomberg.com/news/ features/2019-04-16/the-world-s-biggest-electric-vehicle-compa- ny-looks-nothing-like-tesla Canning D. et al. (2015) Africa's Demographic Transition: Dividend or Disaster? Africa Development Forum series. Washington D.C., World Bank Group. Carbon Policy Watcher (2022) The Top 20 Carbon Dioxide Emitters. Update 5. September. Available at: https://www.climate-poli- cy-watcher.org/greenhouse-gases-2/the-top-20-carbon-diox- ide-emitters.html Carbon Pricing Leadership Coalition (2017) Report of the High- Level Commission on Carbon Prices. The World Bank, Washington, D.C., 29. May. https://www.carbonpricingleadership.org/ report-ofthe-highlevel-commission-on-carbon-prices/ CAREC and ADB (2019) CAREC Energy Strategy 2030 — Common borders. Common solutions. Common energy future. November © 2019 Asian Development Bank. CERRE — Centre for Regulation in Europe (2021) Electricity and gas coupling in a decarbonised economy. March. © Copyright 2021, Centre on Regulation in Europe China Briefing (2021) Understanding China’s Action Plan for Reaching Peak Carbon Emissions by 2030. Available at: https:// www.china-briefing.com ClientEarth (2021): The Greenwashing Files. Available at: https:// www.clientearth.org/projects/the-greenwashing-files/ CAT — Climate Action Tracker (2021a) Glasgow’s 2030 credibility gap: net zero’s lip service to climate action. 9. November. https:// climateactiontracker.org/publications/glasgows-2030-credibility- gap-net-zeros-lip-service-to-climate-action/ CAT (2021b)Climatetargetupdatesslowasscienceramps up need for action. September. https://climateactiontracker.org/documents/871/ CAT_2021-09_Briefing_GlobalUpdate.pdf Coffel E.D. and Mankin J.S. (2021) “Thermal power generation is disadvantaged in a warming world”. Environmental Research Letters. 16. 024043. https://doi.org/10.1088/1748-9326/abd4a8 Conventus Law (2022) Kazakhstan — Carbon credits — A tool to control greenhouse gas emissions. https://conventuslaw.com/ report/kazakhstan-carbon-credits-a-tool-to-control/ Council of the European Union (2021) Joint Declaration of the Eastern Partnership Summit. Brussels, 15. December https://www. consilium.europa.eu/media/53527/20211215-eap-joint-declara- tion-en.pdf DNV (2022a) Hydrogen forecast to 2050. Available at: dnv.com/eto DNV (2022b) The Ukraine war will not derail Europe’s energy transition. Available at: dnv.com/eto DNV (2022c) Maritime Forecast to 2050. Available at: dnv.com/eto DNV (2022d) The Energy Transition Outlook 2022 — Model documentation. Forthcoming DNV (2021a) Energy Transition Outlook 2021. Available at: dnv.com/ eto DNV (2021b) Financing the Energy Transition. Available at: dnv.com/ eto DNV (2020a) Energy Transition Outlook 2020. Available at: dnv. com/eto DNV (2020b) The Promise of Seasonal Storage. By Rob van Gerwen, Marcel Eijgelaar, Theo Bosma. Available at: https://www.dnv.com/ publications/the-promise-of-seasonal-storage-168761 DNV (2020c) Technology Outlook 2030. Available at: https://www. dnv.com/to2030 DNV (2019) Utility-scale solar PV: From big to biggest. By Dana Olson Bent Erik Bakken. Available at: https://www.dnv.com/ feature/utility-scale-solar.html DNV (2018a) Are solid-state batteries the holy grail for 2030? Technology Outlook 2030. Available at: https://www.dnv.com/ to2030/technology/are-solid-state-batteries-the-holy-grail- for-2030.html DNV (2018b) Is peak energy coming soon? Available at: https:// www.dnv.com/feature/counting-energy.html Dubai Future Foundation (2022) The Future of Hydrogen in the UAE. Available at: https://www.dubaifuture.ae/ Ecology China Network (2021) Xie Zhenhua: Carbon peaking is carbon dioxide, carbon neutral includes all greenhouse gases. 6. December. Available at: http://www.eco.gov.cn/index.php/news_ info/51201.html Economic Times (2022) India plans own uniform carbon trading market. By Sarita C Singh, 26. April. Available at: https://economic- times.indiatimes.com/industry/renewables/india-plans-own-uni- form-carbon-trading-market/articleshow/91082527.cms Eicon (2022) Green Taxonomy Approved in Kazakhstan. https:// eicon.green/tpost/3m8r5h51o1-green-taxonomy-approved-in-ka- zakhstan Electrek (2022) Wind and solar produce more electricity than nuclear for the first time in the US. By Michelle Lewis, 7. July. Available at: https://electrek.co/2022/07/07/wind-and-solar-pro- duce-more-electricity-than-nuclear-for-the-first-time-in-the-us/ EMA – Energy Market Authority (2021) EMA to Seek Proposals for Electricity Imports. https://www.ema.gov.sg/media_release. aspx?news_sid=20211024ouxMNg5jwnht ESMAP – Energy Sector Management Assistance Program (2019) Going Global: Expanding Offshore Wind to Emerging Markets. Washington, DC: ©World Bank ETC – Energy Transitions Commission (2021) Bioresources within a Net-Zero Emissions Economy: Making a Sustainable Approach Possible ETC (2020) Mission Possible EC – European Commission (2022) REPowerEU: A plan to rapidly reduce dependence on Russian fossil fuels and fast forward the green transition. Press release 18. May, Brussels. https://ec.europa. eu/commission/presscorner/detail/en/ip_22_3131 EC, Joint Research Centre (EC-JRC) Netherlands Environmental Assessment Agency (PBL) (2021) Emissions Database for Global Atmospheric Research (EDGAR), release EDGAR v6.0_GHG (1970 – 2018). https://edgar.jrc.ec.europa.eu/dataset_ghg60 EC (2010) Global biomass potential under sustainable constraints, DG Environment News Alert Service, edited by SCU, The University of the West of England, Bristol SCU, The University of the West of England, Bristol. European Council (2022) Climate change costs lives and money. ©European Union. https://www.consilium.europa.eu/en/info- graphics/climate-costs/ ESMA — European Securities and Markets Authority (2022) ESMA publishes results of its call for evidence on ESG ratings. https://www. esma.europa.eu/ Financial Times (2022a) Methane emissions are only getting worse. Available at: https://www.ft.com/content/a380307d-4d88-4f3c- 9e73-887f2dcc7276 Financial Times (2022b) US says Iran nuclear deal has made progress but warns ‘gaps’ remain. Available at: https://www.ft.com/ content/dc86fe2b-0e94-4976-a7d9-5d965159d025 Fischer, A. (2022) Clean hydrogen and energy storage project in Utah receives $504 million loan guarantee from DOE. 10. June. Available at: https://pv-magazine-usa.com/2022/06/10/clean-hy- drogen-and-energy-storage-project-in-utah-receives-504-million- loan-guarantee-from-doe/ Future Southeast Asia (2022) Urban Rail Transit of Southeast Asia. Available at: https://futuresoutheastasia.com/urban-rail-tranist/ G7 Germany (2022) G7 Climate, Energy and Environment Ministers’ Communiqué. Berlin. 27. May. https://www.bmwk.de/Redaktion/ DE/Downloads/G/g7-konferenz-klima-energie-umweltminis- ter-05-2022-abschlusskommunique.pdf?__blob=publication- Filev=14 GermanWatch (2021) Global Climate Risk Index. Available at: https://www.germanwatch.org/en/cri GCCA – Global Cement and Concrete Association (2022) Getting the Numbers Right. Available at: https://gccassociation.org/ sustainability-innovation/gnr-gcca-in-numbers/ GCCSI – Global CCS Institute (2021) Global Status of CCS 2021: CCS Accelerating to Net Zero. Available at: https://www.globalccsinsti- tute.com/resources/global-status-report/ GCP – Global Carbon Project (2022) Carbon budget and trends 2021. Published on 26. April 2022. Available at: https://www. globalcarbonproject.org/carbonbudget Global Forrest Watch (2021) Forest Pulse: The Latest on the World’s Forests. Available at: https://research.wri.org/gfr/forest-pulse Global Methane Pledge (2021) Available at: https://www. globalmethanepledge.org/ GOGLA (2022) Investment Data. Available at: https://www.gogla. org/access-to-finance/investment-data. Accessed 1. August Government of Canada (2022) 2030 Emissions Reduction Plan — Canada’s next steps for clear air and a strong economy. https://www. canada.ca/content/dam/eccc/documents/pdf/climate-change/ erp/Canada-2030-Emissions-Reduction-Plan-eng.pdf Government of the Republic of Korea (2020) 2050 Carbon neutral strategy of the Republic of Korea towards a sustainable and green society. December. https://unfccc.int/documents/267683 GreenBiz (2022) State of Green Business 2022. Available at: https:// www.greenbiz.com/report/state-green-business-2022 Gulf International Forum (2022) The Iran Nuclear Deal and World Energy Markets. Available at: https://gulfif.org/the-iran-nuclear- deal-and-world-energy-markets/ References
  • 176.
    350 DNV Energy TransitionOutlook 2022 351 Heggelund, G. et al. (2021) Linking Asian carbon markets: opportu- nities and barriers. Fridtjof Nansens Institutt, FNI Report 2 Hernes S. et al. (2021) Ringvirkninger av Olje- og Gass-næringens aktivitet i 2019. Menon Economics Publikasjon NR. 22/2021. Menon, Oslo Holovo, Iryna (2021) Ukraine and the European Green Deal Guiding Principles for Effective Cooperation. December 2021. Heinrich Böll Foundation. https://boell.org/sites/default/files/2022-01/E-Paper_ Ukraine_and_the_European_Green_Deal_Endf_0.pdf Houache, M.S.E. et al. (2022) “On the Current and Future Outlook of Battery Chemistries for Electric Vehicles—Mini Review”. Batteries, 8, 70. https://doi.org/10.3390/batteries8070070 Hydrogen Rise (2022) Hydrogen Rise and Jindal Shadeed Iron Steel to evaluate landmark trial of green hydrogen in the production of environment-friendly steel in Sohar. Available at: https:// hydrogenrise.com/hydrogen-rise-and-jindal-shadeed-sohar/ ICAP – International Carbon Action Partnership (2022) Emissions Trading Worldwide — Status report 2022. Berlin: International Carbon Action Partnership ICCT – International Council on Clean Transportation (2022) New legislation in Chile shows climate leadership. By Oscar Delgado and Samantha Pettigrew, 25. April. Available at: https://theicct.org/ chile-latam-lvs-leg-en-apr22/ IEA – International Energy Agency (2022a) Oil Market Report — August 2022. IEA, Paris https://www.iea.org/reports/oil-mar- ket-report-august-2022 IEA (2022b) Renewable energy market update – May 2022. https:// www.iea.org/reports/renewable-energy-market-update-may-2022 INSERT IEA (2022c) Solar PV Global Supply Chains. https://www.iea. org/reports/solar-pv-global-supply-chains IEA (2021a) Direct Air Capture: Tracking Report. https://www.iea. org/reports/direct-air-capture IEA (2021b) Is carbon capture too expensive? By Baylin-Stern, A. and Berghout, N. https://www.iea.org/commentaries/is-carbon-cap- ture-too-expensive IEA (2021c) Methane Tracker 2021. https://www.iea.org/reports/ methane-tracker-2021 IEA (2021d) Net Zero by 2050: A Roadmap for the Global Energy Sector. https://www.iea.org/reports/net-zero-by-2050 IEA (2020) Energy Technology Perspectives. https://www.iea.org/ reports/energy-technology-perspectives-2020 IEA (2017) Energy Technology Perspectives 2017 — Catalysing Energy Technology Transformations. IEA-Tsinghua University (2021) The role of China’s ETS in power sector decarbonisation. https://prod.iea.org/events/iea-tsing- hua-joint-report-launch-the-role-of-china-s-ets-in-power-sector- decarbonisation IEA (2018) The Future of petrochemicals IMF – International Monetary Fund (2022) World Economic Outlook International Monetary Fund Update. IMF; Washington DC, July IMF (2019) Sub-Saharan Africa Regional Economic Outlook: Recovery Amid Elevated Uncertainty. https://www.imf.org/en/ Publications/REO/SSA/Issues/2019/04/01/sreo0419 IPCC – Intergovernmental Panel on Climate Change (2022) Climate change 2022 — Mitigation of climate change. The sixth Intergovern- mental Panel on Climate Change Assessment Report, Working Group III. https://www.ipcc.ch/report/ar6/wg3/ IPCC (2021) Climate Change 2021: The Physical Science Basis. The sixth Intergovernmental Panel on Climate Change Assessment Report. https://www.ipcc.ch/report/ar6/wg1/ IPBES (2019) Summary for policymakers of the global assessment report on biodiversity and ecosystem services. https://ipbes.net/ global-assessment IRENA – International Renewable Energy Agency (2022) Renewable Energy Market Analysis: Africa and its Regions. ©IRENA 2022. Abu Dhabi. IRENA AfDB (2022) Renewable Energy Market Analysis: Africa and Its Regions, International Renewable Energy Agency and African Development Bank, Abu Dhabi and Abidjan. IRENA (2019a) Scaling up renewable energy deployment in Africa. ©IRENA 2019. Abu Dhabi. IRENA (2019b) Innovation landscape brief: Flexibility in conventional power plants. IRENA 2019. Abu Dhabi. IQAir (2022) 2021 World Air Quality Report – Region City PM2.5 Ranking. https://www.iqair.com/world-most-polluted-countries Lebel Eric D. et al. (2022) “Methane and NOx emissions from Natural Gas Stoves, Cooktops and Ovens in Residential Homes”. Environmental Science and Technology. 56, 4, 2529–2539. https:// doi.org/10.1021/acs.est.1c04707 LME (2022) LME Cobalt price graph. Available at: https://www.lme. com/Metals/Minor-metals/Cobalt#tabIndex=2 Los Angeles Times (2022) Newsletter: Here’s how California plans to spend $37 billion fighting climate change. By Sammy Roth, 13. January. Available at: https://www.latimes.com/environment/ newsletter/2022-01-13/heres-how-california-plans-to-spend-22- billion-fighting-climate-change-boiling-point Lutz, W. (2014) “A Population Policy Rationale for the Twenty-First Century”. PopulationandDevelopmentReview.Vol40(3).September Lubega W. and Stillwell A. (2019) “Analyzing the economic value of thermal power plant cooling water consumption”. Water Resources and Economics, Vol. 27, July Masdar (2022) Masdar signs landmark agreements to develop 4 GW-capacity green hydrogen plants in Egypt by 2030. https://news. masdar.ae/en/News/2022/04/24/19/05/Masdar-signs-landmark- agreements-to-develop-4-GW McKinsey (2021) How COVID-19 is reshaping supply chains. New York, November. https://www.mckinsey.com/capabilities/ operations/our-insights/how-covid-19-is-reshaping-supply-chains McKinsey (2020) Laying the foundation for zero-carbon cement METI (2021) Overview of Japan’s Green Growth Strategy Through Achieving Carbon Neutrality in 2050. https://www.meti.go.jp/ english/policy/energy_environment/global_warming/ggs2050/ index.html Ministerio de Energia (2021) The National Green Hydrogen Strategy of Chile — Hydrogen Technologies and Production of Synthetic Fuels. https://fch.cl/wp-content/uploads/2021/03/20210309-Chilean-Na- tional-Green-H2-Strategy.pdf MongaBay (2022) Planned coal plants fizzle as Japan ends financing in Indonesia, Bangladesh. By Hans Nicholas Jong, 28. June. Available at: https://news.mongabay.com/2022/06/planned-coal- plants-fizzle-as-japan-ends-financing-in-indonesia-bangladesh/ Nahm, J. et al. (2022) G20’s US$14-trillion economic stimulus reneges on emissions pledges. Nature, 2. March. https://www. nature.com/articles/d41586-022-00540-6 Nakano, Jane (2022) The Geopolitics of Hydrogen in the Indo-Pacific Region. A report from the CSIS Energy Security and Climate Change Program. ©Center for Strategic International Studies Nasdaq (2022) Renewable Energy News Update – February 2022. By Dan Brdar, 17. February. Available at: https://www.nasdaq.com/ articles/renewable-energy-news-update-february-2022 National Centers for Environmental Information – NOAA (2022) Billion-Dollar Weather and Climate Disasters. https://www.ncei. noaa.gov/access/billions/ NOAA GML (2022) Trends in Atmospheric Carbon Dioxide. https:// gml.noaa.gov/ccgg/trends/global.html NDRC–NationalDevelopmentandReformCommission(2021) WorkingGuidanceforCarbonDioxidePeakingandCarbonNeutrality inFullandFaithfulImplementationoftheNewDevelopmentPhiloso- phy.https://en.ndrc.gov.cn/policies/202110/t20211024_1300725.html NREL – National Renewable Energy Laboratory (2020) Exploring renewable energy opportunities in select Southeast Asian countries — A Geospatial Analysis of the Levelized Cost of Energy of Utility-Scale Wind and Solar Photovoltaics. https://www.nrel.gov/docs/ fy19osti/71814.pdf Net Zero Tracker (2022) Net Zero Stocktake 2022. June. https:// zerotracker.net/analysis/net-zero-stocktake-2022 NewsFirst (2022) Long-term investments in Sri Lanka are India’s plan to fix economic crisis. By Zulfick Farzan, 26. July. Available at: https://www.newsfirst.lk/2022/07/26/long-term-investments-in- sri-lanka-are-indias-plan-to-fix-economic-crisis/ NYT – New York Times (2022) An extraordinary heat wave exposes the limits of protecting people. In: Climate Forward Newsletter, April. Available at: https://www.nytimes.com/2022/05/03/climate/ india-heat-wave.html NYT (2021) Why the Markets Need a Strong Government Hand. By Robert H. Frank, 2. April. Available at: https://www.nytimes. com/2021/04/02/business/markets-strong-government.html NYT (2018) In India, Summer Heat May Soon Be Literally Unbearable. By Somini Sengupta, 17. July. Available at: https://www.nytimes. com/2018/07/17/climate/india-heat-wave-summer.html Porthos (2021) Dutch government supports Porthos customers with SDE++ subsidy reservation. https://www.porthosco2.nl/en/ dutch-government-supports-porthos-customers-with-sde-subsi- dy-reservation/ Recharge (2022) 'Mega projects': Azerbaijan and Masdar eye Caspian offshore wind and hydrogen in 10GW pact. By Andrew Lee, 6. June. Available at: https://www.rechargenews.com/energy-tran- sition/mega-projects-azerbaijan-and-masdar-eye-caspian-off- shore-wind-and-hydrogen-in-10gw-pact/2-1-1232334 Reuters (2022) Emerging nations warn high energy costs could threaten emissions targets. Available at: https://www.reuters.com/ business/environment/emerging-nations-warn-high-energy-costs- could-threaten-emissions-targets-2022-07-14/ Reuters (2021) Saudi Arabia wants to be top supplier of hydrogen – energy minister. Available at: https://www.reuters.com/business/ energy/saudi-arabia-wants-be-top-supplier-hydrogen-ener- gy-minister-2021-10-24/ References
  • 177.
    352 DNV Energy TransitionOutlook 2022 353 Rockström, J. and Gaffney, O. (2021) Breaking boundaries — The science of our planet. Penguin Random House Rosenow, J. and Eyre, N. (2016) “A post mortem of the Green Deal: Austerity, energy efficiency, and failure in British energy policy”. Energy Research Social Science, Vol. 21, November. https://doi. org/10.1016/j.erss.2016.07.005 Smart Energy Europe and DNV (2022) Demand-side flexibility in the EU: Quantification of benefits in 2030. September. ©2022 smartEn Smart Energy Europe. SP Global (2021a) Siemens Energy, Masdar to build pilot UAE hydrogen plant by 2022, with focus on SAF. By Dania Saadi, 6. May. Available at: https://www.spglobal.com/commodityinsights/en/ market-insights/latest-news/electric-power/050621-siemens-ener- gy-masdar-to-build-pilot-uae-hydrogen-plant-by-2022-with-focus- on-saf SP Global (2021b) World's largest renewable hydrogen developer adds 25-GW Oman export project. By James Burgess, 18. May. Available at: https://www.spglobal.com/commodityinsights/en/ market-insights/latest-news/petrochemicals/051821-worlds-larg- est-renewable-hydrogen-developer-adds-25-gw-oman-ex- port-project SP Global (2021c) COP26: UAE targets 25% of global low-carbon hydrogen market by 2030. By James Burgess, 4. November. Available at: https://www.spglobal.com/commodityinsights/en/ market-insights/latest-news/electric-power/110421-cop26-uae- targets-25-of-global-low-carbon-hydrogen-market-by-2030 SP Global (2021d) Path to net-zero: Stakeholders demand action on ambitions as pledges swell. By Taylor Kuykendall, 13. December. Available at: https://www.spglobal.com/marketintelligence/en/ news-insights/latest-news-headlines/path-to-net-zero-stakehold- ers-demand-action-on-ambitions-as-pledges-swell-67951124 SolarReviews (2022) President Biden takes executive action to boost solar — what will it mean for homeowners. 6. July. Available at: https://www.solarreviews.com/blog/president-biden-execu- tive-orders-on-solar State Council (2021) Carbon Peak Action Plan for 2030. 24. October. http://www.gov.cn/zhengce/content/2021-10/26/ content_5644984.htm State of California (2022) 2022-2023 Governor’s Budget — Climate Change. https://www.ebudget.ca.gov/2022-23/pdf/BudgetSum- mary/ClimateChange.pdf Swiss Re Group (2021) The economics of climate change: impacts for Asia. By Cherie Grey Thomas Heller. 21. May. Available at: https://www.swissre.com/risk-knowledge/mitigating-climate-risk/ economics-of-climate-change-impacts-for-asia.html SYSTEMIQ (2022) ReShaping Plastics: Pathways to a Circular, Climate Neutral Plastics System in Europe TAQA (2021a) TAQA Group and Abu Dhabi Ports Planning 2 GW Green Hydrogen to Ammonia Project. Available at: https://www. taqa.com/wp-content/uploads/2022/01/20210707_TAQA-AD- Ports-Green-Hydrogen-PRL-En.pdf TAQA (2021b) TAQA Group, Emirates Steel to Enable the Region’s First Green Steel Manufacturing. Available at: https://www.taqa. com/press-releases/greensteel/ Thaler, Richard H. (2015) Misbehaving: the making of behavioral economics. New York, NY: Norton and Company UN – United Nations (2022a) Expert Group on the net-zero emissions commitments of non-state entities. Statement 31. March. https:// www.un.org/sg/en/content/sg/personnel-appoint- ments/2022-03-31/expert-group-the-net-zero-emissions-commit- ments-of-non-state-entities%C2%A0 UN (2022b) Full transcript of Secretary-General's press encounter after Global Crisis Response Group Roundtable and Leaders’ Roundtable on Climate Change. 21. September. https://www.un. org/sg/en UN (2021) World Population Prospects. Department of Economic and Social Affairs, Population Division. https://population.un.org/ wpp/ UNCTAD – United Nations Conference on Trade and Development (2021) State of Commodity Dependence 2021. https://unctad.org/ system/files/official-document/ditccom2021d2_en.pdf UNEP – United Nations Environment Programme (2021) Emissions Gap Report. https://www.unep.org/resources/emissions-gap-re- port-2021 UNEP and Climate and Clean Air Coalition (2021) Global Methane Assessment: Benefits and Costs of Mitigating Methane Emissions, Nairobi: United Nations Environment Programme UNEP and IEA (2020) GlobalABC Regional Roadmap for Buildings and Construction in Asia 2020-2050. https://globalabc.org/sites/ default/files/inline-files/Asia_Buildings%20Roadmap_FINAL.pdf UNFCCC – United Nations Framework Convention on Climate Change (2021a) Glasgow Climate Pact. https://unfccc.int/sites/ default/files/resource/cma2021_10_add1_adv.pdf UNFCCC (2021b) Compilation of good practices and lessons learned on international collaborative research, development and demonstration initiatives of climate technology. https://unfccc.int/ ttclear/tec/rdandr University of Cambridge (2022) Cambridge Bitcoin Electricity Consumption Index. https://ccaf.io/cbeci/index USGS – U.S. Geological Survey (2020) Mineral commodity summaries 2020., https://pubs.usgs.gov/periodicals/ mcs2020/mcs2020.pdf Ürge-Vorsatz et al. (2015) “Heating and cooling energy trends and drivers in buildings”. Renewable and Sustainable Energy Reviews. Vol 41. January. https://doi.org/10.1016/j.rser.2014.08.039 Vakulchuk, R. and Overland, I. (2021) Central Asia is a missing link in analyses of critical materials for the global clean energy transition. https://www.cell.com/action/showPd- f?pii=S2590-3322%2821%2900660-6 van Vuuren, D. et al. (2011) “The representative concentration pathways: an overview”. Climatic Change, Vol. 109. August. https:// link.springer.com/article/10.1007/s10584-011-0148-z Way, R. et al. (2022): Empirically grounded technology forecasts and the energy transition. Joule, Vol. 6, Issue 9. https://doi. org/10.1016/j.joule.2022.08.009 Weatherby, C., (2020) Renewable Energy in Southeast Asia, Written in Powering Southeast Asia — Meeting the Region’s Electricity Needs’. Available at: https://www.nbr.org/publication/power- ing-southeast-asia-introduction/ World Bank (2022a) Global Economic Prospects. June. ©World Bank, Washington DC. World Bank (2022b) State and Trends of Carbon Pricing 2022. May. ©World Bank, Washington, DC. World Bank (2019) Classifying countries by income. By Espen Prydz Divyanshi Wadhwa. 9. September. Available at: https://datatop- ics.worldbank.org/world-development-indicators/stories/ the-classification-of-countries-by-income.html WBCSD – World Business Council for Sustainable Development (2022) H2Zero — Hydrogen Pledges. https://www.wbcsd.org/ Programs/Climate-and-Energy/Hydrogen-Pledges World Energy Council (2022) World Energy Pulse 2022. https:// www.worldenergy.org/world-energy-pulse-2022 WEF – World Economic Forum (2021) Financing the transition to a net-zero future. Insight report in collaboration with Oliver Wyman, October. https://www3.weforum.org/docs/WEF_Financing_the_ Transition_to_a_Net_Zero_Future_2021.pdf WEF (2020) Clean skies for tomorrow, Sustainable aviation fuels as a pathway to net zero aviation. November ©2020 World Economic Forum WRI – World Resources Institute (2022a) Trends show companies are ready for scope 3 reporting with US Climate Disclosure Rule. https:// www.wri.org/update/trends-show-companies-are-ready-scope-3- reporting-us-climate-disclosure-rule WRI (2022b) World Greenhouse Gas Emissions in 2019. https://www. wri.org/data/world-greenhouse-gas-emissions-2019 World Steel (2019) Total production of crude steel. Available at: https://www.worldsteel.org/ World Trade Organization (2022) The crisis in Ukraine — Implications of the war for global trade and development. https://www.wto.org/ english/res_e/booksp_e/imparctukraine422_e.pdf Zawya (2021) PROJECTS: Oman Hydrogen Strategy envisages $34bln investment in green hydrogen. By Sowmya Sundar, 1. December. Available at: https://www.zawya.com/en/projects/ projects-oman-hydrogen-strategy-envisages-34bln-invest- ment-in-green-hydrogen-fb2glvou References Historical data This work is partly based on the World Energy Balances database developed by the International Energy Agency© OECD/IEA 2022, but the resulting work has been prepared by DNV and does not necessarily reflect the views of the International Energy Agency. For energy-related charts, historical (up to and includ- ing 2021) numerical data is mainly based on IEA data from World Energy Balances© OECD/ IEA 2022, www. iea.org/ statistics, License: www.iea. org/tc; as modified by DNV.
  • 178.
    354 DNV Energy TransitionOutlook 2022 ANNEX 355 The project team CORE CONTRIBUTORS FROM DNV: Steering committee: Remi Eriksen, Ditlev Engel, Ulrike Haugen, Trond Hodne, Liv Hovem, Jin James Huang Project director: Sverre Alvik (sverre.alvik@dnv.com) Modelling responsible: Onur Özgün Core modelling- and research team and contributing authors: Bent Erik Bakken, Kaveh Dianati, Thomas Horschig, Anne Louise Koefoed, Erica McConnell, Mats Rinaldo, Sujeetha Selvakkumaran, Adrien Zambon Communication responsible and editor: Mark Irvine (mark.irvine@dnv.com) Reference group: Peter Bjerager, Theo Bosma, Lucy Craig, Al-Karim Govindji, Jan Kvålsvold, Pierre C. Sames, Rune Torhaug Energy Systems: Jørg Aarnes, Kjersti Aarrestad, Mario A. Acevedo, Carlos Albero, Aasta Andreassen, Mohammed Atif, Alireza Bayat, Sarah Barber, Graham Bennett, Frida Berglund, Mario Andrés Bilbao, Jørgen Bjørndalen, Santiago Blanco, Mattia Boccolini, Peter Brun, Marco Ceriotto, Ben Chivers, Nicholas Cole, Jochum Douma, Magnus Ebbesen, Ken Elser, Yerún Fernández, Maja Frost, Rob van Gerwen, Marta Ramos Gomez, Jason Goodhand, Simen Loe Heggen, Christian Hewicker, Daniel Antonio Herrmann, Tchiarles Coutinho Hilbig, Eckhard Hinrichsen, Alexandre Imperial, Michael Johnson, Magnus Killingland, Sarah Karen Kimpton, Alok Kumar, James Thornton Laybourn, Thomas Leonard, Ingrid Bye Løken, Nicholas Marquet, Jennifer McWilliams, Melissa Morrison, Rohit Nair, Benoit Nguyen, Albert van den Noort, Dana Olson, Camiel Oremus, Jeremy Parkes, Kevin Dave Peiris, Mitchell Rosenberg, Matthew Rowe, Varadaraj Salian, Graham Slack, Bart Stoffer, Christopher Taylor, Corin Taylor, Anil Thomas, Nellie Tong, Yukinobu Uchida, Ton van Wingerden, Yongtao Yang, Naim Youssef, Wen Qian Zhou, Jan Zschommler, Roel Jouke Zwart Maritime: Eirik Ovrum (Maritime project manager), Kjersti Aalbu, Christos Chryssakis, Helge Drösemeyer, Magnus S. Eide, Øyvind Endresen, Henrik Helgesen, Kristian Hammer, Linda Hammer, Håkon Hustad, Marius Lesiner, Tore Longva, Eirik Nyhus, Sharin Osman, Nikolai Hydle Rivedal, Øyvind Sekkesæter, Terje Sverud, Jakub Walenkiewicz, Martin Wold Group Technology and Research: Hendrik Brinks, Ida Synnøve Bukkholm, Marcel Eijgelaar, Erik Andreas Hektor, Frank Børre Pedersen, Tianyu Wang Group Government and Public Affairs: Lars Almklov, Per Busk Christiansen, Jerome Colombe, Rob Coveney, Magnus Dahlen, Joyce Dalgarno, Thomas Fries, Caroline Kamerbeek, Peter Lovegrove, Christian Parker, Steven Sawhill, Jeanette Schäfer, Laure Simonnot, Neil Slater, Therese Sanni, Dag Thorstensen, Anne Vandbakk, Ros Williamson, Charlotte Zwick Our external collaboration network for our 2022 Outlook includes: Henok Asmelash (University of Birmingham), Per Brevik (Heidelberg Cement), Maria Paula de Barros Cantusio (Santander), Alejandro Falkner (Enel), Kirsty Gogan and Eric Ingersoll (TerraPraxis), Wolfgang Lutz (Wittgenstein Centre for Demography and Global Human Capital), Alessio Pastore (Enel), Glen Peters (CICERO), Knut Einar Rosendal (NMBU), KC Samir (Wittgenstein Centre for Demography and Global Human Capital), Philip de Smedt (Cefic), Nick Stansbury (LGIM), Yongping Zai (Tencent). This report has been prepared by DNV as a cross-disciplinary exercise between the DNV Group and our business areas of Energy Systems and Maritime across 20 countries. The core model development and research have been conducted by a dedicated team in our Energy Transition Outlook research unit, part of the Group Research Development division, based in Oslo, Norway. In addition, we have been assisted by external energy transition experts, with the core names listed below: THE PROJECT TEAM OTHER ENERGY TRANSITION OUTLOOK 2022 REPORTS Maritime forecast to 2050 The 2022 Maritime Forecast to 2050 presents an updated outlook on regulations, drivers, technologies and fuel availability. From that, a new and extended fuel-mix scenario library has been created, with each scenario describing a possible future fleet composition, its energy use and fuel mix, and emissions to 2050. The library can be applied to DNV’s updated Carbon-Risk-Framework and supports shipowners in their decision making. Hydrogen forecast to 2050 DNV’s new report on hydrogen supply and demand and its role in decarbonization. The report details, inter alia, policy driving the rise of hydrogen ecosystems, develop- ments in approaches to safety, technical aspects of production, storage and transport of hydrogen, expected developments in the regional and international trade of hydrogen and its derivatives, and a comparison of various hydrogen value chains. Published by DNV AS. Design: SDG/McCann Oslo/Infogr8. Images: Cover: Gettyimages, p. 11, 18, 21, 36, 51, 53, 57, 58, 82, 92, 98, 103, 104, 124, 174, 197, 215, 222, 224, 227, 230, 235, 239, 242, 257, 259, 273, 274, 281, 283, 289, 292, 301, 303, 320, 323, 324, 331: Getty Images, p. 31, 43, 96,154, 155, 160, 162, 239, 236, 246, 254, 260, 271, 284 : Shutterstock, p. 14: Unsplash, Joey Kyber, p. 24: Volvo Trucks, p 45: Unsplash, Ashwini Chaudhary, p. 47 Unsplash, Daniel Smyth, p. 55: Quantafuel, p. 70: Unsplash/Czar Nyiko, p. 79: HydrogenPro, p. 89: Unsplash/Andreas Gucklhorn, p. 138: Unsplash/Harold Mendoza, p. 166: Climeworks, p. 171: UN/Mark Garten, p. 179: Unsplash/Olha fedchenko, p. 219: Unsplash/Jan Antonin, p. 245: Unsplash/ William Felipe, p. 256: Unsplash/Marek Piwnicki, p. 311: Unsplash/Arnab Dey, p. 313: Unsplash/Ashwini Chaudhary, p. 314: Unsplash/Jia Le SwuI.
  • 179.
    Headquarters: DNV AS NO-1322 Høvik,Norway Tel: +47 67 57 99 00 www.dnv.com The trademarks DNV® and Det Norske Veritas® are the properties of companies in the Det Norske Veritas group. All rights reserved. DNV is a global quality assurance and risk management company. Driven by our purpose of safeguarding life, property and the environment, we enable organizations to advance the safety and sustainability of their business. We provide classification, technical assurance, software and independent expert advisory services to the maritime, oil gas, power and renewables industries. We also provide certification, supply chain and data management services to customers across a wide range of industries. Combining technical, digital and operational expertise, risk methodology and in-depth industry knowledge, we empower our customers’ decisions and actions with trust and confidence. We continuously invest in research and collaborative innovation to provide customers and society with operational and technological foresight. With origins stretching back to 1864 and operations in more than 100 countries, our experts are dedicated to helping customers make the world safer, smarter and greener. dnv.com/eto About DNV The trademarks DNV® and Det Norske Veritas® are the properties of companies in the Det Norske Veritas group. All rights reserved. Headquarters: DNV AS NO-1322 Høvik, Norway Tel: +47 67 57 99 00 www.dnv.com DNV is an independent assurance and risk management provider, operating in more than 100 countries, with the purpose of safeguarding life, property, and the environment. Whether assessing a new ship design, qualifying technology for a floating wind farm, analysing sensor data from a gas pipeline or certifying a food company's supply chain, DNV enables its customers and their stakeholders to manage technological and regulatory complexity with confidence. As a trusted voice for many of the world’s most successful organizations, we use our broad experience and deep expertise to advance safety and sustainable performance, set industry standards, and inspire and invent solutions. dnv.com/eto