TheChanging
JouleDynamic
Five portfolio plays to help oil and gas companies
win in the new energy transition
The Changing Joule Dynamic | 2
This “energy transition” is different
The world has witnessed multiple energy transitions in the past century.
But the one we’re currently experiencing is different. It is:
• Driven by new demand dynamics (not changes in supply)
• Fueled by an urgency to act on climate change
• Occurring at a time of extraordinary technology advancements (particularly in
renewable generation and energy storage)
Together, these drivers are setting the stage for a more diverse, localized and multi-fuel
energy system.
Copyright © 2022 Accenture. All rights reserved.
The Changing Joule Dynamic |
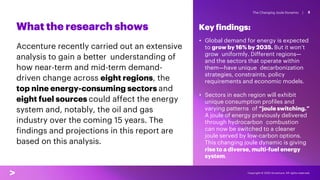
What the research shows
3
Accenture recently carried out an extensive
analysis to gain a better understanding of
how near-term and mid-term demand-
driven change across eight regions, the
top nine energy-consuming sectors and
eight fuel sources could affect the energy
system and, notably, the oil and gas
industry over the coming 15 years. The
findings and projections in this report are
based on this analysis.
Key findings:
• Global demand for energy is expected
to grow by 16% by 2035. But it won’t
grow uniformly. Different regions—
and the sectors that operate within
them—have unique decarbonization
strategies, constraints, policy
requirements and economic models.
• Sectors in each region will exhibit
unique consumption profiles and
varying patterns of “joule switching.”
A joule of energy previously delivered
through hydrocarbon combustion
can now be switched to a cleaner
joule served by low-carbon options.
This changing joule dynamic is giving
rise to a diverse, multi-fuel energy
system.
Copyright © 2022 Accenture. All rights reserved.
The Changing Joule Dynamic | 4
The future of oil and gas
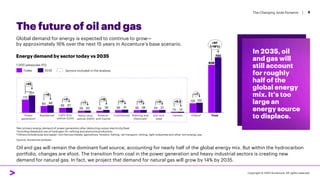
In 2035, oil
and gas will
still account
for roughly
half of the
global energy
mix. It’s too
large an
energy source
to displace.
Oil and gas will remain the dominant fuel source, accounting for nearly half of the global energy mix. But within the hydrocarbon
portfolio, changes are afoot. The transition from coal in the power generation and heavy industrial sectors is creating new
demand for natural gas. In fact, we project that demand for natural gas will grow by 14% by 2035.
Global demand for energy is expected to continue to grow—
by approximately 16% over the next 15 years in Accenture’s base scenario.
Energy demand by sector today vs 2035
Sectors included in the analysis
Today 2035
1,000 petajoules (PJ)
Copyright © 2022 Accenture. All rights reserved.
iNet primary energy demand of power generation after deducting output electricity/heat.
iiIncluding feedstock use of hydrogen for refining and ammonia production.
iiiOthers include pulp and paper, non-ferrous metals, agriculture, forestry, fishing, rail transport, mining, light industries and other non-energy use.
Source: Accenture analysis.
The Changing Joule Dynamic |
A new reality…
5
The homogenous energy system we’ve grown accustomed
to is becoming much more heterogeneous. The new system
will enable consumers to tap different sources of energy to
meet the needs of different industries and geographies.
The role for both oil and gas will no longer be globally pre-
ordained but determined on a region-by-region and sector-
by-sector basis.
Copyright © 2022 Accenture. All rights reserved.
The Changing Joule Dynamic |
… requires a new approach to
making decisions, allocating
capital and diversifying
portfolios
6
To compete in the energy future where there are several
energy sources, oil and gas companies need to base their
decisions on a standardized measure (such as on a per-joule
basis) of how, where and when energy is consumed. This
shift requires a keen understanding of the market-by-
market joule consumption of different regions and sectors.
And that’s not always easy to come by.
Beyond differences in
regional and sector demand
profiles, oil and gas
companies need to
accommodate varying
country regulations,
technology advancements
and investor pressures. Each
of these factors contributes
to even greater
heterogeneity—and
complexity—in the energy
market.
Copyright © 2022 Accenture. All rights reserved.
The Changing Joule Dynamic | 7
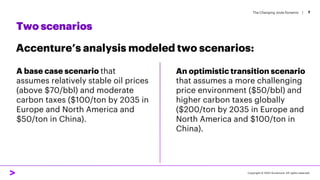
Two scenarios
Accenture’s analysis modeled two scenarios:
Copyright © 2022 Accenture. All rights reserved.
A base case scenario that
assumes relatively stable oil prices
(above $70/bbl) and moderate
carbon taxes ($100/ton by 2035 in
Europe and North America and
$50/ton in China).
An optimistic transition scenario
that assumes a more challenging
price environment ($50/bbl) and
higher carbon taxes globally
($200/ton by 2035 in Europe and
North America and $100/ton in
China).
The Changing Joule Dynamic | 8
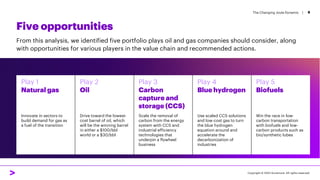
Play 1
Natural gas
Play 2
Oil
Play 3
Carbon
capture and
storage (CCS)
Play 4
Blue hydrogen
Play 5
Biofuels
Innovate in sectors to
build demand for gas as
a fuel of the transition
Drive toward the lowest-
cost barrel of oil, which
will be the winning barrel
in either a $100/bbl
world or a $30/bbl
Scale the removal of
carbon from the energy
system with CCS and
industrial efficiency
technologies that
underpin a flywheel
business
Use scaled CCS solutions
and low-cost gas to turn
the blue hydrogen
equation around and
accelerate the
decarbonization of
industries
Win the race in low-
carbon transportation
with biofuels and low-
carbon products such as
bio/synthetic lubes
Five opportunities
From this analysis, we identified five portfolio plays oil and gas companies should consider, along
with opportunities for various players in the value chain and recommended actions.
Copyright © 2022 Accenture. All rights reserved.
The Changing Joule Dynamic | 9
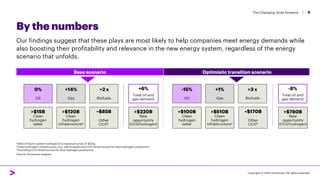
By the numbers
Base scenario Optimistic transition scenario
0%
Oil
+14%
Gas
>2 x
Biofuels
>$15B
Clean
hydrogen
salesi
~$85B
Other
CCSiii
+6%
Total oil and
gas demand
>$220B
New
opportunity
(CCS/hydrogen)
-15%
Oil
+1%
Gas
>3 x
Biofuels
>$100B
Clean
hydrogen
salesi
~$170B
Other
CCSiii
-8%
Total oil and
gas demand
>$780B
New
opportunity
(CCS/hydrogen)
>$120B
Clean
hydrogen
infrastructureii
>$510B
Clean
hydrogen
infrastructureii
iSales of blue or green hydrogen at a maximum price of $2/kg.
iiGreen hydrogen infrastructure; e.g., electrolyzers and CCS infrastructure for blue hydrogen production.
iiiExcluding CCS infrastructure for blue hydrogen production
Source: Accenture analysis.
.
Our findings suggest that these plays are most likely to help companies meet energy demands while
also boosting their profitability and relevance in the new energy system, regardless of the energy
scenario that unfolds.
Copyright © 2022 Accenture. All rights reserved.
The Changing Joule Dynamic |
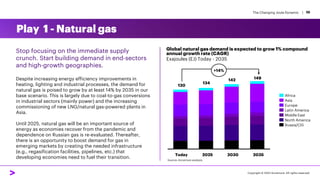
Play 1 - Natural gas
Stop focusing on the immediate supply
crunch. Start building demand in end-sectors
and high-growth geographies.
Despite increasing energy efficiency improvements in
heating, lighting and industrial processes, the demand for
natural gas is poised to grow by at least 14% by 2035 in our
base scenario. This is largely due to coal-to-gas conversions
in industrial sectors (mainly power) and the increasing
commissioning of new LNG/natural gas-powered plants in
Asia.
Until 2025, natural gas will be an important source of
energy as economies recover from the pandemic and
dependence on Russian gas is re-evaluated. Thereafter,
there is an opportunity to boost demand for gas in
emerging markets by creating the needed infrastructure
(e.g., regasification facilities, pipelines, etc.) that
developing economies need to fuel their transition.
Global natural gas demand is expected to grow 1% compound
annual growth rate (CAGR)
Exajoules (EJ) Today - 2035
Today 2025 2030 2035
149
130
134
142
+14%
Africa
Middle East
Europe
Asia
Latin America
North America
Russia/CIS
Source: Accenture analysis.
10
Copyright © 2022 Accenture. All rights reserved.
The Changing Joule Dynamic | 11
Play 1 - Natural gas
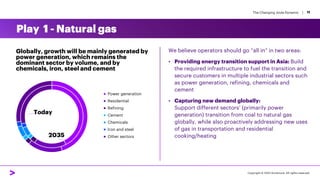
We believe operators should go “all in” in two areas:
• Providing energy transition support in Asia: Build
the required infrastructure to fuel the transition and
secure customers in multiple industrial sectors such
as power generation, refining, chemicals and
cement
• Capturing new demand globally:
Support different sectors’ (primarily power
generation) transition from coal to natural gas
globally, while also proactively addressing new uses
of gas in transportation and residential
cooking/heating
Globally, growth will be mainly generated by
power generation, which remains the
dominant sector by volume, and by
chemicals, iron, steel and cement
Power generation
Residential
Refining
Cement
Chemicals
Iron and steel
Other sectors
Today
2035
Copyright © 2022 Accenture. All rights reserved.
The Changing Joule Dynamic | 12
Stop focusing on the oil super cycle. Start focusing on oil
for all cycles by building the lowest-cost and lowest-
carbon oil supply.
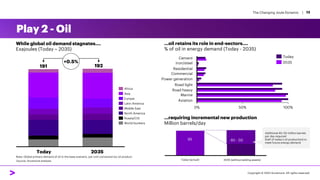
We expect demand for oil to peak the late 2020s and decline back to 2021
levels by 2035. However, while oil demand will plateau by 2035, the world
will require approximately 14-18 billion barrels of “new oil” in 2035 to
replace production from depleted assets. That is approximately equivalent
to half of the current worldwide oil production.
In the short term, contrary to some expectations, there will likely not be
major shifts in consumer demand for oil in key sectors such as road
transportation. Rather, two region-sector clusters—petrochemical
feedstocks in Asia and heavy transportation globally—will drive growth in
oil demand by volume.
Looking ahead, operators should continue to focus on break-even costs to
fund the incremental production required to meet the demand for oil.
In the near-term, we believe operators
should zero in on:
Competing to meet petrochemical
feedstock and heavy transportation
demand with the lowest break-evens:
Invest in reducing the break-even cost
of oil and focus on targeting the
rapidly growing demand for
petrochemical feedstocks and heavy
transportation, mainly in Asia.
Play 2 - Oil
Copyright © 2022 Accenture. All rights reserved.
The Changing Joule Dynamic | 13
95
While global oil demand stagnates….
Exajoules (Today – 2035)
…requiring incremental new production
Million barrels/day
2035 (without adding assets)
Today (actual)
40 - 50
Additional 40–50 million barrels
per day required
(half of today’s oil production) to
meet future energy demand
0% 50% 100%
Road heavy
Road light
Cement
Iron/steel
Commercial
Residential
Power generation
Marine
Aviation
2035
Today
…oil retains its role in end-sectors….
% of oil in energy demand (Today - 2035)
2035
Today
191 192
Africa
Asia
Russia/CIS
Europe
Middle East
Latin America
North America
World bunkers
Note: Global primary demand of oil in the base scenario, per-unit conversion by oil product.
Source: Accenture analysis.
Copyright © 2022 Accenture. All rights reserved.
Play 2 - Oil
+0.5%
The Changing Joule Dynamic | 14
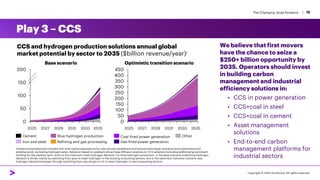
Stop viewing CCS as a negative emissions support technology. Start seeing
carbon management and industrial efficiency technology as a $250+ billion
business.
Three types of technologies underpin the energy market’s transformation: carbon capture solutions, industrial
efficiency solutions and fuel-switching solutions.
Our analysis estimates that reaching a net-zero world by 2050 will require between three and 10 billion tons of
CCS capacity per year, up to 200 times the current capacity. By 2035, that number will be 70 to 90 times the
current capacity.1
Our analysis also predicts that the demand for industrial efficiency and end-to-end carbon management
technologies will surge, with players of all types (i.e., oil and gas operators, oilfield equipment and services
companies, industrial control providers, enterprise software providers and others) fiercely competing to
differentiate themselves in what will be a $150+ billion market by the middle of the decade.
Play 3 – CCS
Copyright © 2022 Accenture. All rights reserved.
1“Decarbonizing Energy: From A to Zero”, Accenture 2020.
The Changing Joule Dynamic | 15
We believe that first movers
have the chance to seize a
$250+ billion opportunity by
2035. Operators should invest
in building carbon
management and industrial
efficiency solutions in:
• CCS in power generation
• CCS+coal in steel
• CCS+coal in cement
• Asset management
solutions
• End-to-end carbon
management platforms for
industrial sectors
Play 3 – CCS
iInfrastructure/solutions includes first-time capital expenditure for new annual installations and annual technology operation and maintenance for
existing stock, excluding hydrogen sales. Adoption based on payback-driven bass diffusion analysis on CCS adoption including additional government
funding for the medium term, built on the maximum clean hydrogen demand. For blue hydrogen production, in the base scenario underlying hydrogen
demand is driven mainly by switching from gray to clean hydrogen in the existing consuming sectors, and in the optimistic transition scenario new
hydrogen demand emerges through switching from natural gas or oil to clean hydrogen in new consuming sectors.
0
50
100
150
200
250
300
350
400
450
2025 2027 2029 2035
2031 2033
Base scenario
0
50
100
150
200
2025 2029
2027 2031 2033 2035
Iron and steel
Cement Blue hydrogen production
Refining and gas processing
Coal-fired power generation
Gas-fired power generation
Other
CCS and hydrogen production solutions annual global
market potential by sector to 2035 ($billion revenue/year)i
Optimistic transition scenario
Copyright © 2022 Accenture. All rights reserved.
The Changing Joule Dynamic | 16
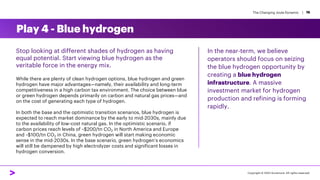
Stop looking at different shades of hydrogen as having
equal potential. Start viewing blue hydrogen as the
veritable force in the energy mix.
While there are plenty of clean hydrogen options, blue hydrogen and green
hydrogen have major advantages—namely, their availability and long-term
competitiveness in a high carbon tax environment. The choice between blue
or green hydrogen depends primarily on carbon and natural gas prices—and
on the cost of generating each type of hydrogen.
In both the base and the optimistic transition scenarios, blue hydrogen is
expected to reach market dominance by the early to mid-2030s, mainly due
to the availability of low-cost natural gas. In the optimistic scenario, if
carbon prices reach levels of ~$200/tn CO2 in North America and Europe
and ~$100/tn CO2 in China, green hydrogen will start making economic
sense in the mid-2030s. In the base scenario, green hydrogen’s economics
will still be dampened by high electrolyzer costs and significant losses in
hydrogen conversion.
In the near-term, we believe
operators should focus on seizing
the blue hydrogen opportunity by
creating a blue hydrogen
infrastructure. A massive
investment market for hydrogen
production and refining is forming
rapidly.
Play 4 - Blue hydrogen
Copyright © 2022 Accenture. All rights reserved.
The Changing Joule Dynamic | 17
Play 4 - Blue hydrogen
0
200
400
600
800
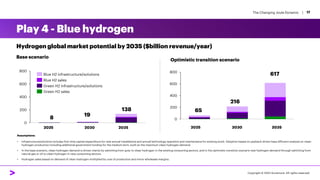
Hydrogen global market potential by 2035 ($billion revenue/year)
Assumptions:
• Infrastructure/solutions includes first-time capital expenditure for new annual installations and annual technology operation and maintenance for existing stock. Adoption based on payback-driven bass diffusion analysis on clean
hydrogen production including additional government funding for the medium term, built on the maximum clean hydrogen demand.
• In the base scenario, clean hydrogen demand is driven mainly by switching from grey to clean hydrogen in the existing consuming sectors, and in the optimistic transition scenario new hydrogen demand through switching from
natural gas or oil to clean hydrogen in new consuming sectors.
• Hydrogen sales based on demand of clean hydrogen multiplied by cost of production and minor wholesale margins.
Optimistic transition scenario
Base scenario
2035
2030
2025
65
216
617
0
200
400
600
800
2025 2030 2035
8
19
138
Green H2 sales
Blue H2 infrastructure/solutions
Blue H2 sales
Green H2 infrastructure/solutions
Copyright © 2022 Accenture. All rights reserved.
The Changing Joule Dynamic | 18
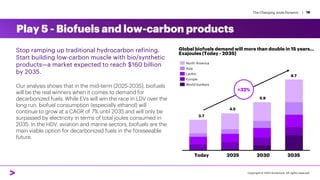
Stop ramping up traditional hydrocarbon refining.
Start building low-carbon muscle with bio/synthetic
products—a market expected to reach $160 billion
by 2035.
Our analysis shows that in the mid-term (2025-2035), biofuels
will be the real winners when it comes to demand for
decarbonized fuels. While EVs will win the race in LDV over the
long run, biofuel consumption (especially ethanol) will
continue to grow at a CAGR of 7% until 2035 and will only be
surpassed by electricity in terms of total joules consumed in
2035. In the HDV, aviation and marine sectors, biofuels are the
main viable option for decarbonized fuels in the foreseeable
future.
Play 5 - Biofuels and low-carbon products
Global biofuels demand will more than double in 15 years…
Exajoules (Today - 2035)
3.7
Today 2025 2030
4.5
2035
5.9
8.7
+32%
World bunkers
Europe
North America
Asia
LatAm
Copyright © 2022 Accenture. All rights reserved.
The Changing Joule Dynamic | 19
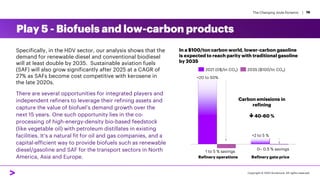
Specifically, in the HDV sector, our analysis shows that the
demand for renewable diesel and conventional biodiesel
will at least double by 2035. Sustainable aviation fuels
(SAF) will also grow significantly after 2025 at a CAGR of
27% as SAFs become cost competitive with kerosene in
the late 2020s.
There are several opportunities for integrated players and
independent refiners to leverage their refining assets and
capture the value of biofuel’s demand growth over the
next 15 years. One such opportunity lies in the co-
processing of high-energy-density bio-based feedstock
(like vegetable oil) with petroleum distillates in existing
facilities. It’s a natural fit for oil and gas companies, and a
capital-efficient way to provide biofuels such as renewable
diesel/gasoline and SAF for the transport sectors in North
America, Asia and Europe.
Play 5 - Biofuels and low-carbon products
Refinery operations
1 to 5 % savings
Refinery gate price
+20 to 50%
+2 to 5 %
0– 0.5 % savings
2021 (0$/tn CO2) 2035 ($100/tn CO2)
In a $100/ton carbon world, lower-carbon gasoline
is expected to reach parity with traditional gasoline
by 2035
Carbon emissions in
refining
 40-60 %
Copyright © 2022 Accenture. All rights reserved.
The Changing Joule Dynamic |
Relevance matters
20
Copyright © 2022 Accenture. All rights reserved.
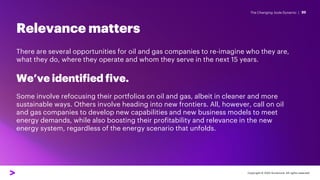
There are several opportunities for oil and gas companies to re-imagine who they are,
what they do, where they operate and whom they serve in the next 15 years.
We’ve identified five.
Some involve refocusing their portfolios on oil and gas, albeit in cleaner and more
sustainable ways. Others involve heading into new frontiers. All, however, call on oil
and gas companies to develop new capabilities and new business models to meet
energy demands, while also boosting their profitability and relevance in the new
energy system, regardless of the energy scenario that unfolds.
The Changing Joule Dynamic | 21
Methodology
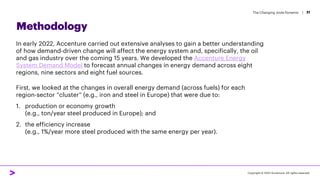
In early 2022, Accenture carried out extensive analyses to gain a better understanding
of how demand-driven change will affect the energy system and, specifically, the oil
and gas industry over the coming 15 years. We developed the Accenture Energy
System Demand Model to forecast annual changes in energy demand across eight
regions, nine sectors and eight fuel sources.
First, we looked at the changes in overall energy demand (across fuels) for each
region-sector “cluster” (e.g., iron and steel in Europe) that were due to:
1. production or economy growth
(e.g., ton/year steel produced in Europe); and
2. the efficiency increase
(e.g., 1%/year more steel produced with the same energy per year).
Copyright © 2022 Accenture. All rights reserved.
The Changing Joule Dynamic | 22
Next, we looked at the expected fuel switching and adoption of alternative fuels
across sectors, driven by an economic business case (e.g., investment in a gas-fired
process would likely replace a coal-fired process, generating annual savings in terms
of energy and carbon costs and positive net cashflow within limited number of years).
We assumed the resulting adoption of the new fuel (which included, for example,
“natural gas” or “coal+CCS”) would lead to an annual decline in demand for the
incumbent fuel (e.g., coal without CCS).
The model's key inputs include selected historical data from OECD, IEA, IRENA, EIA,
BEA, ILO, World Bank, UNSD, S&P Capital IQ, USAGov, Eurostat and selected national
statistical agencies including Destatis, NBS and UK Office of National Statistics.
Copyright © 2022 Accenture. All rights reserved.
The Changing Joule Dynamic |
Authors
23
Copyright © 2022 Accenture. All rights reserved.
The Changing Joule Dynamic | 24
Authors
Vivek Chidambaram
Managing Director
Strategy & Consulting,
Energy
Aleek Datta
Managing Director
Strategy & Consulting,
Energy
Rami ElDebs
Managing Director
Strategy & Consulting,
Energy
Sylvain Vaquer
Senior Manager
Strategy & Consulting,
Energy
Lasse Kari
Senior Principal
Accenture Research,
Energy
Special thanks to the following contributors:
Japun Ahluwalia, Anant Sharma, Sneha Agrawal, Andrew Cartey, Prasin Roy Chowdhury and Monika Kashyap.
Copyright © 2022 Accenture. All rights reserved.
The Changing Joule Dynamic |
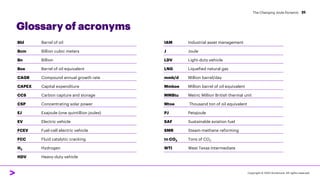
Bbl Barrel of oil
Bcm Billion cubic meters
Bn Billion
Boe Barrel of oil equivalent
CAGR Compound annual growth rate
CAPEX Capital expenditure
CCS Carbon capture and storage
CSP Concentrating solar power
EJ Exajoule (one quintillion joules)
EV Electric vehicle
FCEV Fuel-cell electric vehicle
FCC Fluid catalytic cracking
H2 Hydrogen
HDV Heavy-duty vehicle
IAM Industrial asset management
J Joule
LDV Light-duty vehicle
LNG Liquefied natural gas
mmb/d Million barrel/day
Mmboe Million barrel of oil equivalent
MMBtu Metric Million British thermal unit
Mtoe Thousand ton of oil equivalent
PJ Petajoule
SAF Sustainable aviation fuel
SMR Steam-methane reforming
tn CO2 Tons of CO2
WTI West Texas Intermediate
25
Glossary of acronyms
Copyright © 2022 Accenture. All rights reserved.
About Accenture
Accenture is a global professional services company with leading capabilities in digital,
cloud and security. Combining unmatched experience and specialized skills across more
than 40 industries, we offer Strategy and Consulting, Interactive, Technology and
Operations services—all powered by the world’s largest network of Advanced Technology
and Intelligent Operations centers. Our 674,000 people deliver on the promise of
technology and human ingenuity every day, serving clients in more than 120 countries. We
embrace the power of change to create value and shared success for our clients, people,
shareholders, partners and communities.
Visit us at accenture.com
Disclaimer
This content is provided for general information purposes and is not intended to be used
in place of consultation with our professional advisors.
This document refers to marks owned by third parties. All such third-party marks are the
property of their respective owners. No sponsorship, endorsement, or approval of this
content by the owners of such marks is intended, expressed or implied.
Copyright © 2022 Accenture. All rights reserved.
Accenture and its logo are registered trademarks of Accenture.