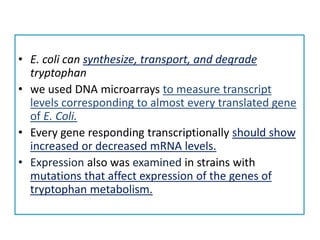
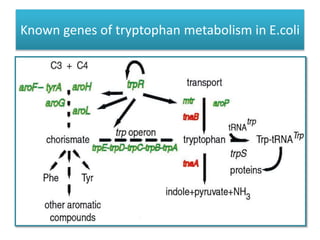
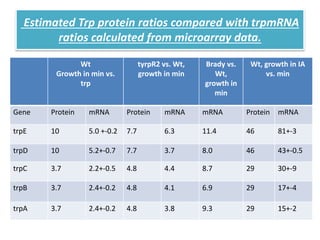
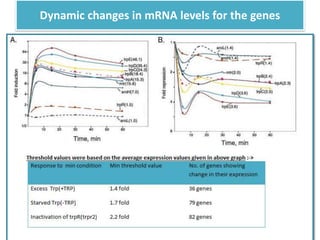
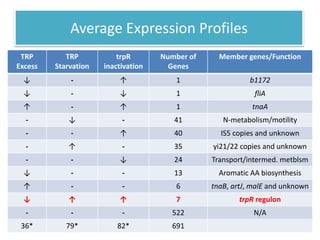
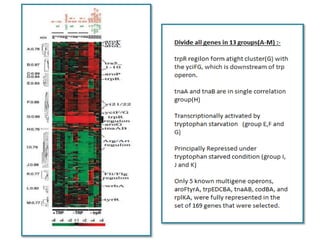
2. DNA MICROARRAYS
DNA microarrays are solid supports, usually of glass or silicon, upon which DNA is
attached in an organized grid fashion. Each spot of DNA, called a probe,
represents a single gene.
There are several synonyms of DNA microarrays such as DNA chips, gene chips,
DNA arrays, gene arrays and biochips.
Microarray technology evolved from Southern blotting, where fragmented DNA is
attached to a substrate and then probed with a known DNA sequence.
The use of miniaturized microarrays for gene expression profiling was first
reported in 1995, and a complete eukaryotic genome (Saccharomyces cerevisiae)
on a microarray was published in 1997
3. Principle
The principle of DNA microarrays lies on the hybridization
between the nucleotide. Using this technology the presence
of one genomic or cDNA sequence in 1,00,000 or more
sequences can be screened in a single hybridization.
The property of complementary nucleic acid sequences is to
specifically pair with each other by forming hydrogen bonds
between complementary nucleotide base pairs.
5. Types of DNA chips
1. cDNA based
microarray 2. Oligonucleotide
based microaaray
6. Microarray Data Analysis
• The goal of microarray image analysis is to extract intensity
descriptors from each spot that represent gene expression
levels and input features for further analysis. Biological
conclusions are then drawn based on the results from data
mining and statistical analysis of all extracted features.
Components of DNA Microarray image analysis are:
• Grid Alignment Problem
• Foreground Separation
• Quality Assurance
• Quantification
• Normalization
7. Microarray Data analysis
Input: Laser image scans (data) and underlying
experiment hypotheses or experiment designs .
Output: Conclusions about statistical behaviour of
measurements and thus the test of the hypotheses
or knowledge. The results are derived automatically
from data for subsequent model fitting.
9. Fluorescent DNA microarray images obtained from laser scanners
containing a 2D array of dots with two channels of 532nm (red) and
632nm (green) wavelengths.
10. DNA microarray analysis of gene expression in
response to physiological and genetic
changes that affect tryptophan metabolism in
Escherichia coli.
11.
12. • E. coli can synthesize, transport, and degrade
tryptophan
• we used DNA microarrays to measure transcript
levels corresponding to almost every translated gene
of E. Coli.
• Every gene responding transcriptionally should show
increased or decreased mRNA levels.
• Expression also was examined in strains with
mutations that affect expression of the genes of
tryptophan metabolism.
13. Following questions were addressed:
• Which genes exhibit expression patterns indicating
that their expression is influenced by changes in
tryptophan availability?
• Which genes are transcriptionally repressed when
trp repressor is active, and transcriptionally active
when trp repressor is inactive?
• Do quantitative estimates of gene expression
provided by microarray analyses agree with previous
estimates of gene expression based on
measurements of specific protein levels?
15. Materials and Methods
• Strains Used and Growth Condition Examined
Vogel and Bonner minimal medium (17)+0.2%
glucose was used throughout. It was
supplemented with L-tryptophan (50 mg/ml) or
indole acrylic acid (10 or 15 mg/ml), as indicated.
After growth to about 2–3 3 108 cell/ml, sodium
azide was added to each culture and the culture
was chilled and centrifuged. Each cell pellet was
stored at 280°C until its RNA was extracted.
16. • Our principal objective is to identify all of the
protein-encoding genes of E. coli whose
transcripts become more or less abundant
when the growth medium or genetic
background of the strains are change.
17. Data Selection and Analysis
• Data were collected by using microarrays using spots whose
intensities were reproducibly higher than the background
level.
• We measured relative mRNA abundance under appropriate
conditions in 19 comparisons. These were divided into the
following categories:
1) Growth with and without added trp --- (+TRP) 5 comparisons
2) Growth with and without trp starvation ---(-TRP) 9 comparisons
3) Growth of strains with and without trp repressor ---(trpR) 5
comparisons
18. Growth condition examined and strains compared
Minimal medium vs. excess tryptophan
1. trpR+ (Min) vs. trpR+ (Min + Trp)
Nonstarved vs. tryptophan-starved
1. trpR+ (Min) vs. trpR+ (Min + 10 mg/ml indole acrylate)
2. trpR+ (Min) vs. trpR+ (Min + 15 mg/ml indole acrylate)
3. trpR+ tnaA2 (Min) vs. trpR+ trpA46PR9 tnaA2 (Min)
trpR+ vs. trpR2 (repressor minus)
1. trpR+ (Min) vs. trpR2 (Min)
2. trpR+(Min) vs. trpR2 (Min + Trp)
3. trpR+ (Min + Trp) vs. trpR2 (Min + Trp)
4. trpR+ tnaA2 (Min + Trp) vs. trpR2 tnaA2 (Min + Trp)
5. trpR+ DtrpEA2 (Min + Trp) vs. trpR2 DtrpEA2 (Min + Trp)
19. 3 Different conditions have different effects on trp metabolism
1) Excess trp was added to cultures growing in minimal medium
(+TRP):- Transcription termination occur
2) Cultures were partially starved of tryptophan (-TRP):-
starvation imposed in either two ways :
>By addition of indole acrylate to growing culture :- it has two
effects
---Prevent the trp repressor from acting
--- Inhibits the charging of tRNATrp by tryptophanyl-tRNA
synthetase
>By using a trp bradytroph,strain trpA46PR9 :- The bradytroph
used grows at only 80% the rate of the wild type strain in min
medium because its mutant TrpA protein is only slightly active ---
20. --- this defect results in overexpression of the trp operon as the
cell attempts to provide sufficient tryptophan to support
rapid growth.
3) Inactivation of Trp repressor(trpR2) :-
---The mutant allele used trpR2, has a frameshift mutation in
trpR that eliminates the production of a functional trp
repressor.
21. Estimated Trp protein ratios compared with trpmRNA
ratios calculated from microarray data.
Wt
Growth in min vs.
trp
tyrpR2 vs. Wt,
growth in min
Brady vs.
Wt,
growth in
min
Wt, growth in IA
vs. min
Gene Protein mRNA Protein mRNA mRNA Protein mRNA
trpE 10 5.0 +-0.2 7.7 6.3 11.4 46 81+-3
trpD 10 5.2+-0.7 7.7 3.7 8.0 46 43+-0.5
trpC 3.7 2.2+-0.5 4.8 4.4 8.7 29 30+-9
trpB 3.7 2.4+-0.2 4.8 4.1 6.9 29 17+-4
trpA 3.7 2.4+-0.2 4.8 3.8 9.3 29 15+-2
23. Average Expression Profiles
TRP
Excess
TRP
Starvation
trpR
inactivation
Number of
Genes
Member genes/Function
↓ - ↑ 1 b1172
↓ - ↓ 1 fliA
↑ - ↑ 1 tnaA
- ↓ - 41 N-metabolism/motility
- - ↑ 40 IS5 copies and unknown
- ↑ - 35 yi21/22 copies and unknown
- - ↓ 24 Transport/intermed. metblsm
↓ - - 13 Aromatic AA biosynthesis
↑ - - 6 tnaB, artJ, malE and unknown
↓ ↑ ↑ 7 trpR regulon
- - - 522 N/A
36* 79* 82* 691
24.
25. Conclusion
• Results demonstrate both quantitatively and qualitatively that only 3
operons trp, mtr, and aroH, constitute the core,highly responsive trp
repressor regulon.
• mRNA levels for a group of genes concerned with aromatic amino acid
biosynthesis decreased when tryptophan was in excess
• Only one operon, containing two genes, tnaA-tnaB, was up-regulated on
tryptophan addition
26. References
• Arkady B. Khodursky*, Brian J. Peter†, Nicholas R. Cozzarelli†, David Botstein‡,
Patrick O. Brown*§, and Charles Yanofsky, DNA microarray analysis of gene
expression in response to physiological and genetic changes that affect tryptophan
metabolism in Escherichia col, August 29, 2000.
• http://genome.genetics.duke.edu/STAT_talk_301.
• MANJULA KURELLA, LI-LI HSIAO,* TAKUMI YOSHIDA, JEFFREY D. RANDALL, GARY
CHOW, SATINDER S. SARANG, RODERICK V. JENSEN, and STEVEN R. GULLANS, DNA
Microarray Analysis of Complex Biologic Processes, J Am Soc Nephrol 12: 1072–
1078, 2001.
Editor's Notes
Note – Trp Protein levels are not available for cultures of the bradytroph used.
A variable that was not taken into consideration in these calculations is that the growth rate of cultures containing 15ug/ml indole acrylate is slightly reduced. This would results in trp mRNA representing a slightly greater fraction of the RNA that is synthesized.
↑ if its expressions increased by more than threshold value. (Up-Regulated)
↓ if its expression decreased by more than threshold value. (Down-Regulated)
- if its expression changed by less than the threshold value. (UnChanged)
* No. of responding Genes.