The document describes calculating the maximum dispersion-limited length of standard single-mode fiber for a 2.5 Gbps directly-modulated laser diode transmitter operating at 1550 nm. It provides the relevant equations and specifies the system parameters. The simulation is run for fiber lengths including the calculated dispersion-limited length and longer lengths to observe the impact on signal quality. The results are analyzed to verify acceptable system performance within the dispersion-limited length.
An Optical Time Domain Reflectometer (OTDR) is an important instrument used by organizations to certify the performance of new fiber optics links and detect problems with existing fiber links.
International Journal of Engineering Research and Applications (IJERA) is an open access online peer reviewed international journal that publishes research and review articles in the fields of Computer Science, Neural Networks, Electrical Engineering, Software Engineering, Information Technology, Mechanical Engineering, Chemical Engineering, Plastic Engineering, Food Technology, Textile Engineering, Nano Technology & science, Power Electronics, Electronics & Communication Engineering, Computational mathematics, Image processing, Civil Engineering, Structural Engineering, Environmental Engineering, VLSI Testing & Low Power VLSI Design etc.
A high efficient narrow linewidth fiber laser based on fiber Bragg grating Fabry-Perot (FBG F-P) cavity was demonstrted. The spatial hole burning effect was restrained by fiber Faraday rotator(FR). Two short FBG F-P cavities as narrow bandwidth filters discriminated and selected the laser longitudinal modes efficiently. Stable single frequency 1550nm laser was acquired. Pumped by two 976nm LD, the fiber laer exhibited a 11mW threshold. The 73mW output power was obtained upon the maximum 145mW pump power. The optical-optical efficciency was 50 and the slope efficiency was 55. The 3dB linewidth of laser was less than 10kHz, measured by the delayed self-heterodyne method with 10km mono-mode fiber. The high power narrow linewidth fiber lasr can be used in high resolution fiber sensor system .
An optical time-domain reflectometer (OTDR) is an optoelectronic instrument used to characterize an optical fiber. An OTDR is the optical equivalent of an electronic time domain reflectometer. It injects a series of optical pulses into the fiber under test and extracts, from the same end of the fiber, light that is scattered (Rayleigh backscatter) or reflected back from points along the fiber. The scattered or reflected light that is gathered back is used to characterize the optical fiber. This is equivalent to the way that an electronic time-domain meter measures reflections caused by changes in the impedance of the cable under test. The strength of the return pulses is measured and integrated as a function of time, and plotted as a function of fiber length.
As we know Optical communication Network offers
very high potential bandwidth and flexibility. In terms of high
bit-rate transmission. However, their performance slows down
due to some parameter like dispersion, attenuation, scattering. In
long haul application, dispersion is the main parameter which
needs to be compensated in order to provide better service. Fiber
Braggs Grating (FBG) is one of the most widely used element to
compensate it, however its performance slows down with the
increase in distance.
This paper presents an investigation on Pulse distortions due to
the third-order dispersion (TOD) on very high speed long
distance single mode optical fiber communication system using
OptiSystem. Presence of the TOD introduces broadening on the
propagating pulse. The impact of TOD is observed at the
receiving end of transmission line considering the variation of
different factors such as transmission reach, bit rate, duty
cycle.BER performance are also considered here.
A high efficient narrow linewidth fiber laser based on fiber Bragg grating Fabry- Perot( FBG F- P) cavity was demonstrted. The spatial hole burning effect was restrained by fiber Faraday rotator( FR) . Two short FBG F- P cavities as narrow bandw idth filters discriminated and selected the laser longitudinal modes efficiently. Stable single frequency 1550nm laser was acquired. Pumped by two 976nm LD, the fiber laer exhib ited a 11 mW threshold. The 73mW output power was obtained upon the maximum 145mW pump power. The optica-l optical efficciency was 50% and the slope efficiency was 55% . T he 3 dB linewidth of laser was less than 10 kHz, measured by the delayed sel-f heterodyne method with 10 km mono- mode fiber. T he high power narrow linewidth fiber lasr can be used in high resolution fiber sensor system.
This is a presentation by Dada Robert in a Your Skill Boost masterclass organised by the Excellence Foundation for South Sudan (EFSS) on Saturday, the 25th and Sunday, the 26th of May 2024.
He discussed the concept of quality improvement, emphasizing its applicability to various aspects of life, including personal, project, and program improvements. He defined quality as doing the right thing at the right time in the right way to achieve the best possible results and discussed the concept of the "gap" between what we know and what we do, and how this gap represents the areas we need to improve. He explained the scientific approach to quality improvement, which involves systematic performance analysis, testing and learning, and implementing change ideas. He also highlighted the importance of client focus and a team approach to quality improvement.
Unit 8 - Information and Communication Technology (Paper I).pdfThiyagu K
This slides describes the basic concepts of ICT, basics of Email, Emerging Technology and Digital Initiatives in Education. This presentations aligns with the UGC Paper I syllabus.
The French Revolution, which began in 1789, was a period of radical social and political upheaval in France. It marked the decline of absolute monarchies, the rise of secular and democratic republics, and the eventual rise of Napoleon Bonaparte. This revolutionary period is crucial in understanding the transition from feudalism to modernity in Europe.
For more information, visit-www.vavaclasses.com
We all have good and bad thoughts from time to time and situation to situation. We are bombarded daily with spiraling thoughts(both negative and positive) creating all-consuming feel , making us difficult to manage with associated suffering. Good thoughts are like our Mob Signal (Positive thought) amidst noise(negative thought) in the atmosphere. Negative thoughts like noise outweigh positive thoughts. These thoughts often create unwanted confusion, trouble, stress and frustration in our mind as well as chaos in our physical world. Negative thoughts are also known as “distorted thinking”.
Palestine last event orientationfvgnh .pptxRaedMohamed3
An EFL lesson about the current events in Palestine. It is intended to be for intermediate students who wish to increase their listening skills through a short lesson in power point.
Students, digital devices and success - Andreas Schleicher - 27 May 2024..pptxEduSkills OECD
Andreas Schleicher presents at the OECD webinar ‘Digital devices in schools: detrimental distraction or secret to success?’ on 27 May 2024. The presentation was based on findings from PISA 2022 results and the webinar helped launch the PISA in Focus ‘Managing screen time: How to protect and equip students against distraction’ https://www.oecd-ilibrary.org/education/managing-screen-time_7c225af4-en and the OECD Education Policy Perspective ‘Students, digital devices and success’ can be found here - https://oe.cd/il/5yV
1.4 modern child centered education - mahatma gandhi-2.pptx
Dispersion_Limited_Fiber_Length.pdf
1. Dispersion Limited Fiber Length
Objective:
Calculate the dispersion-limited fiber length for a fiber optic transport system that
employs standard single-mode fiber and a directly-modulated single-mode laser diode
transmitter.
Simulate the resulting system and verify that it meets performance objective.
Theory:
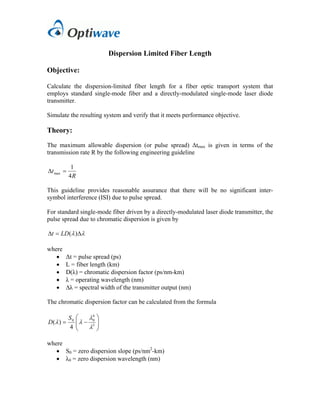
The maximum allowable dispersion (or pulse spread) Δtmax is given in terms of the
transmission rate R by the following engineering guideline
R
t
4
1
max =
Δ
This guideline provides reasonable assurance that there will be no significant inter-
symbol interference (ISI) due to pulse spread.
For standard single-mode fiber driven by a directly-modulated laser diode transmitter, the
pulse spread due to chromatic dispersion is given by
λ
λ Δ
=
Δ )
(
LD
t
where
• Δt = pulse spread (ps)
• L = fiber length (km)
• D(λ) = chromatic dispersion factor (ps/nm-km)
• λ = operating wavelength (nm)
• ∆λ = spectral width of the transmitter output (nm)
The chromatic dispersion factor can be calculated from the formula
⎟
⎟
⎠
⎞
⎜
⎜
⎝
⎛
−
= 3
4
0
0
4
)
(
λ
λ
λ
λ
S
D
where
• S0 = zero dispersion slope (ps/nm2
-km)
• λ0 = zero dispersion wavelength (nm)
2. The dispersion-limited fiber length is the value of L such that Δt = Δtmax.
Note that there can be additional pulse spread due to the transmitter and receiver rise
times. The somewhat conservative engineering guideline allows for this, but the results of
the simulation should be checked to verify acceptable system performance.
Pre-lab Calculation:
The specifications for the system are summarized in the table below
Transmission rate 2.5 Gb/s
Output power 0 dBm
Operating wavelength 1550 nm
Transmitter
Spectral width 0.6 nm
Zero-dispersion slope 0.09 ps/nm2
-km
Zero-dispersion
wavelength
1312 nm
Fiber
Input/output coupling
efficiency
0 dB
The fiber attenuation factor and coupling efficiencies are set to 0 in order to isolate the
effects of dispersion from those of attenuation.
Using the data in the table (and in the fiber data sheet) and the theory summarized above,
determine the dispersion-limited fiber length.
Layout:
Open up the OptiPerformer file called “Dispersion Limited Fiber.osp”. This layout uses
the Laser Rate Equations laser diode component with default parameters. It models a
directly modulated laser diode based using a standard rate equation model. One of the
effects of this model is that it generates a signal with a spectral width of about 0.6 nm for
the default parameters with 2.5 Gb/s, return to zero modulation.
Within the layout, there are several “Visualizers.” The “Optical Time Domain
Visualizers” allow the user to the view the simulated signal as a function of time. There is
one at the output of the laser and one at the end of the fiber. This allows the user to
directly observe the changes in the pulses due fiber dispersion. The “Optical Spectrum
Analyzer” allows the user to view the spectral content of the signal. It this lab it is used to
verify that the spectral width is about 6 nm. The “BER analyzer” provides calculations of
the Q factor, the bit error rate (BER) and provides a plot of the eye diagram.
3. Simulation:
Set the laser power such to achieve a transmitter output power of 0 dBm. The transmitter
power can be viewed by double clicking the “Output Power Meter Visualizer.” The
power will read -100 dBm until the first run is made.
Using the chromatic dispersion factor equation, determine the dispersion of the fiber at
1550 nm and set the fiber dispersion parameter accordingly.
Using the equations above, determine the dispersion-limited fiber length.
Run the simulation 5 times with the following values for fiber length:
Iteration Fiber Length
1 Calculated dispersion-limited fiber length
2 25 km
3 50 km
4 75 km
5 100 km
After the first run, use the optical spectrum analyzer to verify that the spectral width at
the transmitter output is about 0.6 nm. To do this, right click on the spectrum plot and
choose “Marker”. Place one marker on either side of the main signal. The spectrum is
noisy so a precise measurement can not be obtained in this way, but it should be clear that
the spectral width is about 0.6 ± 0.1 nm
For each iteration:
• Use the BER analyzer to measure and record the Q factor, the bit error rate and
the eye diagram.
• Use optical time domain analyzers to compare the pulse width at the input and
output of the fiber.
Analysis:
Compare the result of the simulations and your pre-lab calculations and record your
observations. Provide an explanation for any differences between the pre-lab calculations
and the simulation results.