This document is a project report on discrete mathematics submitted by Annimesh Sasmal for his Bachelor of Technology in Computer Science and Engineering. It includes various topics such as propositional logic, valid arguments, properties of relations, topological sorting in partially ordered sets, and the use of matrix representations in these contexts. The report reflects the student's original work and has been completed under the supervision of faculty members at Centurion University.


![7
As we embark on this journey through the matrix representation of relations, we invite readers
to unravel the intricate tapestry of connections that exist within sets, fostering an appreciation for
the elegance and utility of this mathematical tool. From the abstract realm of mathematical relations
to the tangible applications in various domains, this project aims to illuminate the multifaceted
nature of relations on sets and their representation through matrices.
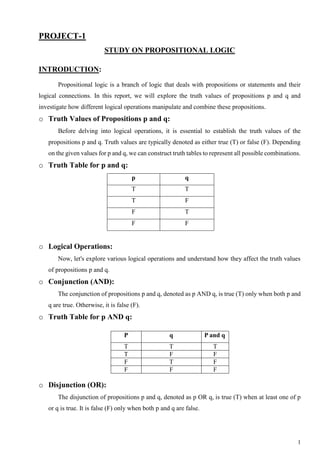
o PROPERTIES OF A RELATION:
Understanding the properties of relations is essential in discerning the nature of connections
between elements within a set. In this section, we delve into three fundamental properties of
relations—reflexivity, symmetry, and transitivity— examining their significance and exploring
how they manifest within the matrix representation.
o MATRIX REPRESENTATION OF A RELATION:
To facilitate a systematic examination of relations, matrices serve as a powerful representation.
For a set A with n elements, the matrix MR representing the relation R is an n × n matrix, where
the entry MR[i][j] is 1 if (ai, aj) € R, and 0 otherwise. This matrix encapsulates the relationships
between elements, paving the way for a detailed analysis of various properties.
o PROPERTIES OF A RELATION MATRIX:
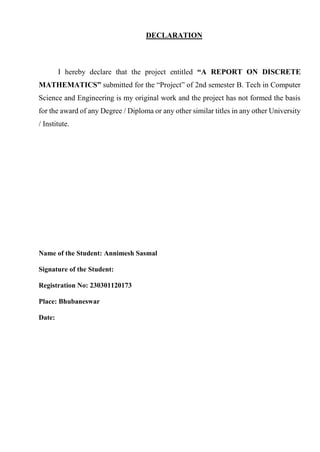
REFLEXIVITY:
Reflexivity is a fundamental property of relations that captures the notion that every element is
related to itself. In the context of a matrix MR, a relation R is reflexive if and only if MR[i][i] = 1
for every i in the range 1 ≤ i ≤ n. In other words, the diagonal elements of the matrix must be filled
with 1s.
Examples:
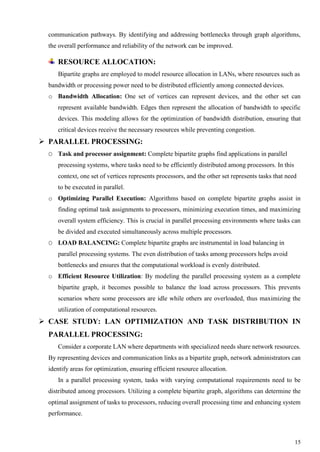
Consider a set A = {a, b, c} with a reflexive relation R = {(a, a), (b, b), (c, c)}. The matrix
representation MR would be:
MR=[
𝟏 𝟎 𝟎
𝟎 𝟏 𝟎
𝟎 𝟎 𝟏
]
SYMMETRY:
Symmetry in a relation signifies that if (ai, aj) is in the relation, then (aj, ai) must also be present.
In matrix terms, a relation R is symmetric if MR[i][j] = MR[j][i] for all i and j.
Examples:
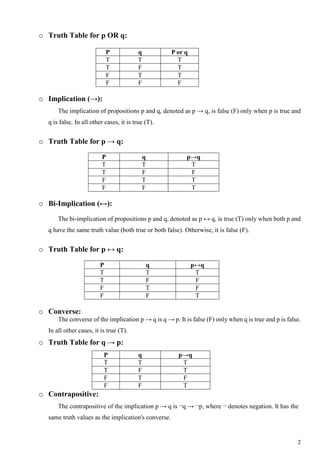
Let A = {a, b, c} with a symmetric relation R = {(a, b), (b, a), (b, c), (c, b)}. The matrix](https://image.slidesharecdn.com/discretemathmaticsprojectreport-240502111005-7a37c906/85/Discrete_Mathmatics-Projects-report-docx-12-320.jpg)
![8
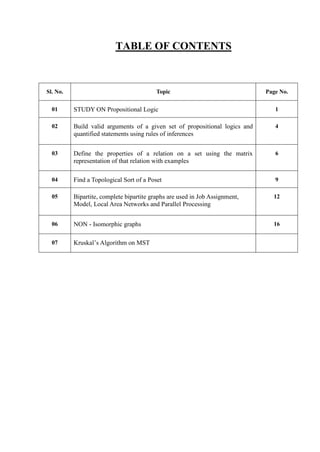
representation MR would be:
MR= [
𝟎 𝟏 𝟎
𝟏 𝟎 𝟏
𝟎 𝟏 𝟎
]
TRANSITIVITY:
Transitivity asserts that if (ai, aj) and (aj, ak) are in the relation, then (ai, ak) must also be
present. In terms of matrices, a relation R is transitive if MR[i][j] = 1 and MR[j][k] = 1 imply
MR[i][k] = 1.
Examples:
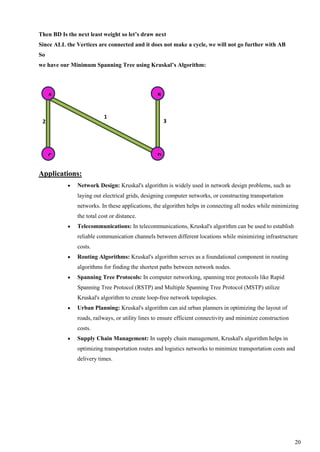
Consider A = {a, b, c} with a transitive relation R = {(a, b), (b, c), (a, c)}. The matrix
representation MR would be:
MR=[
𝟎 𝟏 𝟏
𝟎 𝟎 𝟏
𝟎 𝟎 𝟎
]](https://image.slidesharecdn.com/discretemathmaticsprojectreport-240502111005-7a37c906/85/Discrete_Mathmatics-Projects-report-docx-13-320.jpg)