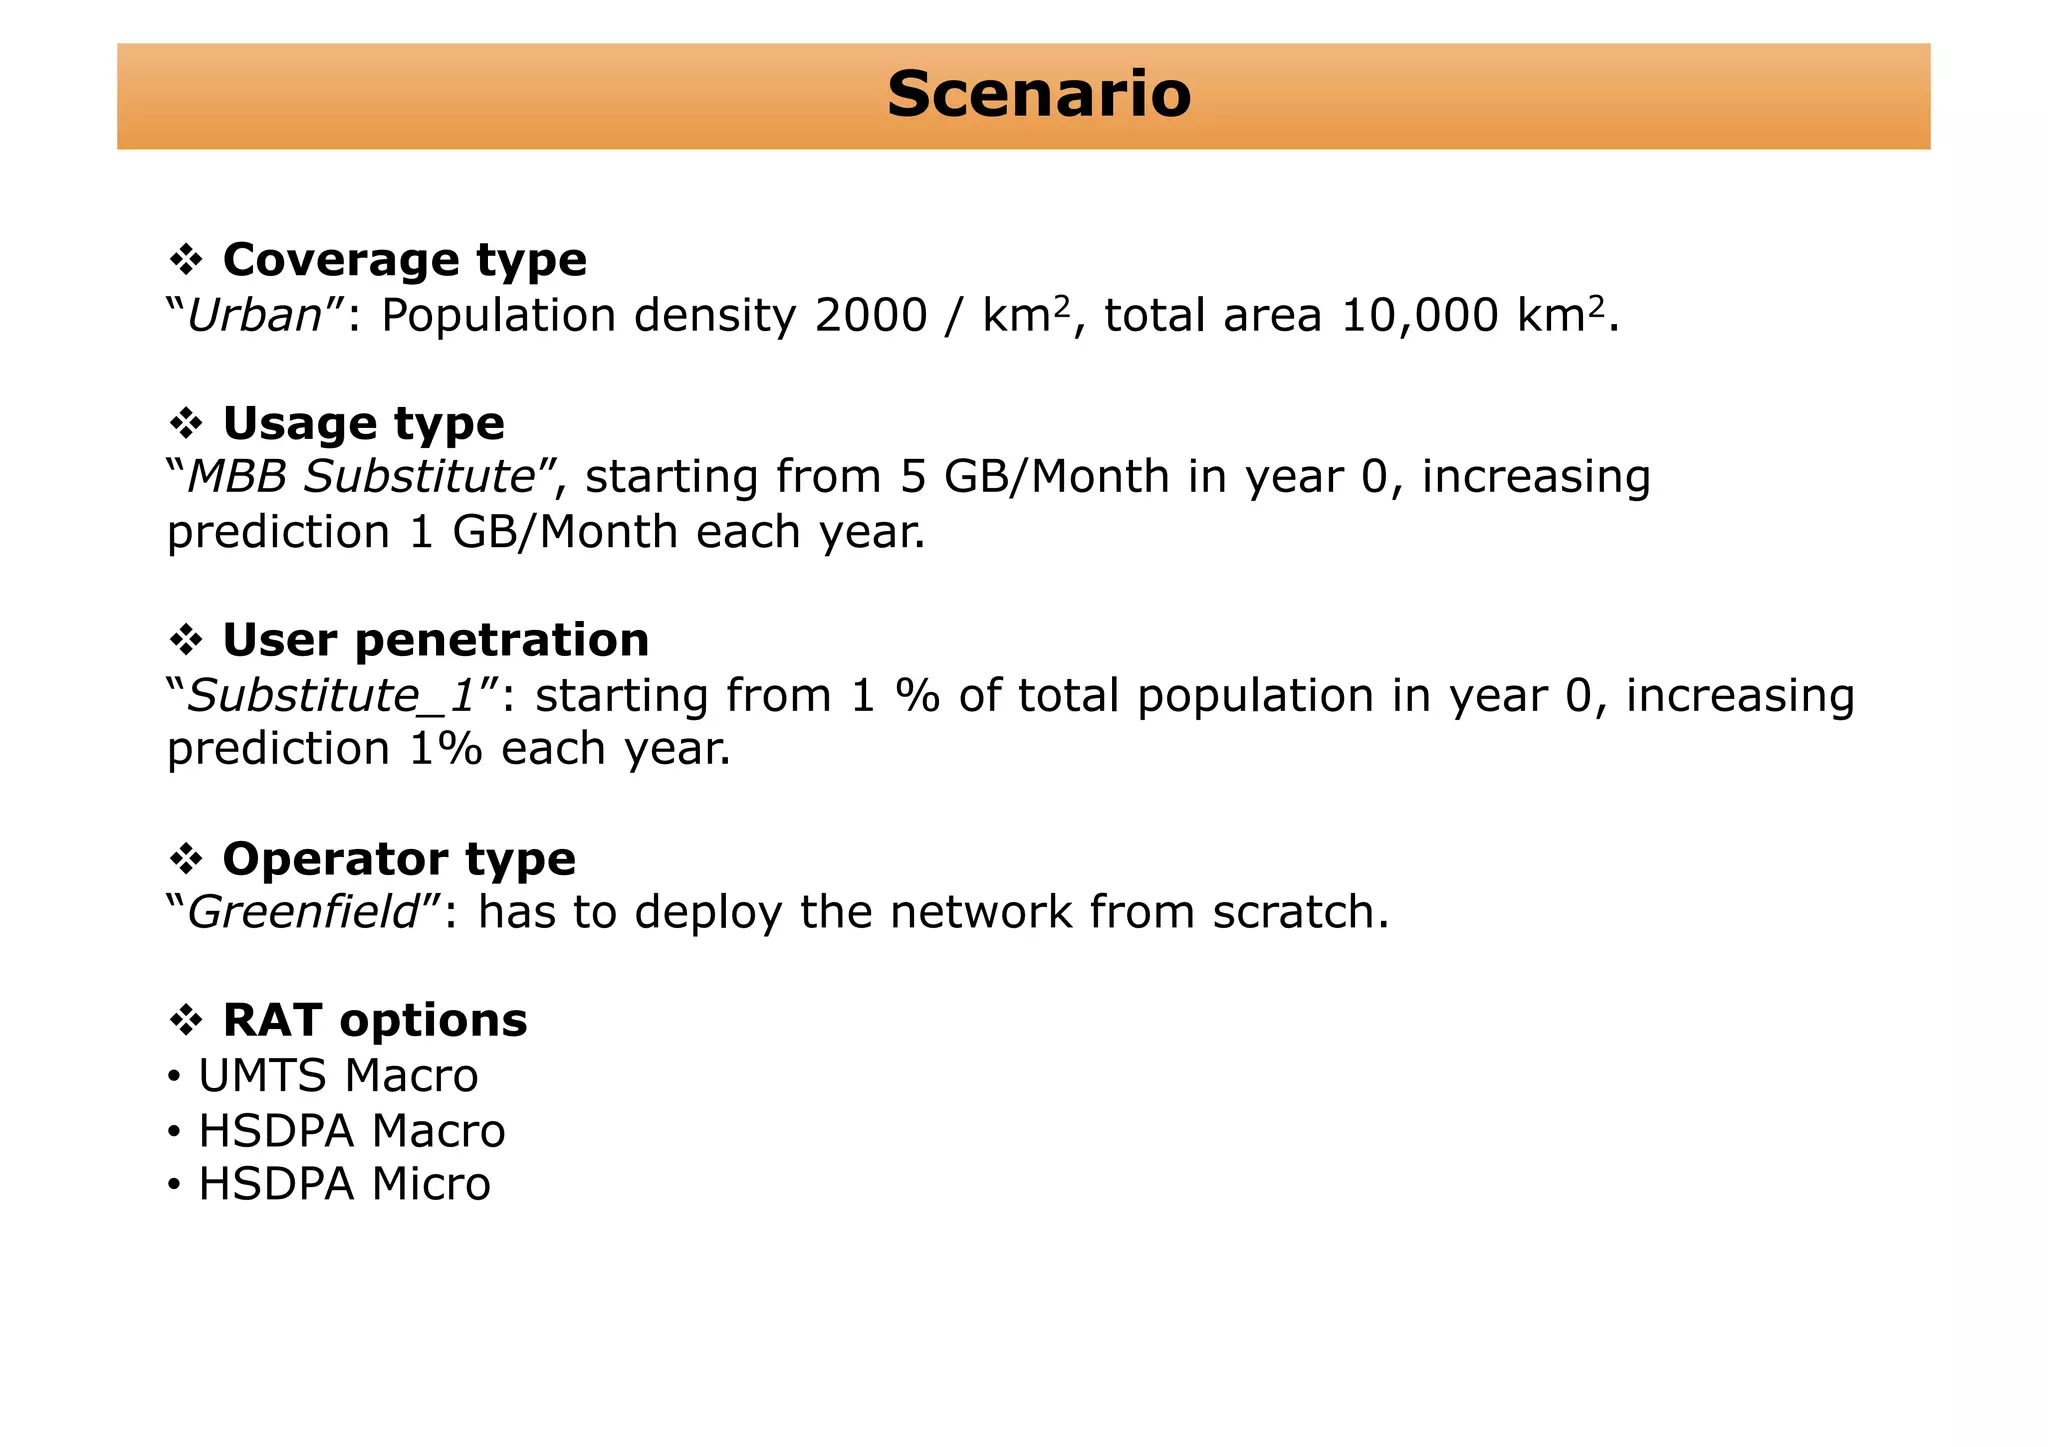
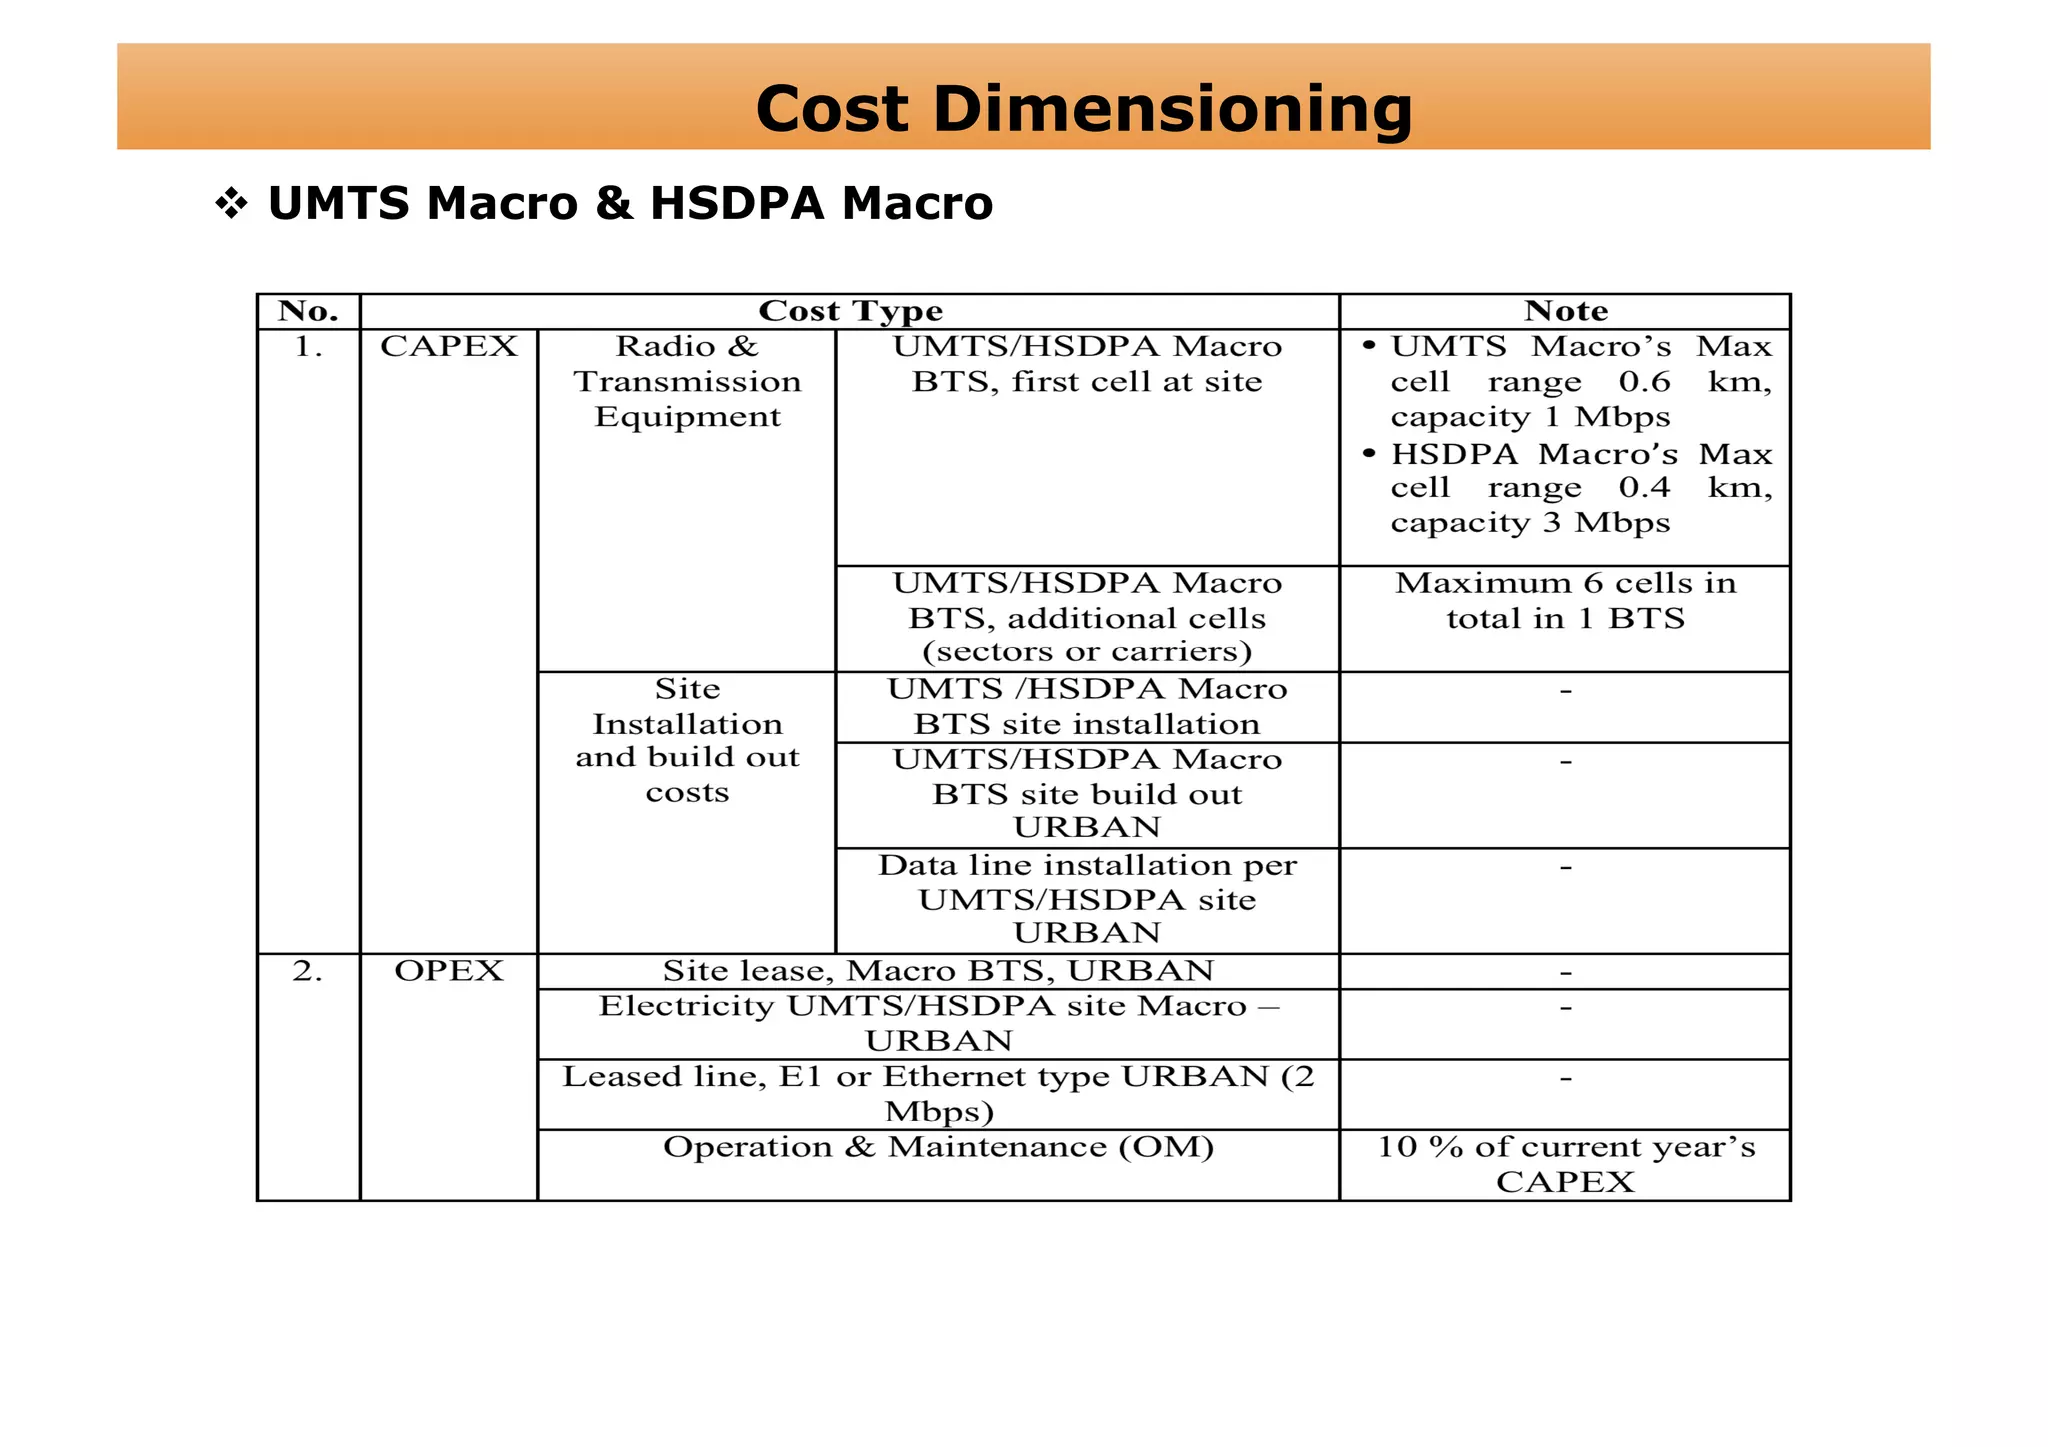
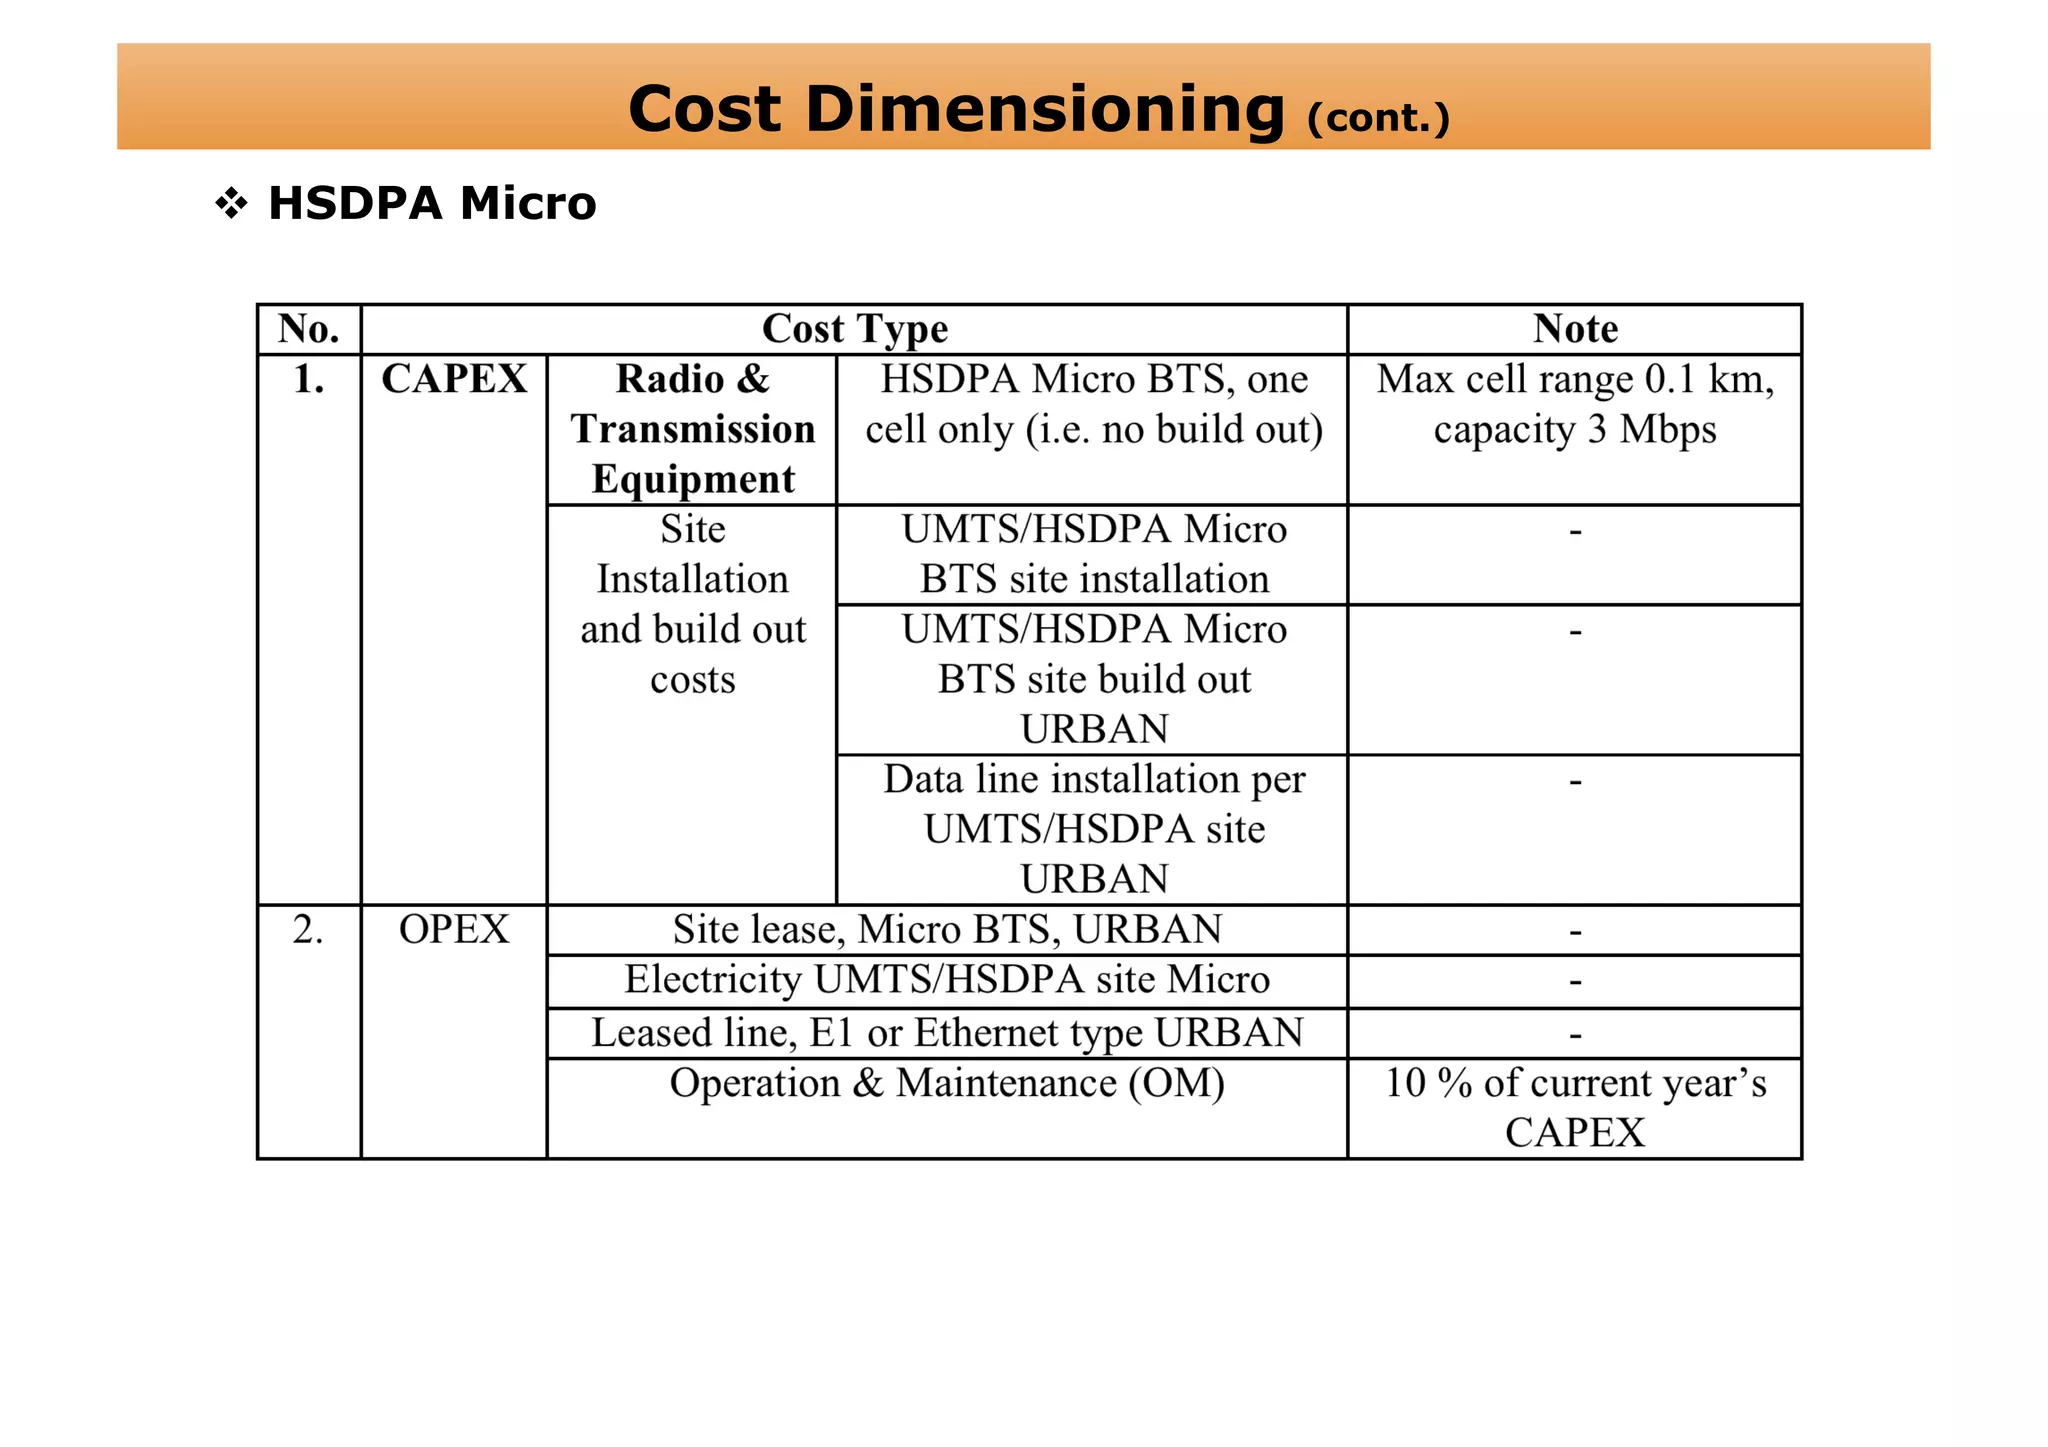
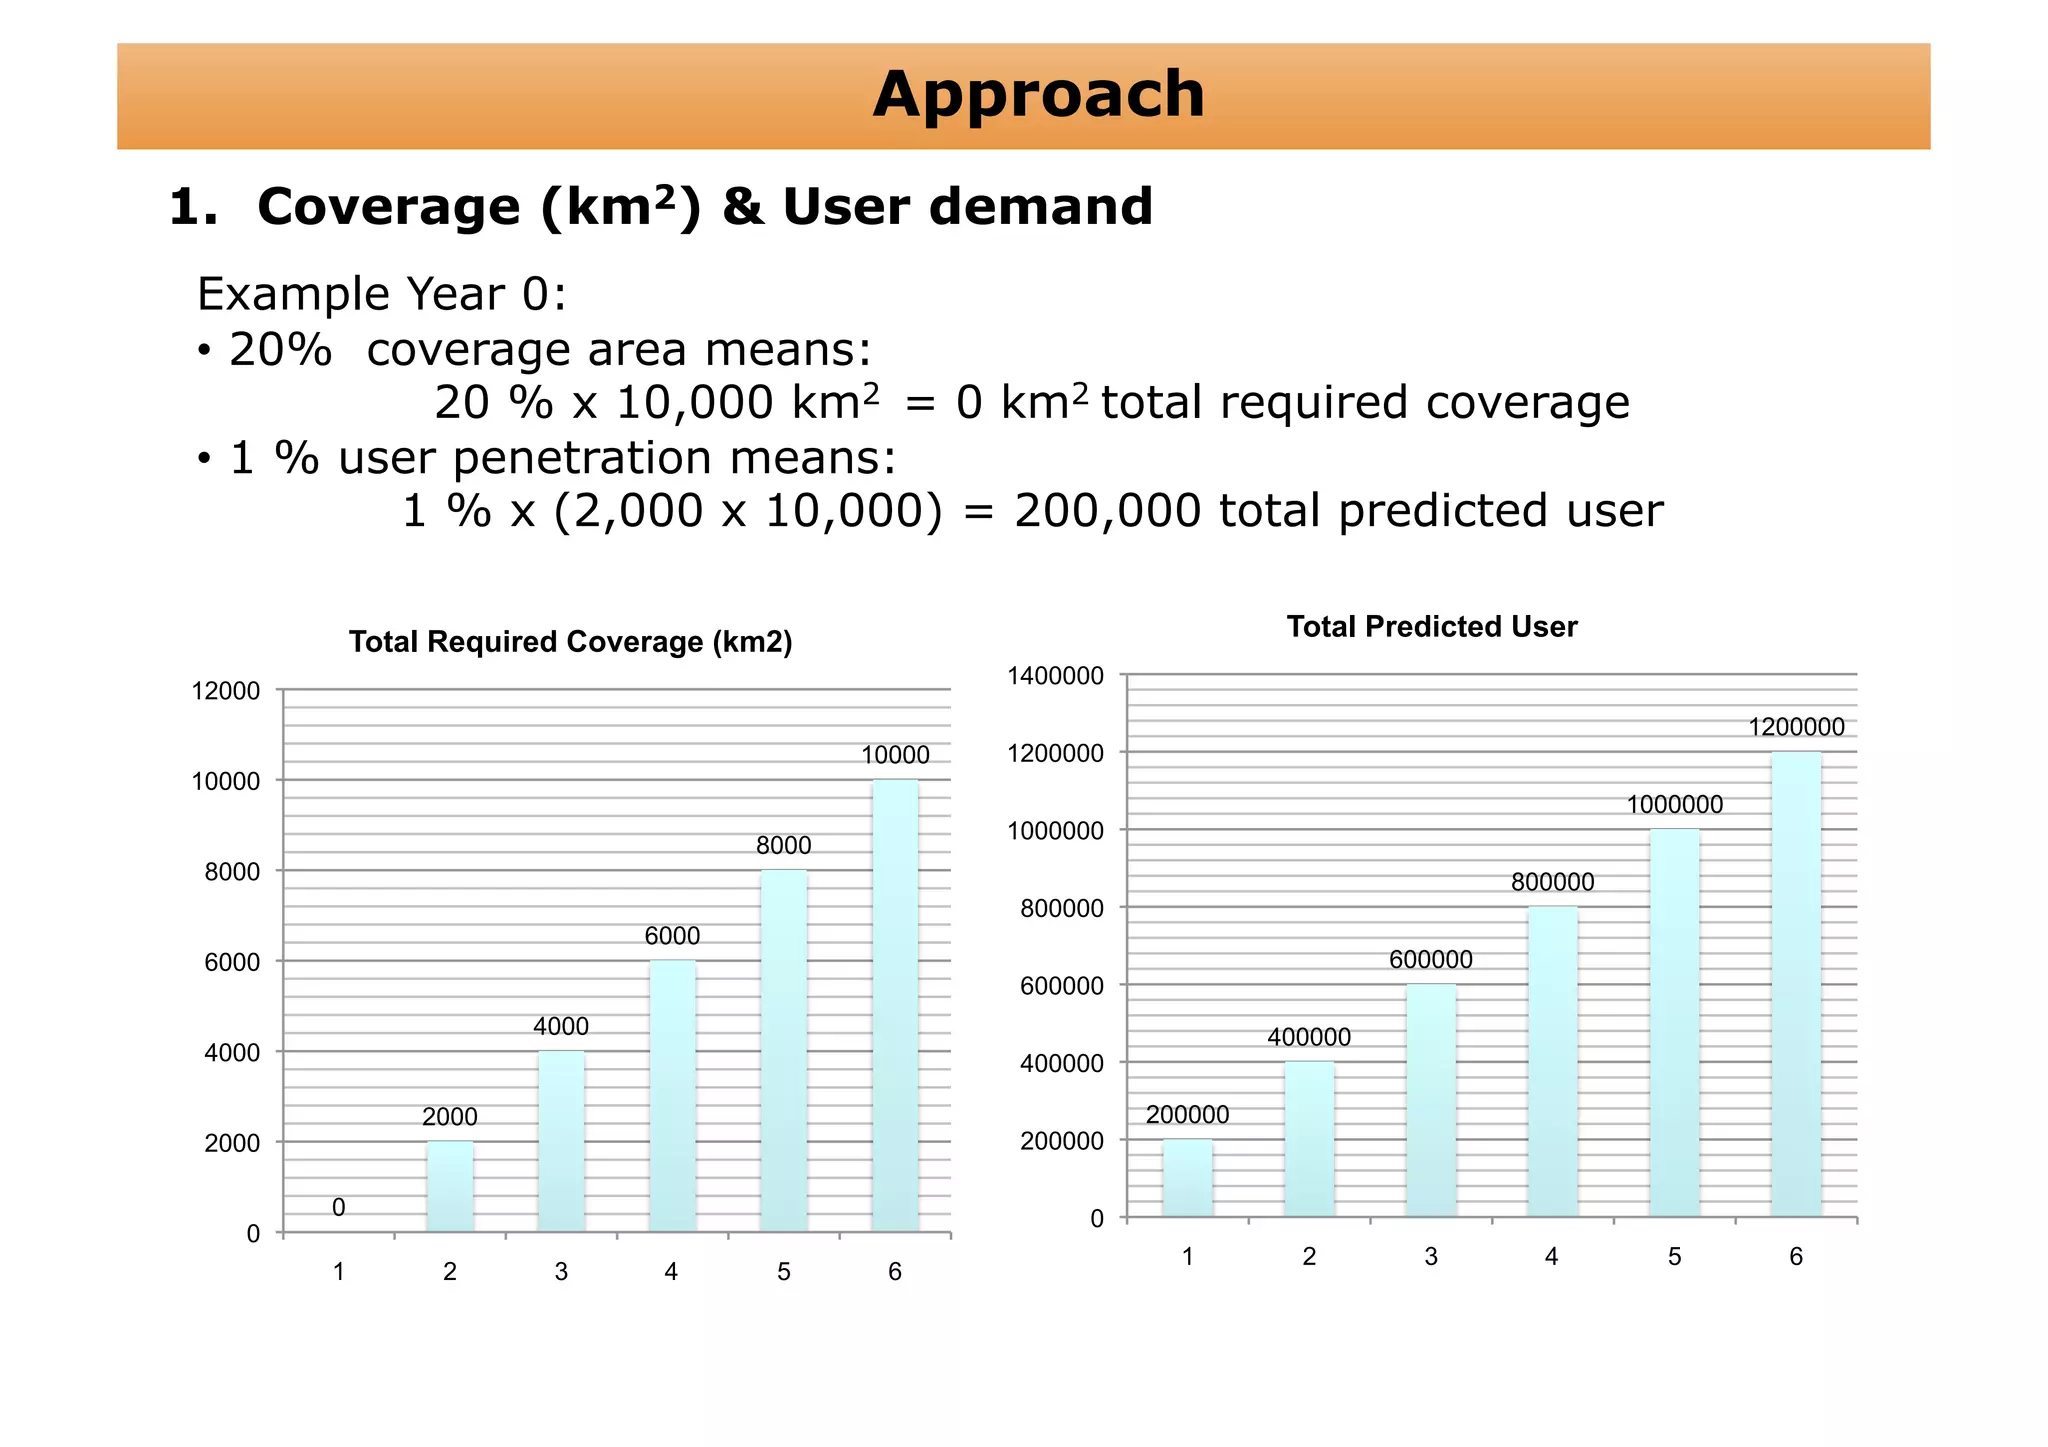
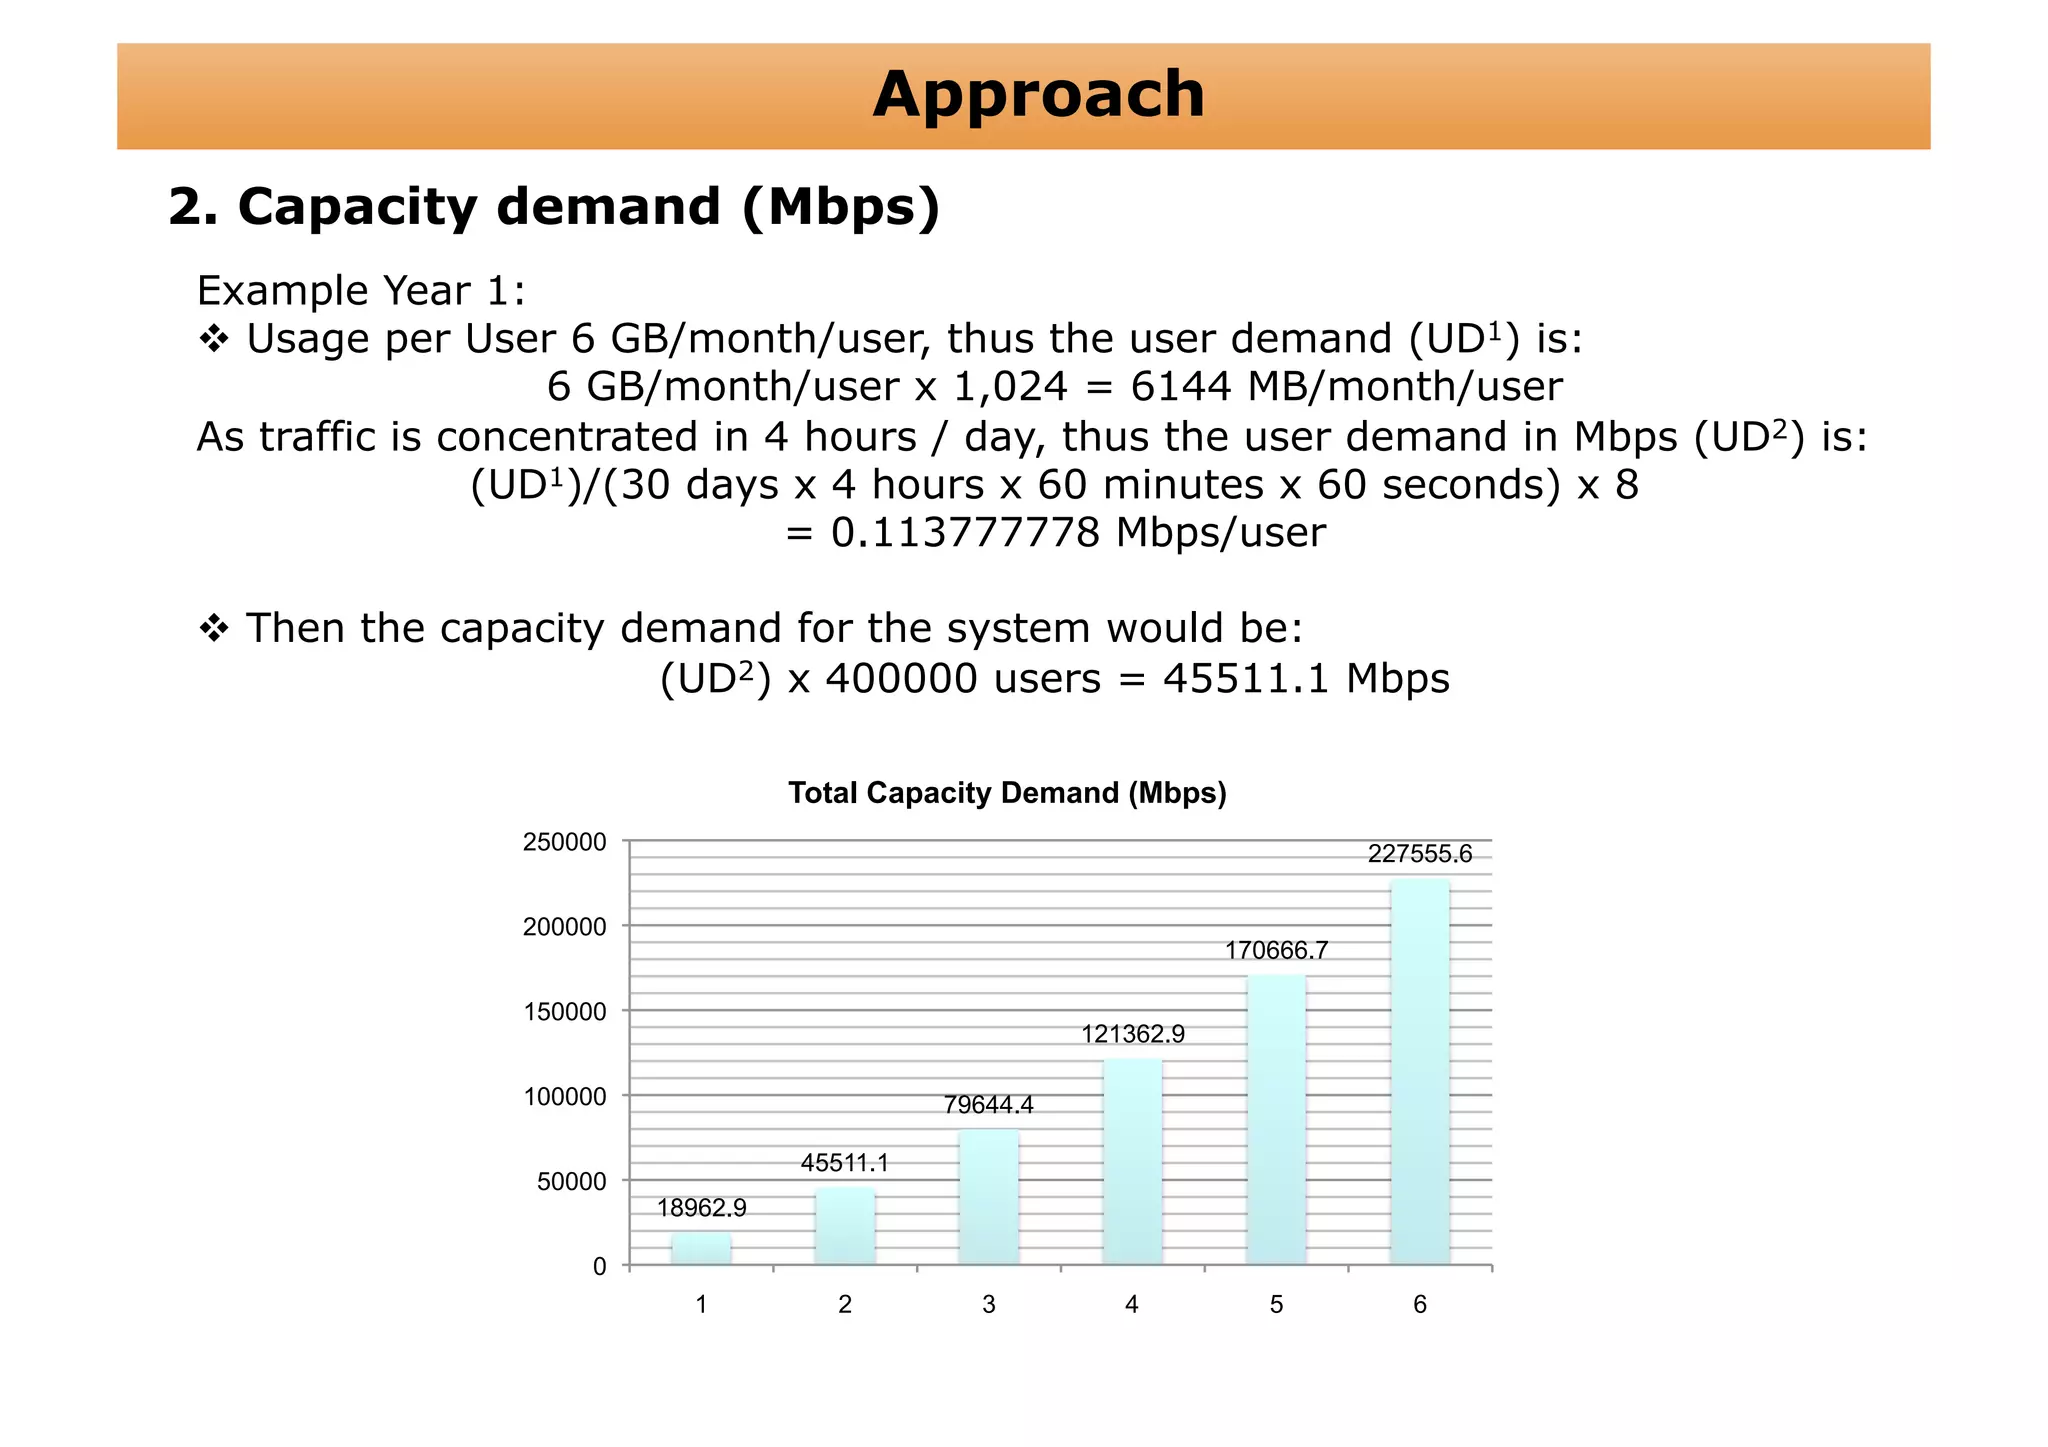
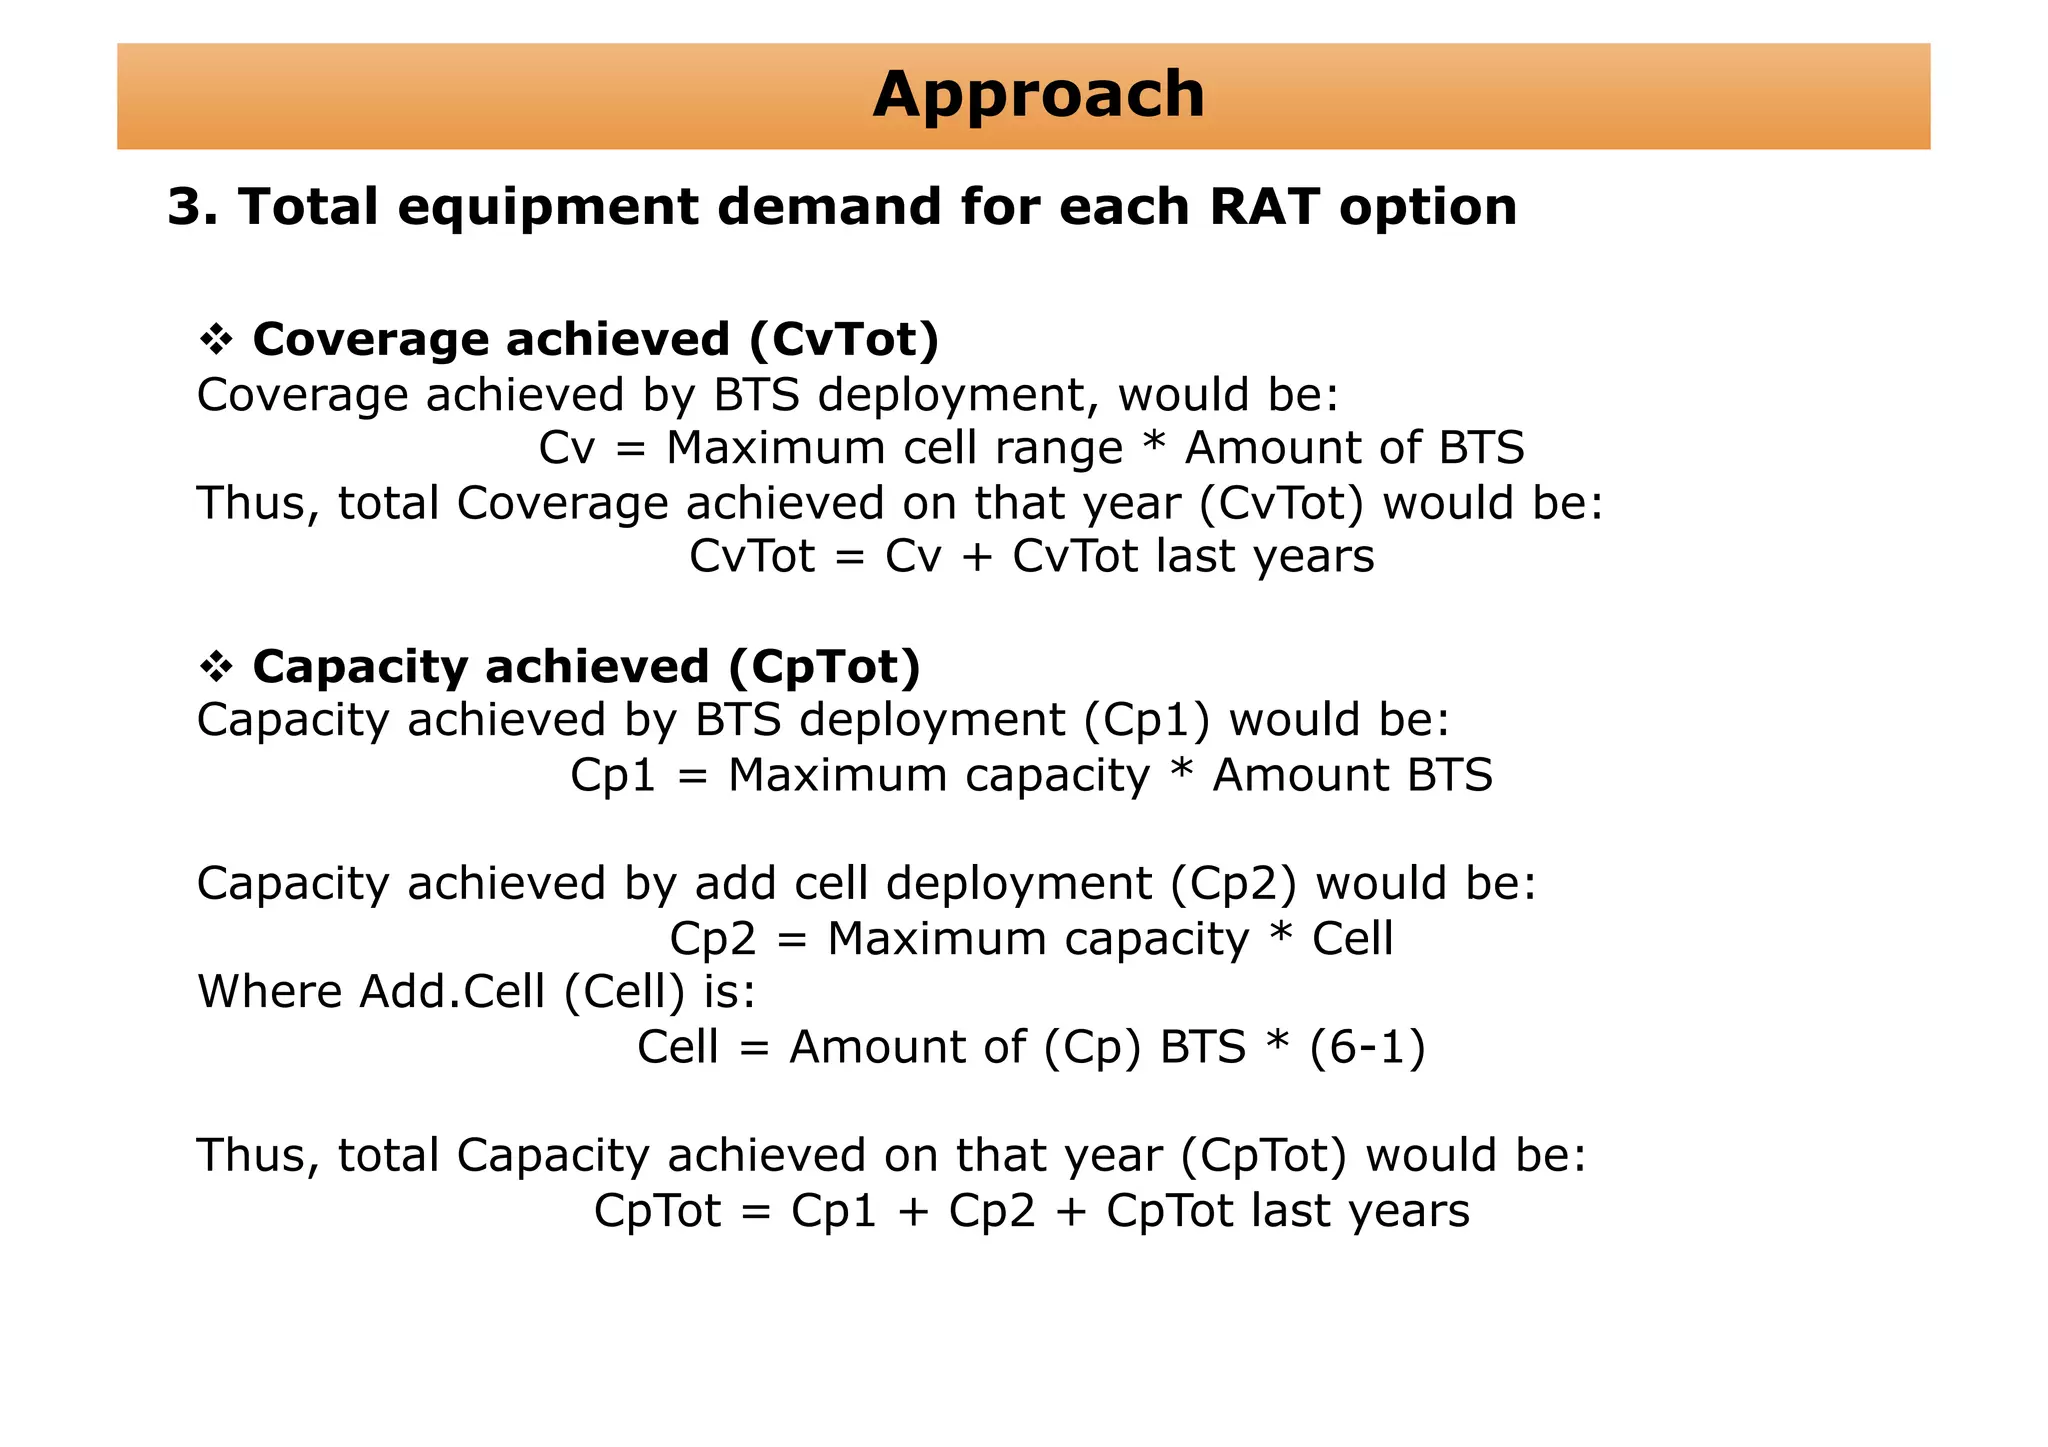
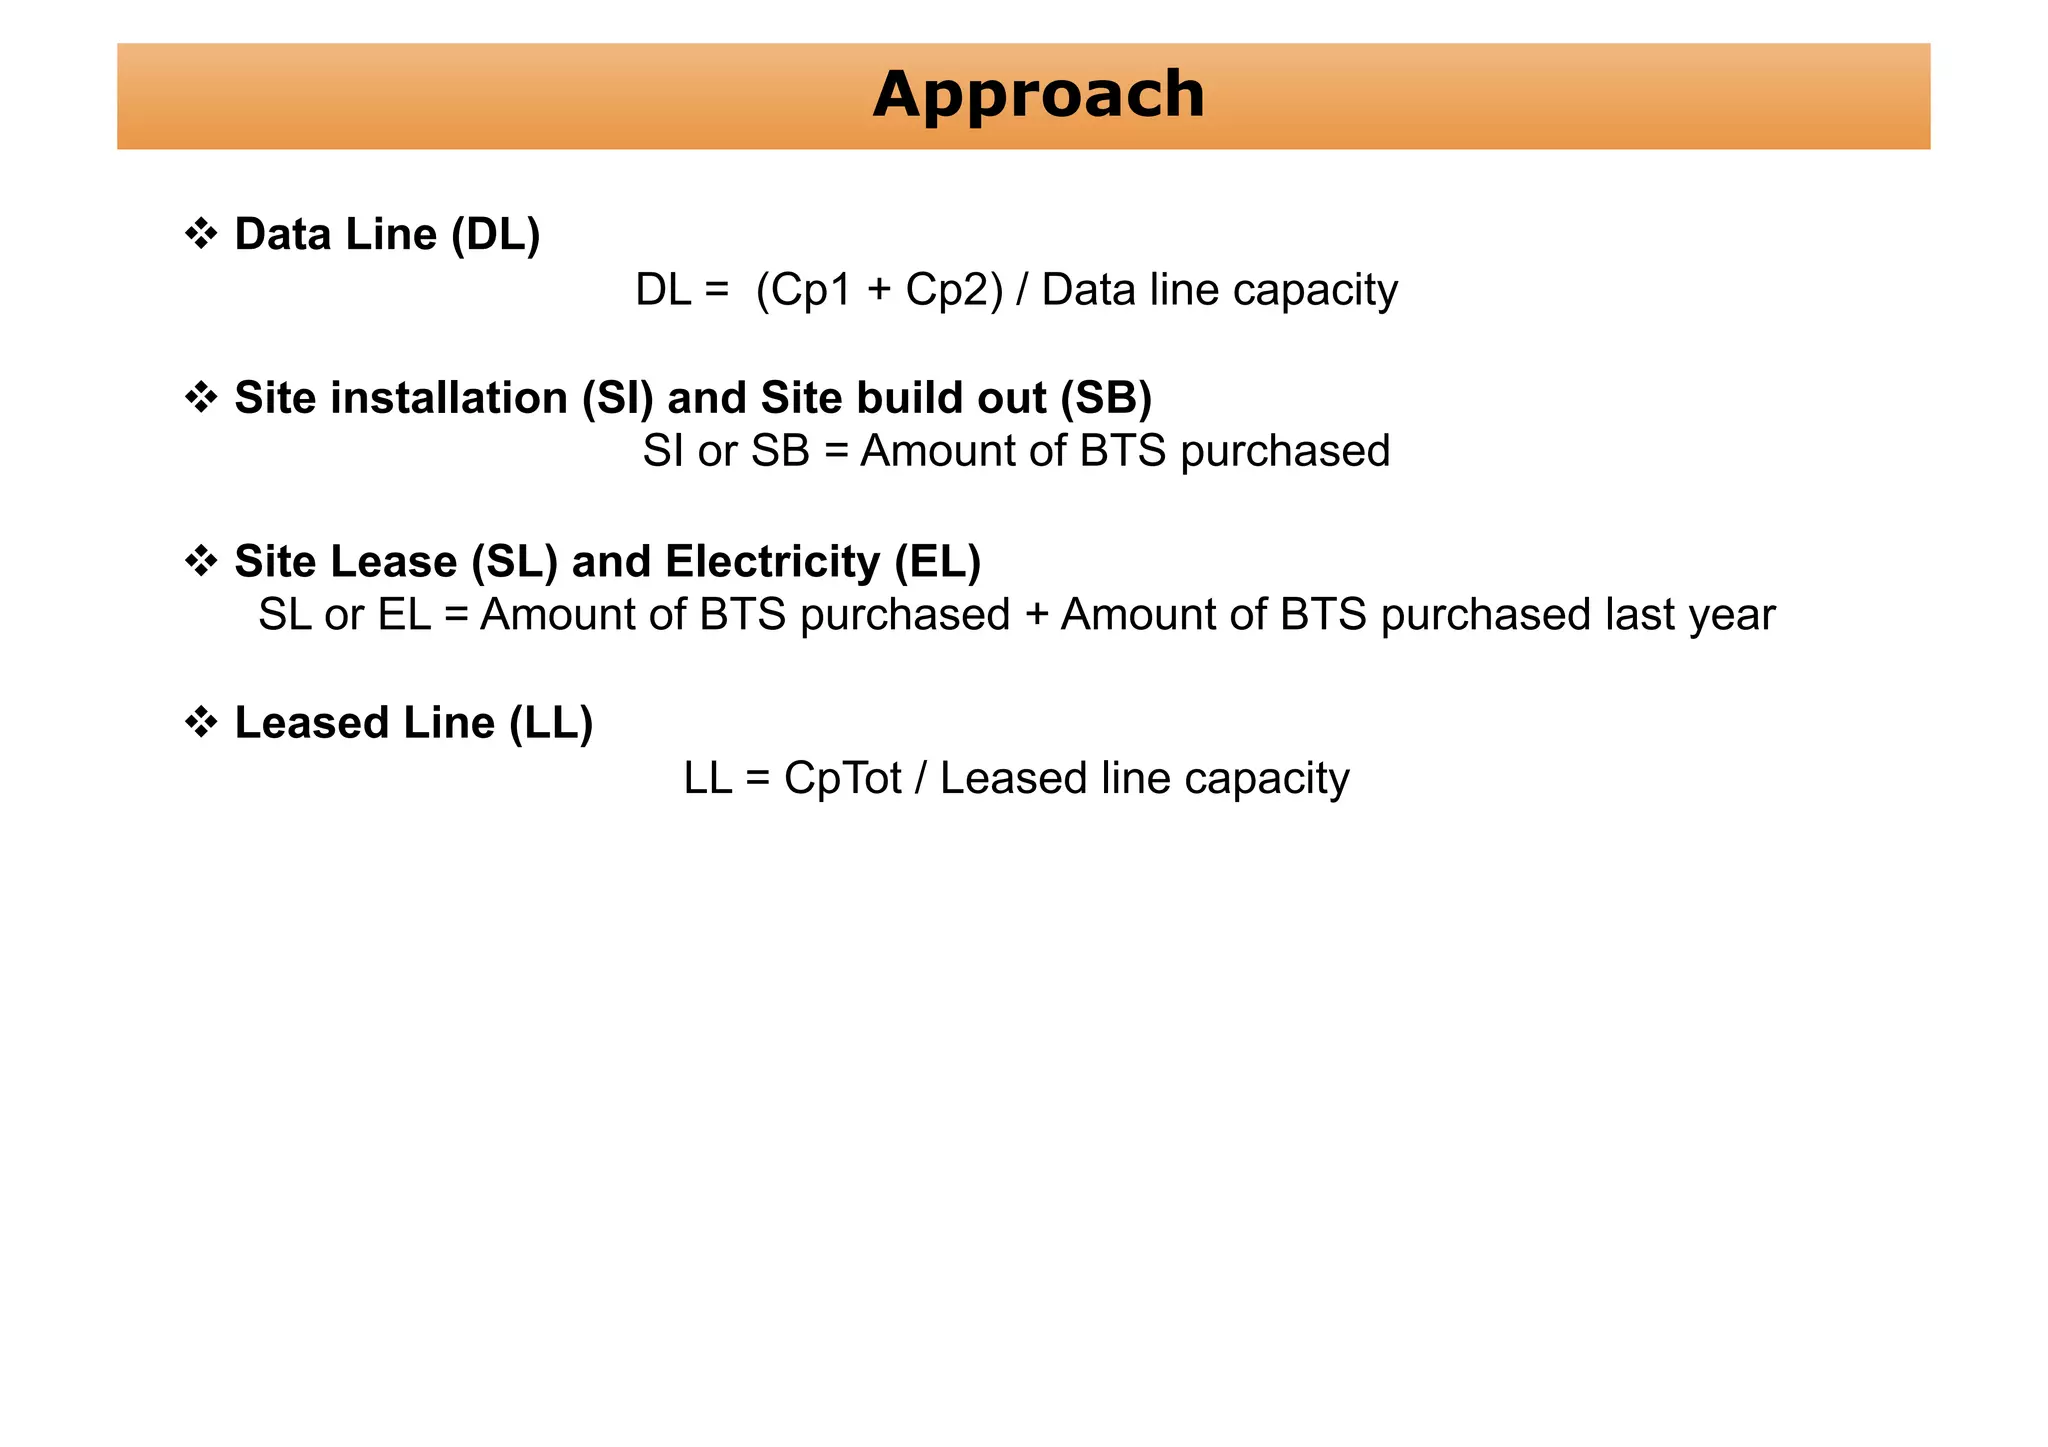
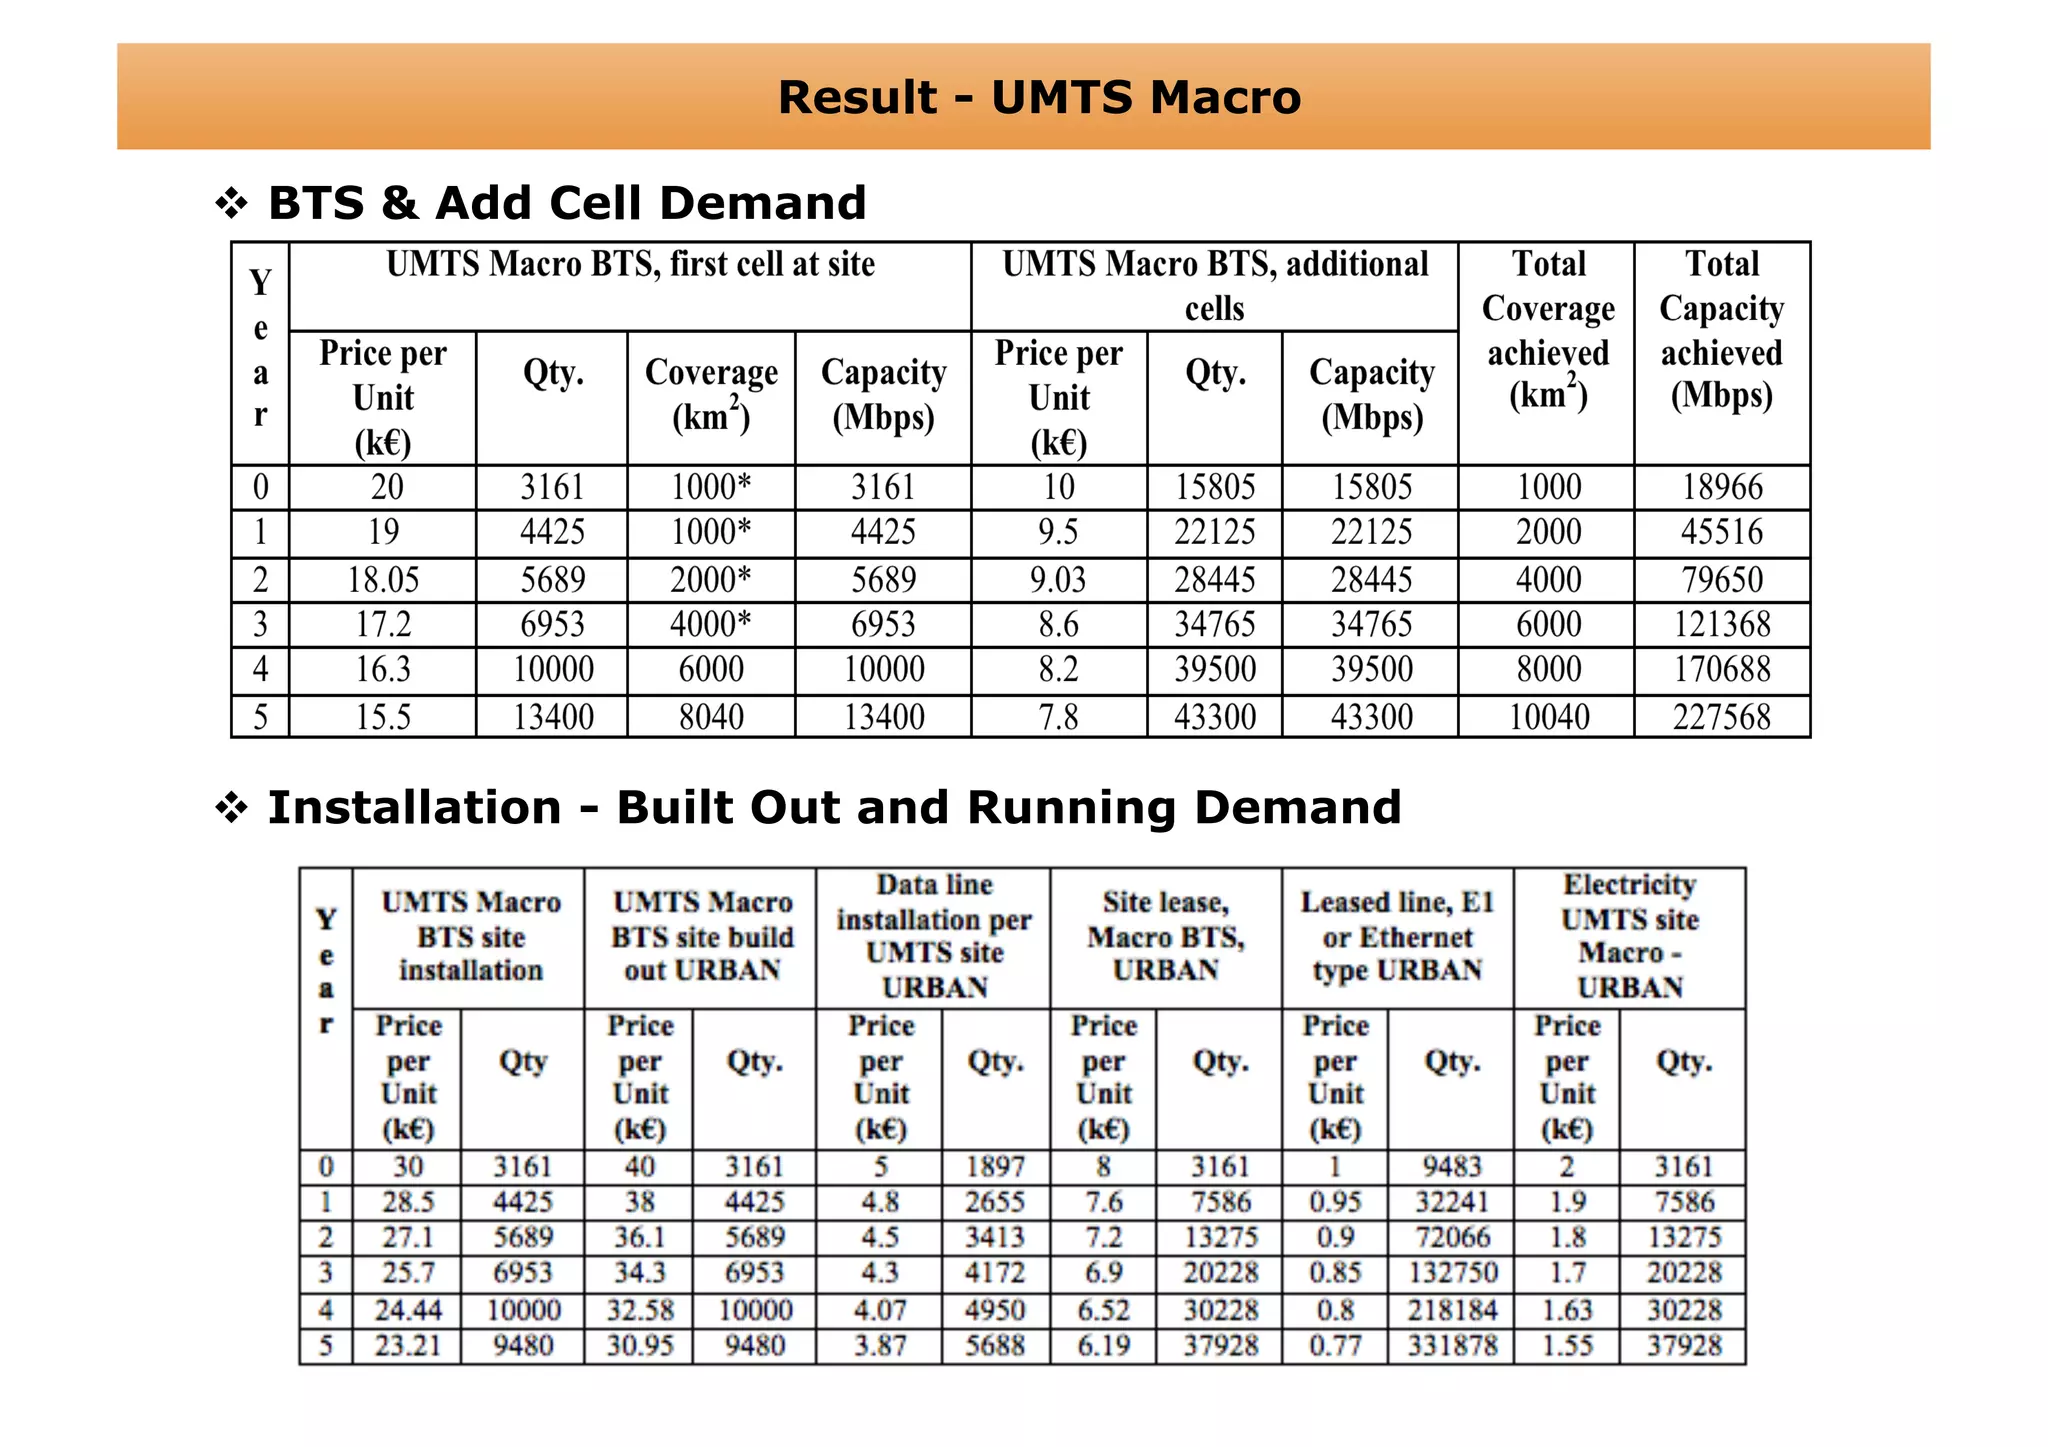
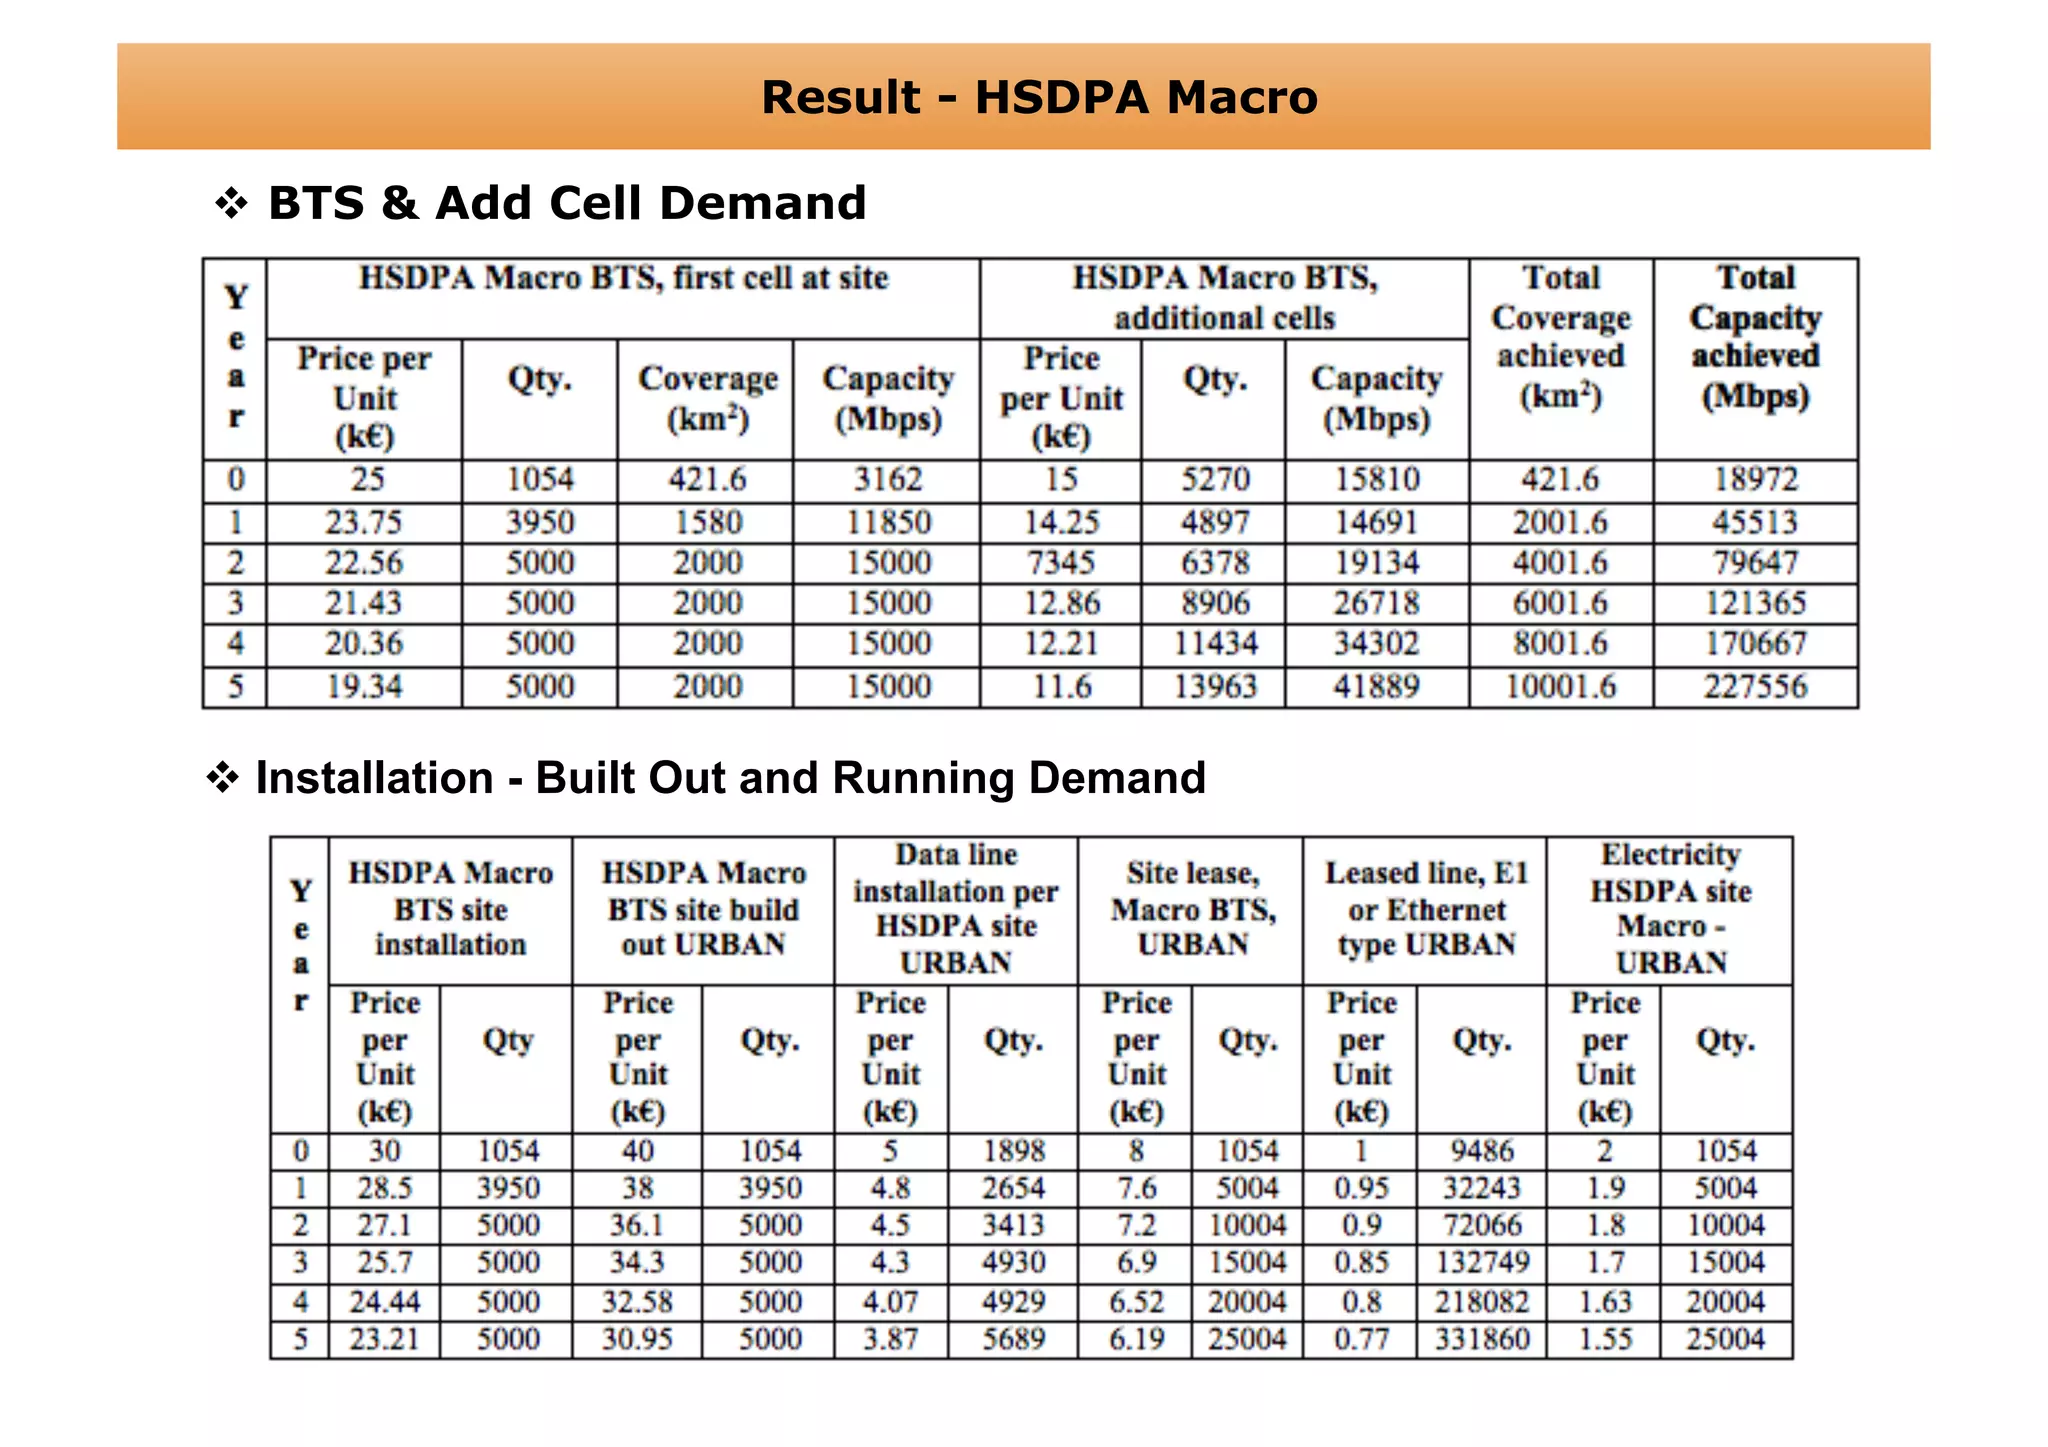
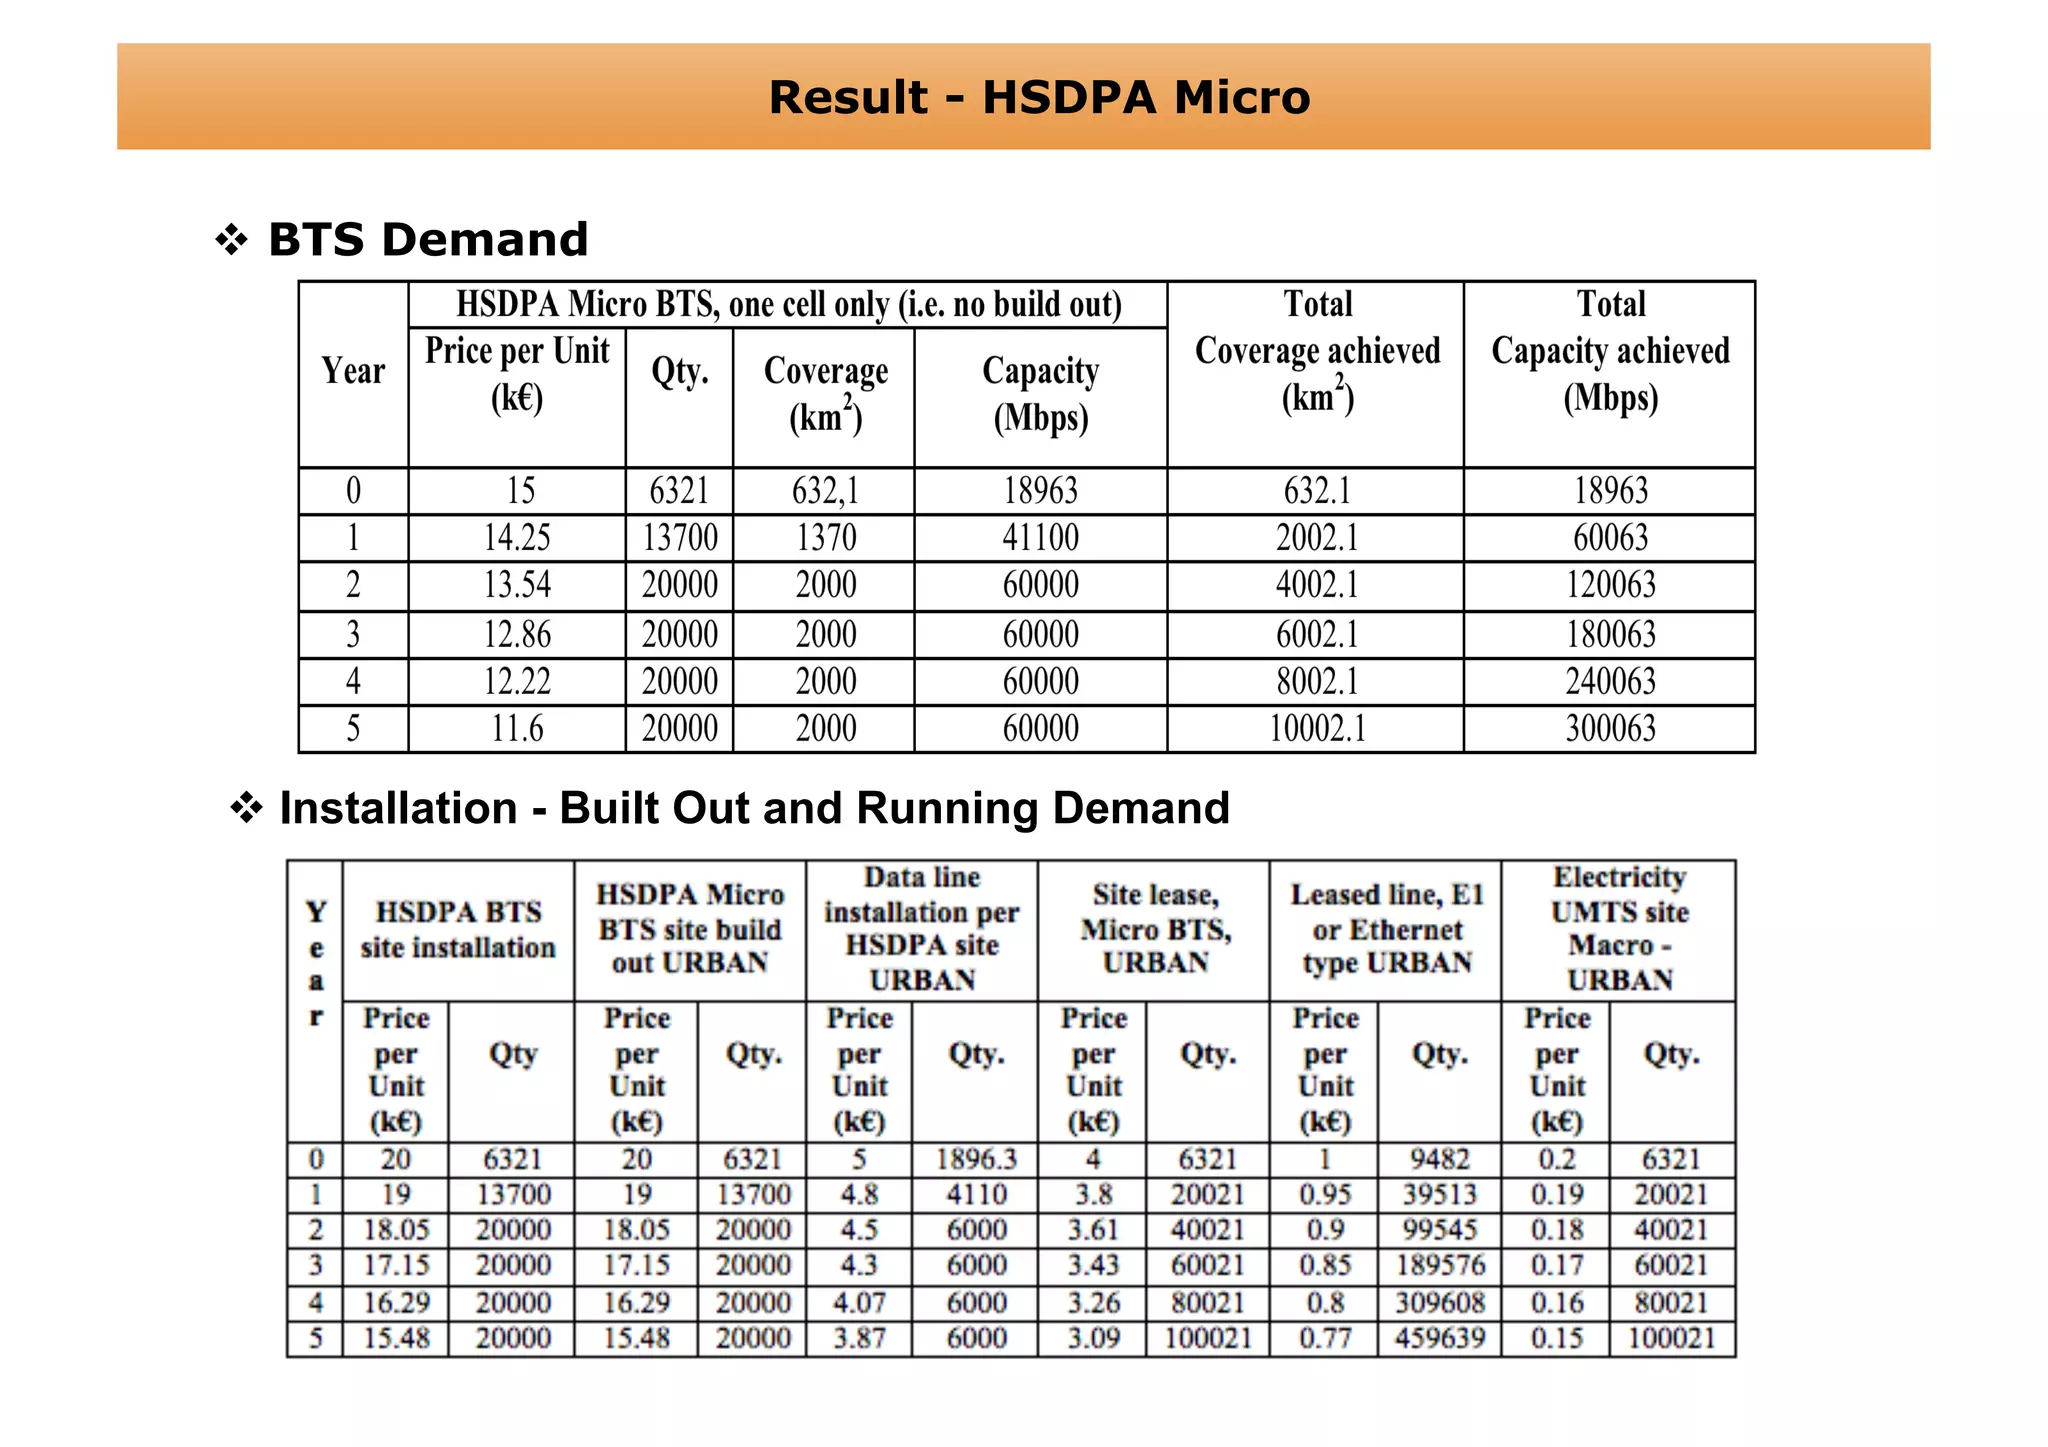
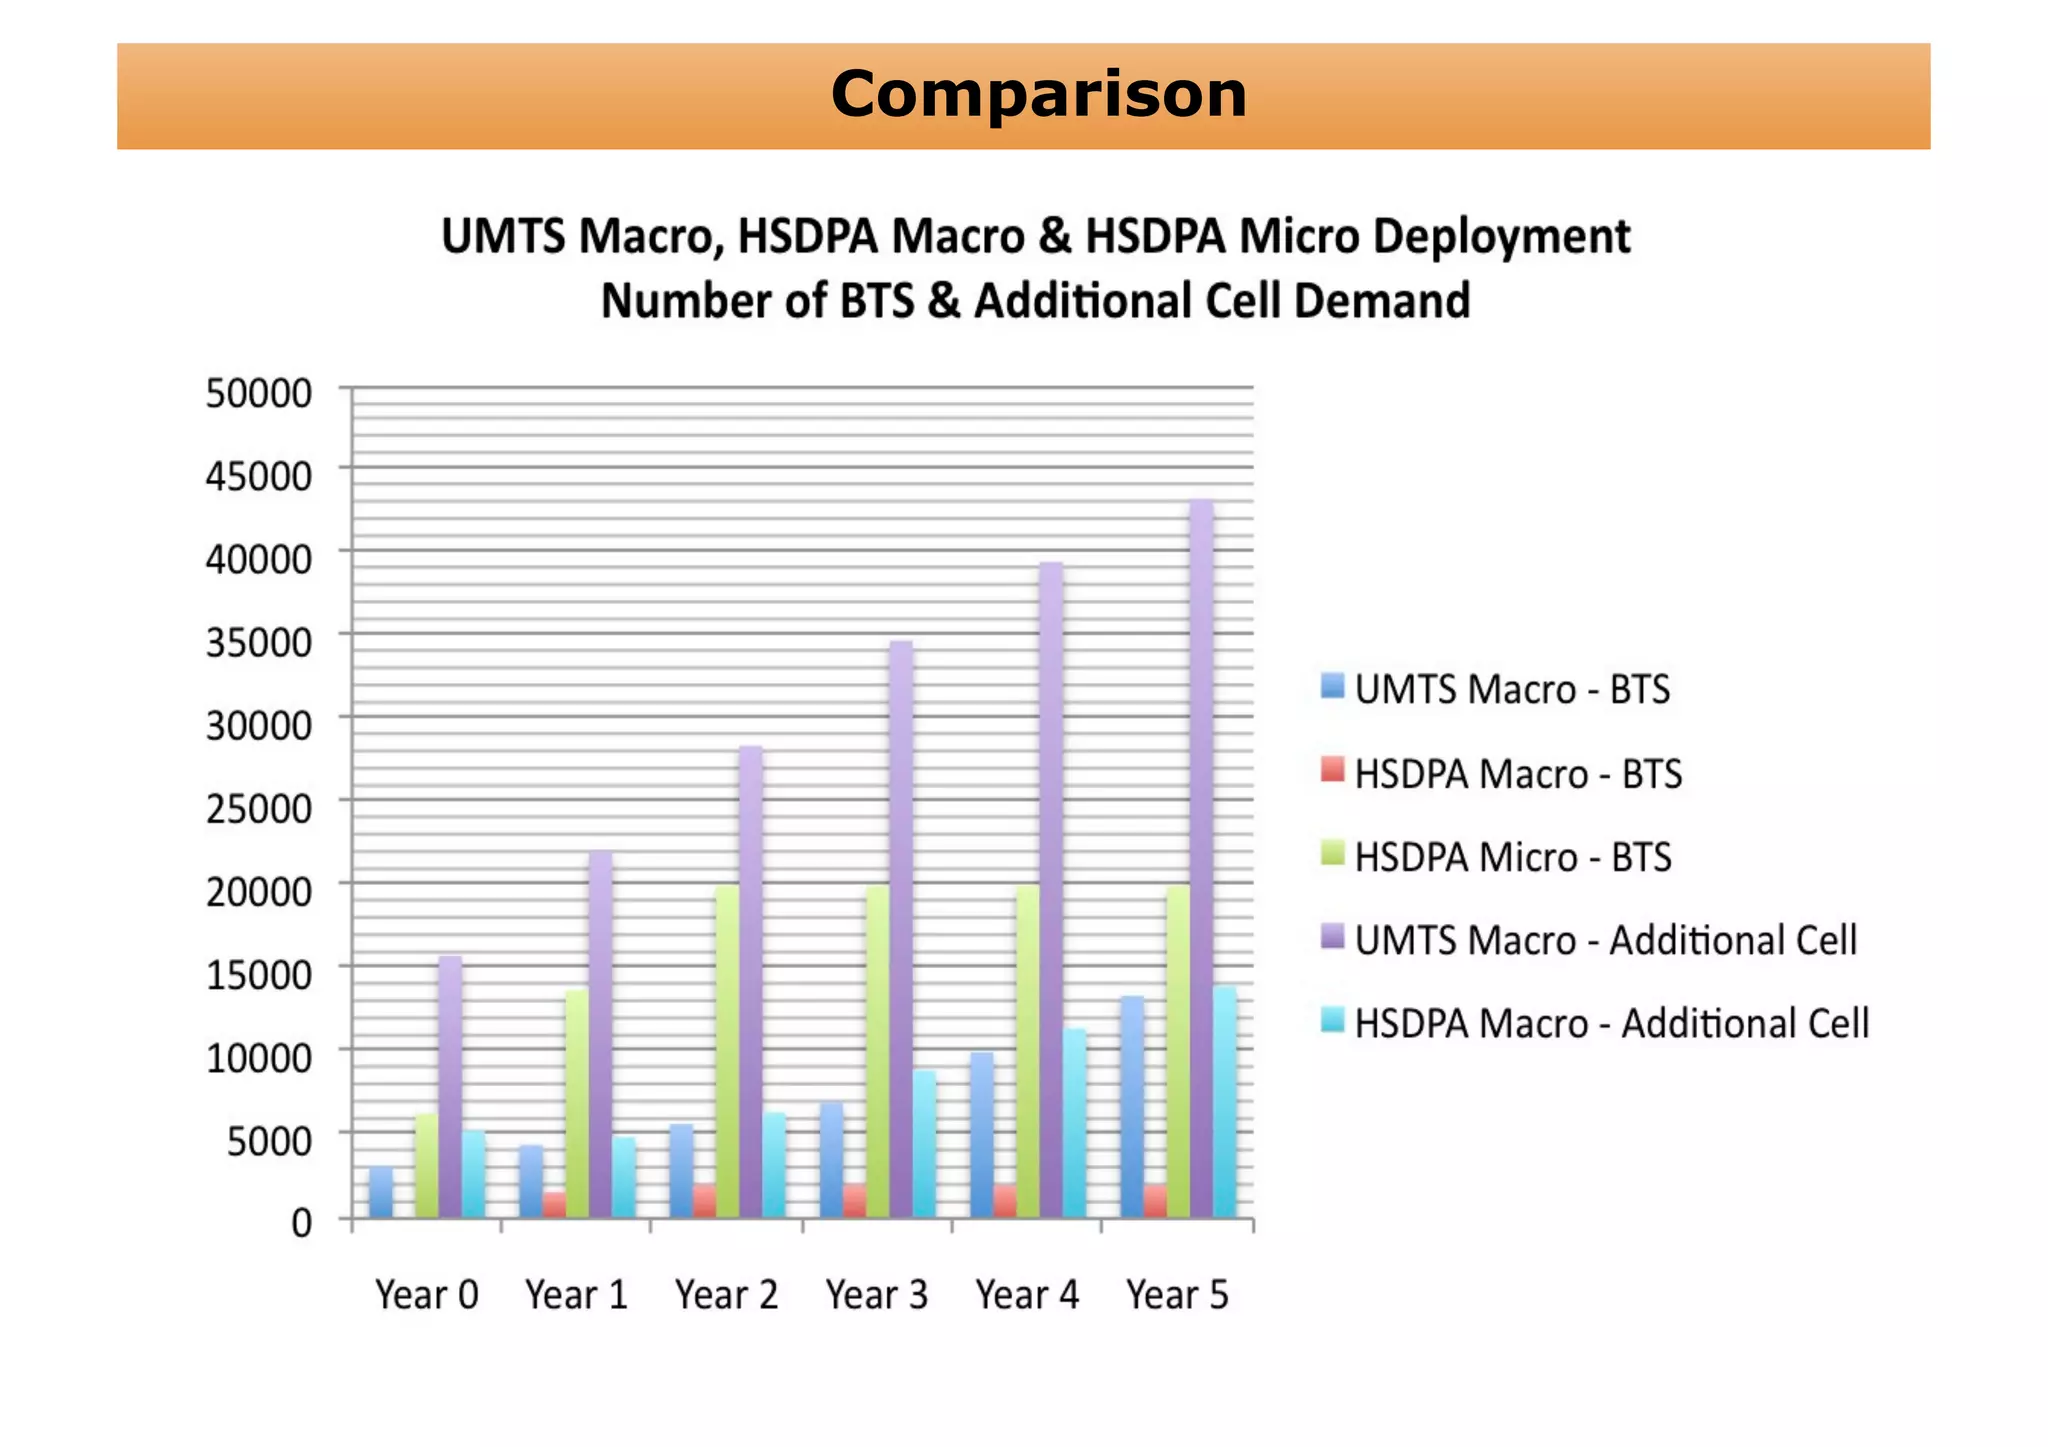
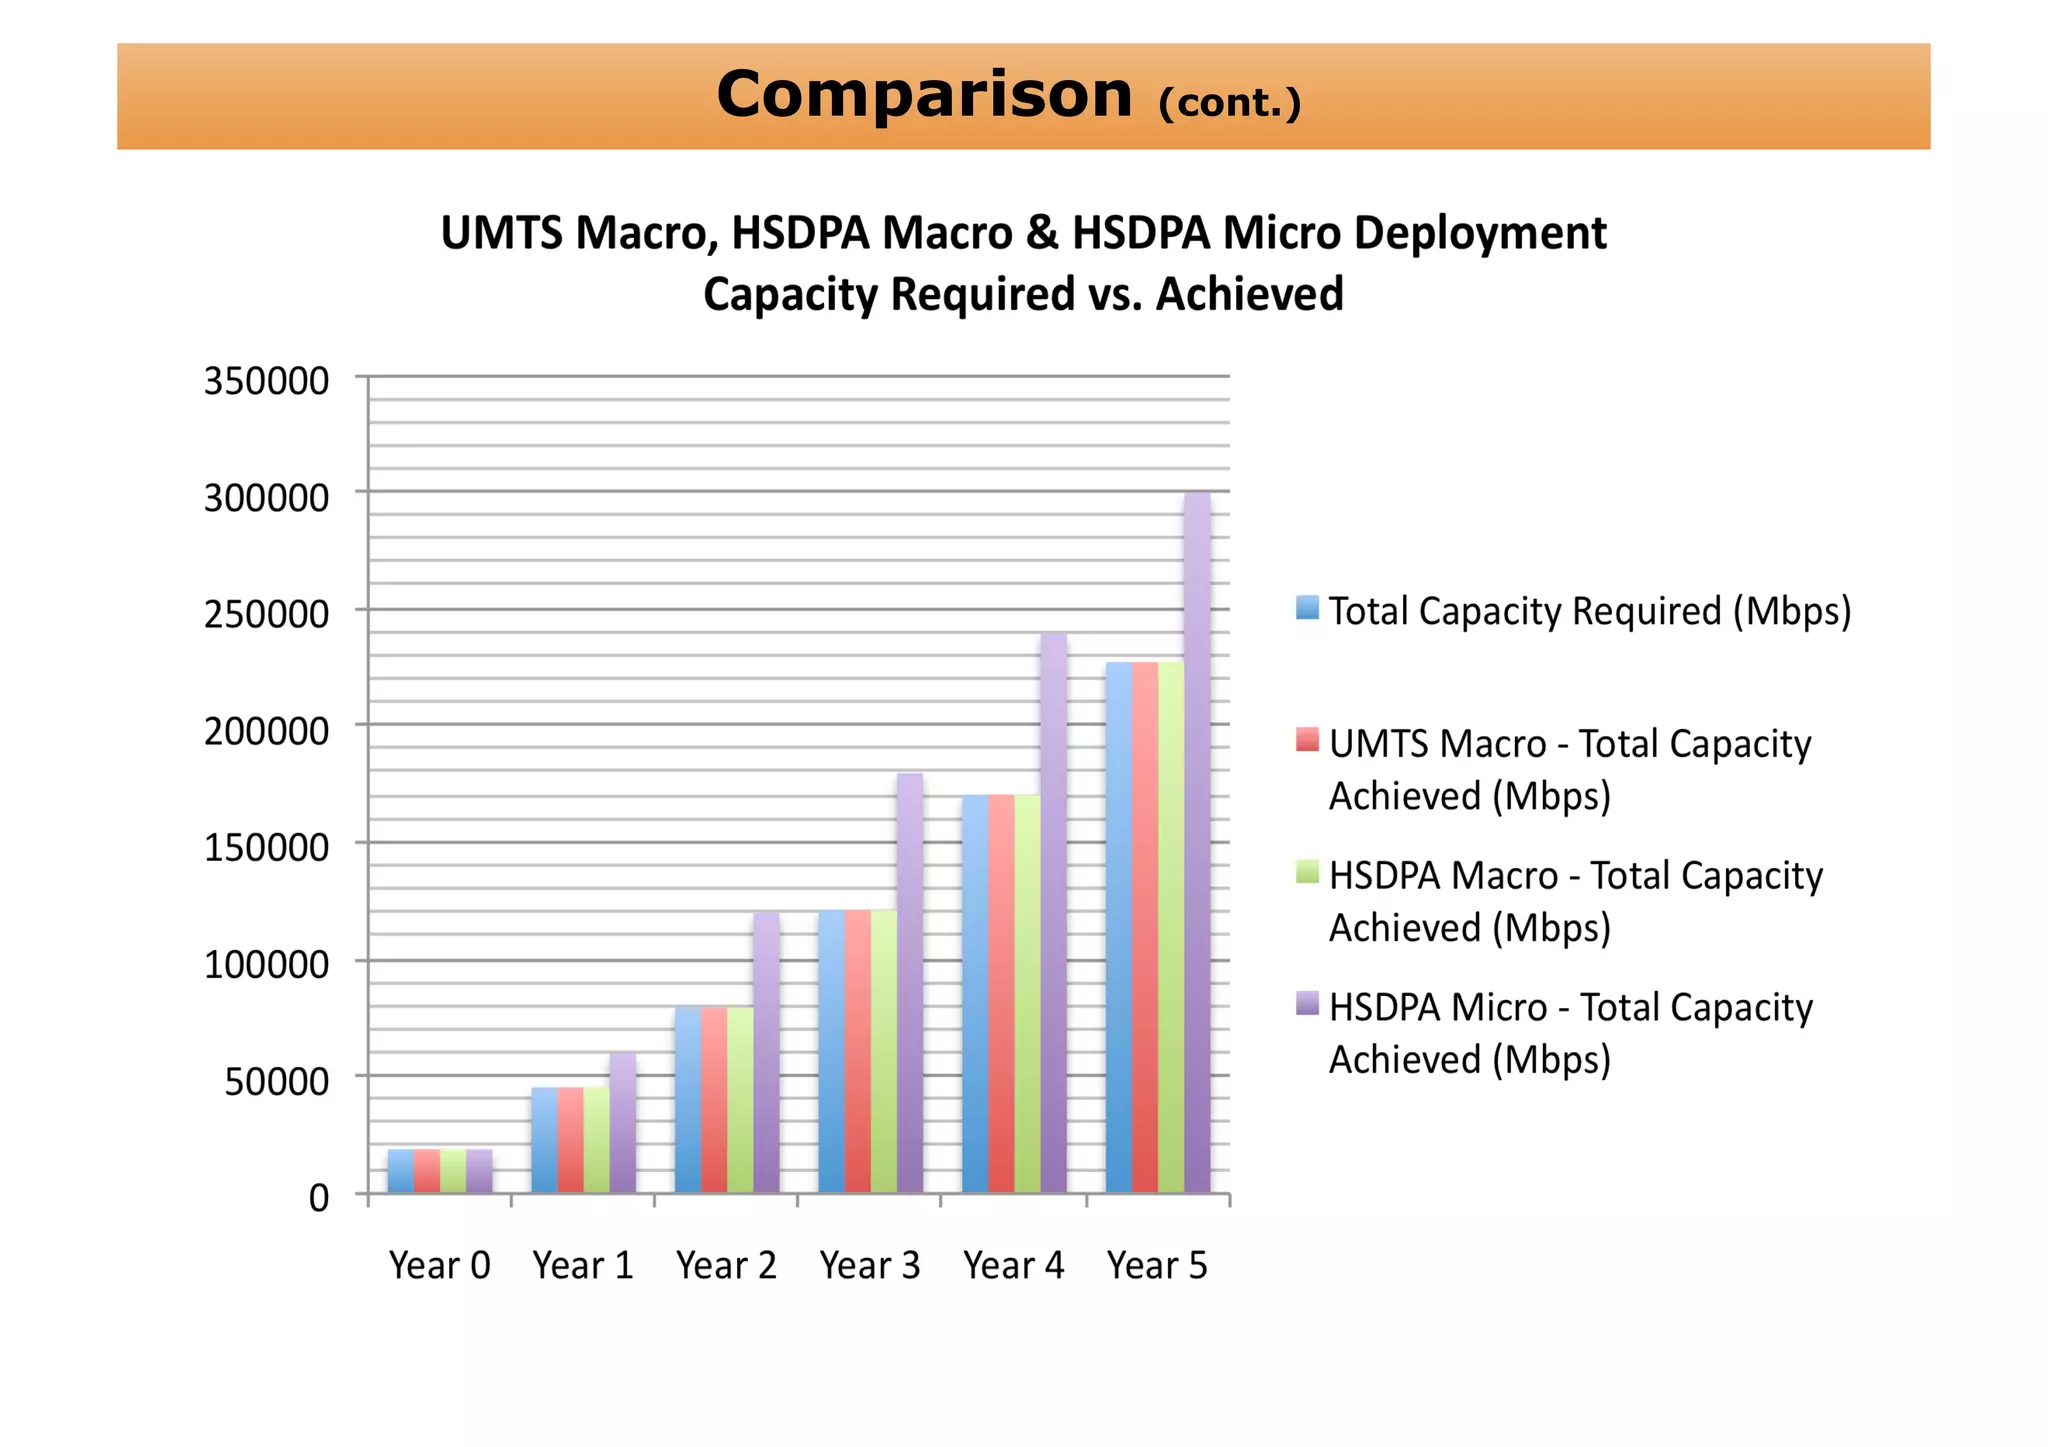
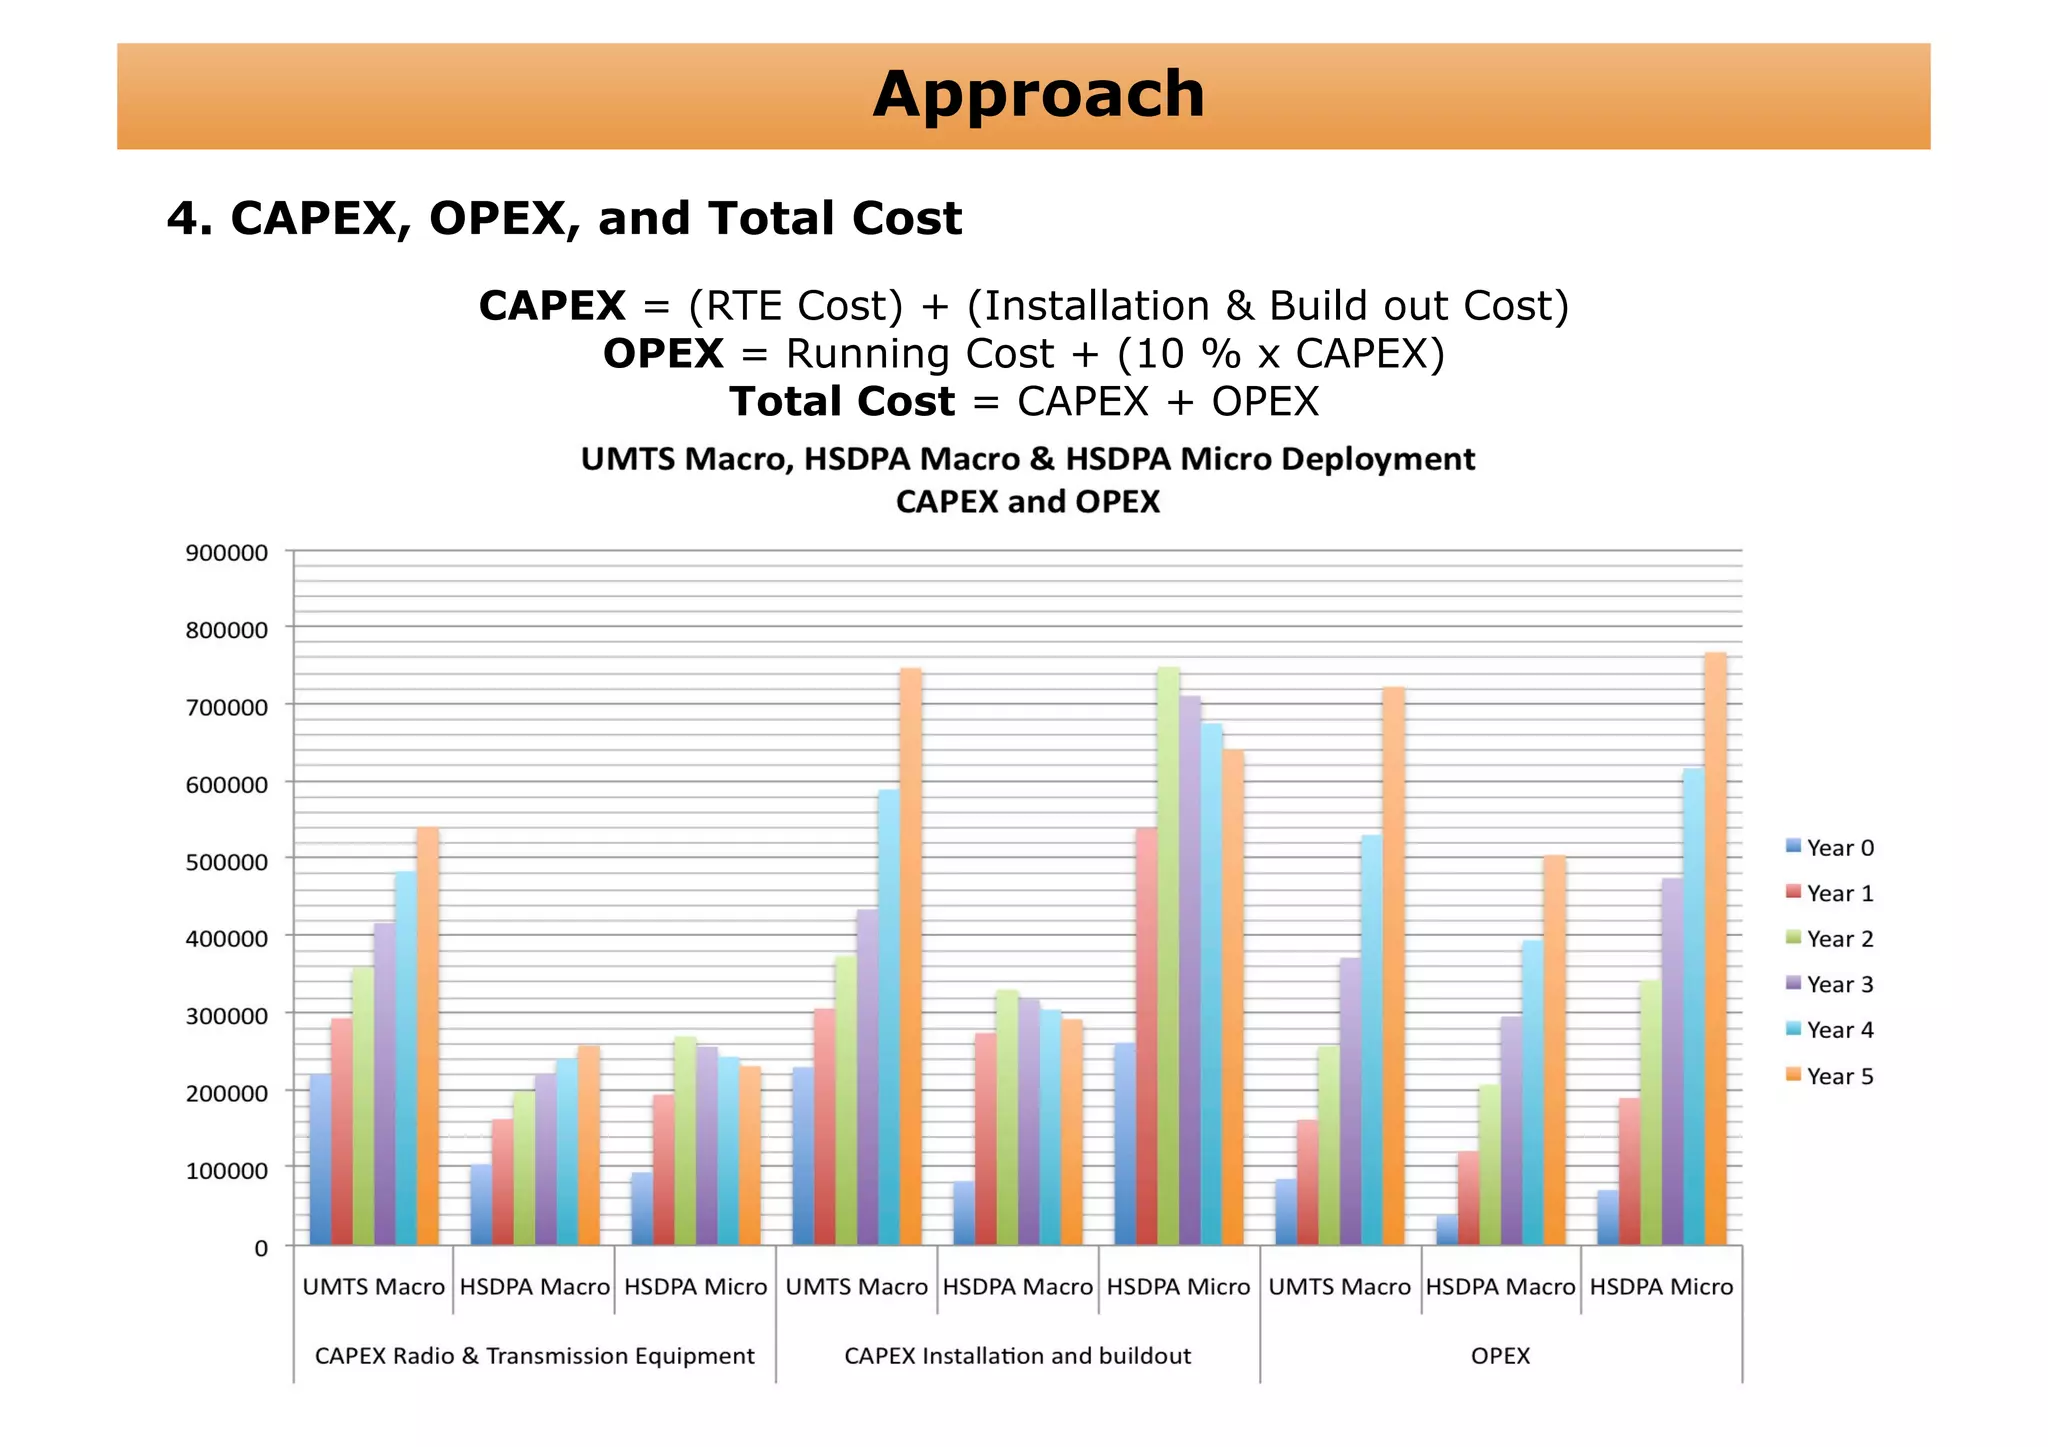
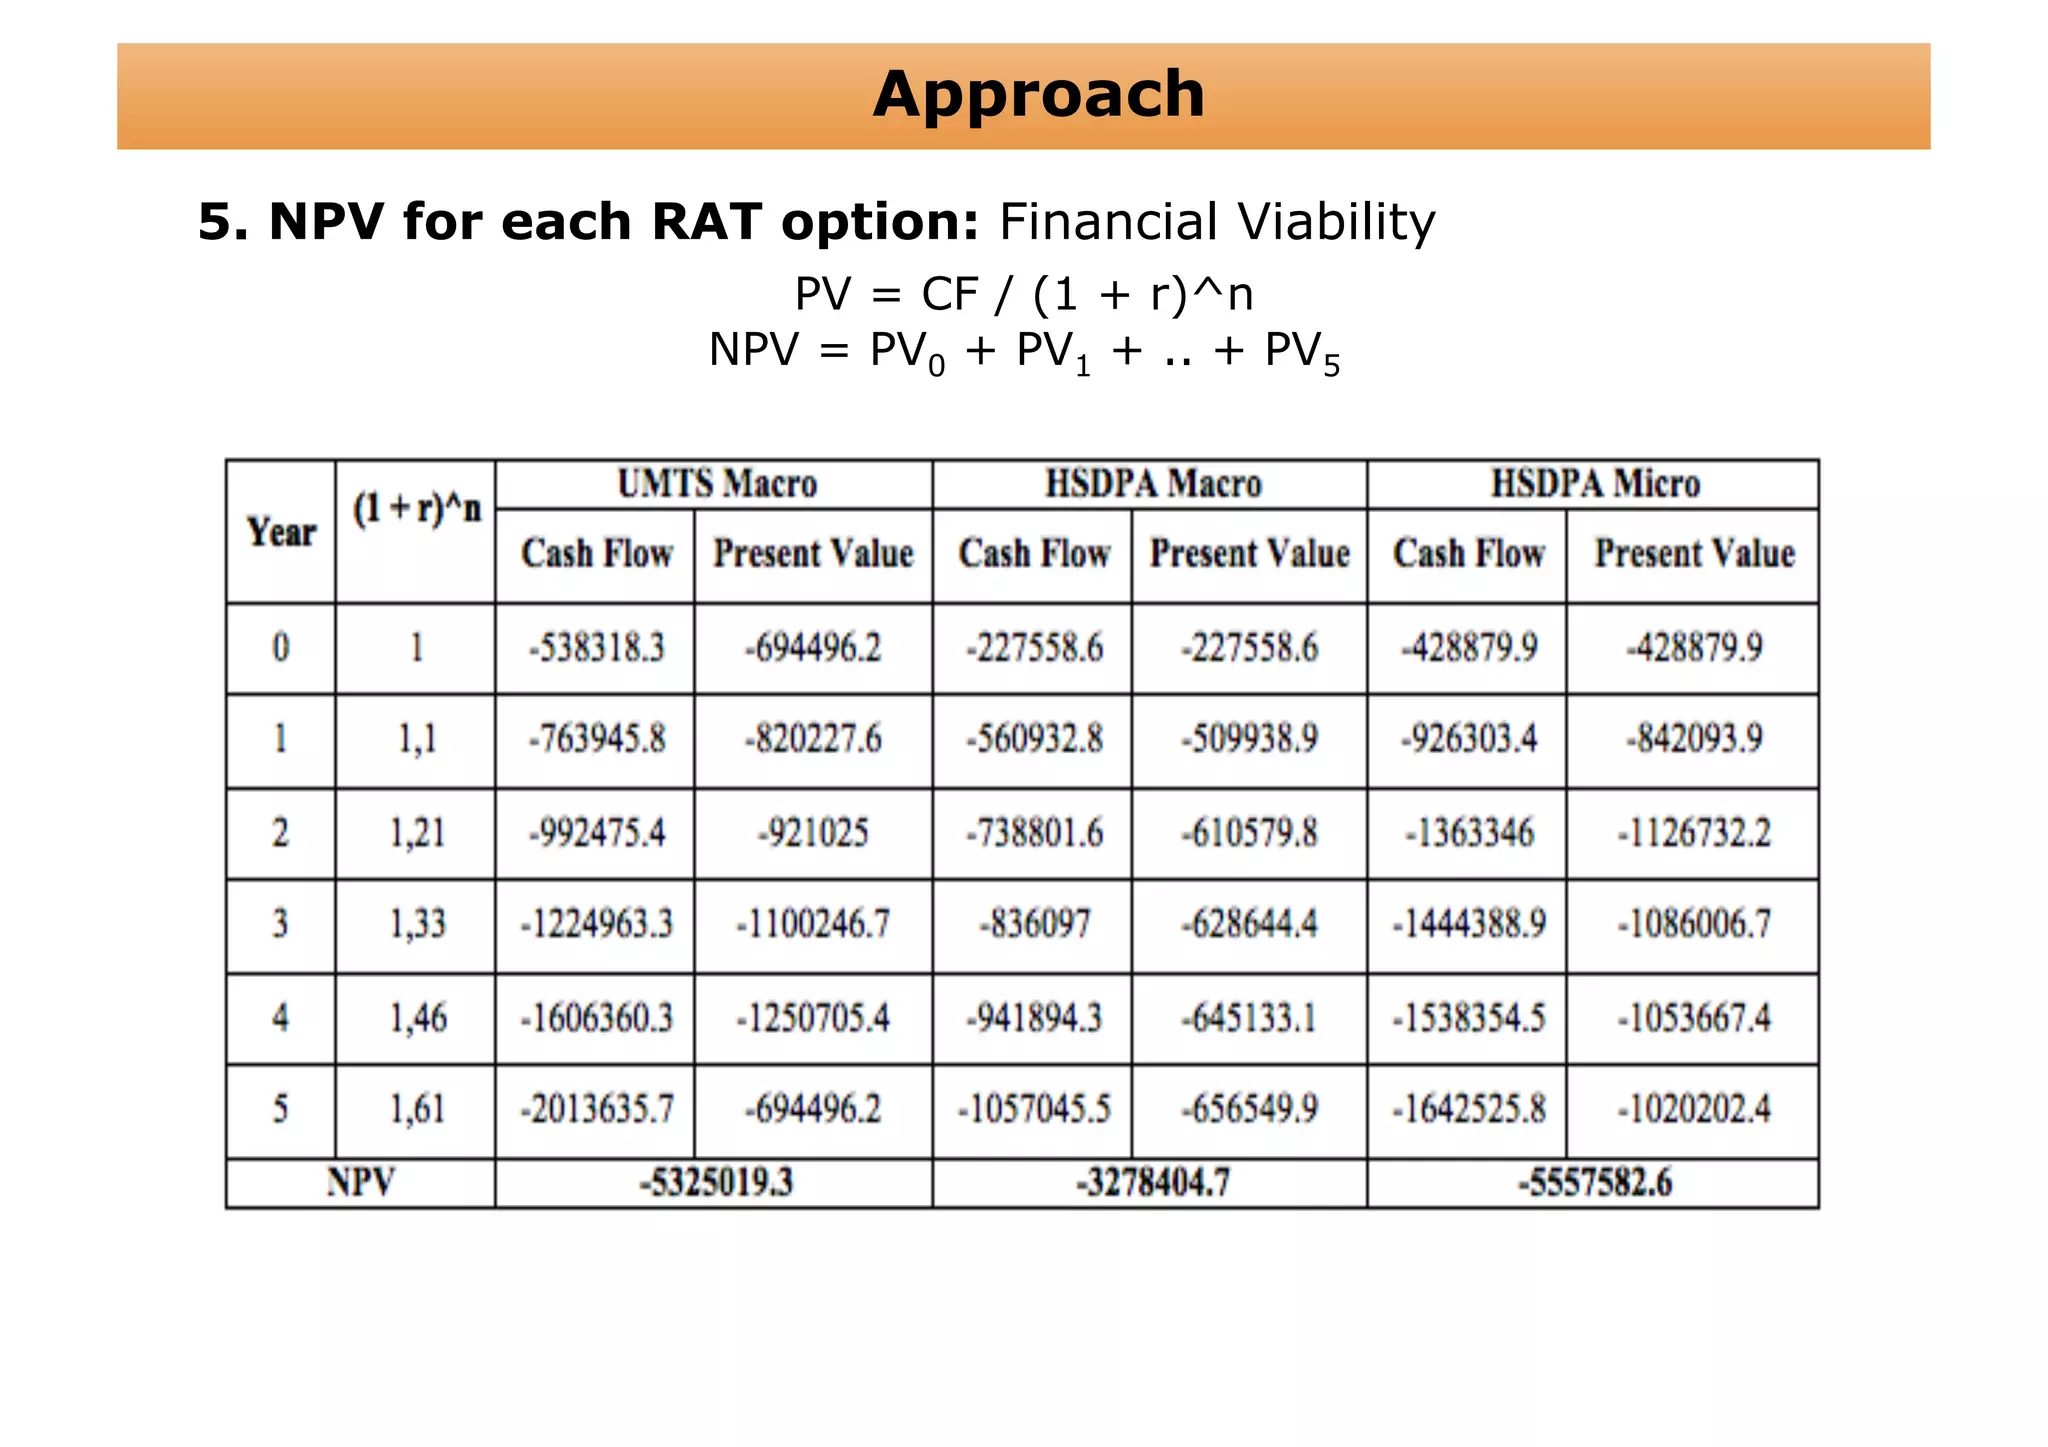
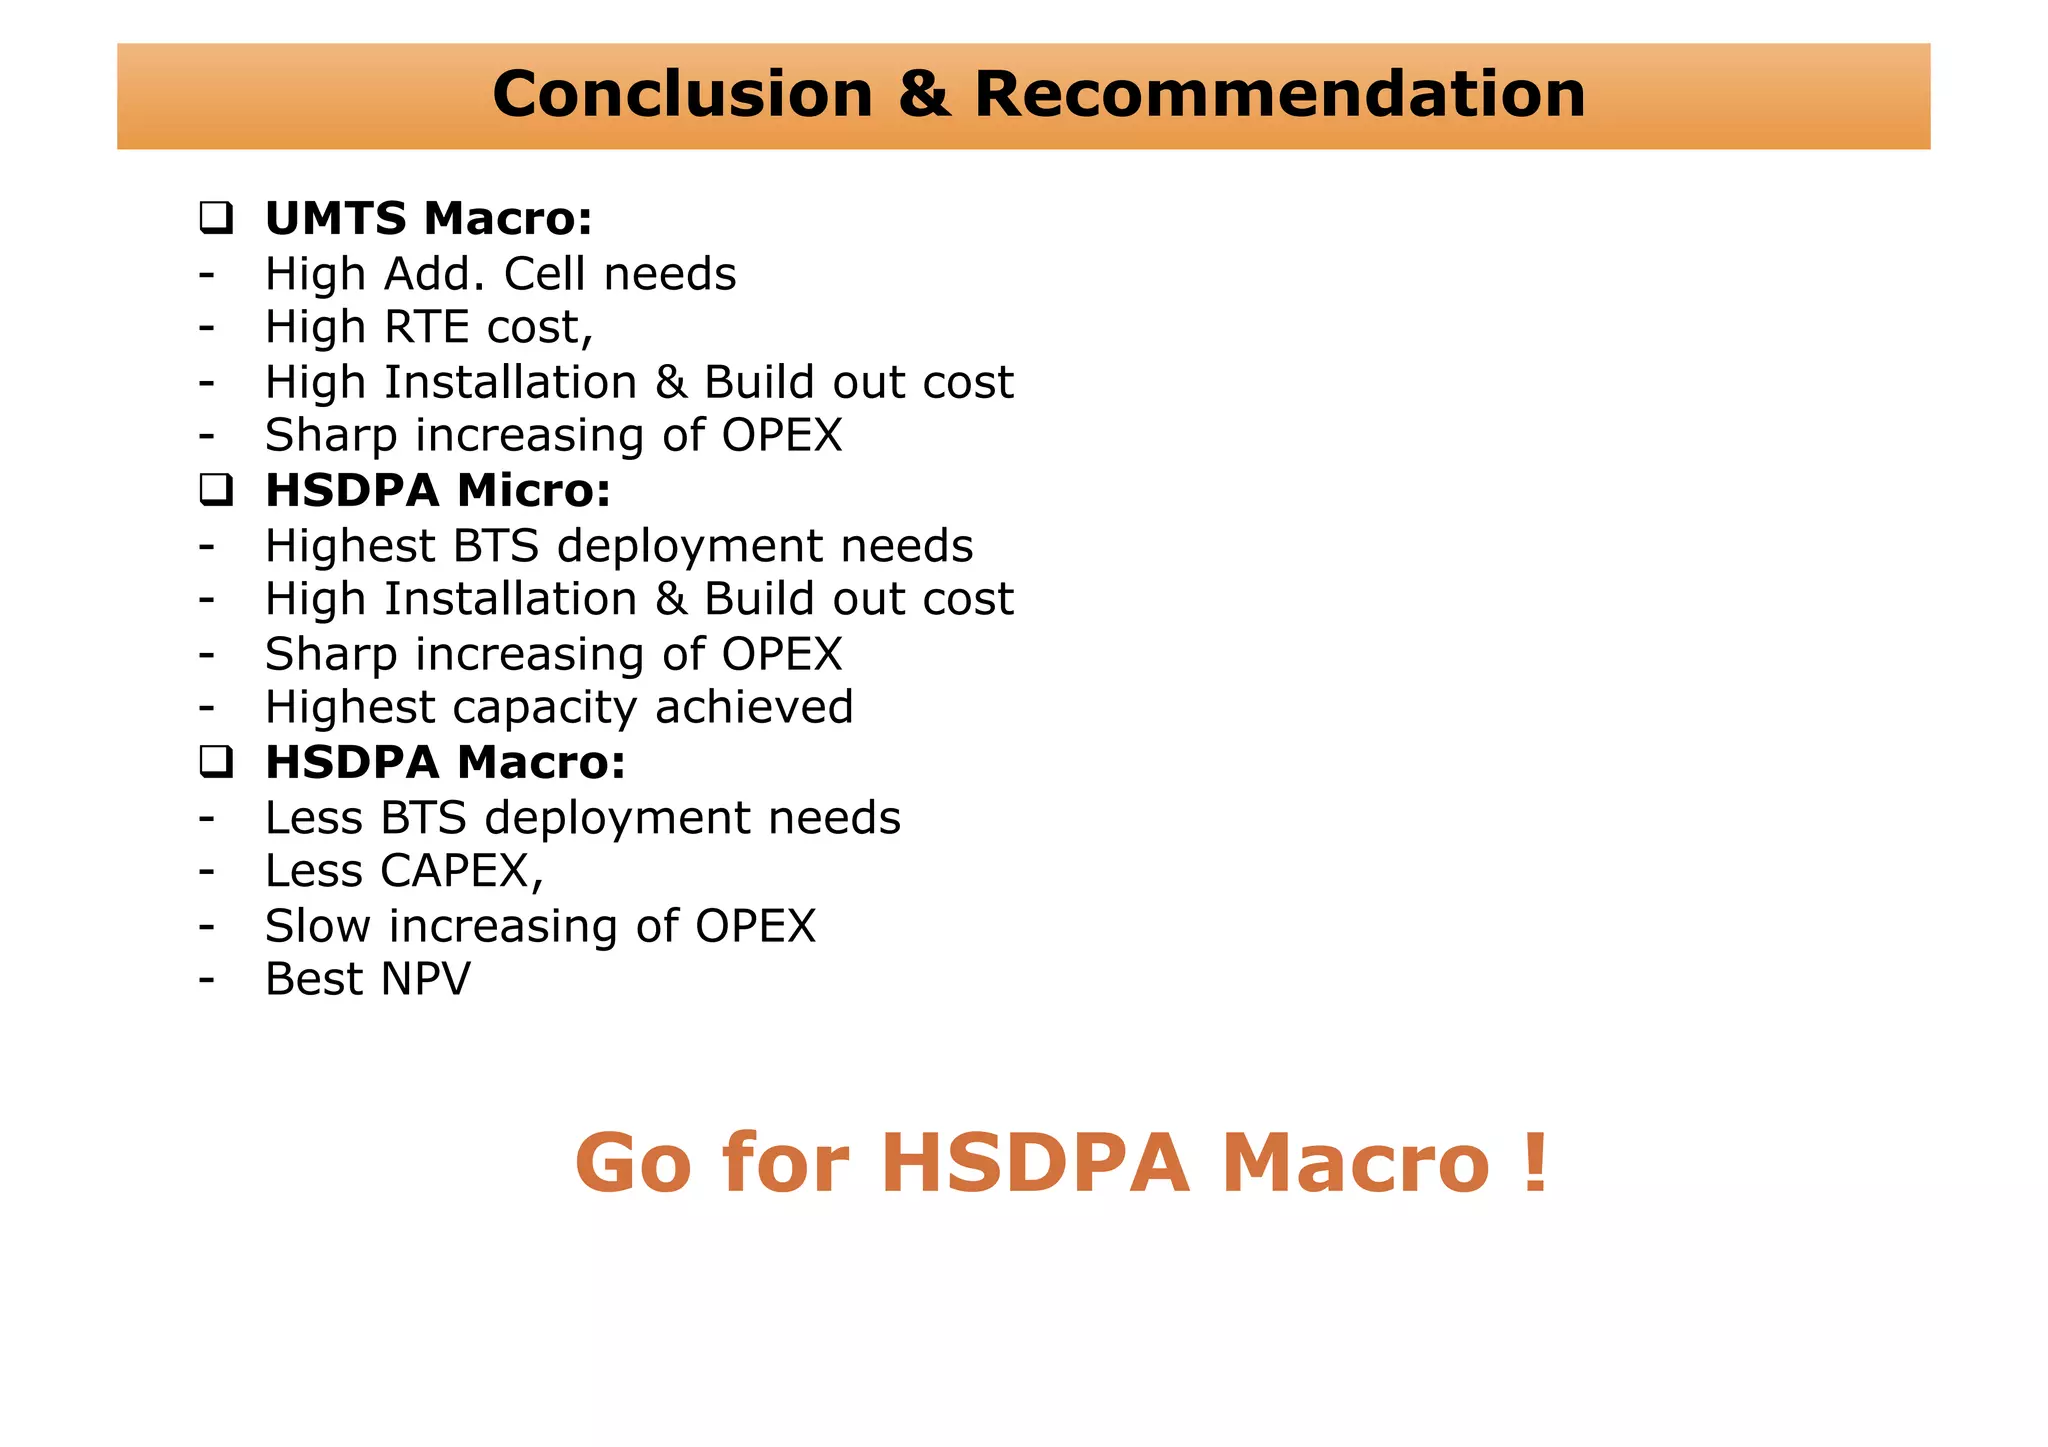
IK2514
       Wireless Infrastructure Deployment & Economics


Homework 3
Dimensioning and Cost Structure Analysis
of Wide Area Data Service Network


                     Laili Aidi (aidi@kth.se)
             Communication Systems, School of ICT, KTH
Scenario

  Coverage type
“Urban”: Population density 2000 / km2, total area 10,000 km2.

  Usage type
“MBB Substitute”, starting from 5 GB/Month in year 0, increasing
prediction 1 GB/Month each year.

  User penetration
“Substitute_1”: starting from 1 % of total population in year 0, increasing
prediction 1% each year.

  Operator type
“Greenfield”: has to deploy the network from scratch.

  RAT options
•  UMTS Macro
•  HSDPA Macro
•  HSDPA Micro
Cost Dimensioning
  UMTS Macro & HSDPA Macro
Cost Dimensioning (cont.)
  HSDPA Micro
Money ?
Approach
1.  Coverage (km2) & User demand
Example Year 0:
•  20% coverage area means:
           20 % x 10,000 km2 = 0 km2 total required coverage
•  1 % user penetration means:
         1 % x (2,000 x 10,000) = 200,000 total predicted user

                                                                         Total Predicted User
            Total Required Coverage (km2)
                                                     1400000
12000
                                                                                                             1200000
                                             10000   1200000
10000
                                                                                                   1000000
                                                     1000000
                                      8000
 8000                                                                                     800000
                                                     800000
                               6000
 6000                                                                            600000
                                                     600000
                        4000                                            400000
 4000                                                400000

                2000                                           200000
 2000                                                200000

        0                                                 0
    0
                                                                 1        2        3        4        5         6
        1         2      3      4      5      6
Approach
2. Capacity demand (Mbps)
Example Year 1:
  Usage per User 6 GB/month/user, thus the user demand (UD1) is:
                   6 GB/month/user x 1,024 = 6144 MB/month/user
As traffic is concentrated in 4 hours / day, thus the user demand in Mbps (UD2) is:
               (UD1)/(30 days x 4 hours x 60 minutes x 60 seconds) x 8
                               = 0.113777778 Mbps/user

  Then the capacity demand for the system would be:
                       (UD2) x 400000 users = 45511.1 Mbps

                                   Total Capacity Demand (Mbps)
                250000                                                       227555.6

                200000
                                                                  170666.7

                150000
                                                       121362.9

                100000                       79644.4

                                   45511.1
                50000
                         18962.9

                    0
                           1          2        3          4          5          6
Approach
3. Total equipment demand for each RAT option

   Coverage achieved (CvTot)
 Coverage achieved by BTS deployment, would be:
                Cv = Maximum cell range * Amount of BTS
 Thus, total Coverage achieved on that year (CvTot) would be:
                      CvTot = Cv + CvTot last years

   Capacity achieved (CpTot)
 Capacity achieved by BTS deployment (Cp1) would be:
                 Cp1 = Maximum capacity * Amount BTS

 Capacity achieved by add cell deployment (Cp2) would be:
                     Cp2 = Maximum capacity * Cell
 Where Add.Cell (Cell) is:
                   Cell = Amount of (Cp) BTS * (6-1)

 Thus, total Capacity achieved on that year (CpTot) would be:
                  CpTot = Cp1 + Cp2 + CpTot last years
Approach

 Data Line (DL)
                     DL = (Cp1 + Cp2) / Data line capacity

 Site installation (SI) and Site build out (SB)
                       SI or SB = Amount of BTS purchased

 Site Lease (SL) and Electricity (EL)
   SL or EL = Amount of BTS purchased + Amount of BTS purchased last year

 Leased Line (LL)
                       LL = CpTot / Leased line capacity
Result - UMTS Macro

  BTS & Add Cell Demand


  Installation - Built Out and Running Demand
Result - HSDPA Macro

  BTS & Add Cell Demand


 Installation - Built Out and Running Demand
Result - HSDPA Micro


  BTS Demand


 Installation - Built Out and Running Demand
Comparison
Comparison   (cont.)
Approach
4. CAPEX, OPEX, and Total Cost
           CAPEX = (RTE Cost) + (Installation & Build out Cost)
               OPEX = Running Cost + (10 % x CAPEX)
                     Total Cost = CAPEX + OPEX
Approach
5. NPV for each RAT option: Financial Viability
                      PV = CF / (1 + r)^n
                   NPV = PV0 + PV1 + .. + PV5
Conclusion & Recommendation
    UMTS Macro:
-    High Add. Cell needs
-    High RTE cost,
-    High Installation & Build out cost
-    Sharp increasing of OPEX
    HSDPA Micro:
-    Highest BTS deployment needs
-    High Installation & Build out cost
-    Sharp increasing of OPEX
-    Highest capacity achieved
    HSDPA Macro:
-    Less BTS deployment needs
-    Less CAPEX,
-    Slow increasing of OPEX
-    Best NPV


                  Go for HSDPA Macro !
Thank You!

Dimensioning and Cost Structure Analysis of Wide Area Data Service Network - Presentation

  • 1.
    IK2514 Wireless Infrastructure Deployment & Economics Homework 3 Dimensioning and Cost Structure Analysis of Wide Area Data Service Network Laili Aidi (aidi@kth.se) Communication Systems, School of ICT, KTH
  • 2.
    Scenario   Coverage type “Urban”:Population density 2000 / km2, total area 10,000 km2.   Usage type “MBB Substitute”, starting from 5 GB/Month in year 0, increasing prediction 1 GB/Month each year.   User penetration “Substitute_1”: starting from 1 % of total population in year 0, increasing prediction 1% each year.   Operator type “Greenfield”: has to deploy the network from scratch.   RAT options •  UMTS Macro •  HSDPA Macro •  HSDPA Micro
  • 3.
    Cost Dimensioning   UMTSMacro & HSDPA Macro
  • 4.
  • 5.
  • 6.
    Approach 1.  Coverage (km2)& User demand Example Year 0: •  20% coverage area means: 20 % x 10,000 km2 = 0 km2 total required coverage •  1 % user penetration means: 1 % x (2,000 x 10,000) = 200,000 total predicted user Total Predicted User Total Required Coverage (km2) 1400000 12000 1200000 10000 1200000 10000 1000000 1000000 8000 8000 800000 800000 6000 6000 600000 600000 4000 400000 4000 400000 2000 200000 2000 200000 0 0 0 1 2 3 4 5 6 1 2 3 4 5 6
  • 7.
    Approach 2. Capacity demand(Mbps) Example Year 1:   Usage per User 6 GB/month/user, thus the user demand (UD1) is: 6 GB/month/user x 1,024 = 6144 MB/month/user As traffic is concentrated in 4 hours / day, thus the user demand in Mbps (UD2) is: (UD1)/(30 days x 4 hours x 60 minutes x 60 seconds) x 8 = 0.113777778 Mbps/user   Then the capacity demand for the system would be: (UD2) x 400000 users = 45511.1 Mbps Total Capacity Demand (Mbps) 250000 227555.6 200000 170666.7 150000 121362.9 100000 79644.4 45511.1 50000 18962.9 0 1 2 3 4 5 6
  • 8.
    Approach 3. Total equipmentdemand for each RAT option   Coverage achieved (CvTot) Coverage achieved by BTS deployment, would be: Cv = Maximum cell range * Amount of BTS Thus, total Coverage achieved on that year (CvTot) would be: CvTot = Cv + CvTot last years   Capacity achieved (CpTot) Capacity achieved by BTS deployment (Cp1) would be: Cp1 = Maximum capacity * Amount BTS Capacity achieved by add cell deployment (Cp2) would be: Cp2 = Maximum capacity * Cell Where Add.Cell (Cell) is: Cell = Amount of (Cp) BTS * (6-1) Thus, total Capacity achieved on that year (CpTot) would be: CpTot = Cp1 + Cp2 + CpTot last years
  • 9.
    Approach  Data Line (DL) DL = (Cp1 + Cp2) / Data line capacity  Site installation (SI) and Site build out (SB) SI or SB = Amount of BTS purchased  Site Lease (SL) and Electricity (EL) SL or EL = Amount of BTS purchased + Amount of BTS purchased last year  Leased Line (LL) LL = CpTot / Leased line capacity
  • 10.
    Result - UMTSMacro   BTS & Add Cell Demand   Installation - Built Out and Running Demand
  • 11.
    Result - HSDPAMacro   BTS & Add Cell Demand  Installation - Built Out and Running Demand
  • 12.
    Result - HSDPAMicro   BTS Demand  Installation - Built Out and Running Demand
  • 13.
  • 14.
    Comparison (cont.)
  • 15.
    Approach 4. CAPEX, OPEX,and Total Cost CAPEX = (RTE Cost) + (Installation & Build out Cost) OPEX = Running Cost + (10 % x CAPEX) Total Cost = CAPEX + OPEX
  • 16.
    Approach 5. NPV foreach RAT option: Financial Viability PV = CF / (1 + r)^n NPV = PV0 + PV1 + .. + PV5
  • 17.
    Conclusion & Recommendation   UMTS Macro: -  High Add. Cell needs -  High RTE cost, -  High Installation & Build out cost -  Sharp increasing of OPEX   HSDPA Micro: -  Highest BTS deployment needs -  High Installation & Build out cost -  Sharp increasing of OPEX -  Highest capacity achieved   HSDPA Macro: -  Less BTS deployment needs -  Less CAPEX, -  Slow increasing of OPEX -  Best NPV Go for HSDPA Macro !
  • 18.