Download to read offline


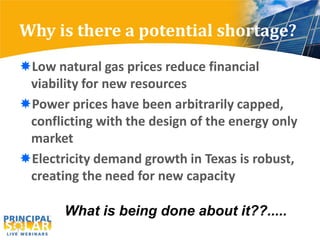


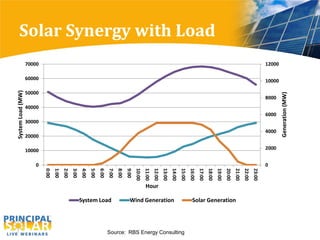
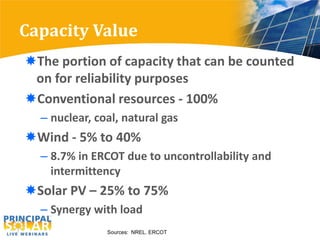
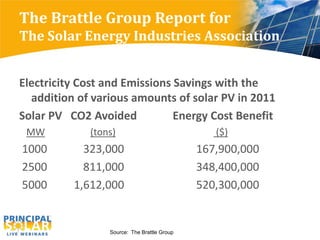


The document discusses the Texas energy shortage and highlights the need for additional capacity in the ERCOT market, where current demand outpaces supply due to low natural gas prices and capped power prices. It emphasizes the potential for solar energy development in Texas, where significant solar PV capabilities are available, suggesting that solar could play a crucial role in addressing the energy needs while providing benefits in terms of cost savings and emissions reduction. Recommendations include considering new resource adequacy requirements and potential legislative actions to enhance the energy market framework.


