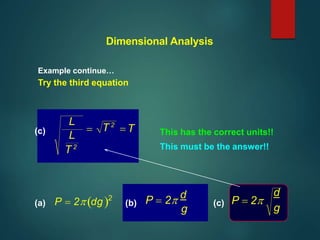
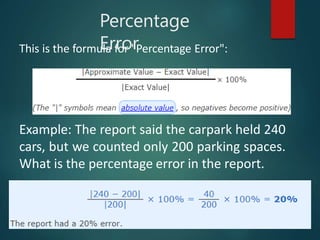
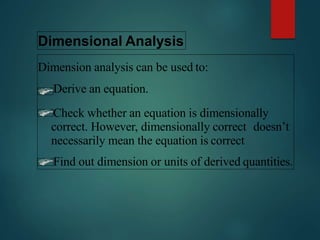
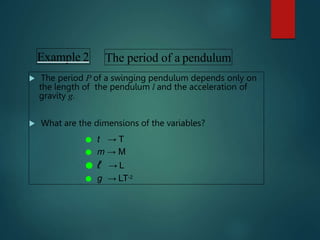
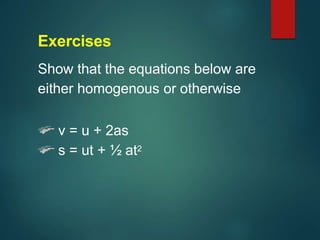
Dimensional analysis can be used to derive equations, check if equations are dimensionally correct, and find the dimensions or units of derived quantities. It involves identifying the fundamental dimensions - such as length, time, mass - of the variables in an equation. An equation is dimensionally correct if the dimensions on both sides are equal. For example, the equation for velocity, v=s/t, can be dimensionally checked as [v]=[s]/[t] which gives meters/second. Dimensional analysis allows deriving the formula for the period of a pendulum as T=2π√(l/g).
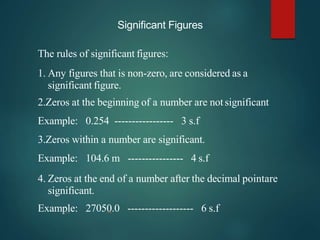
![Many physical quantities can be expressed in terms of a
combination of fundamental dimensions such as
[Length] L
[Time] T
[Mass] M
[Current] A
[Temperature] θ
[Amount] N
The symbol [ ] means dimension or stands for dimension](https://image.slidesharecdn.com/dimensionalanalysis-221103134800-bc1f533f/85/Dimensional-Analysis-pptx-4-320.jpg)
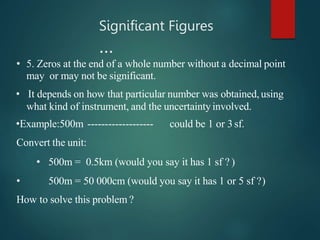
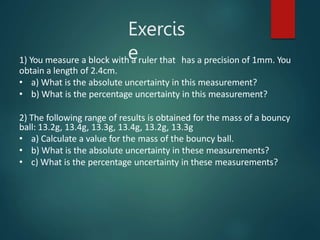
![Derived an Equation (Quantities)
Example 1
Velocity = displacement / time
[velocity] = [displacement] / [time]
= L / T
= LT-1
v = s / t](https://image.slidesharecdn.com/dimensionalanalysis-221103134800-bc1f533f/85/Dimensional-Analysis-pptx-7-320.jpg)
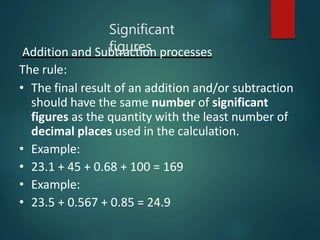
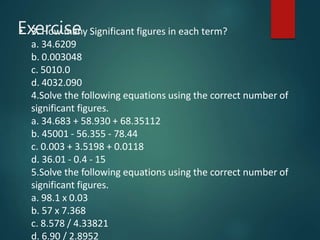
![Write out the dimensions of the variables
= MaLb(LT-2)c
= MaLbLcT-2c
[T] = [ma][ℓb][gc]
T1 = MaLb+cT-2c
Using indices
a = 0
-2c = 1 → c =-½
b + c = 0
b = -c = ½](https://image.slidesharecdn.com/dimensionalanalysis-221103134800-bc1f533f/85/Dimensional-Analysis-pptx-10-320.jpg)
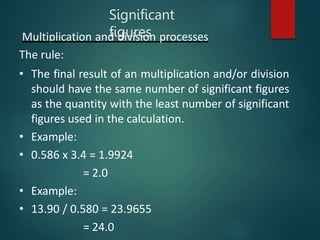
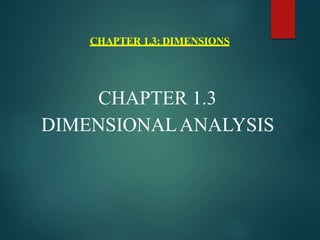
![To check whether a specific formula or
an equation is homogenous
Example 1
S = vt
[s] = [v] [t]
L.H.S
[s] = L
R.H.S
[v] [t] = LT-1(T)
= L
Thus, the left hand side = right hand side, renderingthe
equation as homogenous](https://image.slidesharecdn.com/dimensionalanalysis-221103134800-bc1f533f/85/Dimensional-Analysis-pptx-13-320.jpg)
![m
C
[m]
Example 2
Given that the speed for the wave of a ropeis
F
,
m
[C]2
[F]
Check its homogenity by using the dimensionalanalysis
C 2
F](https://image.slidesharecdn.com/dimensionalanalysis-221103134800-bc1f533f/85/Dimensional-Analysis-pptx-14-320.jpg)
![L.H.S
[C] = (LT-1)2
[C] = L2T-2
R.H.S
[F] = MLT-2 ,
[M ] M
[F] MLT2
= LT-2
[M] = M
Conclusion: The above equation is not homogenous
(L.H.S ≠ R.H.S)](https://image.slidesharecdn.com/dimensionalanalysis-221103134800-bc1f533f/85/Dimensional-Analysis-pptx-15-320.jpg)
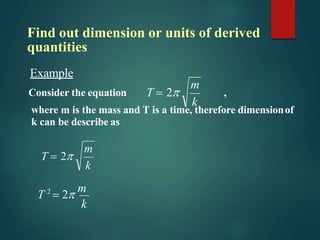
![T2
k
2m
[T2
]
[k]
[m]
M
T2
MT2
→ unit: kgs-2
thus, the units of k is inkgs-2](https://image.slidesharecdn.com/dimensionalanalysis-221103134800-bc1f533f/85/Dimensional-Analysis-pptx-18-320.jpg)