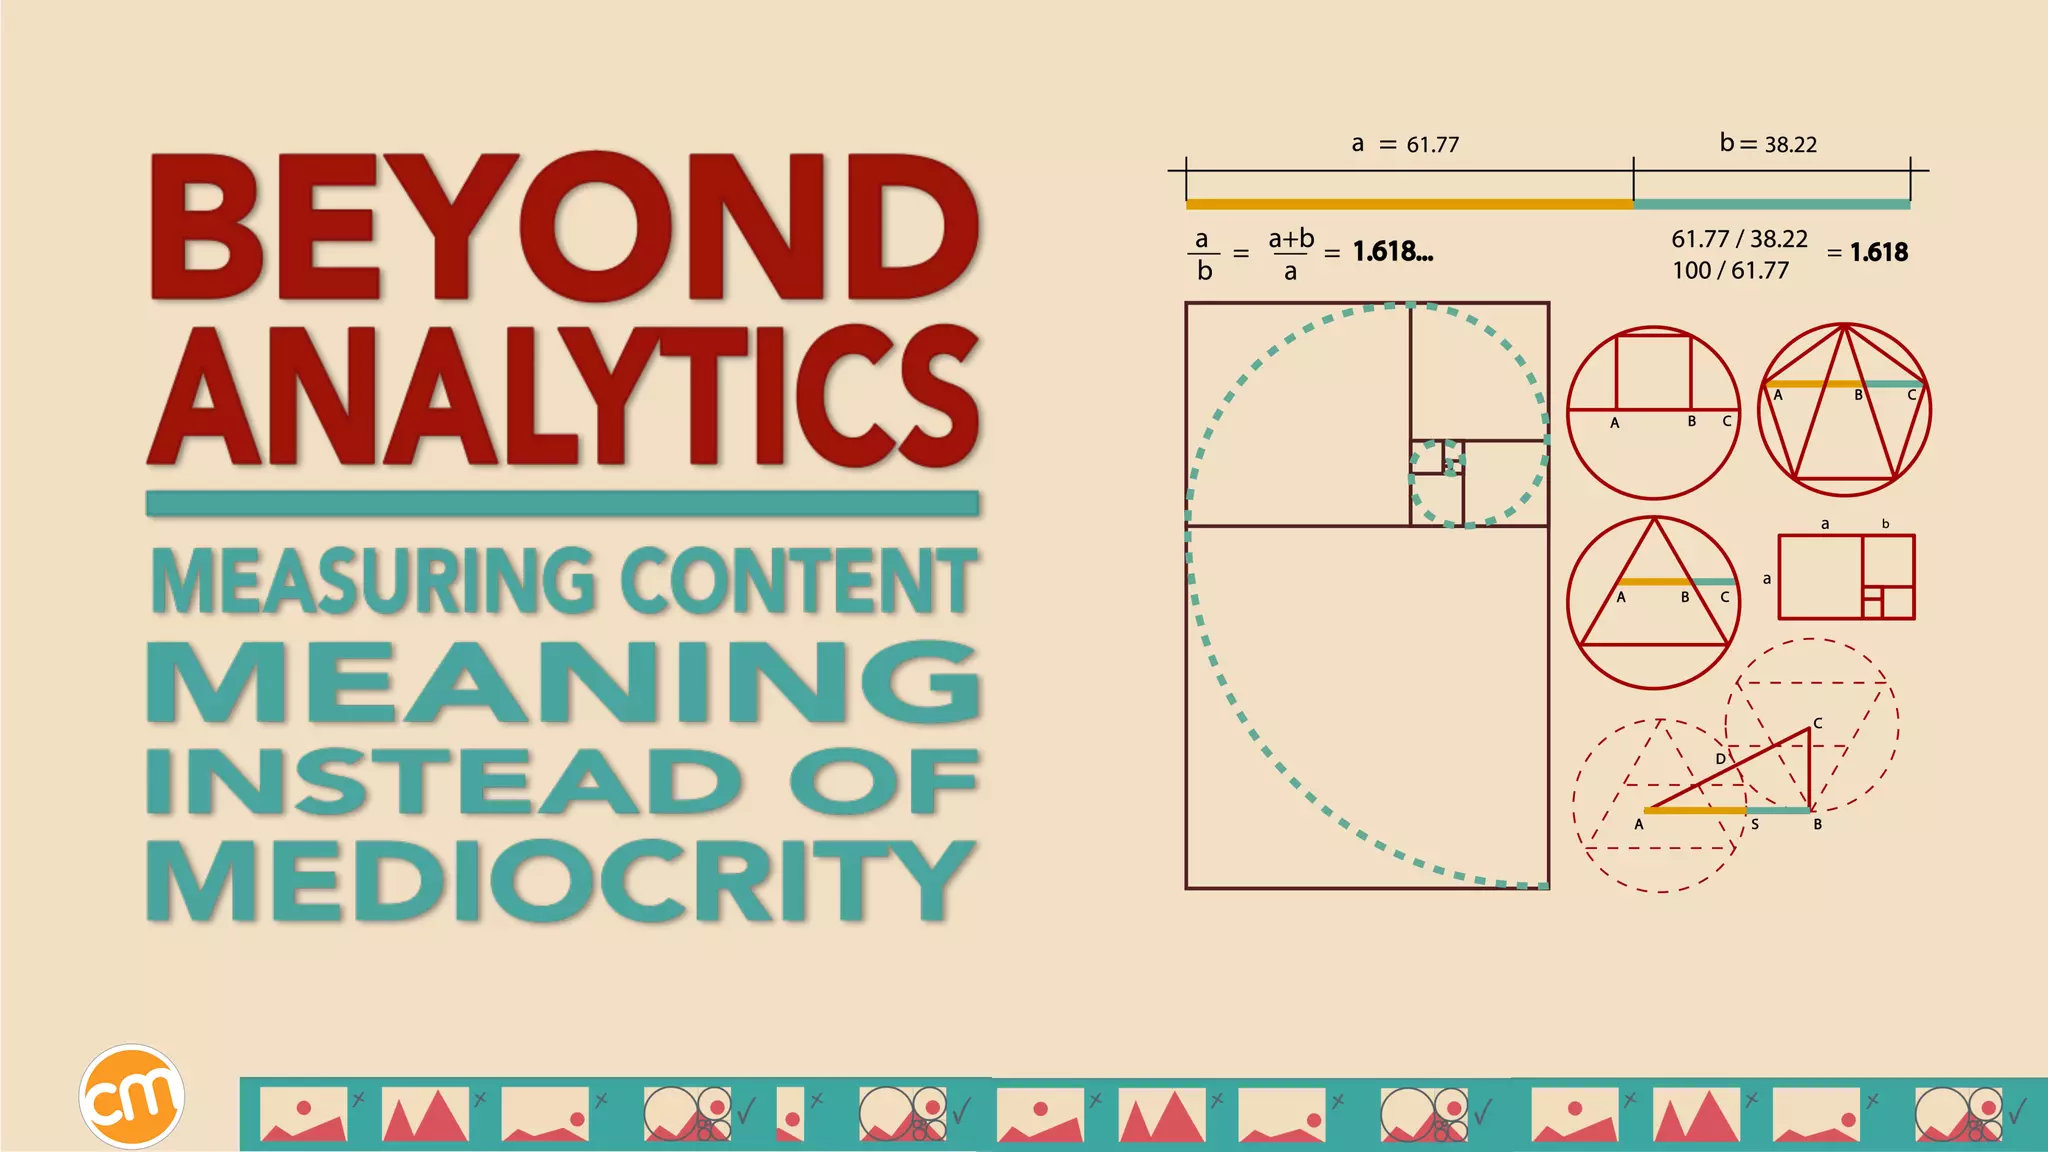
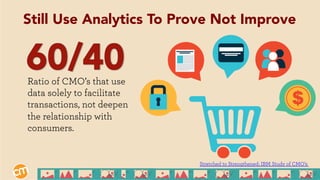
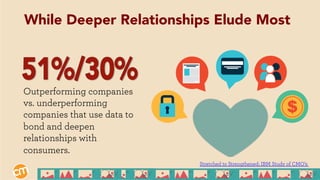
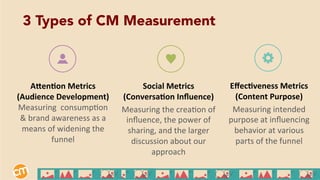
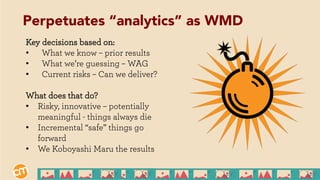
We can skip this, yes?
18%	
  
200%	
  
400%	
  
100 Hrs.
/ Min.	
  
1000%	
  
Ratio of CMO’s that use
data solely to facilitate
transactions, not deepen
the relationship with
consumers.
Stretched to Strengthened: IBM Study of CMO’s
Still Use Analytics To Prove Not Improve
Outperforming companies
vs. underperforming
companies that use data to
bond and deepen
relationships with
consumers.
While Deeper Relationships Elude Most
Stretched to Strengthened: IBM Study of CMO’s
an a lyt ics
/ anl’itiks /
noun
plural noun: analytics
1.  The systematic computational analysis of data
or statistics.
Information resulting from the systematic analysis
of data or statistics
. . .
Analytics Defined:
an a lyt ics
/ anl’itiks /
WMD
Weapon Of Mass Delusion
1.  A systematic way to make
any effort look like a massive
success or failure depending
on your agenda
. . .
Analytics Re-Defined:
Goals:
Indicate progress to achievement
Key KPI’s
Secondary goals and indicators
Indicators
Data that improve process
The Measurement Pyramid
Goal:
Increase leads by 10% w/
no extra cost in 6 months
Reporting:
•  # of Leads / % of Increase
•  Cost Increase or Decrease
•  Subscribers
•  Conversion rates
•  Email response rates
•  Cost per lead by channel
KEY KPI’s
•  Likes / Followers
•  Page views
•  Social metrics
•  Keyword reports
INDICATORS
The Measurement Pyramid
Measure what’s important and, more
importantly, meaningful.
Frees the team from “always up
and to the right” mentality
Prevents departmental
competition
The Pyramid Benefits
But We Haven’t……
18%	
  
200%	
  
400%	
  
100 Hrs.
/ Min.	
  
1000%	
  
1.  Still operate that content is separate
from “real marketing”
2.  Still think measurement is a way to prove
worth, rather than improve a process
3.  We still think that “content” is an
attribute of marketing instead of value in
and of itself
We Haven’t Changed…
1.  Can we infuse the content marketing
approach into existing strategy
2.  Can we stop measuring in silos? And all
the way down?
3.  Can we stop “acting” like a media
company and actually BE a media
company?
But can we make it better?
WEB	
  BANNER	
  
SEARCH	
  ADS	
  PRINT	
  
SEARCH	
  
Let’s look at an example… Advertising
1	
  Customer	
  -­‐	
  $3,000	
  Cost	
  
Per	
  Customer	
  
50,000	
  Impressions	
  
1%	
  CTR	
  -­‐	
  (500	
  Visitors)	
  
$6.00	
  CPC	
  
30	
  Demo	
  Requests	
  -­‐	
  6%	
  
Conversion	
  Rate	
  
10	
  DemonstraEons	
  -­‐	
  
$300	
  /	
  Demo	
  
Let’s look at an example… Advertising
75	
  Downloads	
  -­‐	
  30%	
  
Conversion	
  Rate	
  
($20	
  ea)	
  
9	
  DemonstraEons	
  	
  ($166)	
  
3	
  Customers	
  -­‐	
  $500	
  Cost	
  
Per	
  Customer	
  
Let’s look at an example… Advertising
50,000	
  Impressions	
  
.5%	
  CTR	
  -­‐	
  (250	
  Visitors)	
  
$6.00	
  CPC	
  
Sometimes Content Marketing IS
more expensive but can it create a
better customer?
“The Switching Economy” $5.9
Trillion up for grabs…
Engaging experiences are not
“nice to have’s” any longer.
Measuring the whole journey
670	
  Miles	
  
$100	
  Dollar	
  Bills	
  
B2B Training Company
Methodology to measure all the
way through – from first
awareness to customer service.
8 Months later…
•  1.2x the cost
•  1.5x the time
Loyalty. Upsell. Evangelism
Customers closed through content
marketing infusion
Spent 2X as much
Stayed 5X as long
2X more likely to share…
It’s not just more likes, leads or
customers. It’s also: Better likes, leads,
customers – relationships.
Loyalty. Upsell. Evangelism.
A"en%on	
  Metrics	
  
(Audience	
  Development)	
  
Measuring	
  	
  consumpEon	
  
&	
  brand	
  awareness	
  as	
  a	
  
means	
  of	
  widening	
  the	
  
funnel	
  	
  
Social	
  Metrics	
  
(Conversa%on	
  Influence)	
  
Measuring	
  the	
  creaEon	
  of	
  
influence,	
  the	
  power	
  of	
  
sharing,	
  and	
  the	
  larger	
  
discussion	
  about	
  our	
  
approach	


Effec%veness	
  Metrics	
  
(Content	
  Purpose)	
  
Measuring	
  intended	
  
purpose	
  at	
  influencing	
  
behavior	
  at	
  various	
  
parts	
  of	
  the	
  funnel	


3 Types of CM Measurement
Visitors/Customers	
  
Awareness	
  recall	
  
Visitor	
  loyalty	


Share	
  of	
  voice	
  	
  
Brand	
  Awareness	
  %	
  
Earned	
  Media	


Impressions	
  
Page	
  views	
  
Downloads	
  
Earned	
  Media	
  $$	
  
Visitors/Leads	
  
Discussion	
  LiZ	
  
Total	
  CPL	
  
Customer	
  Cost	
  RaEo	
  
NPS	
  -­‐	
  Loyalty	


Social	
  Shares	
  
SenEment	
  Analysis	
  
Influencer	
  MenEons	


Tweets,	
  Likes	
  +1’s	
  
Forwards	
  
Inbound	
  Links	


Cost	
  Per	
  Visitor	
  
Lead	
  (by	
  channel)	
  
Total	
  Value	
  by	
  lead	


Blog	
  subscripEons	
  
Time	
  on	
  site	
  
Referral	
  Traffic	


Some examples for ya…
Broad range of campaigns
Winnow and place our bets on
campaigns/projects
Map into phrases:
Plan, Development, Launch, Manage
Separate these phases by stage gates.
Go/No Go – Move On or Kill It
Stage Gate Vs. Discovery Driven
Key decisions based on:
•  What we know – prior results
•  What we’re guessing – WAG
•  Current risks – Can we deliver?
What does that do?
•  Risky, innovative – potentially
meaningful - things always die
•  Incremental “safe” things go
forward
•  We Koboyashi Maru the results
Perpetuates “analytics” as WMD
Start with success. What does it look like.
What needs to be true?
List/Prioritize in rank order. Showstoppers,
and Easily tested
Now – ideas/projects to make these true.
Map them into your phases.
If a critical assumption isn’t true – then
revise, learn and iterate. Lots of small steps.
Discovery Driven Planning
The goal remains the same – but assumptions to
reach the goal are what must be changed.
Leaders in the business can help clear the way for
the assumptions rather than view practitioners as
trying to move the goalpost.
Most failure in marketing comes from failing to
ask the right question, not because of the
accuracy, detail or our ability to get an answer.
Shine the light on meaning, not numbers
287%	
  

Evolving Beyond Analytics - Getting To Meaningful Measurement

  • 3.
    We can skipthis, yes? 18%   200%   400%   100 Hrs. / Min.   1000%  
  • 4.
    Ratio of CMO’sthat use data solely to facilitate transactions, not deepen the relationship with consumers. Stretched to Strengthened: IBM Study of CMO’s Still Use Analytics To Prove Not Improve
  • 5.
    Outperforming companies vs. underperforming companiesthat use data to bond and deepen relationships with consumers. While Deeper Relationships Elude Most Stretched to Strengthened: IBM Study of CMO’s
  • 6.
    an a lytics / anl’itiks / noun plural noun: analytics 1.  The systematic computational analysis of data or statistics. Information resulting from the systematic analysis of data or statistics . . . Analytics Defined:
  • 7.
    an a lytics / anl’itiks / WMD Weapon Of Mass Delusion 1.  A systematic way to make any effort look like a massive success or failure depending on your agenda . . . Analytics Re-Defined:
  • 8.
    Goals: Indicate progress toachievement Key KPI’s Secondary goals and indicators Indicators Data that improve process The Measurement Pyramid
  • 9.
    Goal: Increase leads by10% w/ no extra cost in 6 months Reporting: •  # of Leads / % of Increase •  Cost Increase or Decrease •  Subscribers •  Conversion rates •  Email response rates •  Cost per lead by channel KEY KPI’s •  Likes / Followers •  Page views •  Social metrics •  Keyword reports INDICATORS The Measurement Pyramid
  • 10.
    Measure what’s importantand, more importantly, meaningful. Frees the team from “always up and to the right” mentality Prevents departmental competition The Pyramid Benefits
  • 11.
    But We Haven’t…… 18%   200%   400%   100 Hrs. / Min.   1000%  
  • 12.
    1.  Still operatethat content is separate from “real marketing” 2.  Still think measurement is a way to prove worth, rather than improve a process 3.  We still think that “content” is an attribute of marketing instead of value in and of itself We Haven’t Changed…
  • 13.
    1.  Can weinfuse the content marketing approach into existing strategy 2.  Can we stop measuring in silos? And all the way down? 3.  Can we stop “acting” like a media company and actually BE a media company? But can we make it better?
  • 14.
    WEB  BANNER   SEARCH  ADS  PRINT   SEARCH   Let’s look at an example… Advertising
  • 15.
    1  Customer  -­‐  $3,000  Cost   Per  Customer   50,000  Impressions   1%  CTR  -­‐  (500  Visitors)   $6.00  CPC   30  Demo  Requests  -­‐  6%   Conversion  Rate   10  DemonstraEons  -­‐   $300  /  Demo   Let’s look at an example… Advertising
  • 16.
    75  Downloads  -­‐  30%   Conversion  Rate   ($20  ea)   9  DemonstraEons    ($166)   3  Customers  -­‐  $500  Cost   Per  Customer   Let’s look at an example… Advertising 50,000  Impressions   .5%  CTR  -­‐  (250  Visitors)   $6.00  CPC  
  • 17.
    Sometimes Content MarketingIS more expensive but can it create a better customer? “The Switching Economy” $5.9 Trillion up for grabs… Engaging experiences are not “nice to have’s” any longer. Measuring the whole journey 670  Miles   $100  Dollar  Bills  
  • 18.
    B2B Training Company Methodologyto measure all the way through – from first awareness to customer service. 8 Months later… •  1.2x the cost •  1.5x the time Loyalty. Upsell. Evangelism
  • 19.
    Customers closed throughcontent marketing infusion Spent 2X as much Stayed 5X as long 2X more likely to share… It’s not just more likes, leads or customers. It’s also: Better likes, leads, customers – relationships. Loyalty. Upsell. Evangelism.
  • 20.
    A"en%on  Metrics   (Audience  Development)   Measuring    consumpEon   &  brand  awareness  as  a   means  of  widening  the   funnel     Social  Metrics   (Conversa%on  Influence)   Measuring  the  creaEon  of   influence,  the  power  of   sharing,  and  the  larger   discussion  about  our   approach       Effec%veness  Metrics   (Content  Purpose)   Measuring  intended   purpose  at  influencing   behavior  at  various   parts  of  the  funnel       3 Types of CM Measurement
  • 21.
    Visitors/Customers   Awareness  recall   Visitor  loyalty     Share  of  voice     Brand  Awareness  %   Earned  Media     Impressions   Page  views   Downloads   Earned  Media  $$   Visitors/Leads   Discussion  LiZ   Total  CPL   Customer  Cost  RaEo   NPS  -­‐  Loyalty     Social  Shares   SenEment  Analysis   Influencer  MenEons     Tweets,  Likes  +1’s   Forwards   Inbound  Links     Cost  Per  Visitor   Lead  (by  channel)   Total  Value  by  lead       Blog  subscripEons   Time  on  site   Referral  Traffic     Some examples for ya…
  • 23.
    Broad range ofcampaigns Winnow and place our bets on campaigns/projects Map into phrases: Plan, Development, Launch, Manage Separate these phases by stage gates. Go/No Go – Move On or Kill It Stage Gate Vs. Discovery Driven
  • 24.
    Key decisions basedon: •  What we know – prior results •  What we’re guessing – WAG •  Current risks – Can we deliver? What does that do? •  Risky, innovative – potentially meaningful - things always die •  Incremental “safe” things go forward •  We Koboyashi Maru the results Perpetuates “analytics” as WMD
  • 25.
    Start with success.What does it look like. What needs to be true? List/Prioritize in rank order. Showstoppers, and Easily tested Now – ideas/projects to make these true. Map them into your phases. If a critical assumption isn’t true – then revise, learn and iterate. Lots of small steps. Discovery Driven Planning
  • 26.
    The goal remainsthe same – but assumptions to reach the goal are what must be changed. Leaders in the business can help clear the way for the assumptions rather than view practitioners as trying to move the goalpost. Most failure in marketing comes from failing to ask the right question, not because of the accuracy, detail or our ability to get an answer. Shine the light on meaning, not numbers
  • 27.