Download as PDF, PPTX


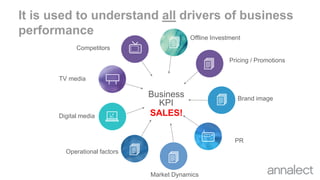
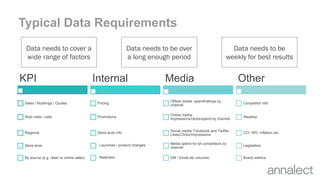
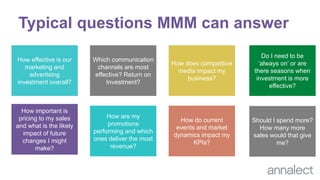
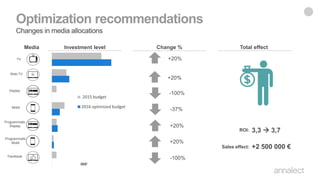
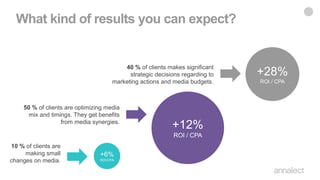
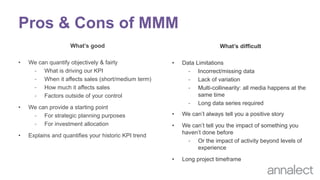


The document discusses the transition from traditional web analytics to Marketing Mix Modelling (MMM) for understanding user behavior and the effectiveness of marketing efforts. It outlines data requirements, typical questions MMM can answer, and highlights the importance of insights gained regarding overall advertising investment, pricing impacts, and competitive factors. Additionally, it addresses the pros and cons of MMM while providing optimization recommendations and expected outcomes from varied marketing strategies.


![[Notes] Customer 360 Analytics with LEO CDP](https://cdn.slidesharecdn.com/ss_thumbnails/notescustomer360analyticswithleocdp-220126053232-thumbnail.jpg?width=640&height=640&fit=bounds)