Download to read offline


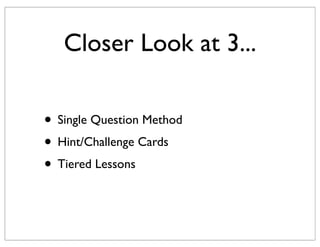


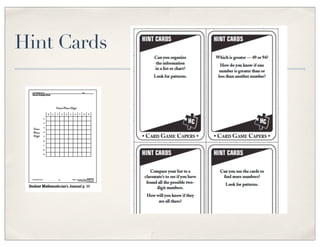


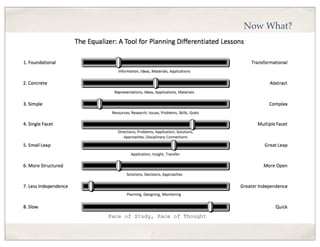
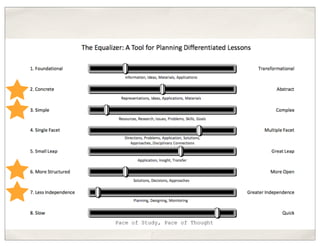
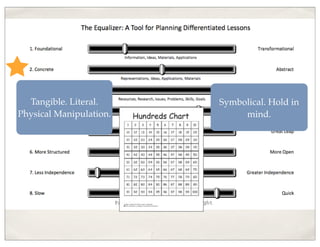


This document discusses principles of differentiation and ways to implement it in the classroom. It describes three specific differentiation strategies: the single question method, hint/challenge cards, and tiered lessons. The single question method involves posing an open-ended question for students to answer at their own level. Hint/challenge cards provide varying levels of support or extension for problems. Tiered lessons allow students to engage with content at different levels of complexity. The document provides examples for applying each of these differentiation strategies in the classroom.


