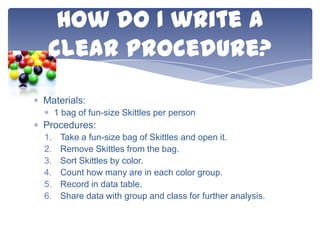
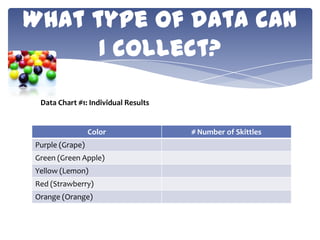
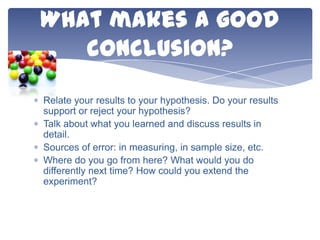
understanding
experimental
design help me
with my science
fair project?
Important Reminders:
Due Date: Friday, November 22nd
Grace turn in day without penalty: Monday,
December 2nd
Final project: Display board, log book and a report
– NOT YOUR EXPERIMENT
Pictures: Take a lot including of you doing your
experiment but no faces
Where do we start?
Question!
How many Skittles of each color are there in a fun
size packet?
What could we
research?
Topic: Manufacturing of Candy
What does a good
hypothesis look like?
(Summary) If we count how many of each color
Skittles there are in a fun-size bag,
(Expected Result) Then there will be more yellow
ones
(Research) Because in the past it seemed like
yellow was the most common color.
What are my
variables?
Manipulated/Independent Variable:
The thing you (experimenter) is changing
The packet of Skittles

Responding/Dependent Variable:
The thing you are measuring
The number of each color of Skittles

Controls
Things that stay the same for all experiment groups or
trials
Size the of the packet (fun-size)
Type of candy
How do I write a
clear procedure?
Materials:
1 bag of fun-size Skittles per person

Procedures:
1.
2.
3.
4.
5.
6.

Take a fun-size bag of Skittles and open it.
Remove Skittles from the bag.
Sort Skittles by color.
Count how many are in each color group.
Record in data table.
Share data with group and class for further analysis.
What type of data can
I collect?
Data Chart #1: Individual Results

Color
Purple (Grape)
Green (Green Apple)
Yellow (Lemon)
Red (Strawberry)
Orange (Orange)

# Number of Skittles
What should I do with
my data?
Measures of central tendency
Mean, Median, Mode, Range, Standard Deviation

Graph our data
Triple bar graph comparing individual, group and
class
Pie chart
What makes a good
conclusion?
Relate your results to your hypothesis. Do your results
support or reject your hypothesis?
Talk about what you learned and discuss results in
detail.
Sources of error: in measuring, in sample size, etc.
Where do you go from here? What would you do
differently next time? How could you extend the
experiment?

How can understanding science experimental design

  • 1.
  • 2.
    Important Reminders: Due Date:Friday, November 22nd Grace turn in day without penalty: Monday, December 2nd Final project: Display board, log book and a report – NOT YOUR EXPERIMENT Pictures: Take a lot including of you doing your experiment but no faces
  • 3.
    Where do westart? Question! How many Skittles of each color are there in a fun size packet?
  • 4.
    What could we research? Topic:Manufacturing of Candy
  • 5.
    What does agood hypothesis look like? (Summary) If we count how many of each color Skittles there are in a fun-size bag, (Expected Result) Then there will be more yellow ones (Research) Because in the past it seemed like yellow was the most common color.
  • 6.
    What are my variables? Manipulated/IndependentVariable: The thing you (experimenter) is changing The packet of Skittles Responding/Dependent Variable: The thing you are measuring The number of each color of Skittles Controls Things that stay the same for all experiment groups or trials Size the of the packet (fun-size) Type of candy
  • 7.
    How do Iwrite a clear procedure? Materials: 1 bag of fun-size Skittles per person Procedures: 1. 2. 3. 4. 5. 6. Take a fun-size bag of Skittles and open it. Remove Skittles from the bag. Sort Skittles by color. Count how many are in each color group. Record in data table. Share data with group and class for further analysis.
  • 8.
    What type ofdata can I collect? Data Chart #1: Individual Results Color Purple (Grape) Green (Green Apple) Yellow (Lemon) Red (Strawberry) Orange (Orange) # Number of Skittles
  • 9.
    What should Ido with my data? Measures of central tendency Mean, Median, Mode, Range, Standard Deviation Graph our data Triple bar graph comparing individual, group and class Pie chart
  • 10.
    What makes agood conclusion? Relate your results to your hypothesis. Do your results support or reject your hypothesis? Talk about what you learned and discuss results in detail. Sources of error: in measuring, in sample size, etc. Where do you go from here? What would you do differently next time? How could you extend the experiment?