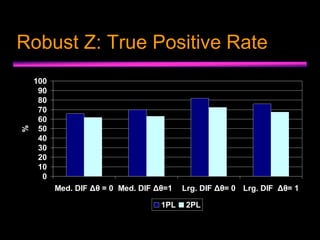
Detecting DIF between Conventional and Computerized Adaptive Testing: A Monte Carlo StudyBarth B. RileyAdam C. Carle
IntroductionInstruments are being transitioned from paper-and-pencil (P&P) to computerized adaptive modes of administration.Problems arise when item parameters used by CAT are estimated from P&P. Mode effects can diminish measurement reliability and validity and increase error in trait estimates (Pommerich, 2007).
ProblemDifferential item functioning (DIF) refers to differences in level of item endorsement between two or more groups after controlling for differences in ability.Most DIF methods are designed for use within mode but not between mode of administration.Differences in level of missing item responses between modes.
Purpose and RationaleDevelop and evaluate approaches to assessing item-level mode effects.Bayesian methods can provide more accurate results compared to conventional approaches.Take into account uncertainty in trait and item parameter estimates.
DIF ProcedureEstimate θ using item response data pooled across administration modes (CAT and P&P).Using θi obtained in Step 1, estimate the posterior distributions of mode-specific item parameters.For each item common across modes, assess the difference in the posterior distributions of the item parameters (i.e., between βjCAT and βjP&P).
Comparing Posterior DistributionsTwo approaches.Modified robust Z statistic (Huynh & Meyer, 2010).95% Credible Interval for mean difference between βjCAT and βjP&P.
Modified Robust ZMed = median of the differences in the CAT and P&P item parameters based on their posterior distributions.IQR = interquartile range of the difference.
Priors and Generated Parameters
Monte Carlo StudyTwo sets of P&P item parameters generated using previous criteria fitting one- (1PLM) and two-parameter (2PLM) IRT models.Item response data generated using each set of parameters.Parameters then estimated using maximum likelihood (Mplus).
Monte Carlo Study cont.CAT item response data were generated using the following variables:% of DIF items (10% vs. 30%).Magnitude of DIF |βjCAT - βjP&P| = 0.42 vs. 0.63.Mean difference in θ between CAT and P&P samples (0 vs. 1 logit).Direction of DIF was randomized.10 datasets generated per condition.CAT simulations: Firestar 1.33 (Choi, 2009).Bayesian Analysis: WinBUGS 1.43 (Spiegelhalter et al., 2007).Sample Size:P&P Data: N = 1,000.CAT Data: N = 3,000.
Robust Z: False Positive Rate
Robust Z: True Positive Rate
CrI: False Positive Rate
CrI: True Positive Rate
Performance by Item Difficulty
True & False Positive Rates by CAT Item Usage
ConclusionsBoth procedures evidenced adequate control of false positive DIF results.Exception: low difficulty items (< -2.5 logits).Not significantly affected by % of DIF items.Was affected by mean trait level difference.CrI evidenced slightly higher power to detect DIF, but also higher false positive rate.
Conclusions cont.Power to detect DIF varied considerably, and was affected by several factors, including:Item usage.DIF size.IRT model.Mean difference in trait estimates.Item difficulty.
Future ResearchTest robustness of procedures to data that do not conform to prior assumptions.Skewed ability and item parameter distributions.Detecting non-uniform DIF.
ReferencesChoi SW: Firestar: Computerized adaptive testing simulation program for polytomous IRT models. Applied Psychological Measurement 2009, 33(8):644-645.Huynh H, Meyer P: Use of robust z in detecting unstable items in item response theory models. In Practical Assessment Research & Evaluation. Volume 15. 2010.Pommerich M: The effect of using item parameters calibrated from paper administrations in computer adaptive test administrations. Journal of Technology, Learning, and Assessment 2007, 5(7):1-29.Spiegelhalter D, Thomas A, Best N, Lunn D: WinBUGS version 1.4. 3 user manual. Cambridge, United Kingdom: MRC Biostatistics Unit; 2007.
Thank YouFor more information, please contact:Barth Rileybbriley@chestnut.org

Detecting Dif Between Conventional And Computerized Adaptive Testing.Ppt

  • 1.
    Detecting DIF betweenConventional and Computerized Adaptive Testing: A Monte Carlo StudyBarth B. RileyAdam C. Carle
  • 2.
    IntroductionInstruments are beingtransitioned from paper-and-pencil (P&P) to computerized adaptive modes of administration.Problems arise when item parameters used by CAT are estimated from P&P. Mode effects can diminish measurement reliability and validity and increase error in trait estimates (Pommerich, 2007).
  • 3.
    ProblemDifferential item functioning(DIF) refers to differences in level of item endorsement between two or more groups after controlling for differences in ability.Most DIF methods are designed for use within mode but not between mode of administration.Differences in level of missing item responses between modes.
  • 4.
    Purpose and RationaleDevelopand evaluate approaches to assessing item-level mode effects.Bayesian methods can provide more accurate results compared to conventional approaches.Take into account uncertainty in trait and item parameter estimates.
  • 5.
    DIF ProcedureEstimate θusing item response data pooled across administration modes (CAT and P&P).Using θi obtained in Step 1, estimate the posterior distributions of mode-specific item parameters.For each item common across modes, assess the difference in the posterior distributions of the item parameters (i.e., between βjCAT and βjP&P).
  • 6.
    Comparing Posterior DistributionsTwoapproaches.Modified robust Z statistic (Huynh & Meyer, 2010).95% Credible Interval for mean difference between βjCAT and βjP&P.
  • 7.
    Modified Robust ZMed= median of the differences in the CAT and P&P item parameters based on their posterior distributions.IQR = interquartile range of the difference.
  • 8.
  • 9.
    Monte Carlo StudyTwosets of P&P item parameters generated using previous criteria fitting one- (1PLM) and two-parameter (2PLM) IRT models.Item response data generated using each set of parameters.Parameters then estimated using maximum likelihood (Mplus).
  • 10.
    Monte Carlo Studycont.CAT item response data were generated using the following variables:% of DIF items (10% vs. 30%).Magnitude of DIF |βjCAT - βjP&P| = 0.42 vs. 0.63.Mean difference in θ between CAT and P&P samples (0 vs. 1 logit).Direction of DIF was randomized.10 datasets generated per condition.CAT simulations: Firestar 1.33 (Choi, 2009).Bayesian Analysis: WinBUGS 1.43 (Spiegelhalter et al., 2007).Sample Size:P&P Data: N = 1,000.CAT Data: N = 3,000.
  • 11.
    Robust Z: FalsePositive Rate
  • 12.
    Robust Z: TruePositive Rate
  • 13.
  • 14.
  • 15.
  • 16.
    True & FalsePositive Rates by CAT Item Usage
  • 17.
    ConclusionsBoth procedures evidencedadequate control of false positive DIF results.Exception: low difficulty items (< -2.5 logits).Not significantly affected by % of DIF items.Was affected by mean trait level difference.CrI evidenced slightly higher power to detect DIF, but also higher false positive rate.
  • 18.
    Conclusions cont.Power todetect DIF varied considerably, and was affected by several factors, including:Item usage.DIF size.IRT model.Mean difference in trait estimates.Item difficulty.
  • 19.
    Future ResearchTest robustnessof procedures to data that do not conform to prior assumptions.Skewed ability and item parameter distributions.Detecting non-uniform DIF.
  • 20.
    ReferencesChoi SW: Firestar:Computerized adaptive testing simulation program for polytomous IRT models. Applied Psychological Measurement 2009, 33(8):644-645.Huynh H, Meyer P: Use of robust z in detecting unstable items in item response theory models. In Practical Assessment Research & Evaluation. Volume 15. 2010.Pommerich M: The effect of using item parameters calibrated from paper administrations in computer adaptive test administrations. Journal of Technology, Learning, and Assessment 2007, 5(7):1-29.Spiegelhalter D, Thomas A, Best N, Lunn D: WinBUGS version 1.4. 3 user manual. Cambridge, United Kingdom: MRC Biostatistics Unit; 2007.
  • 21.
    Thank YouFor moreinformation, please contact:Barth Rileybbriley@chestnut.org