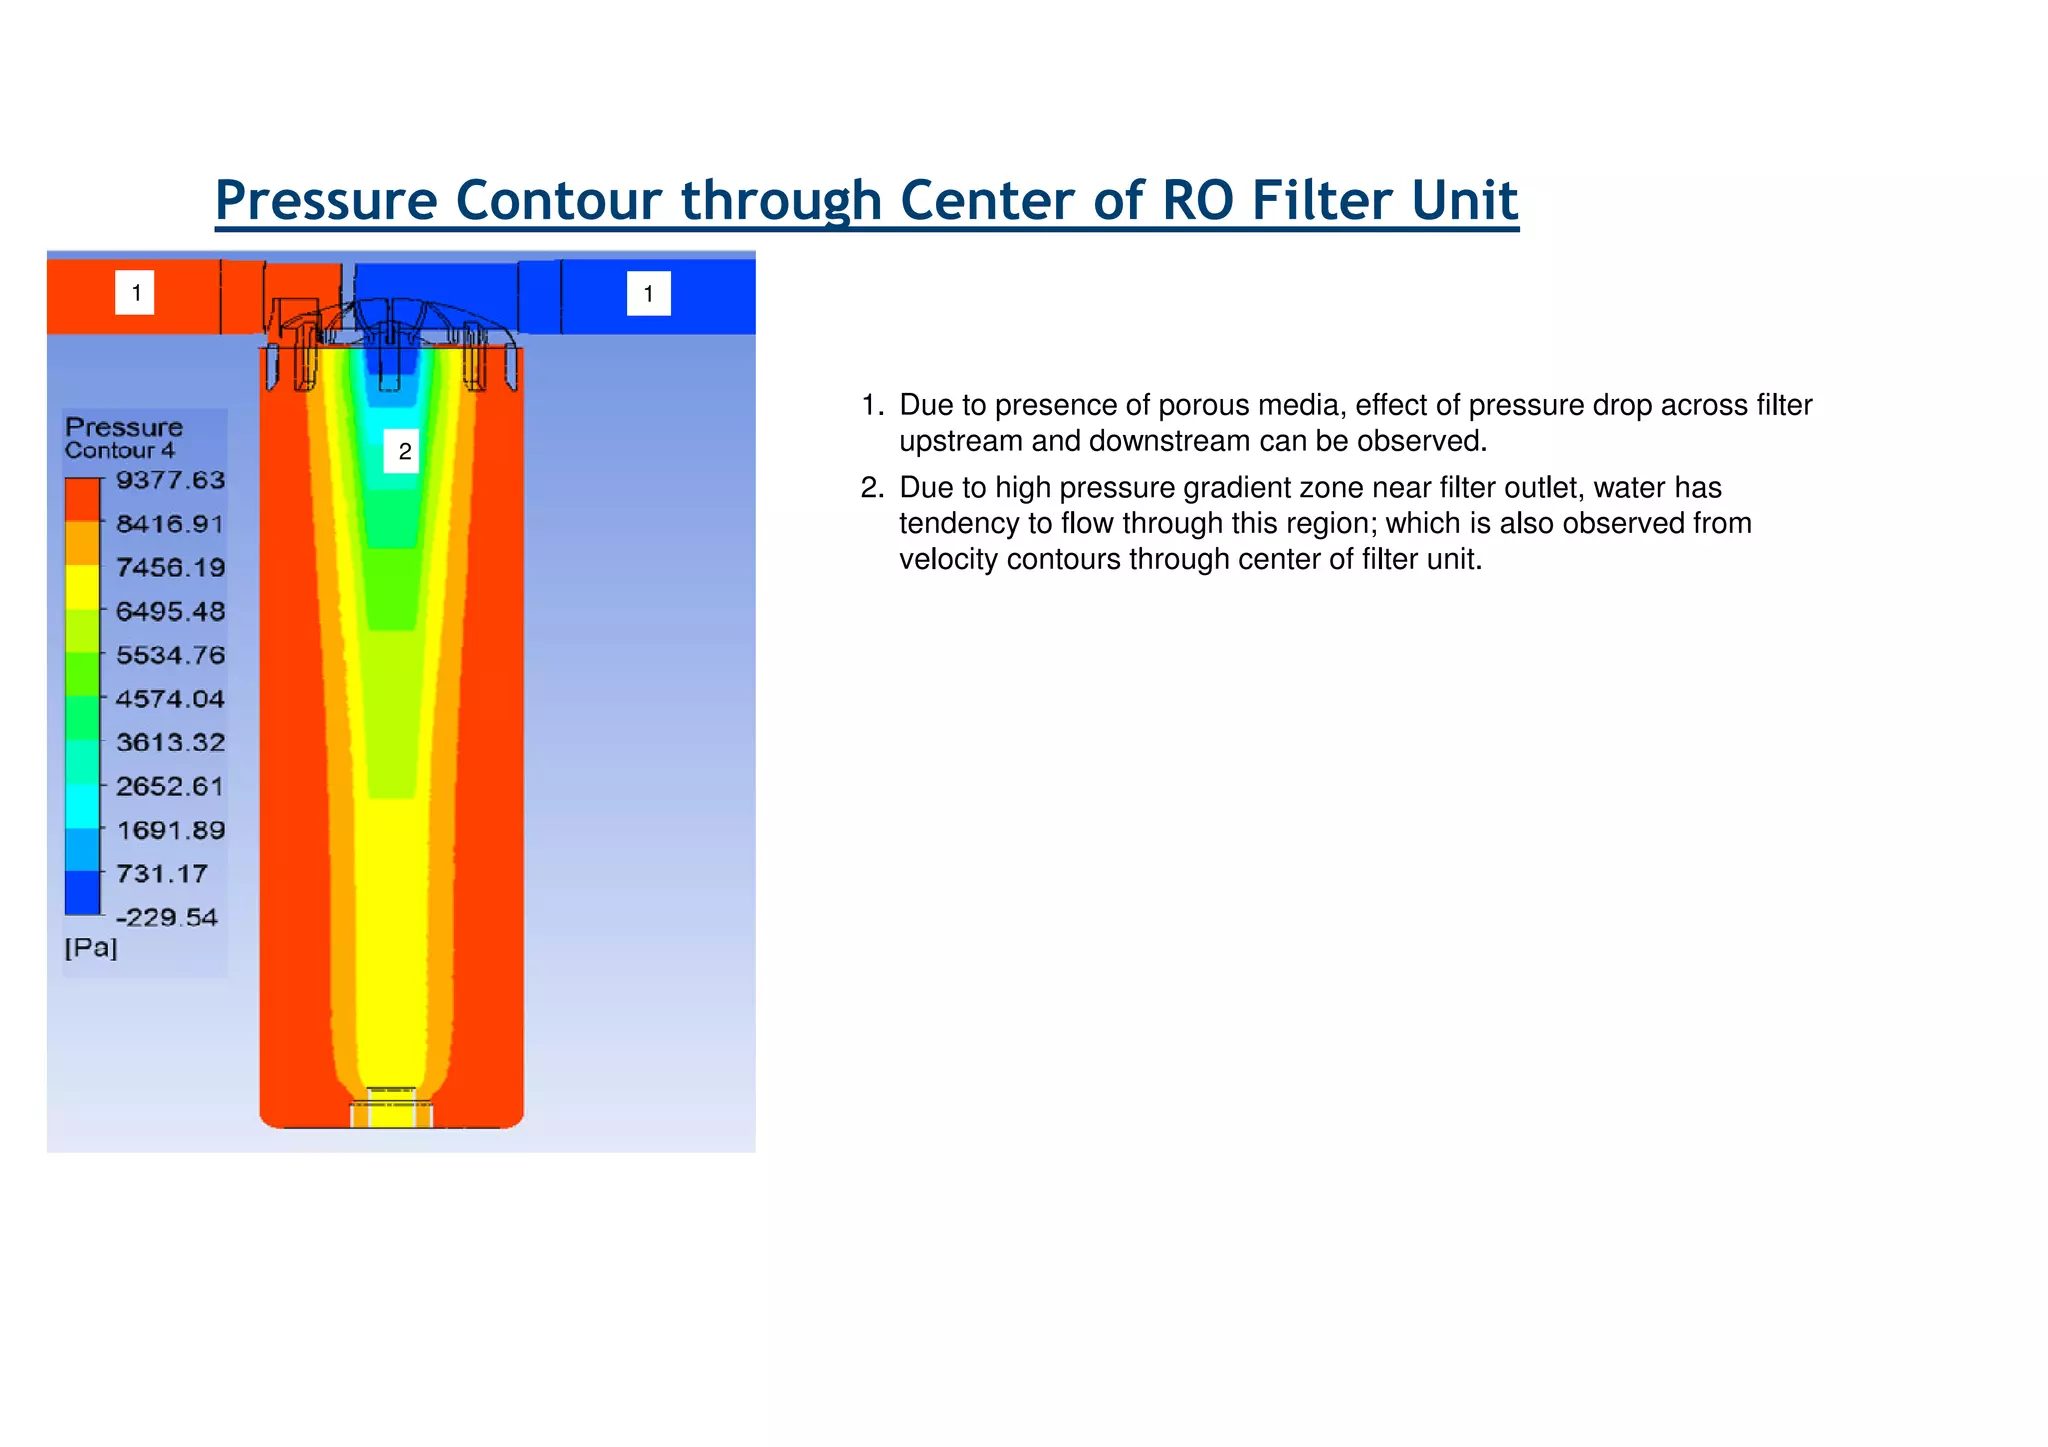
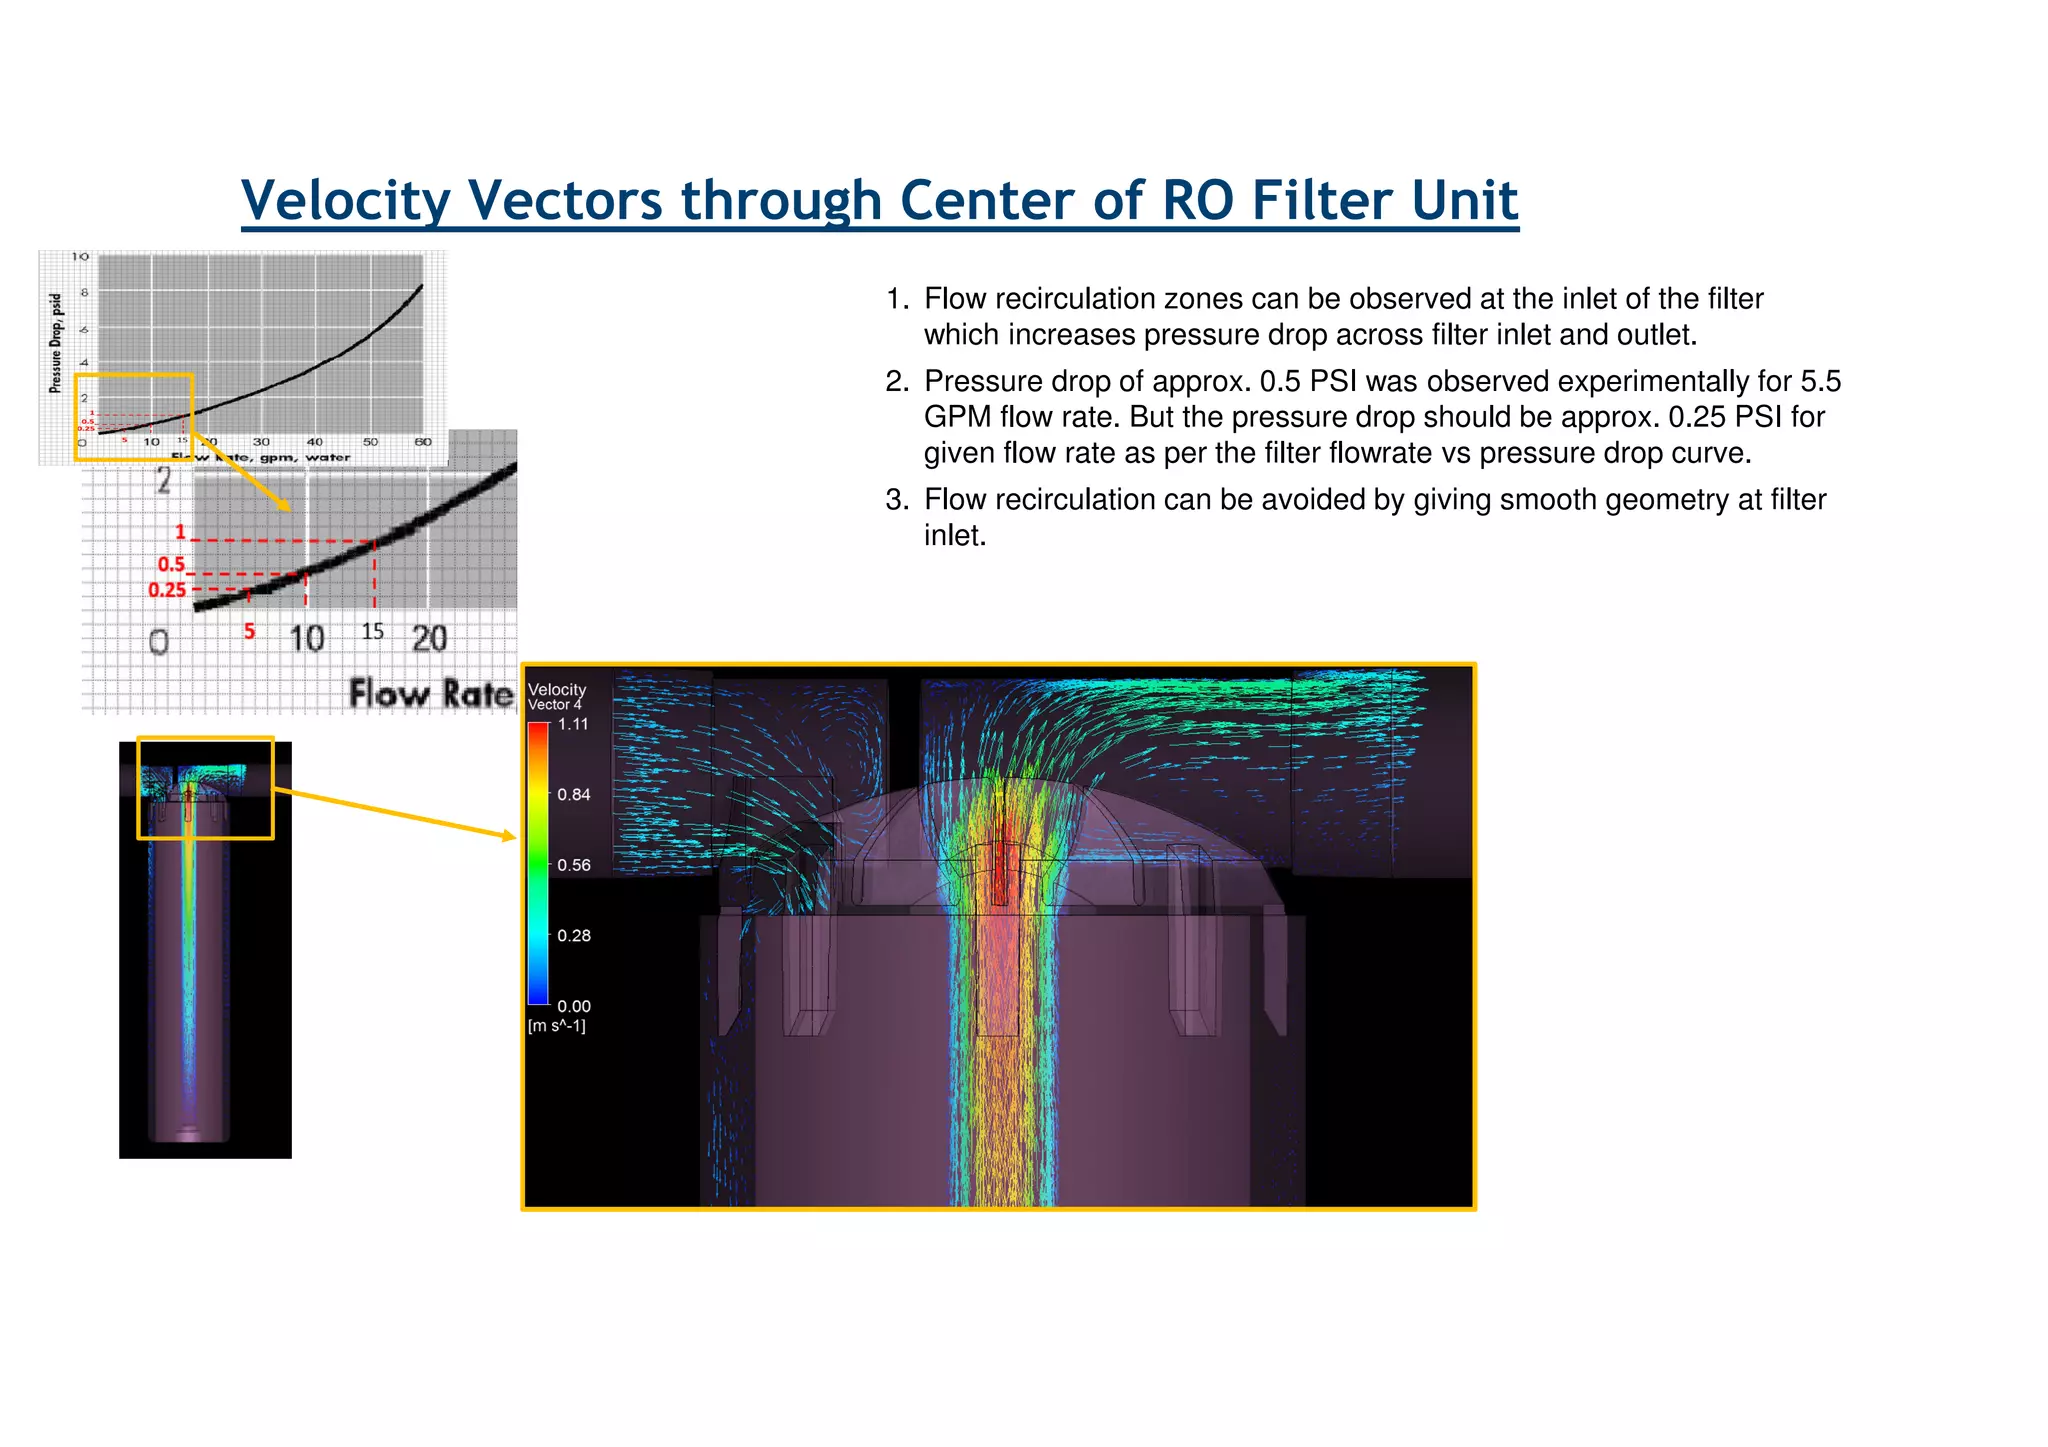
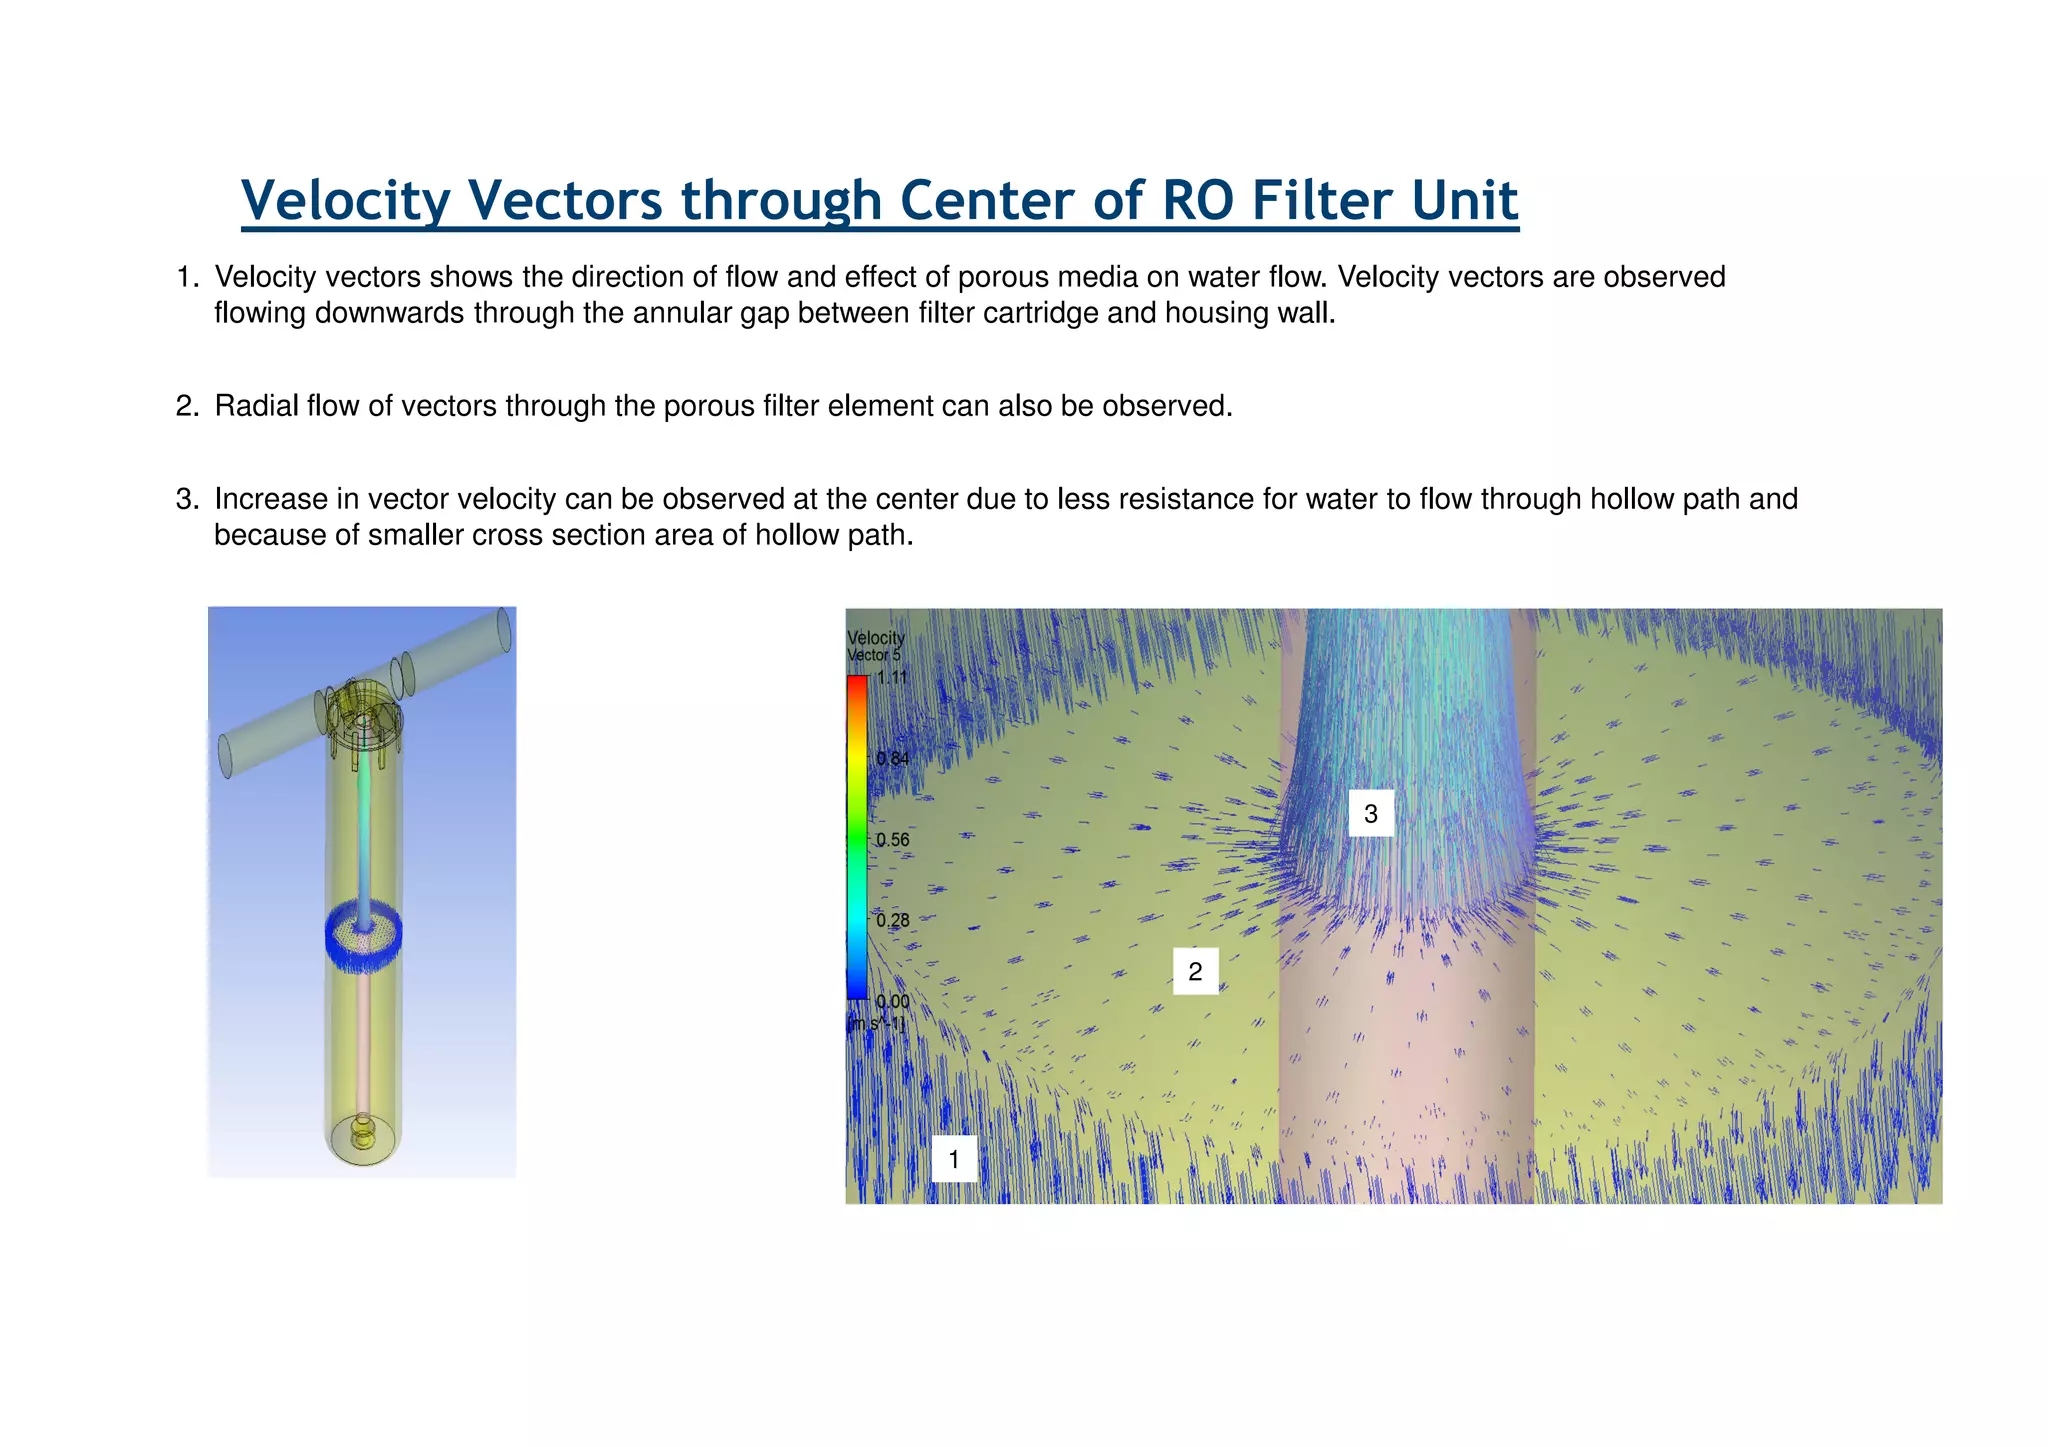
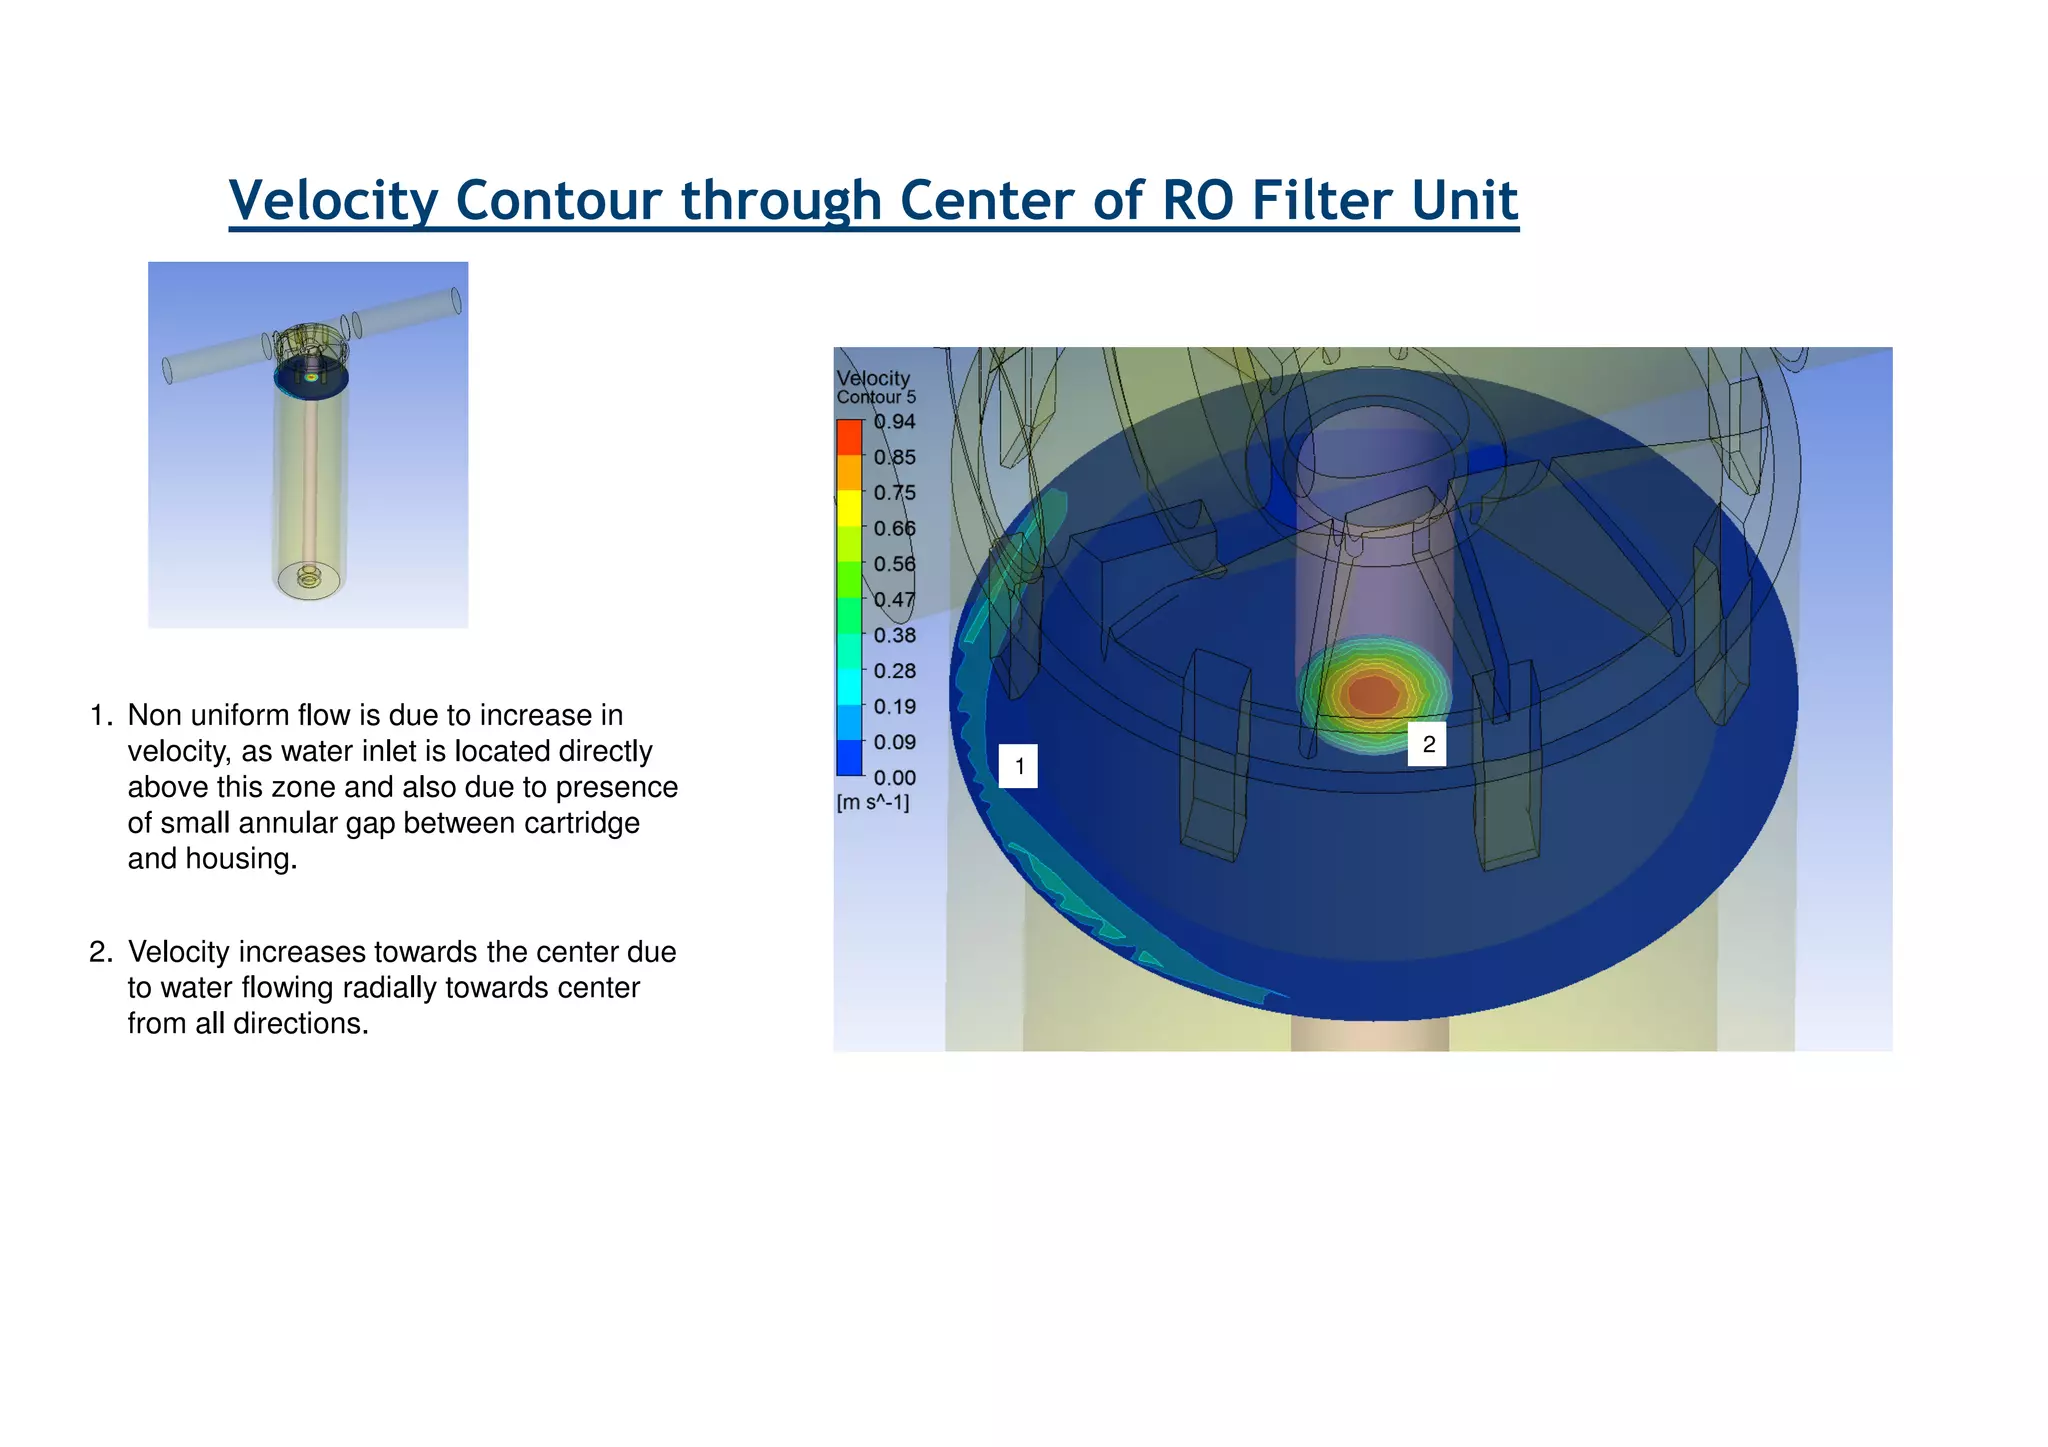
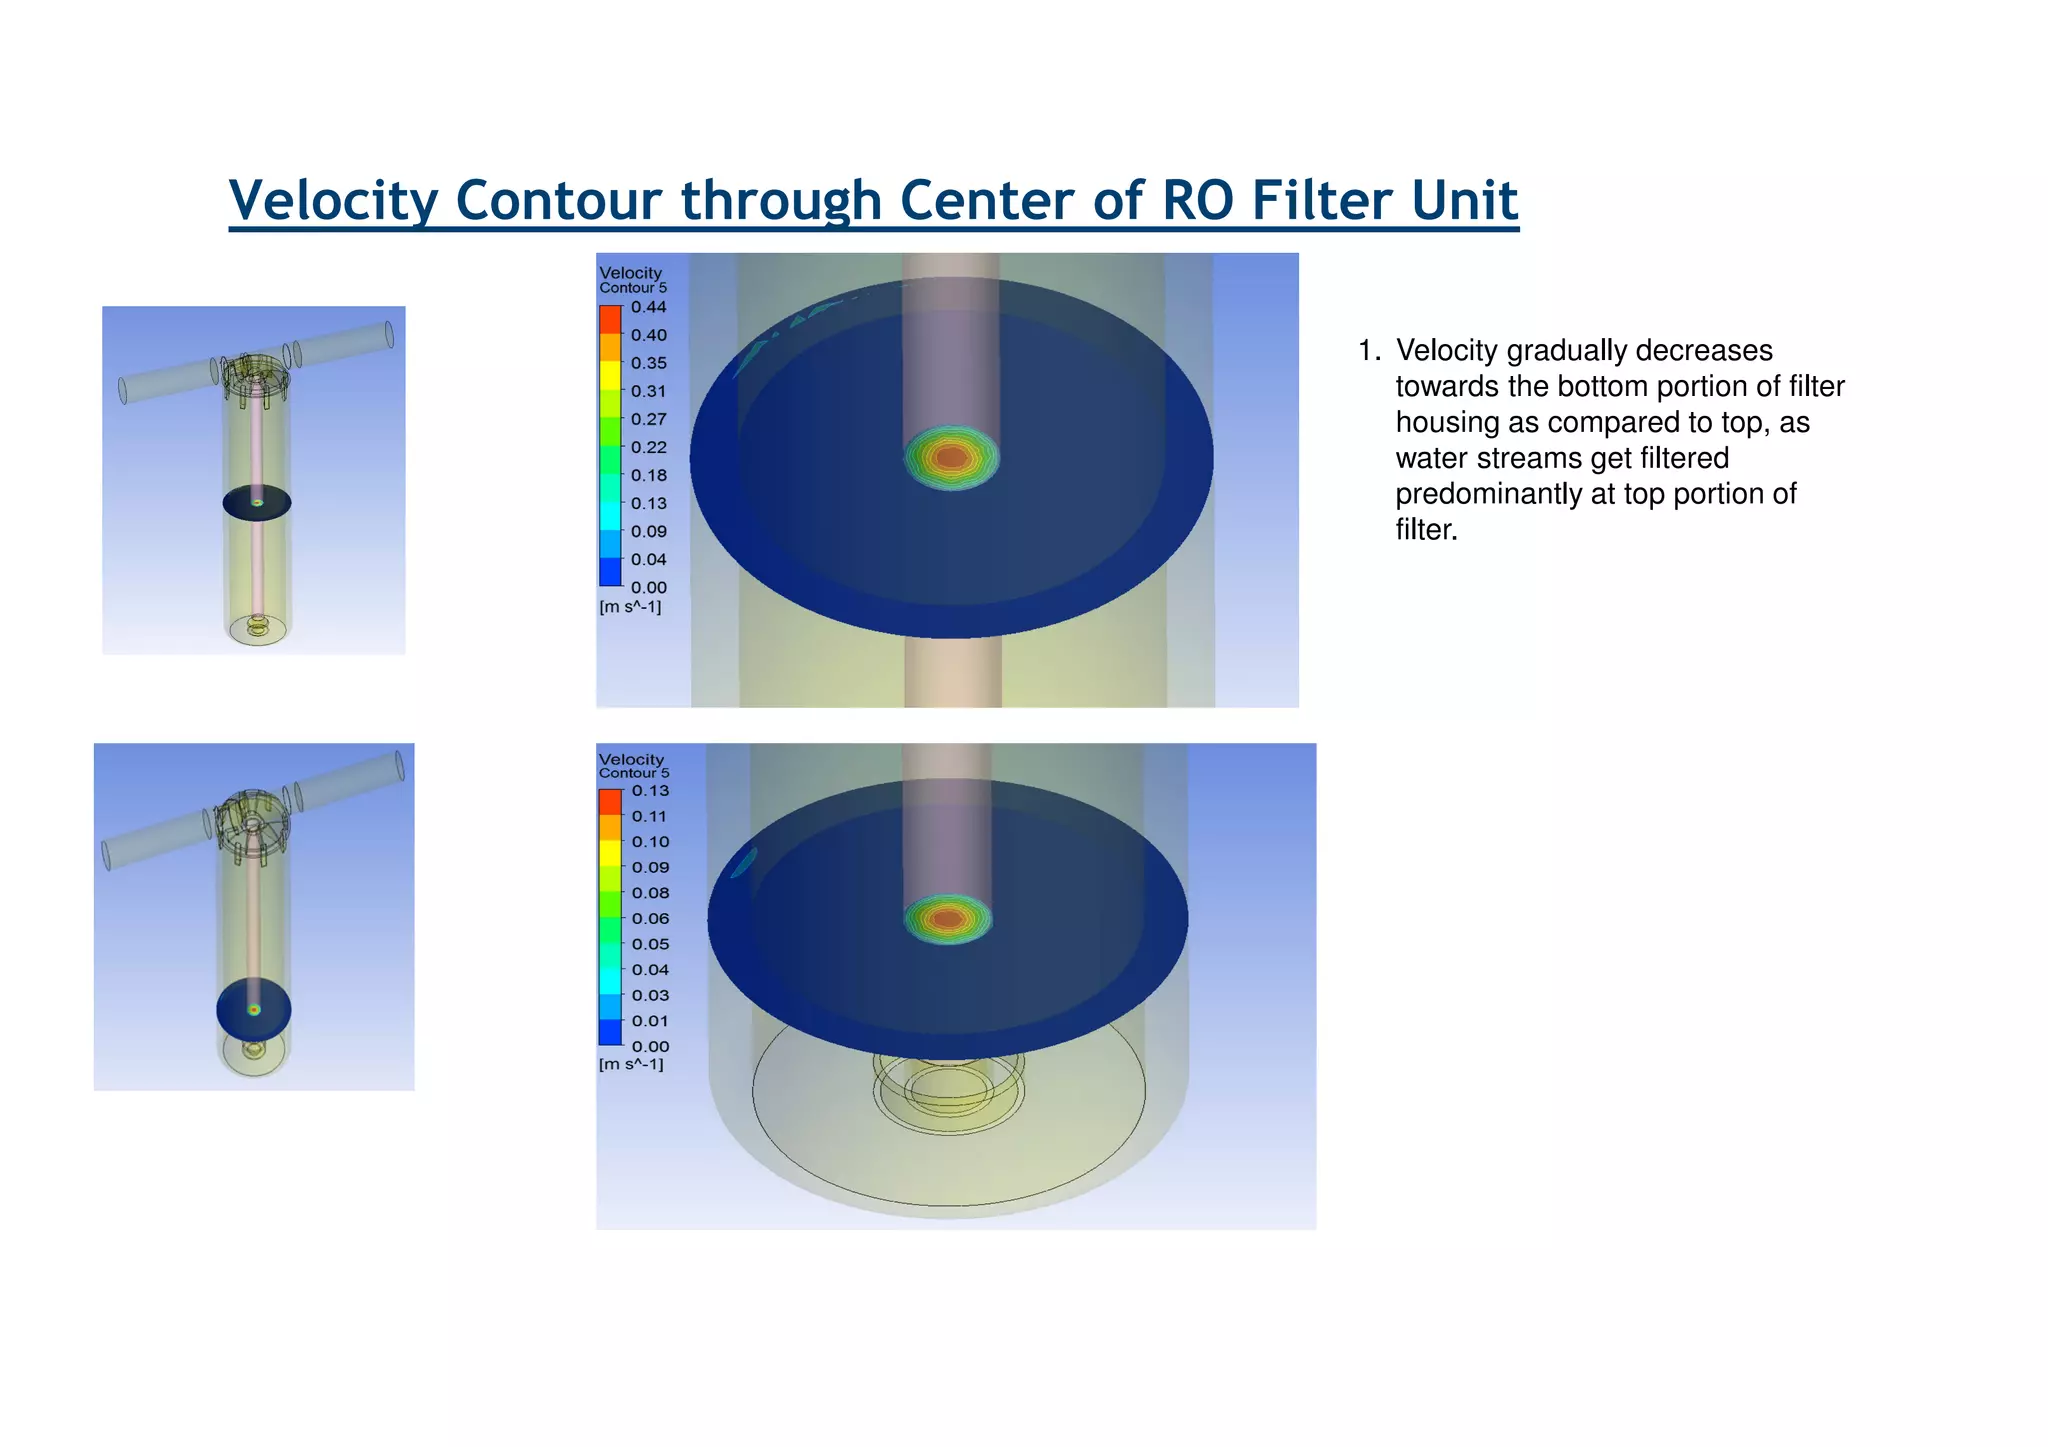
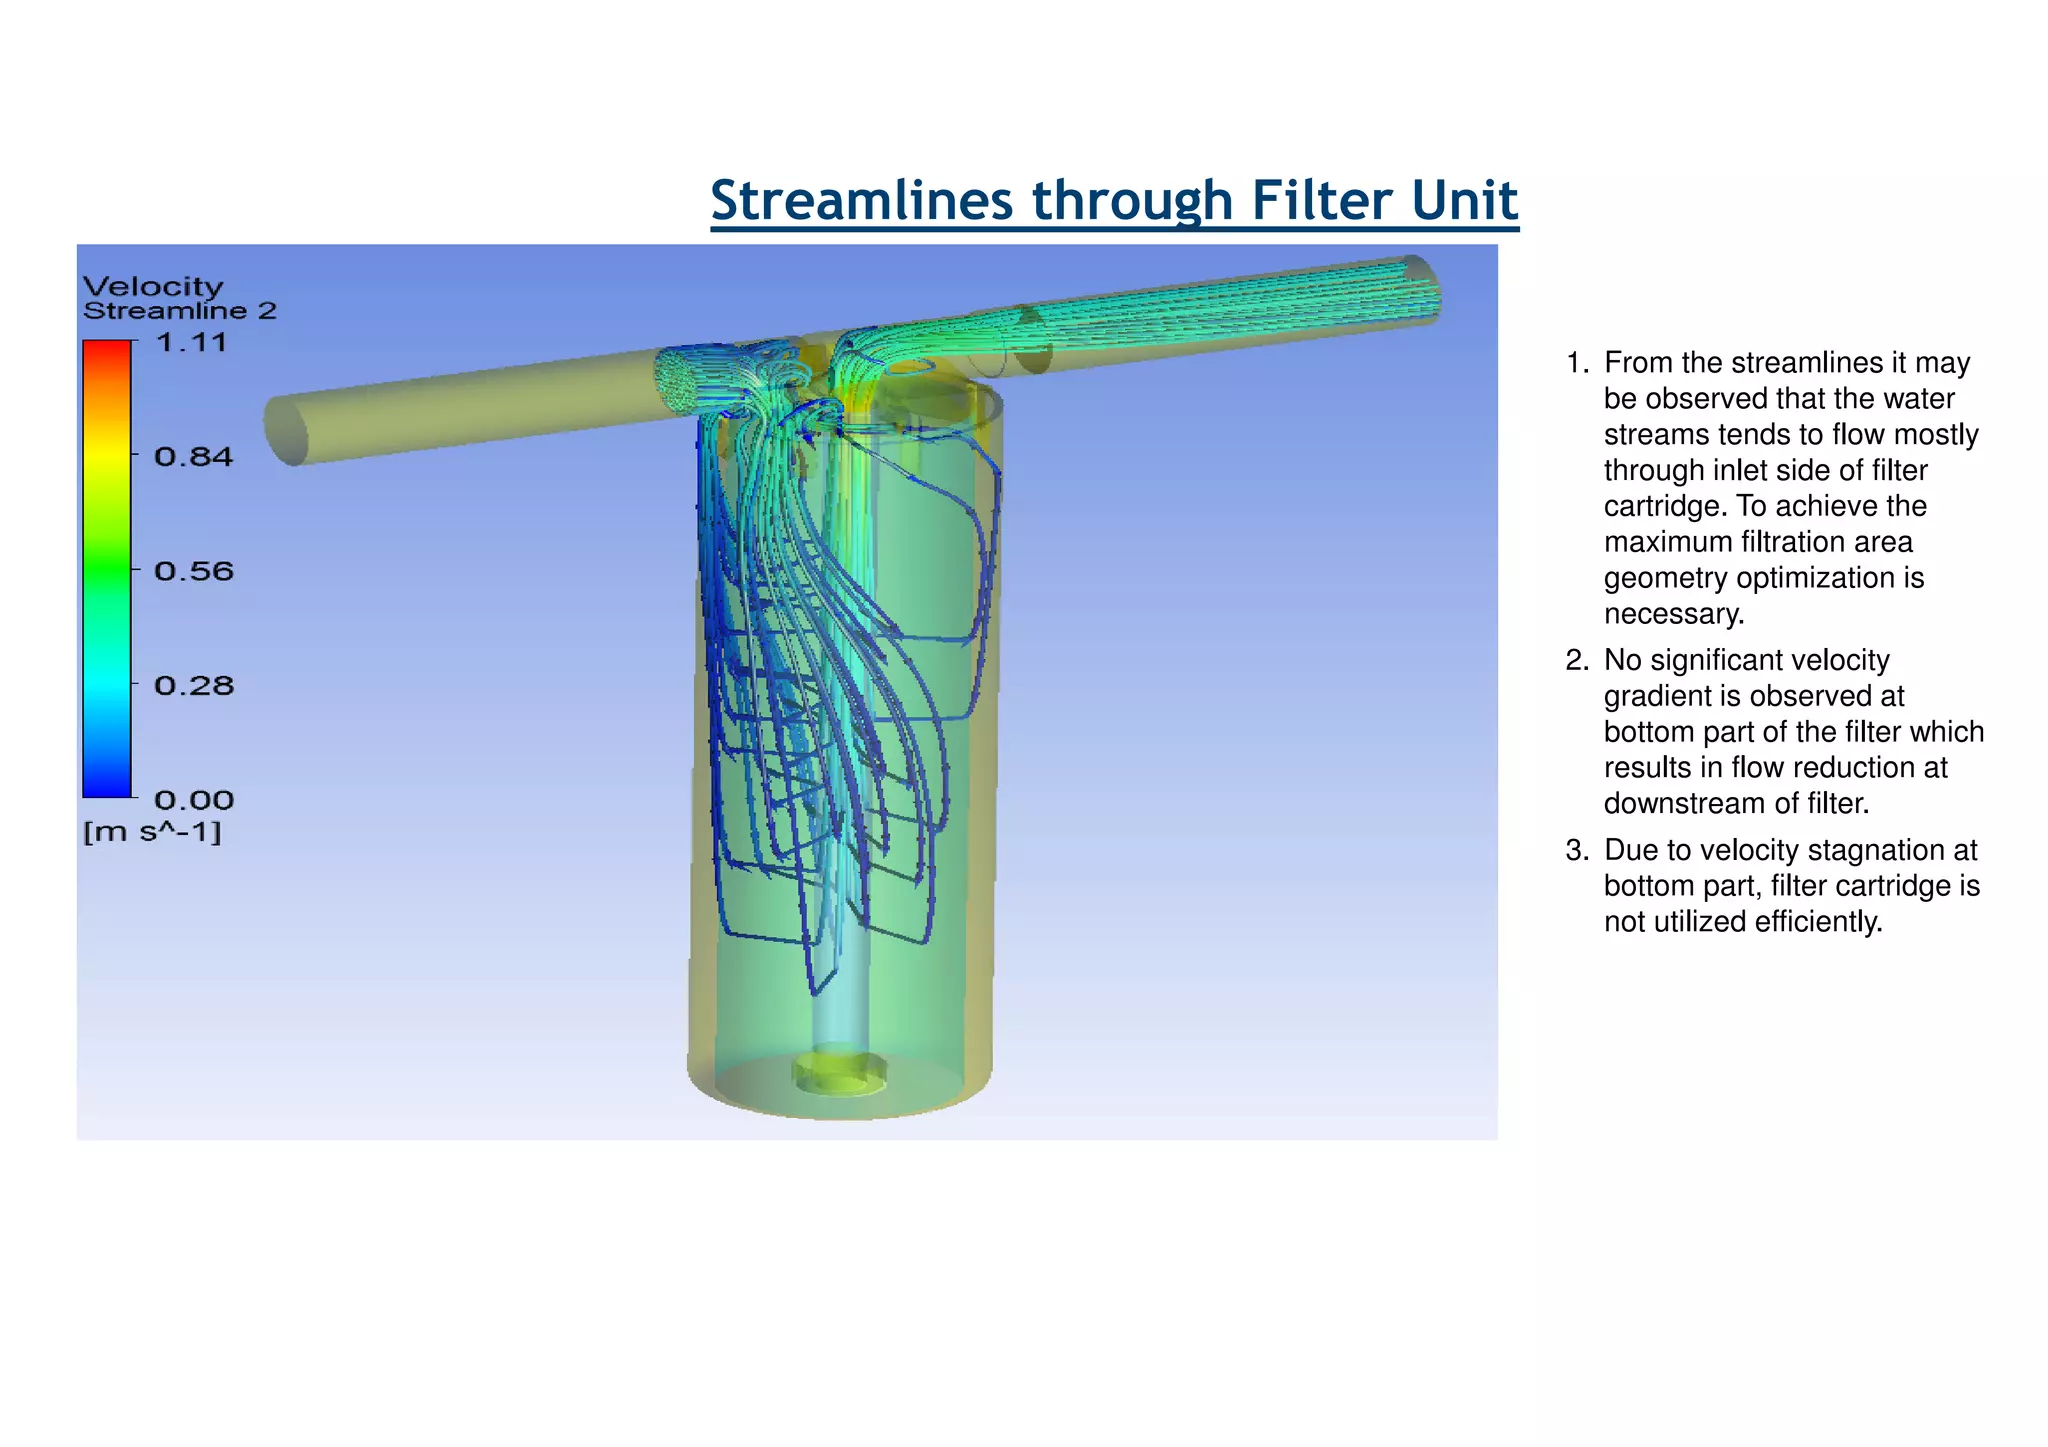
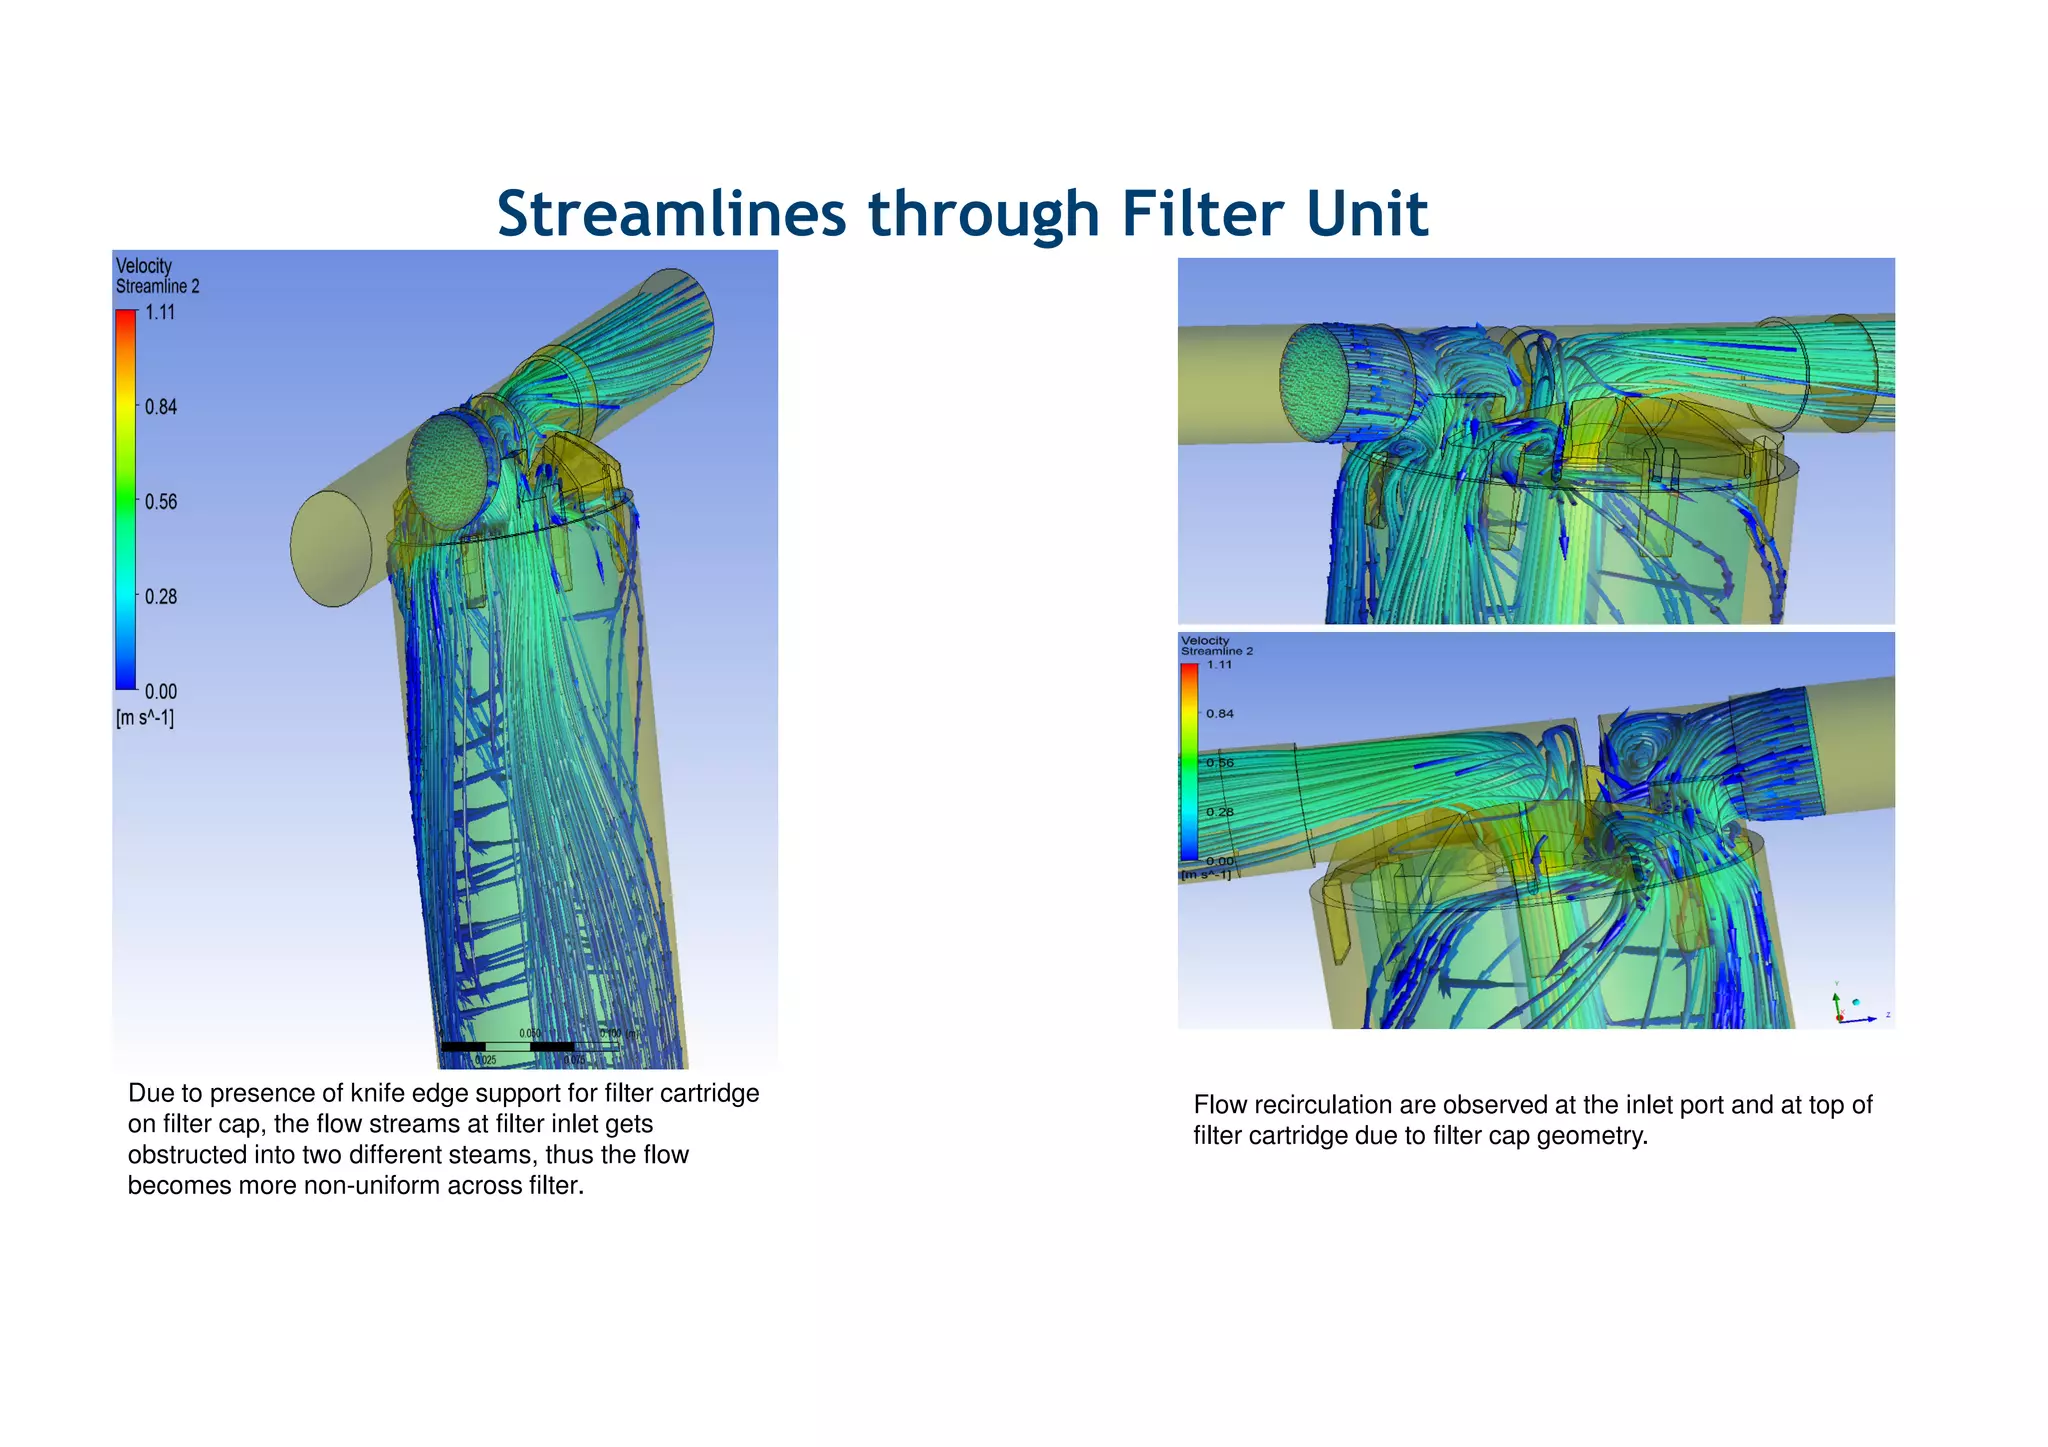
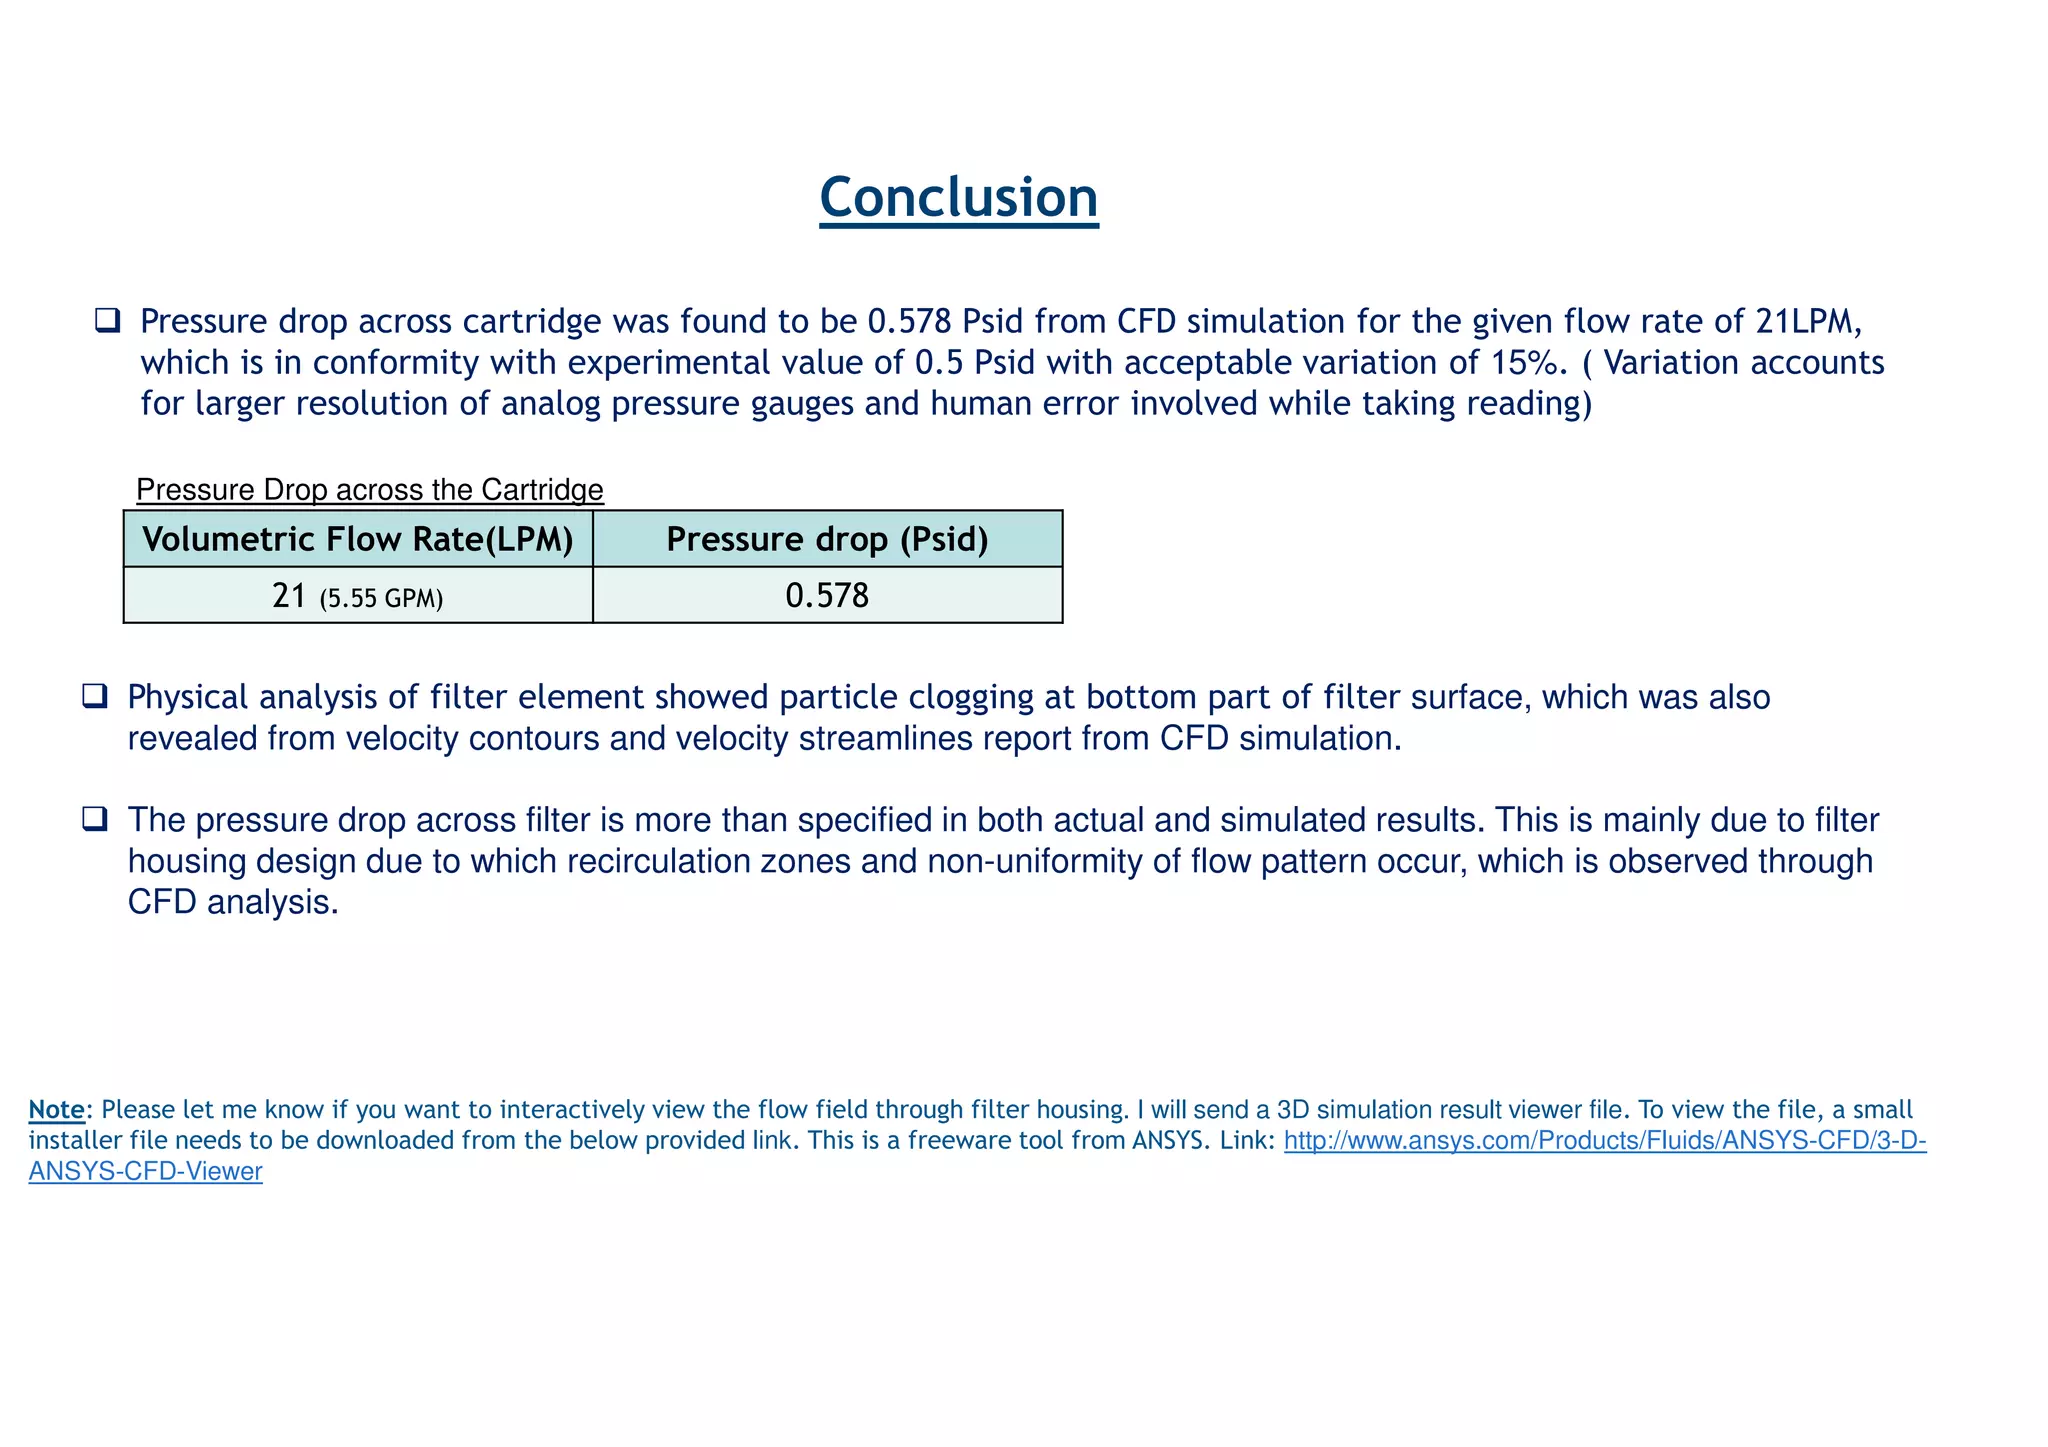
DESIGN OPTIMIZATION OF SEDIMENT WATER FILTER
USING REVERSE ENGINEERING AND CFD SIMULATION
Shreyansh
Shreyansh
Shreyansh
Shreyansh
CAD Design Engineer
L&T Technology Services
Objective of Project
• To develop the domain understanding in the area of filters and filtration system.
• This POC is to validate the Flow of water through polypropylene cartridge filter in a 250 LPH capacity RO filter plant with actual
results.
• To make 3D CAD model of existing Polypropylene sediment water filter by taking dimension using Vernier calliper.
• The scope of this project is to compare experimental results on flow regime and pressure drop of cartridge filter with that of
CFD simulation results.
• It is generally desirable to determine the pressure drop across the porous medium and to predict the flow field in order to
optimize a given design. Use of CFD also revels the flow pattern of water through filter housing and reveal the areas which have
scope of improvement in terms of filter Design.
250 LPH RO water filter plant
Sediment Filter Specifications
Type : Single Cartridge
Length : 20” (nom.)
Outer Dia. : 4.5” (nom.) diameter
Flow rate : 40 GPM/Cartridge
Rating : 5 micron (nominal)
Material of Construction
Cartridge : Polypropylene foam
Housing : Polypropylene
Water Filter Solidworks CAD model
Filter housing – CAD model
Filter Cap 20 inch polypropylene
cartridge filter
Water Filter system
Dynamic pressure readings are obtained by taking the readings from the pressure gauges in a system with the water
flowing. Dynamic pressure readings are the only way to determine cartridge filter condition.
The theoretical pressure drop per unit length presented in Table 5.1 was predicted using the following
relation:
Viscous and Inertial Resistance
Flow Rate
(GPM)
Pressure Drop
(psid)
Velocity (m/s) Pressure (Pa)
0.00 0.00 0 0
3.34 0.19 0.001155 1300.655
10.21 0.57 0.003531 3902.772
17.07 1.17 0.005904 8048.46
22.64 1.58 0.00783 10902.27
29.13 2.33 0.010074 16075.41
34.88 3.04 0.012062 20988.13
43.03 4.17 0.014883 28741.08
48.03 5.10 0.016613 35194.23
52.85 6.23 0.018277 42932.84
56.17 7.16 0.019429 49378.82
58.21 7.87 0.020131 54275.55
Flow Velocity = Flow rate / Flow area
Flow Area=0.18241 m2
y = 1.032E+08x2 + 5.110E+05x
R² = 9.962E-01
0
10000
20000
30000
40000
50000
60000
0 0.005 0.01 0.015 0.02 0.025
Velocity vs Pressure
  1.03208
5.11005

Viscous Resistance Co-efficient= 1.1507E+10
Inertial Resistance Co-efficient= 4.675E+06
Note: The CFD simulation results are based on assuming the above pressure drop vs flow rate curve true for 5 micron polypropylene filter. Any deviation of filter performance from
the given curve the CFD results will vary.
Pressure drop Vs Flow rate curve for 5micron PP filter • To define filter porous media in CFD software, values of
viscous and inertial resistance coefficients are required.
• These values are calculated from polynomial function of
velocity vs pressure curve of filter element. This curve is
plotted from pressure drop vs Flow rate curve for filter
element from filter specification sheet.
SIMULATION RESULTS
Volumetric Flow Rate: 21 LPM (5.55 GPM)
Velocity Contour through Center of RO Filter Unit
1
2
3 1. Velocity gradient is negligible at bottom part of filter due to
reduction in flow velocity of water at this zone and also because of
vertical orientation of filter. This results in inefficient filtration and
particle deposition at the bottom part of filter element which was
also observed in our experimental filter cartridge.
2. At outlet, velocity is high due to decrease in cross- section area for
outlet path.
3. Due to the nature of bend near filter outlet, non-uniform velocity
zone is observed.
Pressure Contour through Center of RO Filter Unit
1. Due to presence of porous media, effect of pressure drop across filter
upstream and downstream can be observed.
2. Due to high pressure gradient zone near filter outlet, water has
tendency to flow through this region; which is also observed from
velocity contours through center of filter unit.
1 1
2
Velocity Vectors through Center of RO Filter Unit
1. Flow recirculation zones can be observed at the inlet of the filter
which increases pressure drop across filter inlet and outlet.
2. Pressure drop of approx. 0.5 PSI was observed experimentally for 5.5
GPM flow rate. But the pressure drop should be approx. 0.25 PSI for
given flow rate as per the filter flowrate vs pressure drop curve.
3. Flow recirculation can be avoided by giving smooth geometry at filter
inlet.
Velocity Vectors through Center of RO Filter Unit
1. Velocity vectors shows the direction of flow and effect of porous media on water flow. Velocity vectors are observed
flowing downwards through the annular gap between filter cartridge and housing wall.
2. Radial flow of vectors through the porous filter element can also be observed.
3. Increase in vector velocity can be observed at the center due to less resistance for water to flow through hollow path and
because of smaller cross section area of hollow path.
1
2
3
Velocity Contour through Center of RO Filter Unit
1. Non uniform flow is due to increase in
velocity, as water inlet is located directly
above this zone and also due to presence
of small annular gap between cartridge
and housing.
2. Velocity increases towards the center due
to water flowing radially towards center
from all directions.
1
2
Velocity Contour through Center of RO Filter Unit
1. Velocity gradually decreases
towards the bottom portion of filter
housing as compared to top, as
water streams get filtered
predominantly at top portion of
filter.
Streamlines through Filter Unit
1. From the streamlines it may
be observed that the water
streams tends to flow mostly
through inlet side of filter
cartridge. To achieve the
maximum filtration area
geometry optimization is
necessary.
2. No significant velocity
gradient is observed at
bottom part of the filter which
results in flow reduction at
downstream of filter.
3. Due to velocity stagnation at
bottom part, filter cartridge is
not utilized efficiently.
Streamlines through Filter Unit
Flow recirculation are observed at the inlet port and at top of
filter cartridge due to filter cap geometry.
Due to presence of knife edge support for filter cartridge
on filter cap, the flow streams at filter inlet gets
obstructed into two different steams, thus the flow
becomes more non-uniform across filter.
Volumetric Flow Rate(LPM) Pressure drop (Psid)
21 (5.55 GPM) 0.578
Conclusion
Note: Please let me know if you want to interactively view the flow field through filter housing. I will send a 3D simulation result viewer file. To view the file, a small
installer file needs to be downloaded from the below provided link. This is a freeware tool from ANSYS. Link: http://www.ansys.com/Products/Fluids/ANSYS-CFD/3-D-
ANSYS-CFD-Viewer
 Pressure drop across cartridge was found to be 0.578 Psid from CFD simulation for the given flow rate of 21LPM,
which is in conformity with experimental value of 0.5 Psid with acceptable variation of 15%. ( Variation accounts
for larger resolution of analog pressure gauges and human error involved while taking reading)
Pressure Drop across the Cartridge
 Physical analysis of filter element showed particle clogging at bottom part of filter surface, which was also
revealed from velocity contours and velocity streamlines report from CFD simulation.
 The pressure drop across filter is more than specified in both actual and simulated results. This is mainly due to filter
housing design due to which recirculation zones and non-uniformity of flow pattern occur, which is observed through
CFD analysis.

DESIGN OPTIMIZATION OF SEDIMENT WATER FILTER USING REVERSE ENGINEERING AND CFD SIMULATION

  • 1.
    DESIGN OPTIMIZATION OFSEDIMENT WATER FILTER USING REVERSE ENGINEERING AND CFD SIMULATION Shreyansh Shreyansh Shreyansh Shreyansh CAD Design Engineer L&T Technology Services
  • 2.
    Objective of Project •To develop the domain understanding in the area of filters and filtration system. • This POC is to validate the Flow of water through polypropylene cartridge filter in a 250 LPH capacity RO filter plant with actual results. • To make 3D CAD model of existing Polypropylene sediment water filter by taking dimension using Vernier calliper. • The scope of this project is to compare experimental results on flow regime and pressure drop of cartridge filter with that of CFD simulation results. • It is generally desirable to determine the pressure drop across the porous medium and to predict the flow field in order to optimize a given design. Use of CFD also revels the flow pattern of water through filter housing and reveal the areas which have scope of improvement in terms of filter Design.
  • 3.
    250 LPH ROwater filter plant Sediment Filter Specifications Type : Single Cartridge Length : 20” (nom.) Outer Dia. : 4.5” (nom.) diameter Flow rate : 40 GPM/Cartridge Rating : 5 micron (nominal) Material of Construction Cartridge : Polypropylene foam Housing : Polypropylene
  • 4.
    Water Filter SolidworksCAD model Filter housing – CAD model Filter Cap 20 inch polypropylene cartridge filter
  • 5.
    Water Filter system Dynamicpressure readings are obtained by taking the readings from the pressure gauges in a system with the water flowing. Dynamic pressure readings are the only way to determine cartridge filter condition. The theoretical pressure drop per unit length presented in Table 5.1 was predicted using the following relation:
  • 6.
    Viscous and InertialResistance Flow Rate (GPM) Pressure Drop (psid) Velocity (m/s) Pressure (Pa) 0.00 0.00 0 0 3.34 0.19 0.001155 1300.655 10.21 0.57 0.003531 3902.772 17.07 1.17 0.005904 8048.46 22.64 1.58 0.00783 10902.27 29.13 2.33 0.010074 16075.41 34.88 3.04 0.012062 20988.13 43.03 4.17 0.014883 28741.08 48.03 5.10 0.016613 35194.23 52.85 6.23 0.018277 42932.84 56.17 7.16 0.019429 49378.82 58.21 7.87 0.020131 54275.55 Flow Velocity = Flow rate / Flow area Flow Area=0.18241 m2 y = 1.032E+08x2 + 5.110E+05x R² = 9.962E-01 0 10000 20000 30000 40000 50000 60000 0 0.005 0.01 0.015 0.02 0.025 Velocity vs Pressure 1.03208
  • 7.
    5.11005 Viscous Resistance Co-efficient=1.1507E+10 Inertial Resistance Co-efficient= 4.675E+06 Note: The CFD simulation results are based on assuming the above pressure drop vs flow rate curve true for 5 micron polypropylene filter. Any deviation of filter performance from the given curve the CFD results will vary. Pressure drop Vs Flow rate curve for 5micron PP filter • To define filter porous media in CFD software, values of viscous and inertial resistance coefficients are required. • These values are calculated from polynomial function of velocity vs pressure curve of filter element. This curve is plotted from pressure drop vs Flow rate curve for filter element from filter specification sheet.
  • 8.
    SIMULATION RESULTS Volumetric FlowRate: 21 LPM (5.55 GPM)
  • 9.
    Velocity Contour throughCenter of RO Filter Unit 1 2 3 1. Velocity gradient is negligible at bottom part of filter due to reduction in flow velocity of water at this zone and also because of vertical orientation of filter. This results in inefficient filtration and particle deposition at the bottom part of filter element which was also observed in our experimental filter cartridge. 2. At outlet, velocity is high due to decrease in cross- section area for outlet path. 3. Due to the nature of bend near filter outlet, non-uniform velocity zone is observed.
  • 10.
    Pressure Contour throughCenter of RO Filter Unit 1. Due to presence of porous media, effect of pressure drop across filter upstream and downstream can be observed. 2. Due to high pressure gradient zone near filter outlet, water has tendency to flow through this region; which is also observed from velocity contours through center of filter unit. 1 1 2
  • 11.
    Velocity Vectors throughCenter of RO Filter Unit 1. Flow recirculation zones can be observed at the inlet of the filter which increases pressure drop across filter inlet and outlet. 2. Pressure drop of approx. 0.5 PSI was observed experimentally for 5.5 GPM flow rate. But the pressure drop should be approx. 0.25 PSI for given flow rate as per the filter flowrate vs pressure drop curve. 3. Flow recirculation can be avoided by giving smooth geometry at filter inlet.
  • 12.
    Velocity Vectors throughCenter of RO Filter Unit 1. Velocity vectors shows the direction of flow and effect of porous media on water flow. Velocity vectors are observed flowing downwards through the annular gap between filter cartridge and housing wall. 2. Radial flow of vectors through the porous filter element can also be observed. 3. Increase in vector velocity can be observed at the center due to less resistance for water to flow through hollow path and because of smaller cross section area of hollow path. 1 2 3
  • 13.
    Velocity Contour throughCenter of RO Filter Unit 1. Non uniform flow is due to increase in velocity, as water inlet is located directly above this zone and also due to presence of small annular gap between cartridge and housing. 2. Velocity increases towards the center due to water flowing radially towards center from all directions. 1 2
  • 14.
    Velocity Contour throughCenter of RO Filter Unit 1. Velocity gradually decreases towards the bottom portion of filter housing as compared to top, as water streams get filtered predominantly at top portion of filter.
  • 15.
    Streamlines through FilterUnit 1. From the streamlines it may be observed that the water streams tends to flow mostly through inlet side of filter cartridge. To achieve the maximum filtration area geometry optimization is necessary. 2. No significant velocity gradient is observed at bottom part of the filter which results in flow reduction at downstream of filter. 3. Due to velocity stagnation at bottom part, filter cartridge is not utilized efficiently.
  • 16.
    Streamlines through FilterUnit Flow recirculation are observed at the inlet port and at top of filter cartridge due to filter cap geometry. Due to presence of knife edge support for filter cartridge on filter cap, the flow streams at filter inlet gets obstructed into two different steams, thus the flow becomes more non-uniform across filter.
  • 17.
    Volumetric Flow Rate(LPM)Pressure drop (Psid) 21 (5.55 GPM) 0.578 Conclusion Note: Please let me know if you want to interactively view the flow field through filter housing. I will send a 3D simulation result viewer file. To view the file, a small installer file needs to be downloaded from the below provided link. This is a freeware tool from ANSYS. Link: http://www.ansys.com/Products/Fluids/ANSYS-CFD/3-D- ANSYS-CFD-Viewer  Pressure drop across cartridge was found to be 0.578 Psid from CFD simulation for the given flow rate of 21LPM, which is in conformity with experimental value of 0.5 Psid with acceptable variation of 15%. ( Variation accounts for larger resolution of analog pressure gauges and human error involved while taking reading) Pressure Drop across the Cartridge  Physical analysis of filter element showed particle clogging at bottom part of filter surface, which was also revealed from velocity contours and velocity streamlines report from CFD simulation.  The pressure drop across filter is more than specified in both actual and simulated results. This is mainly due to filter housing design due to which recirculation zones and non-uniformity of flow pattern occur, which is observed through CFD analysis.
  • 18.