Download to read offline


![17
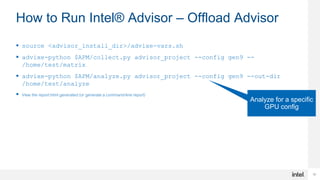
How to Run Intel® Advisor – GPU Roofline
Run 2 collections
advixe-cl –collect=survey --enable-gpu-profiling --project-
dir=<my_project_directory> --search-dir src:r=<my_source_directory> --
./myapp [app_parameters]
Run the Trip Counts and FLOP analysis with --enable-gpu-profiling option:
advixe-cl –collect=tripcounts --stacks --flop --enable-gpu-profiling --
project-dir=<my_project_directory> --search-dir
src:r=<my_source_directory> -- ./myapp [app_parameters]
Generate a GPU Roofline report:
advixe-cl --report=roofline --gpu --project-dir=<my_project_directory> --
report-output=roofline.html
Open the generated roofline.html in a web browser to visualize GPU performance.](https://image.slidesharecdn.com/vinuthamarch4thwebinar-210308064521/85/Design-and-Optimize-your-code-for-high-performance-with-Intel-Advisor-and-Intel-VTune-Profiler-17-320.jpg)

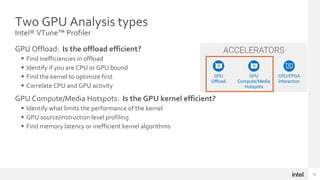
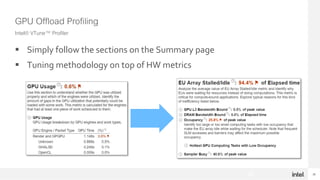
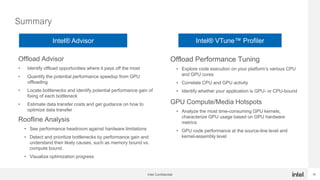

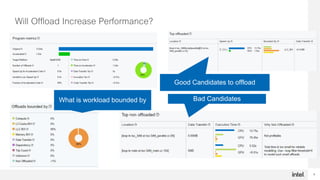
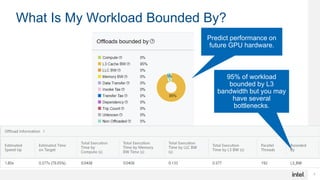
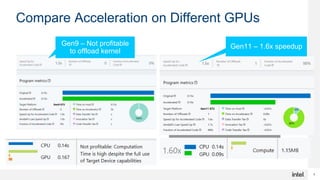
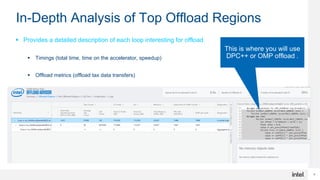
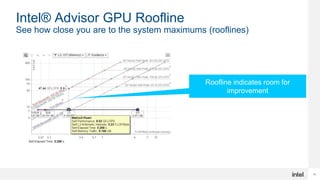
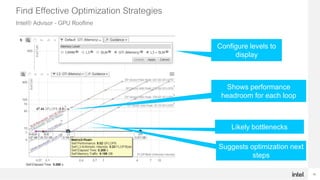
The document discusses using Intel Advisor and Intel VTune Profiler to optimize code for high performance. It provides an overview of the capabilities of Offload Advisor to identify offload opportunities and bottlenecks. It also discusses GPU Roofline analysis to find optimization strategies and identify memory-bound vs compute-bound issues. Finally, it covers profiling GPU offloads for efficiency and analyzing GPU kernels for performance issues using the two tools.


![Getting Started with Apache Spark: Big Data Made Simple [Free Meetup]](https://cdn.slidesharecdn.com/ss_thumbnails/apachesparkgettingstarted-260203175547-8361bcc3-thumbnail.jpg?width=640&height=640&fit=bounds)


