Downloaded 25 times
![Legal Disclaimer
© 2019 Intel Corporation. Intel, the Intel logo, Intel Inside, the Intel Inside logo, Intel Experience What’s Inside, The Intel Experience What’s Inside logo, and Xeon are trademarks of Intel Corporation in the U.S.
and/or other countries. *Other names and brands may be claimed as the property of others.
Intel technologies’ features and benefits depend on system configuration and may require enabled hardware, software or service activation. Learn more at intel.com, or from the OEM or retailer.
Intel processors of the same SKU may vary in frequency or power as a result of natural variability in the production process.
For more complete information about performance and benchmark results, visit www.intel.com/benchmarks.
The cost reduction scenarios described are intended to enable you to get a better understanding of how the purchase of a given Intel based product, combined with a number of situation-specific variables, might
affect future costs and savings. Circumstances will vary and there may be unaccounted-for costs related to the use and deployment of a given product. Nothing in this document should be interpreted as either a
promise of or contract for a given level of costs or cost reduction.
Intel does not control or audit third-party benchmark data or the web sites referenced in this document. You should visit the referenced web site and confirm whether referenced data are accurate.
Optimization Notice: Intel's compilers may or may not optimize to the same degree for non-Intel microprocessors for optimizations that are not unique to Intel microprocessors. These optimizations include SSE2,
SSE3, and SSSE3 instruction sets and other optimizations. Intel does not guarantee the availability, functionality, or effectiveness of any optimization on microprocessors not manufactured by Intel.
Microprocessor-dependent optimizations in this product are intended for use with Intel microprocessors. Certain optimizations not specific to Intel microarchitecture are reserved for Intel microprocessors. Please
refer to the applicable product User and Reference Guides for more information regarding the specific instruction sets covered by this notice. Notice Revision #20110804.
No computer system can be absolutely secure.
Intel® Advanced Vector Extensions (Intel® AVX)* provides higher throughput to certain processor operations. Due to varying processor power characteristics, utilizing AVX instructions may cause a) some parts to
operate at less than the rated frequency and b) some parts with Intel® Turbo Boost Technology 2.0 to not achieve any or maximum turbo frequencies. Performance varies depending on hardware, software, and
system configuration and you can learn more at http://www.intel.com/go/turbo.
Available on select Intel® processors. Requires an Intel® HT Technology-enabled system. Your performance varies depending on the specific hardware and software you use. Learn more by visiting
http://www.intel.com/info/hyperthreading.
Intel, the Intel logo, [List the Intel trademarks in your document] are trademarks of Intel Corporation or its subsidiaries in the U.S. and/or other countries.
*Other names and brands may be claimed as the property of others.
© Intel Corporation](https://image.slidesharecdn.com/platform-observability-and-infrastructure-closed-loops-190517210220/75/Platform-Observability-and-Infrastructure-Closed-Loops-2-2048.jpg)


![8
Platform Telemetry Exposure & Integration
Compute Network Storage
Hypervisor [RT/SA KVM4NFV extensions]
NFVI
IPFIX
Virtualised
Compute
Virtualised
Network
Virtualised
Storage
E.g.
Working/Protect
Failover
Local
Corrective
Action
Enterprise
MIB
SYSLOG
Collectd
PMU*
counters
NIC counters
vSwitch
counters
SNMP API
Perfmon
MIB
Common / Standard Open APIs
Fast Path
Triggers on events or
counters
VM Stall Detection/
RT Stall Detection
Monitoring/
Analytics
Systems
Slow Path
Periodic Pull 1/15mins
RAS Hypervisor/Container
Counters
Container
Monitoring
Solutions
(Prometheus
….)
Includes
NetFlow Collectors
Vendor SA
Middleware
Intel® Node
Manager
NFV Platform
MIB
Standard Open APIs
Intel Components
Open Platform
Collectors
Intel® Run Sure Technology
MCA* PCIe AER
Resilient System Technology
Resilient Memory Technology
SDDC DDDC+1 Mirroring
RAID/
NVMe
Intel® Rapid
Storage
Technology
sFlow
Intel®
Management
Engine
IPMI
Ceilometer
Aodh
Vitrage
Congress
In progress
Done/Integrated
Open Stack
Collectd PluginsIntel Infrastructure
Management Technologies
Gnocchi
VES Plugin
Redfish
C
M
T
Intel® RDT
C
A
T
M
B
M
C
D
P
PO
W
ER
Out Of
Band
Telemetry
Kafka Prometheus
OpenStack
VIM
PMU*: Performance Monitoring Unit](https://image.slidesharecdn.com/platform-observability-and-infrastructure-closed-loops-190517210220/75/Platform-Observability-and-Infrastructure-Closed-Loops-8-2048.jpg)


![Analytics
12
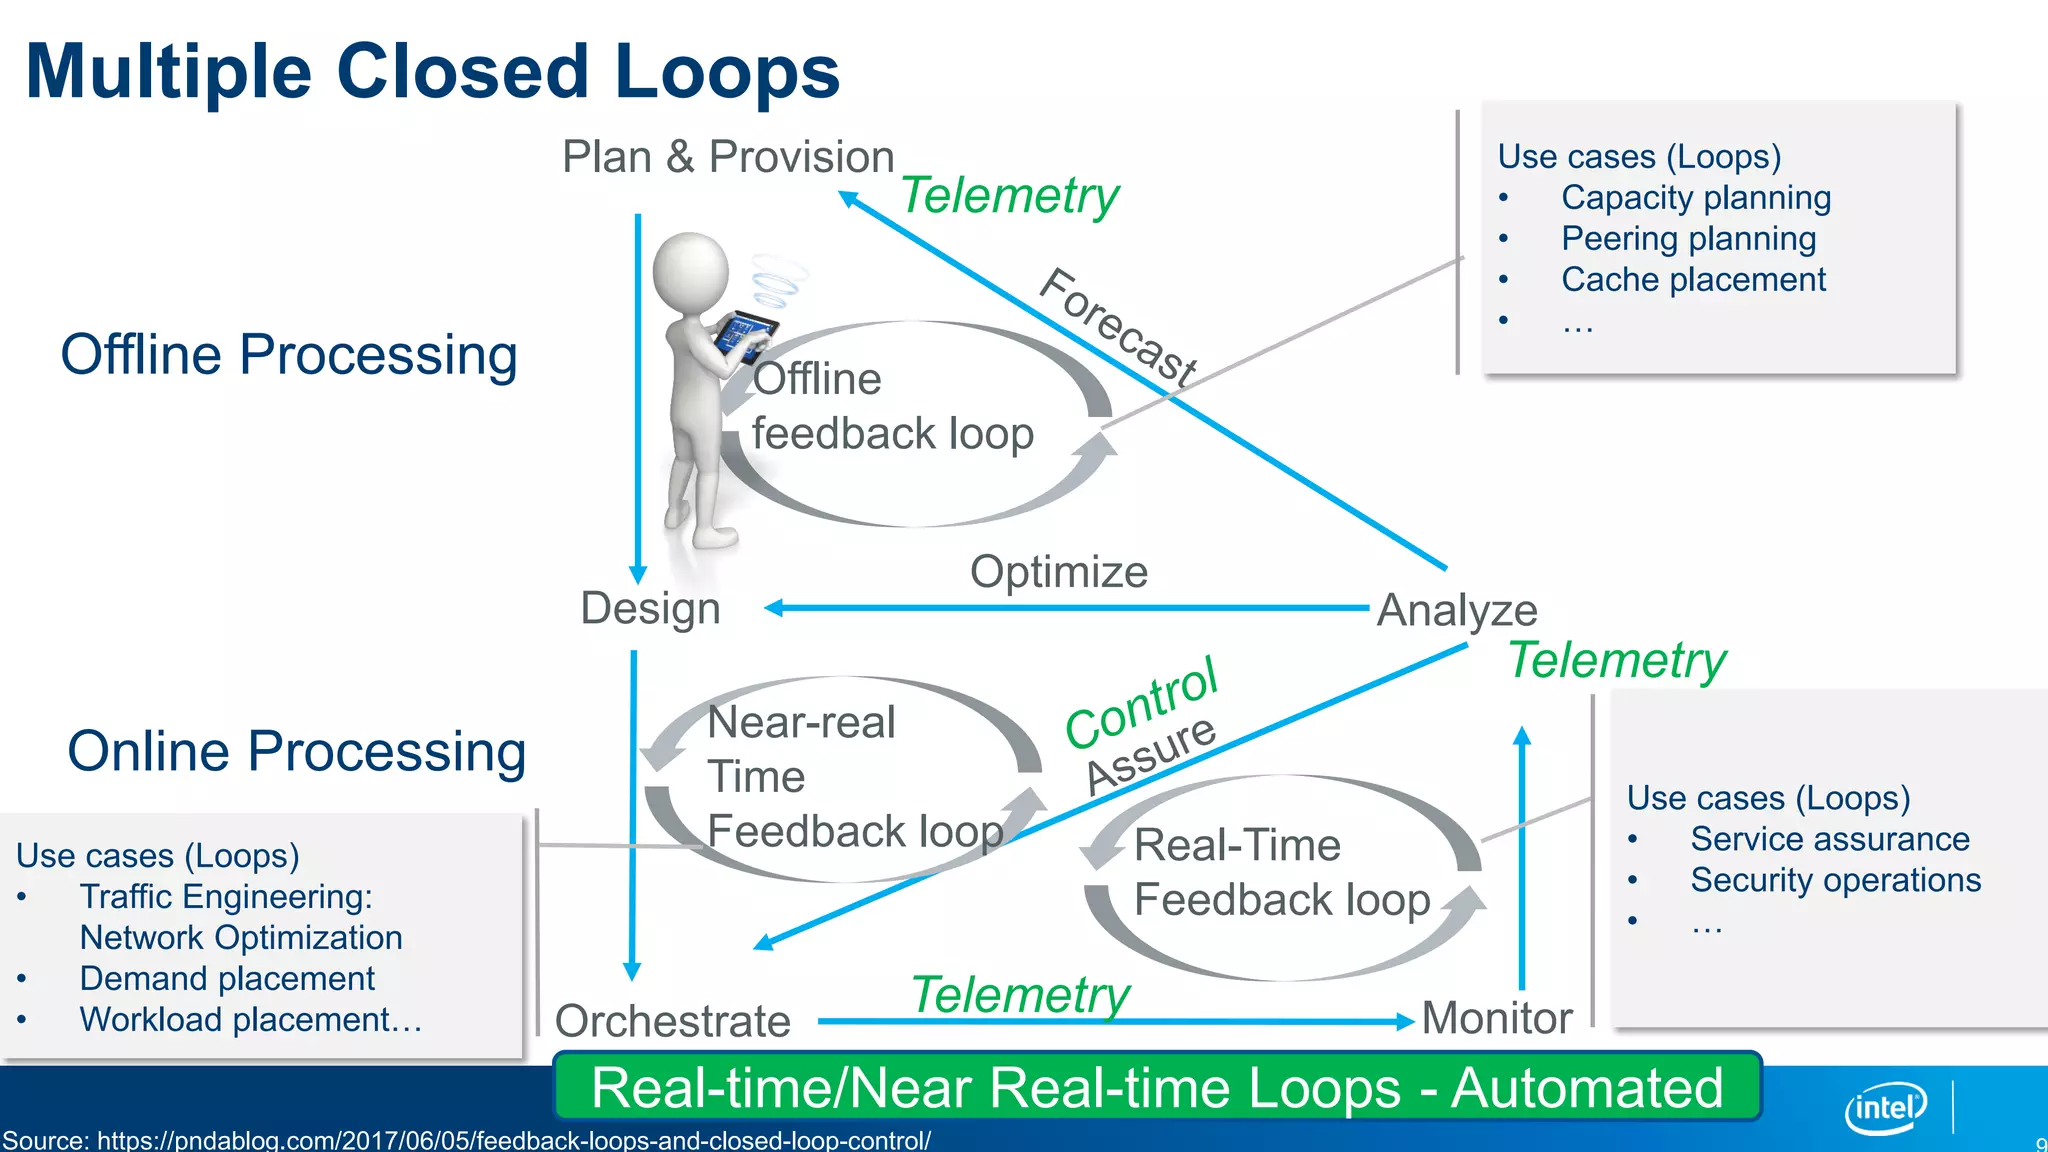
Closed Loops – Business Cases
Improved Customer
Experience
Cloud Optimization &
Efficiency
Edge Placement
Service Healing
Differentiated QoS
Service Optimization
Energy Optimization
Capacity Optimization
Cloud Configurations
Business
Use Cases
AI/ML/DL
Platform(s)
Feature Exposure Provisioning Telemetry
Local Policy Enforcement Agent(s)
For Local Dynamic Control
Intel Infrastructure
Management Tech
Intel RDT Power
Monitoring/Storage
NFV Orchestrator (NFVO) [eg ONAP/OSM]
Security
Threat Detection
Threat Response
Business Applications
collectd
Policy Based Provisioning
Control Loops
VNF Manager (VNFM)
Open Stack Kubernetes Telemetry I/FTelemetry I/F
Actively
Contributing
Intel
RunSure
Bare Metal
Telemetry I/F](https://image.slidesharecdn.com/platform-observability-and-infrastructure-closed-loops-190517210220/75/Platform-Observability-and-Infrastructure-Closed-Loops-12-2048.jpg)


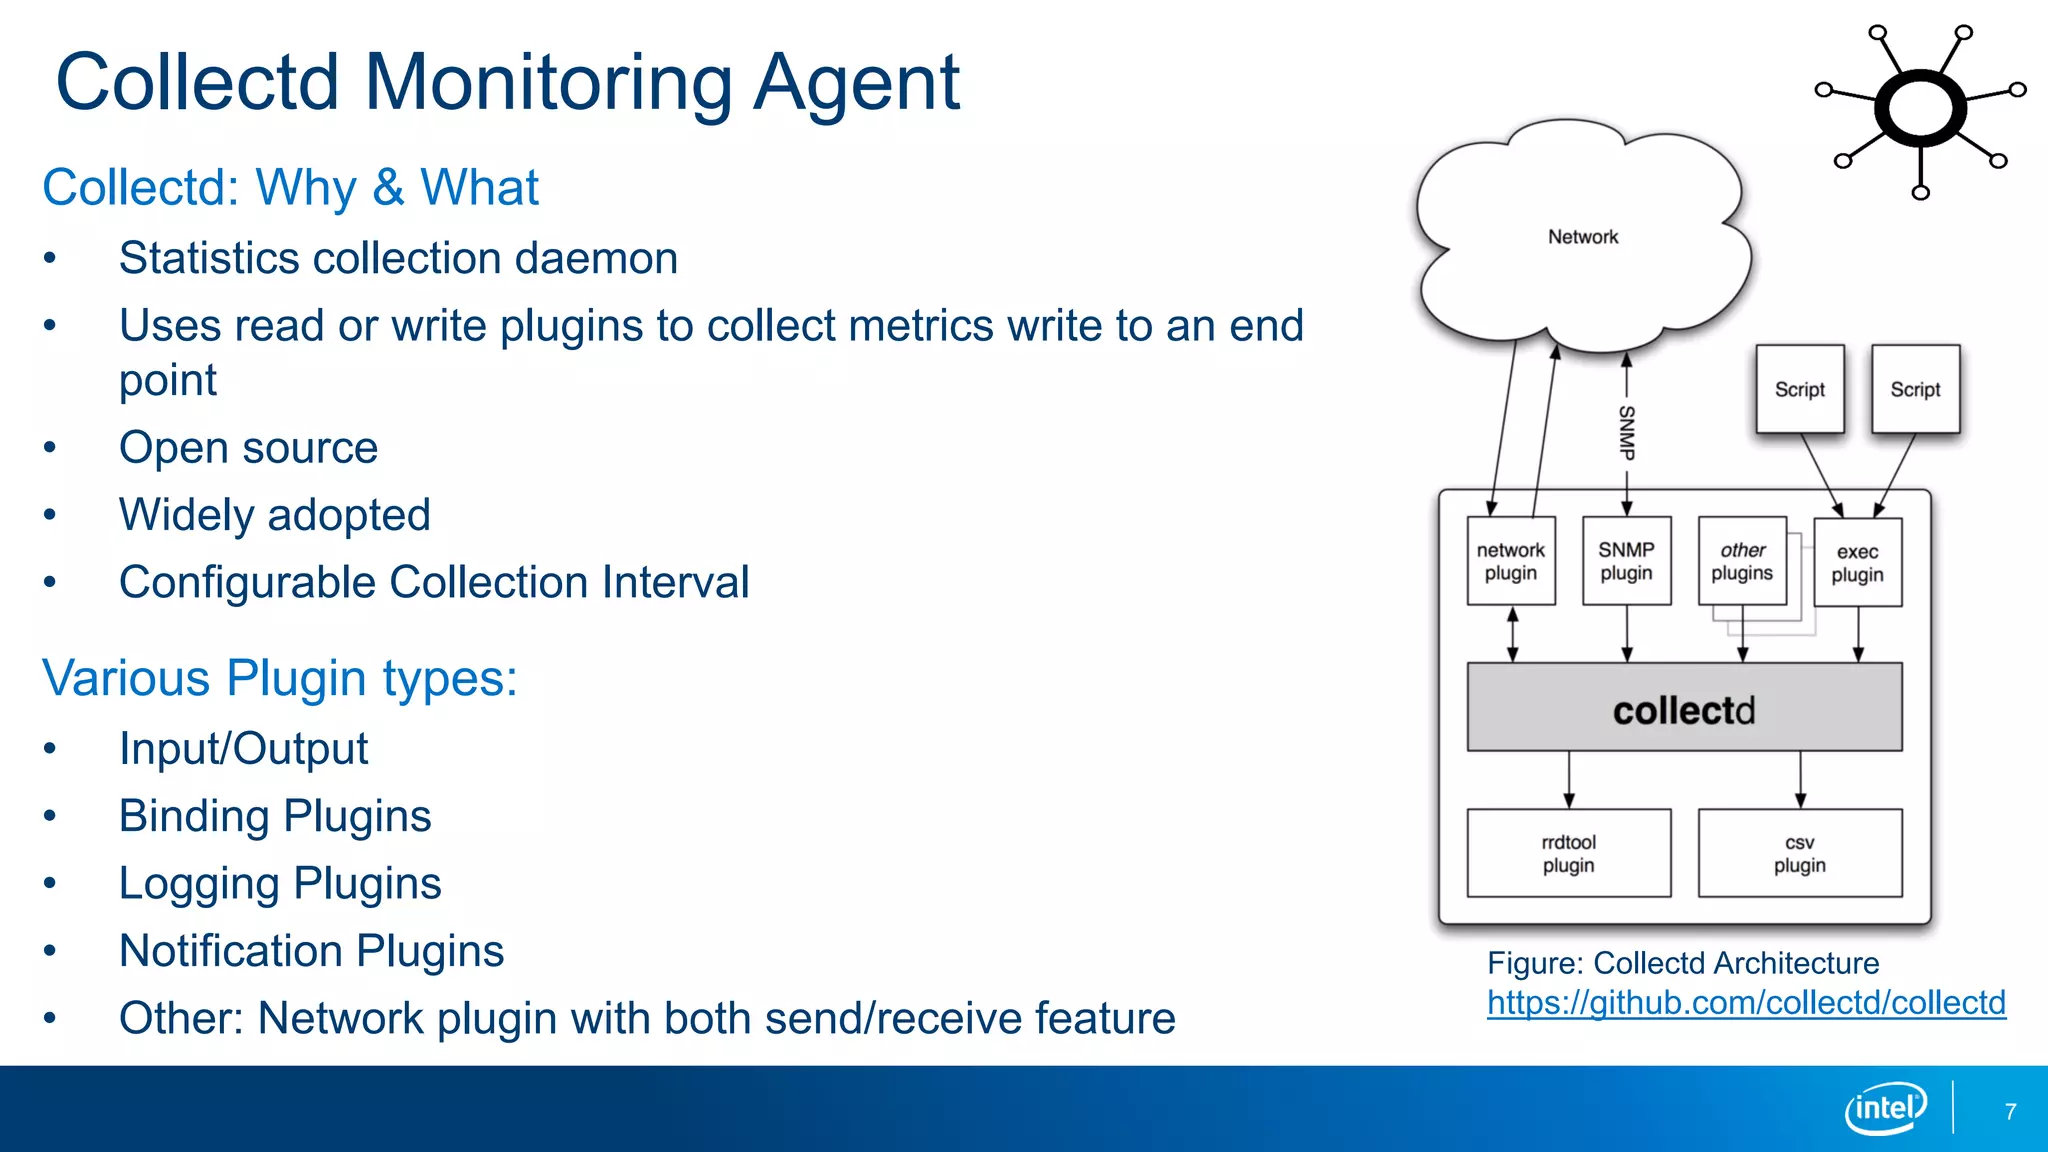
The document outlines Intel's approach to platform observability and service assurance within network infrastructures, emphasizing the importance of monitoring, logging, and closed loop automation for maintaining service quality. It discusses various technologies, frameworks, and tools, such as Collectd and Open Network Automation Platform, that can enhance performance and reliability. Furthermore, it highlights the phased evolution of service assurance from traditional methods to fully automated systems leveraging real-time telemetry and predictive capabilities.