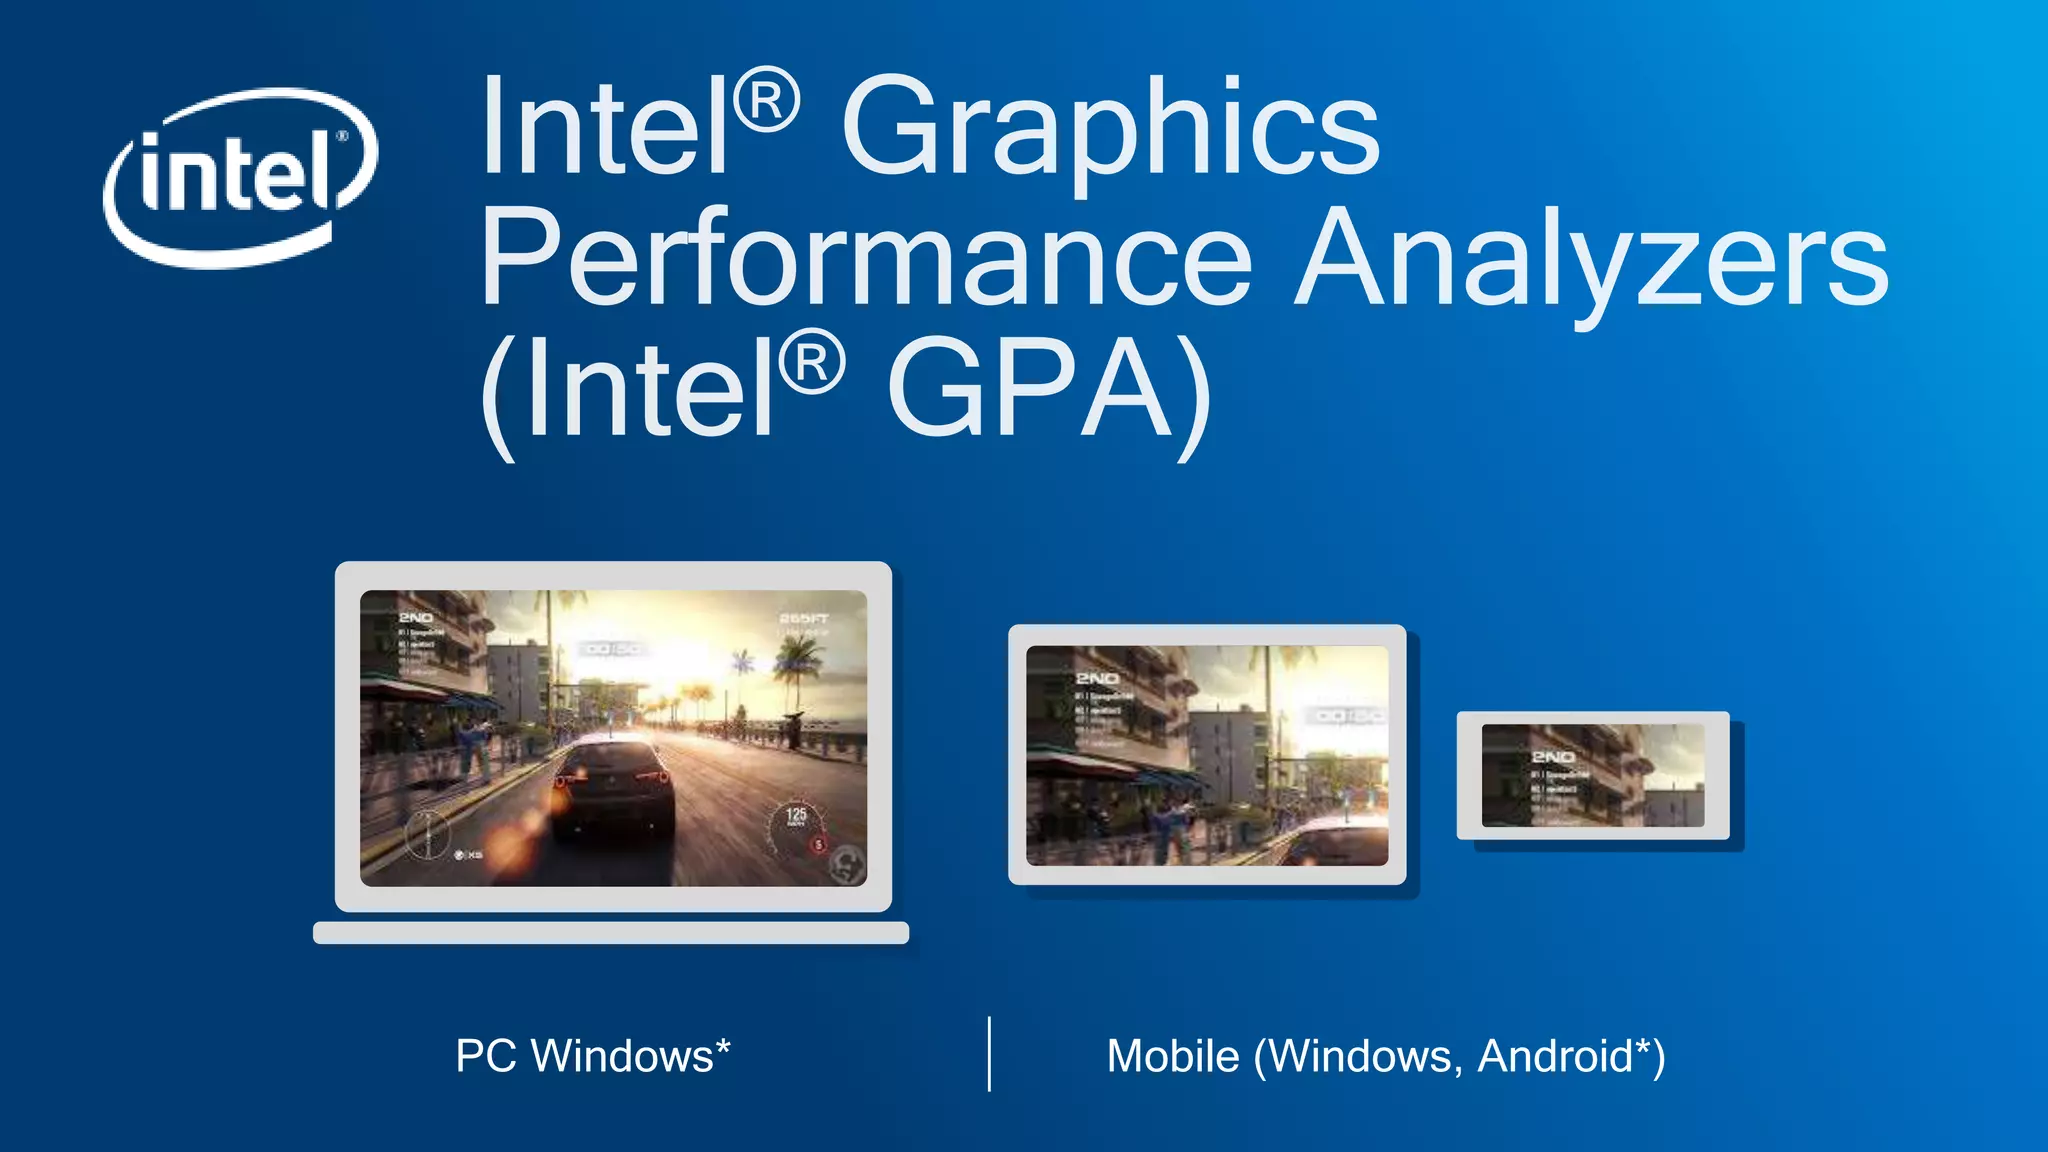
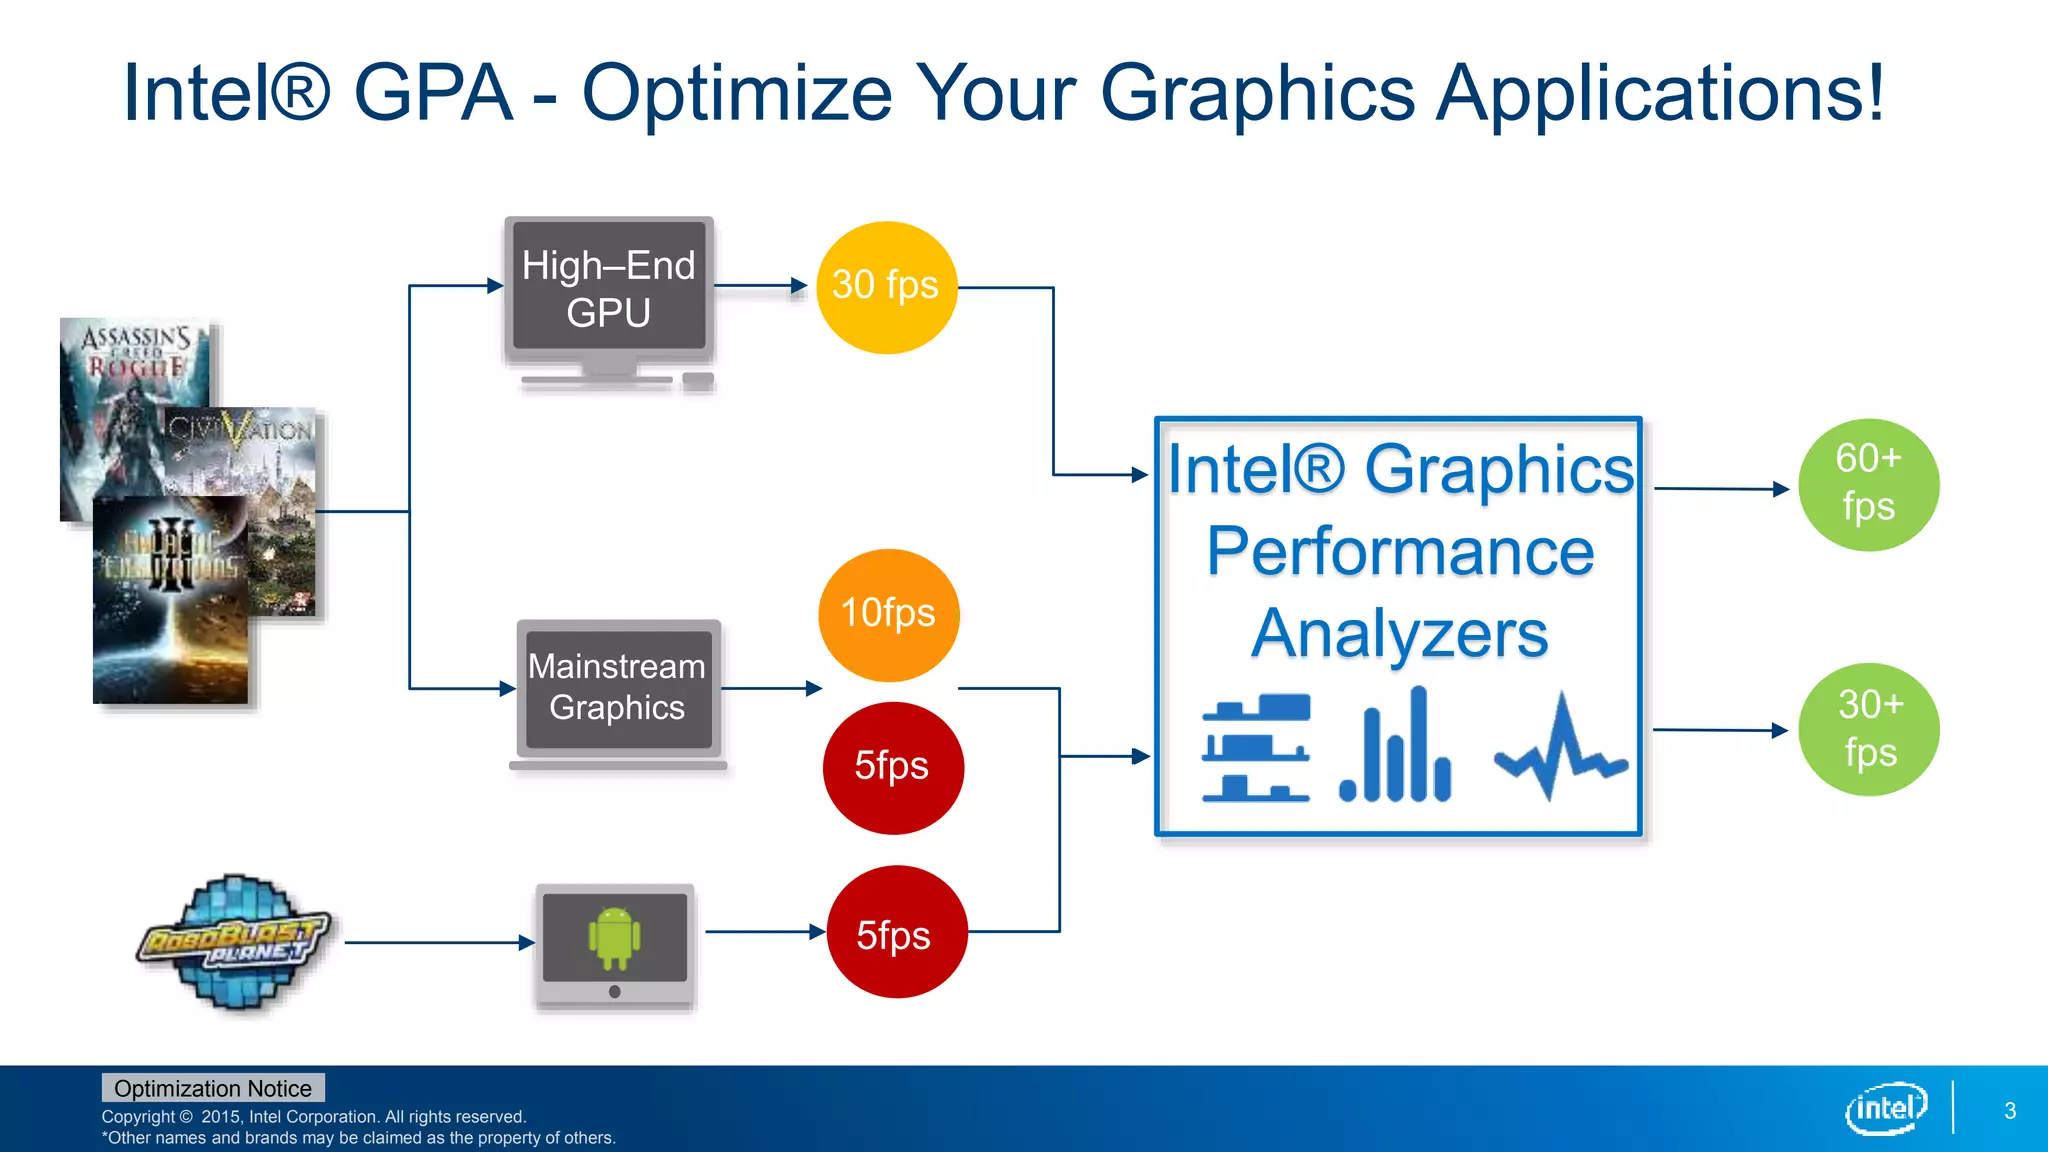
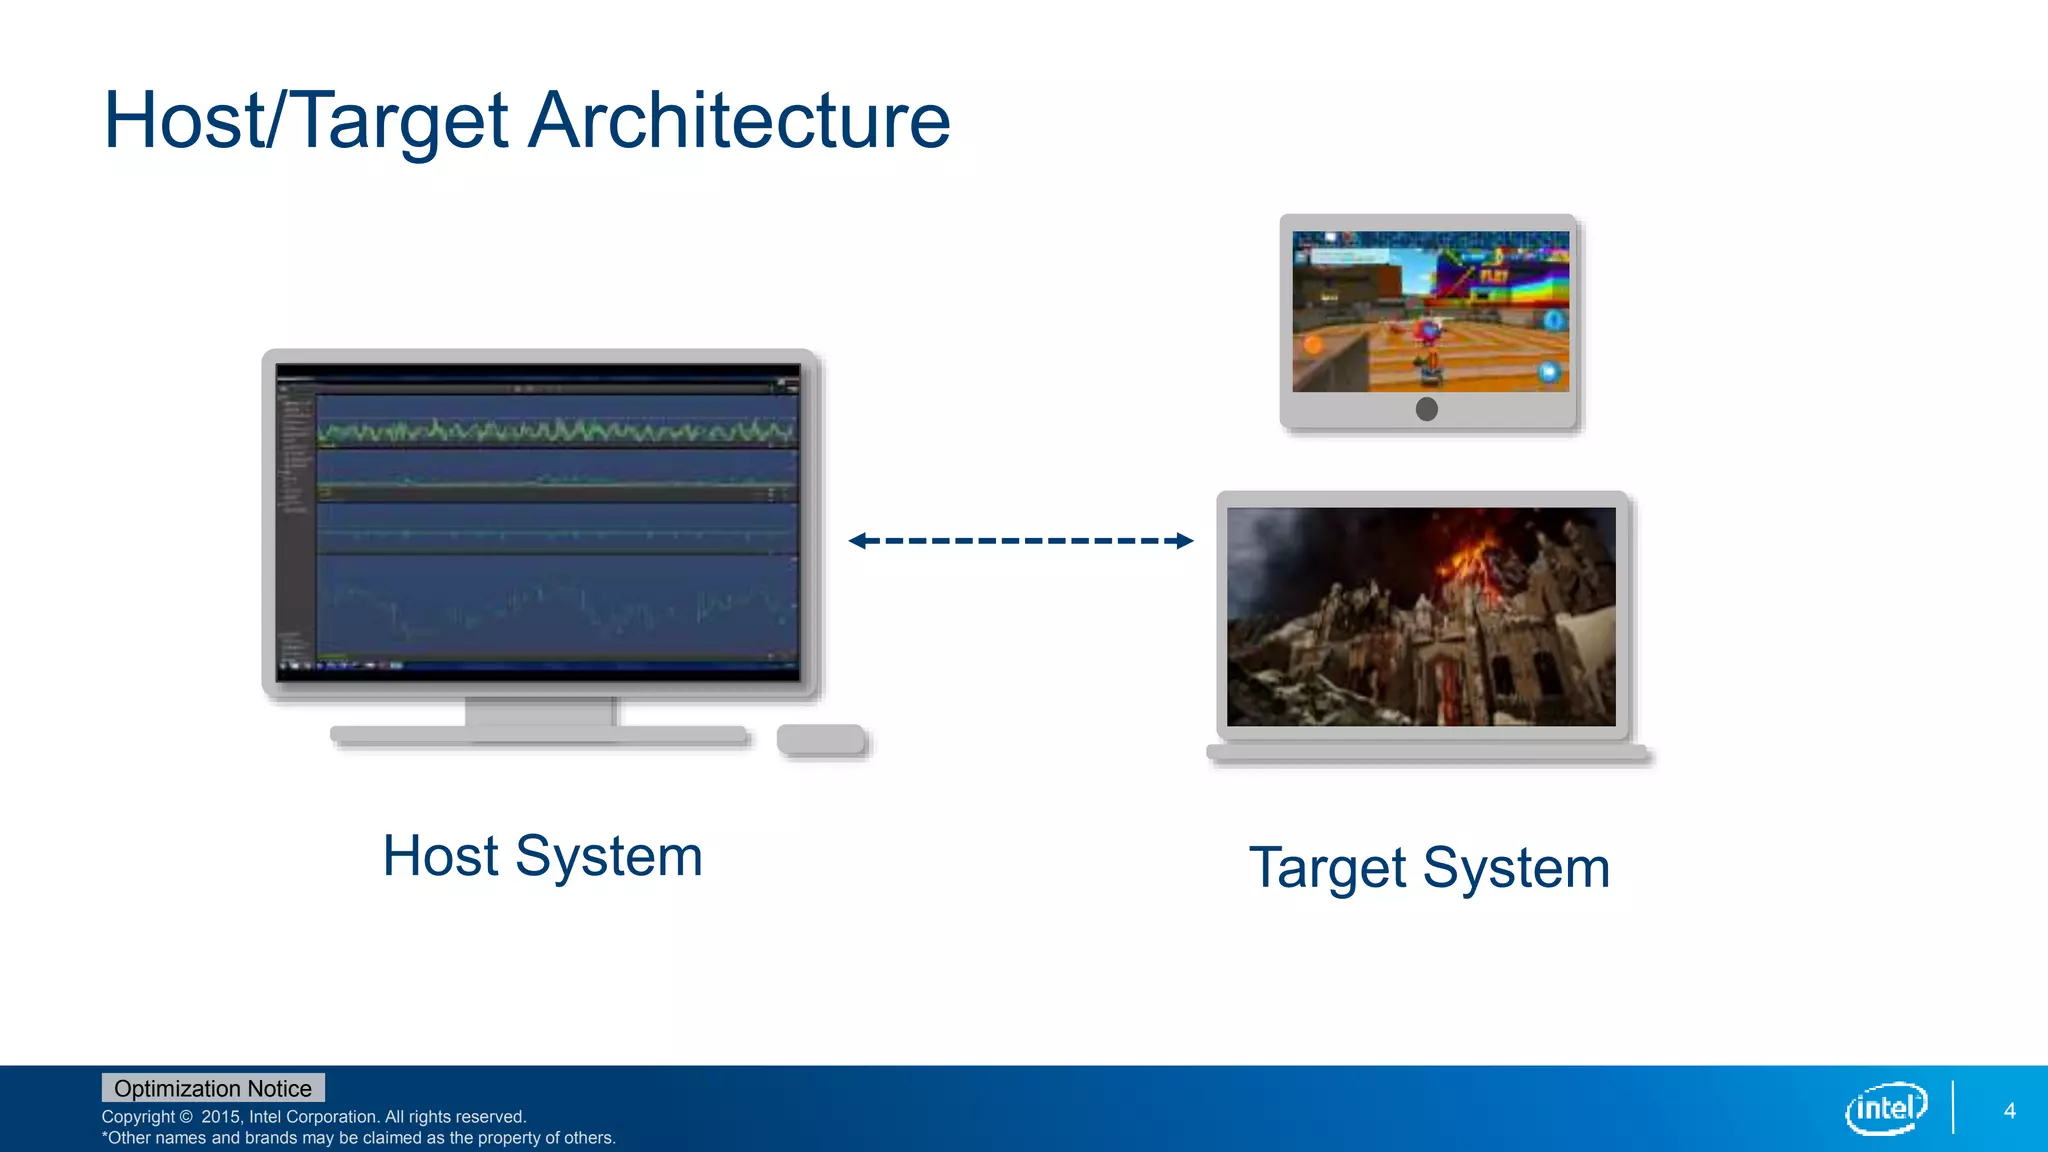
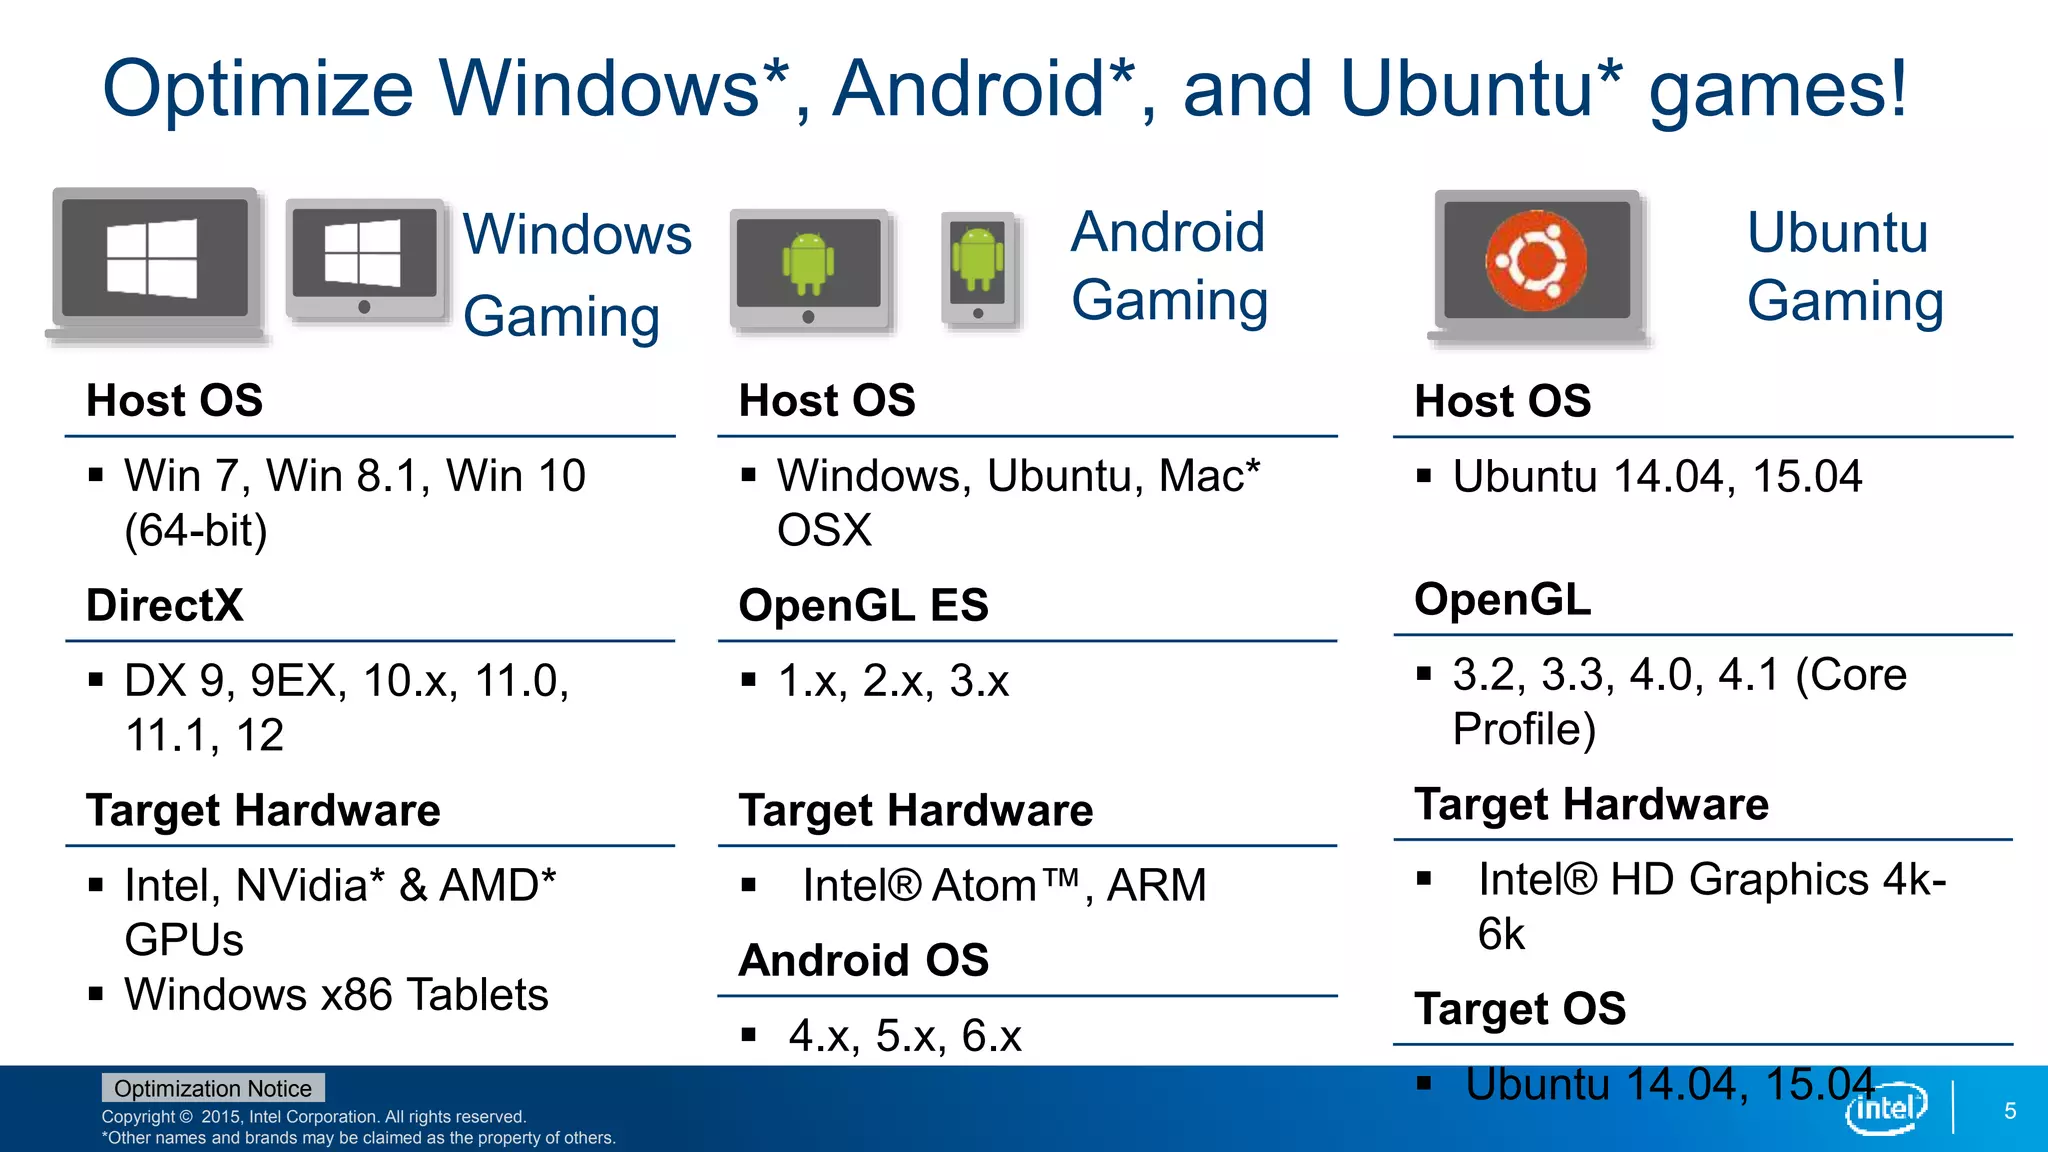
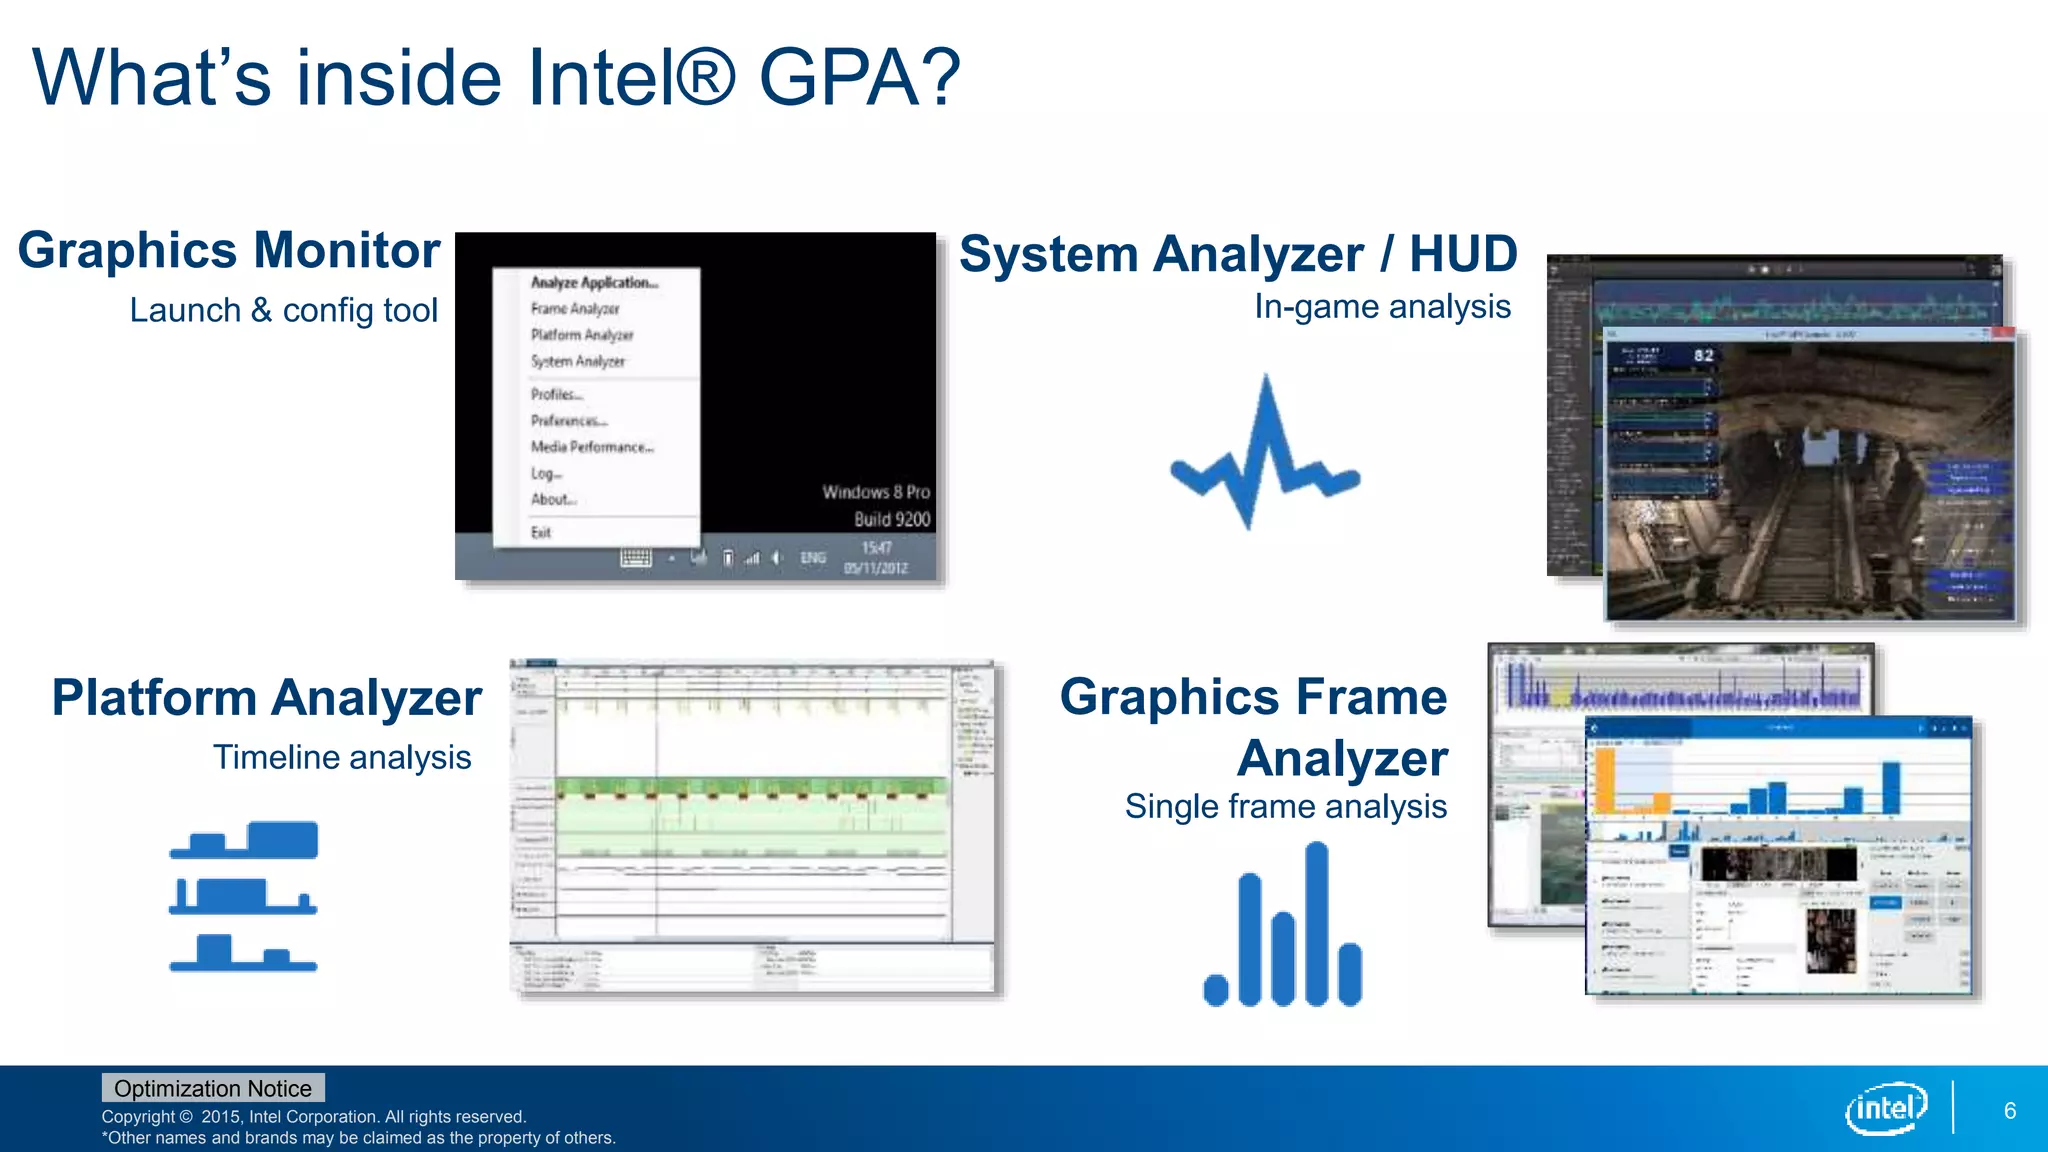
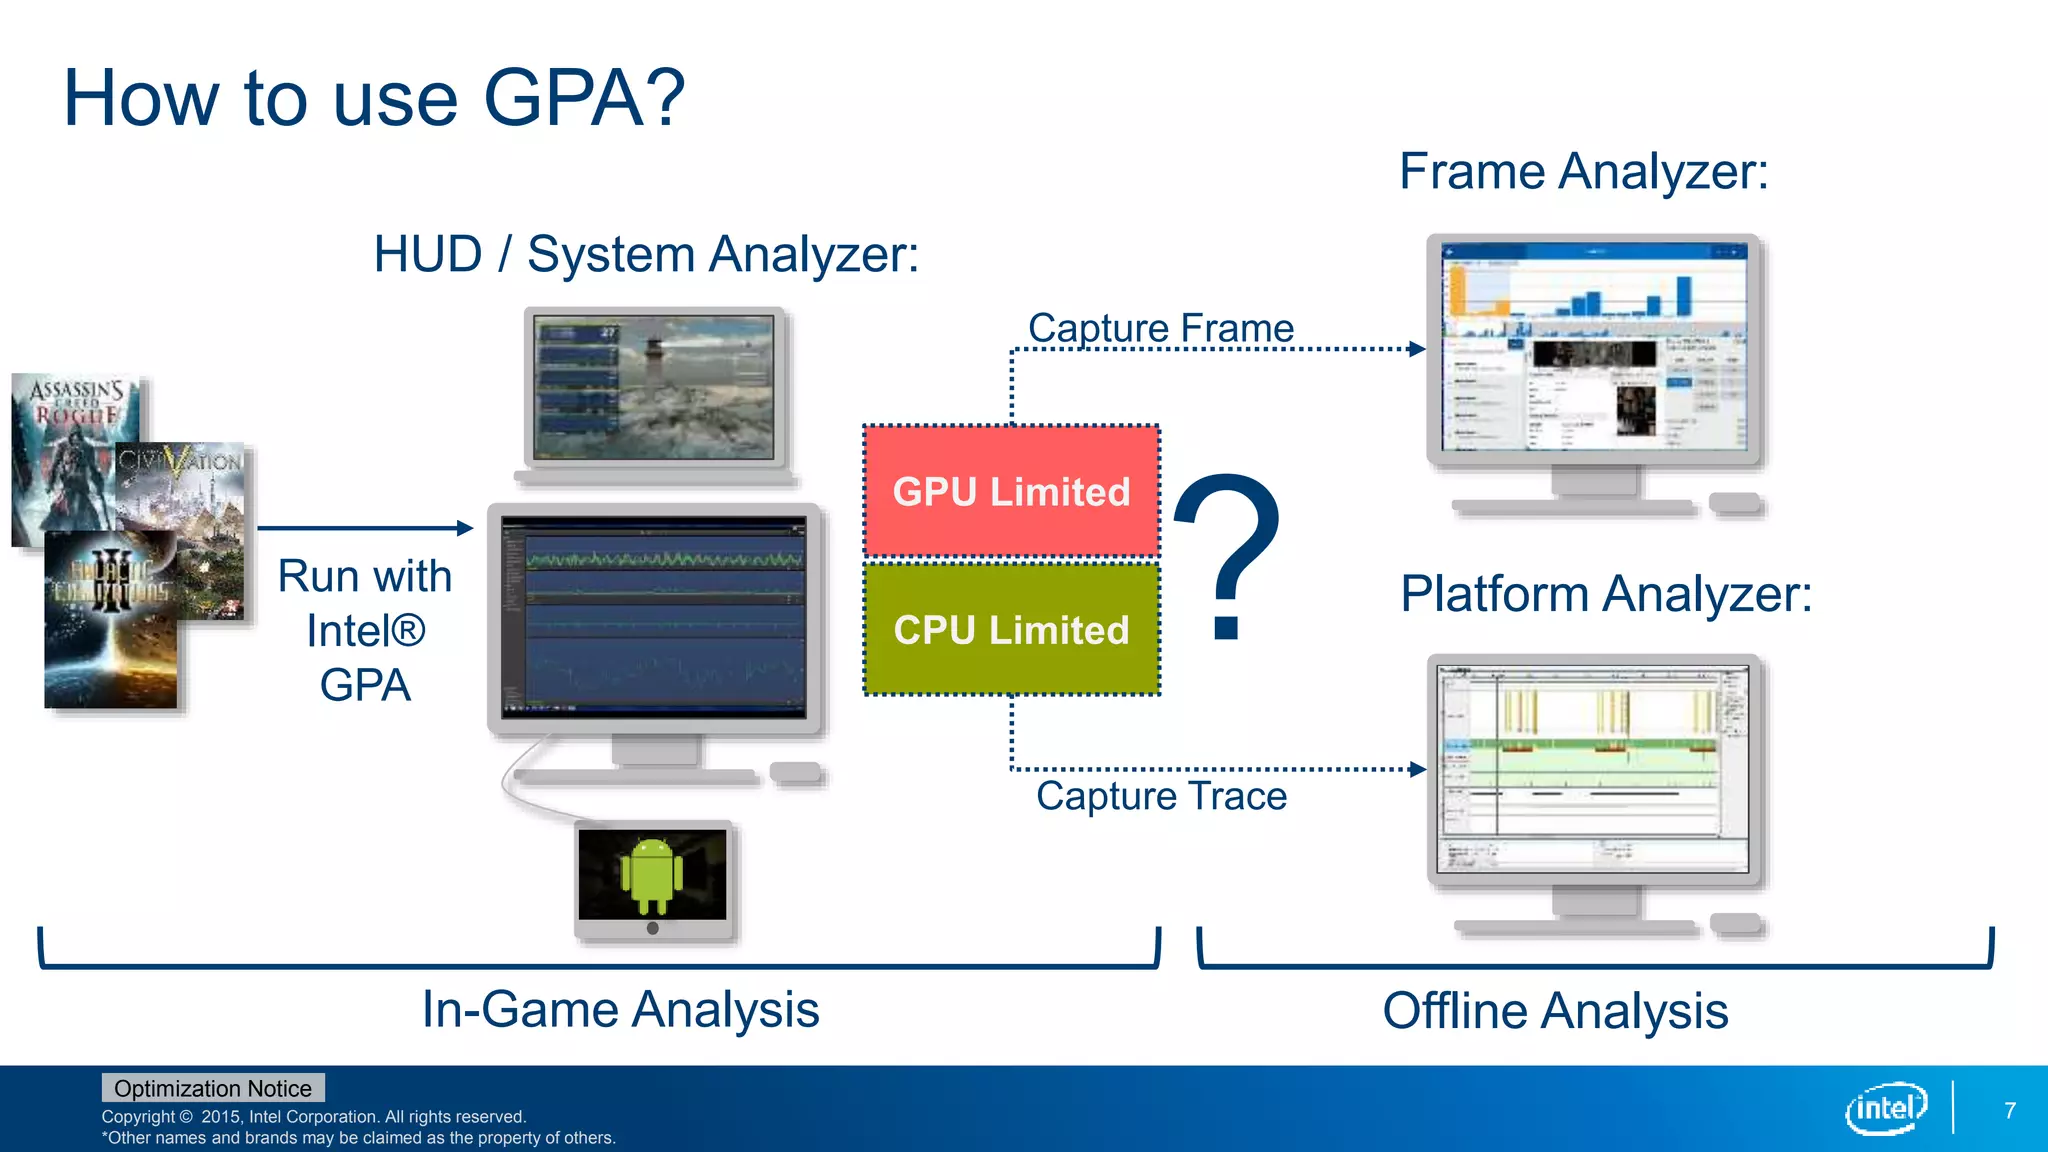
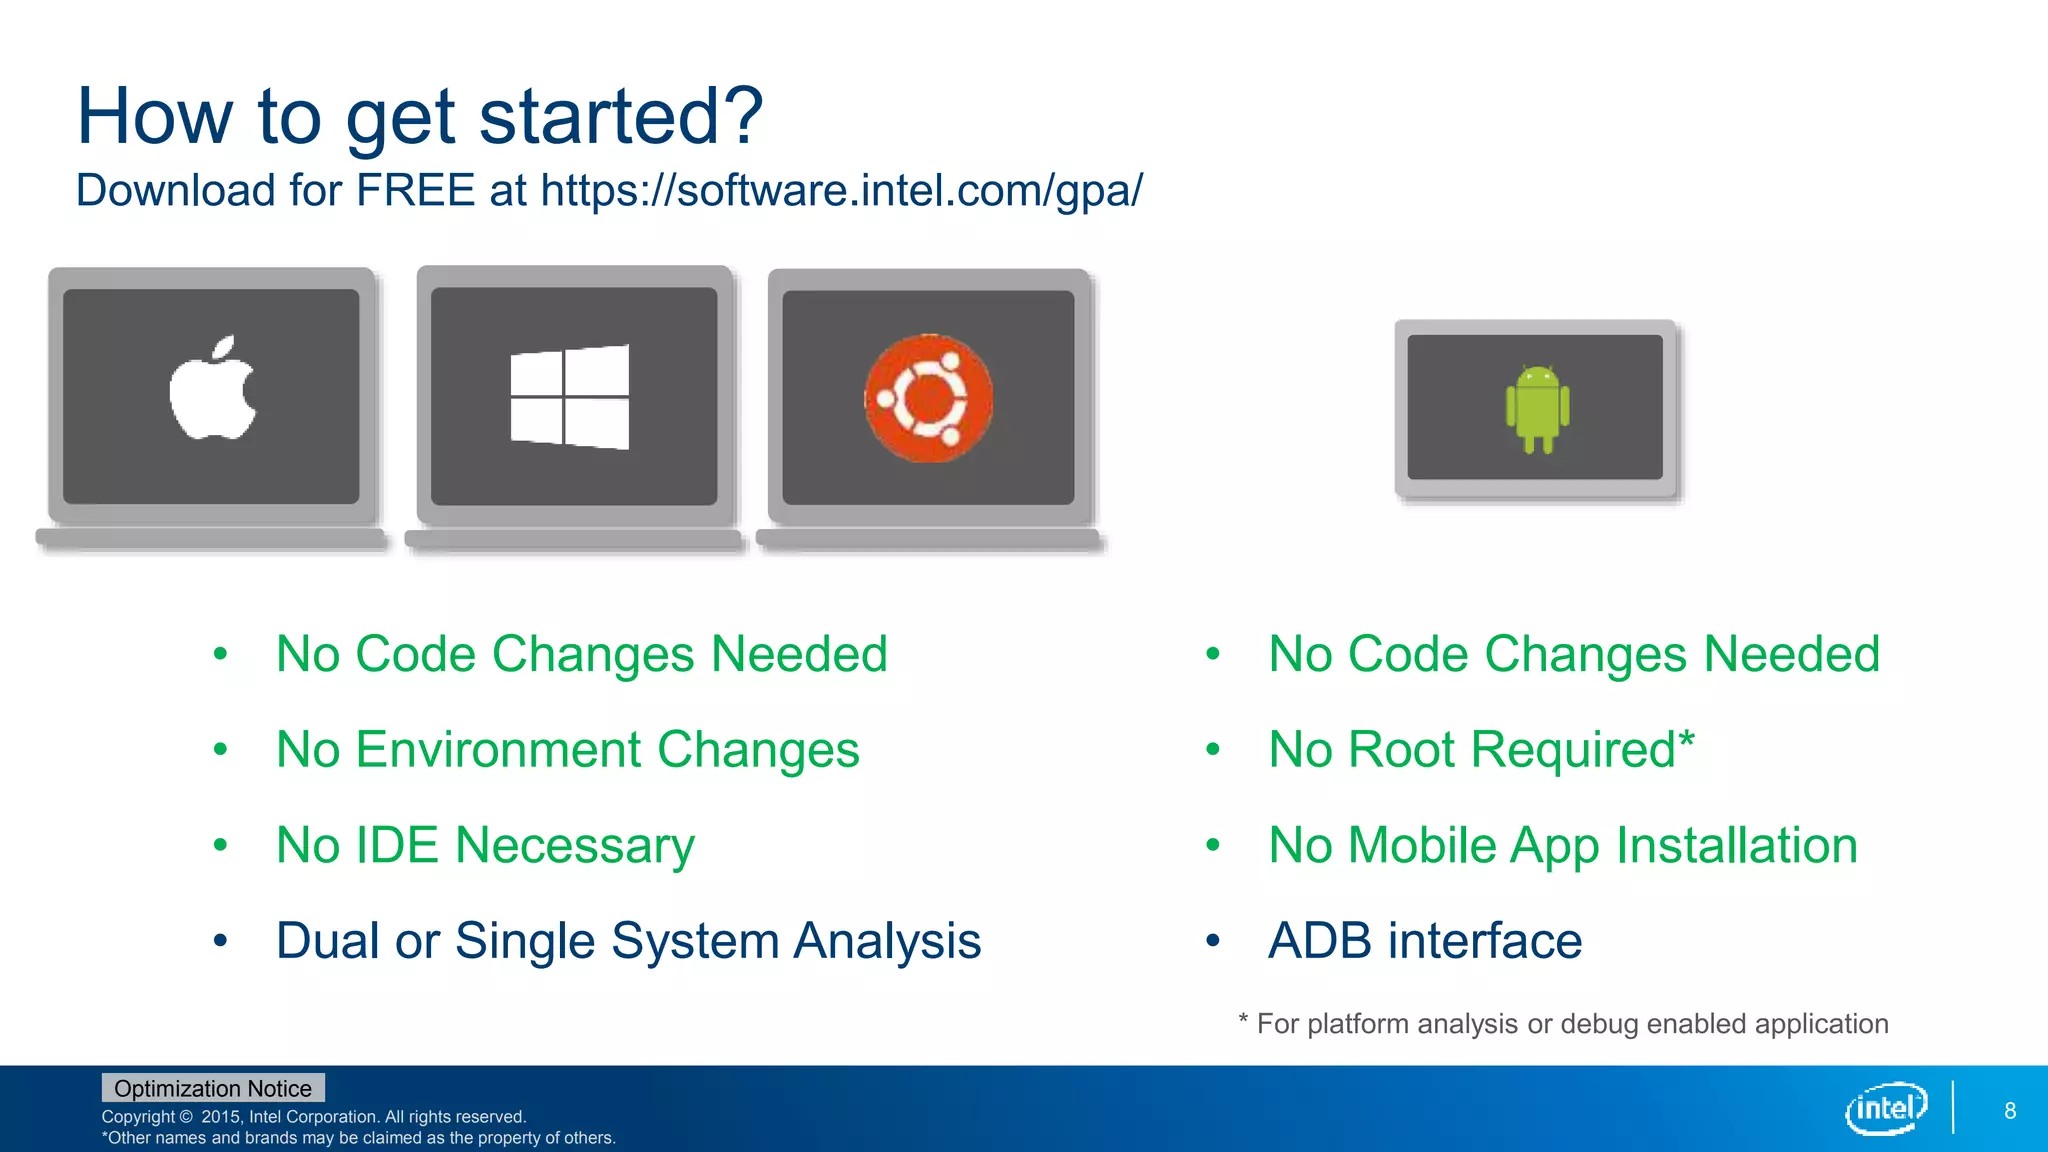
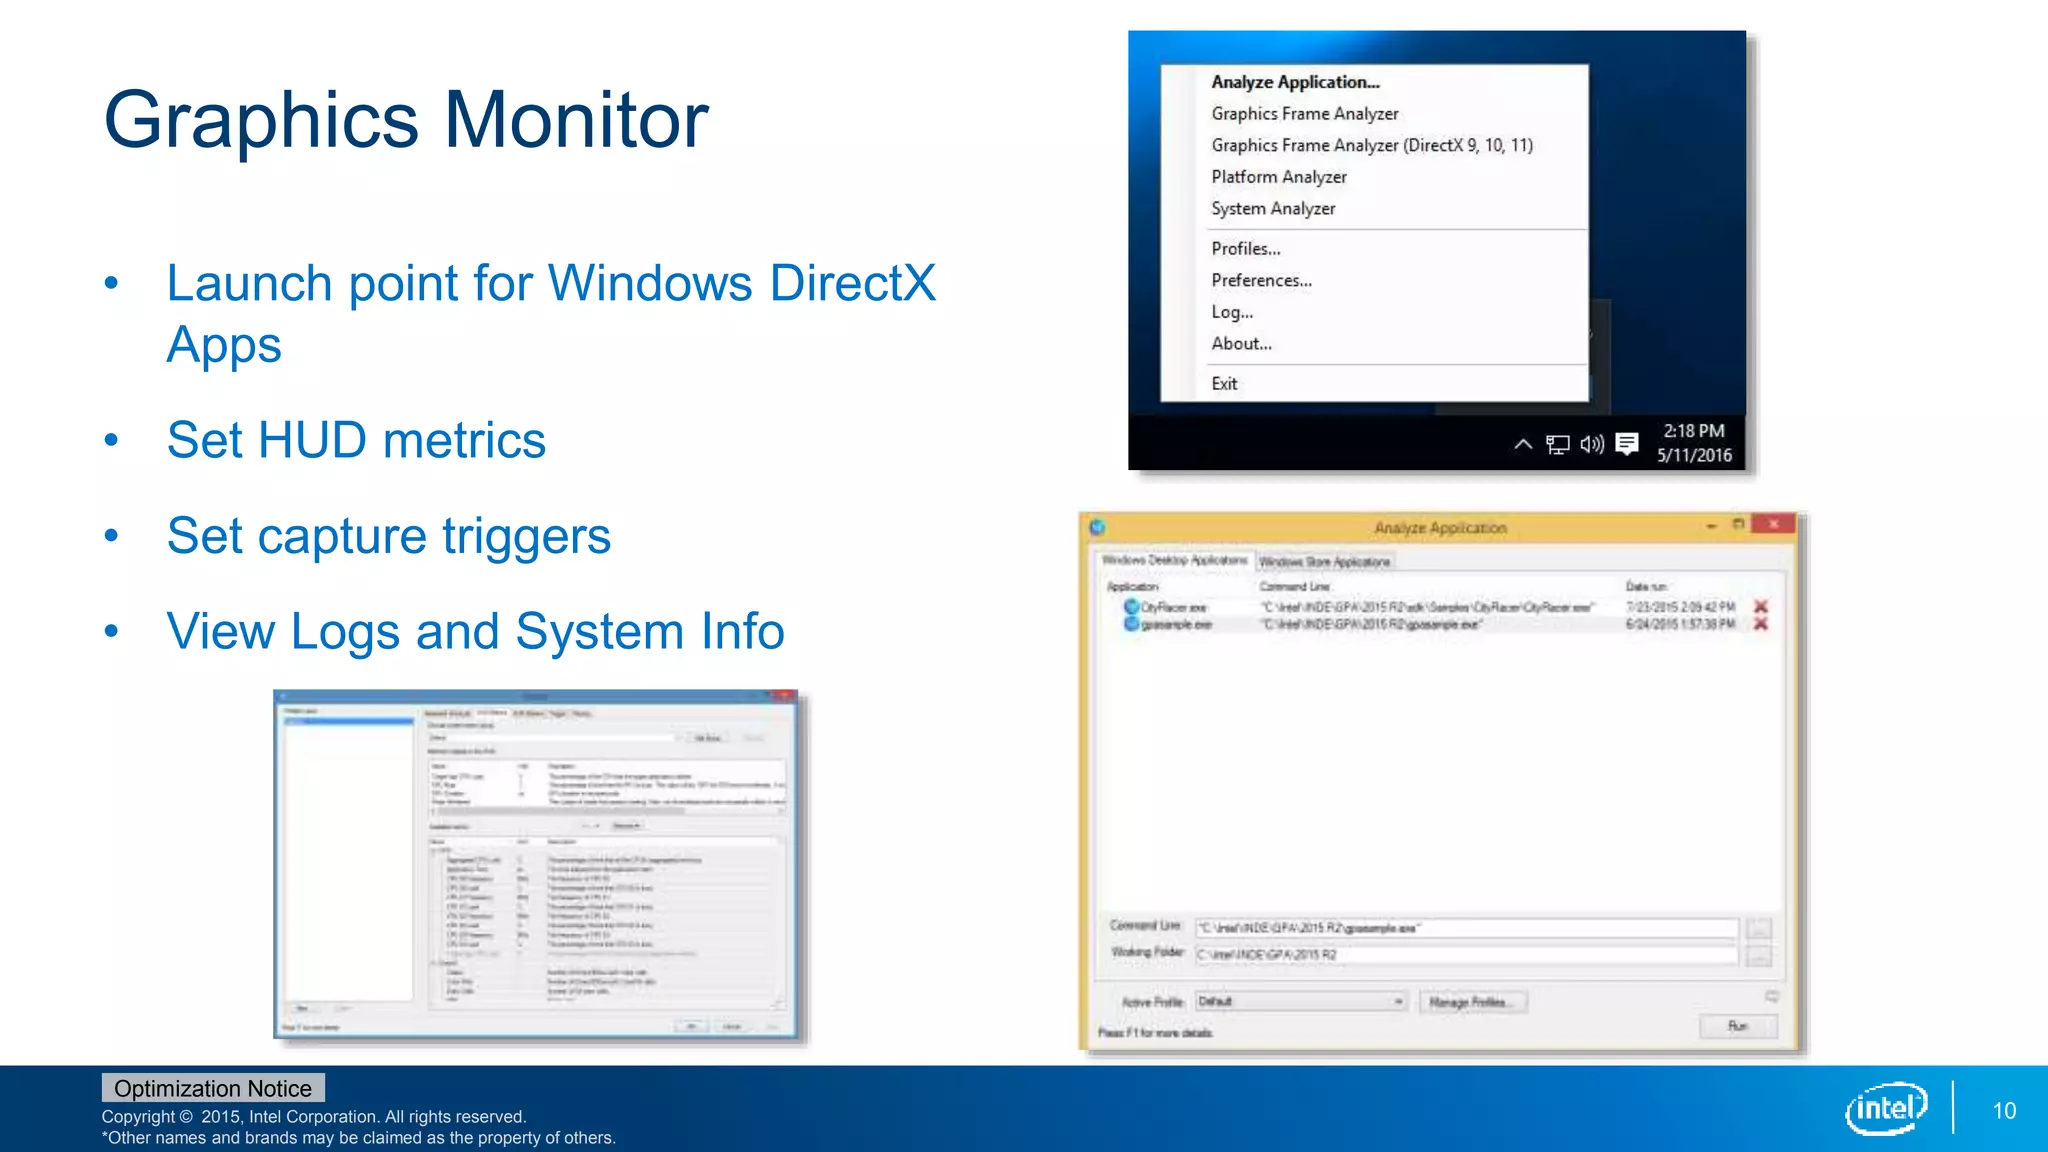
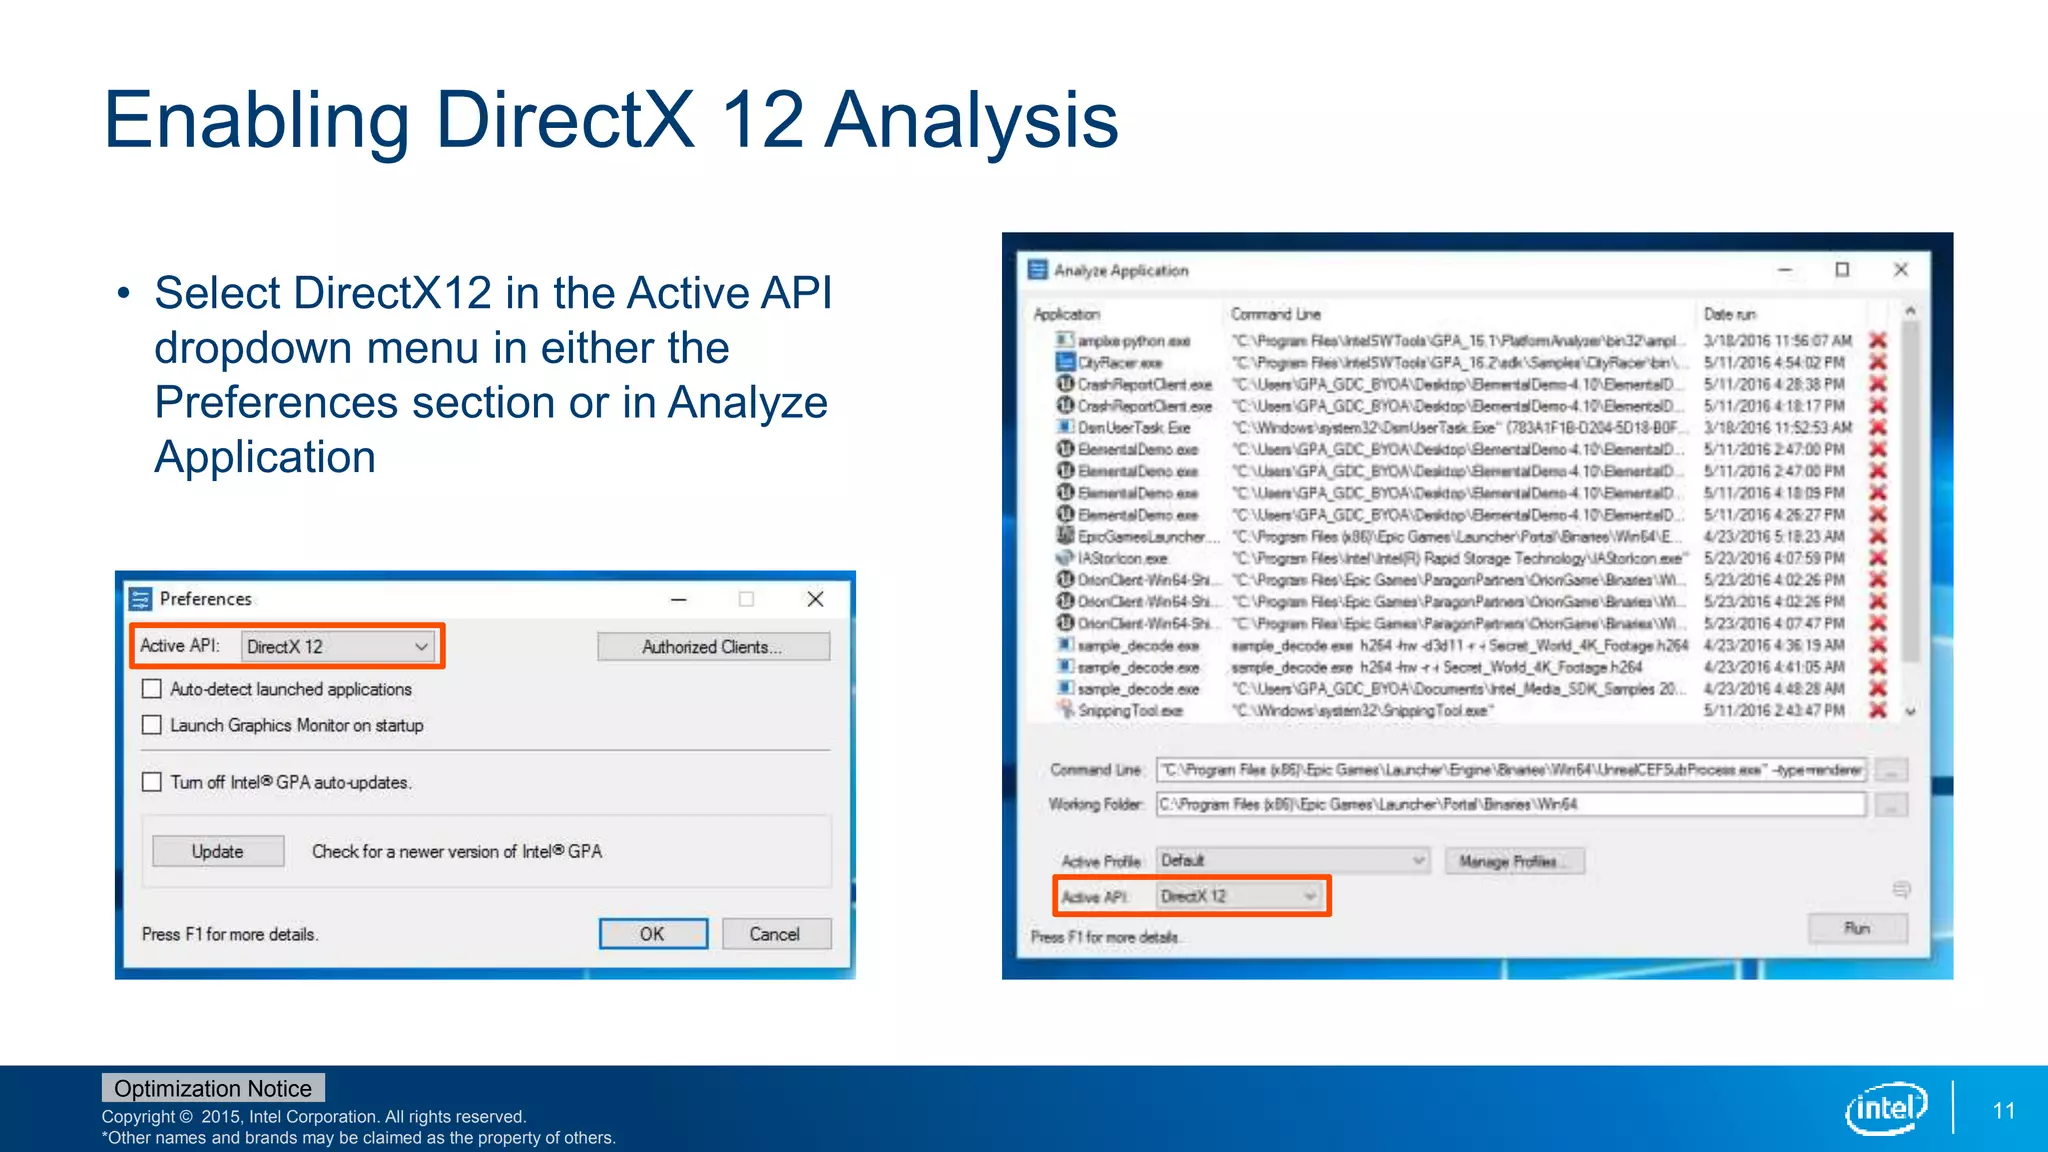
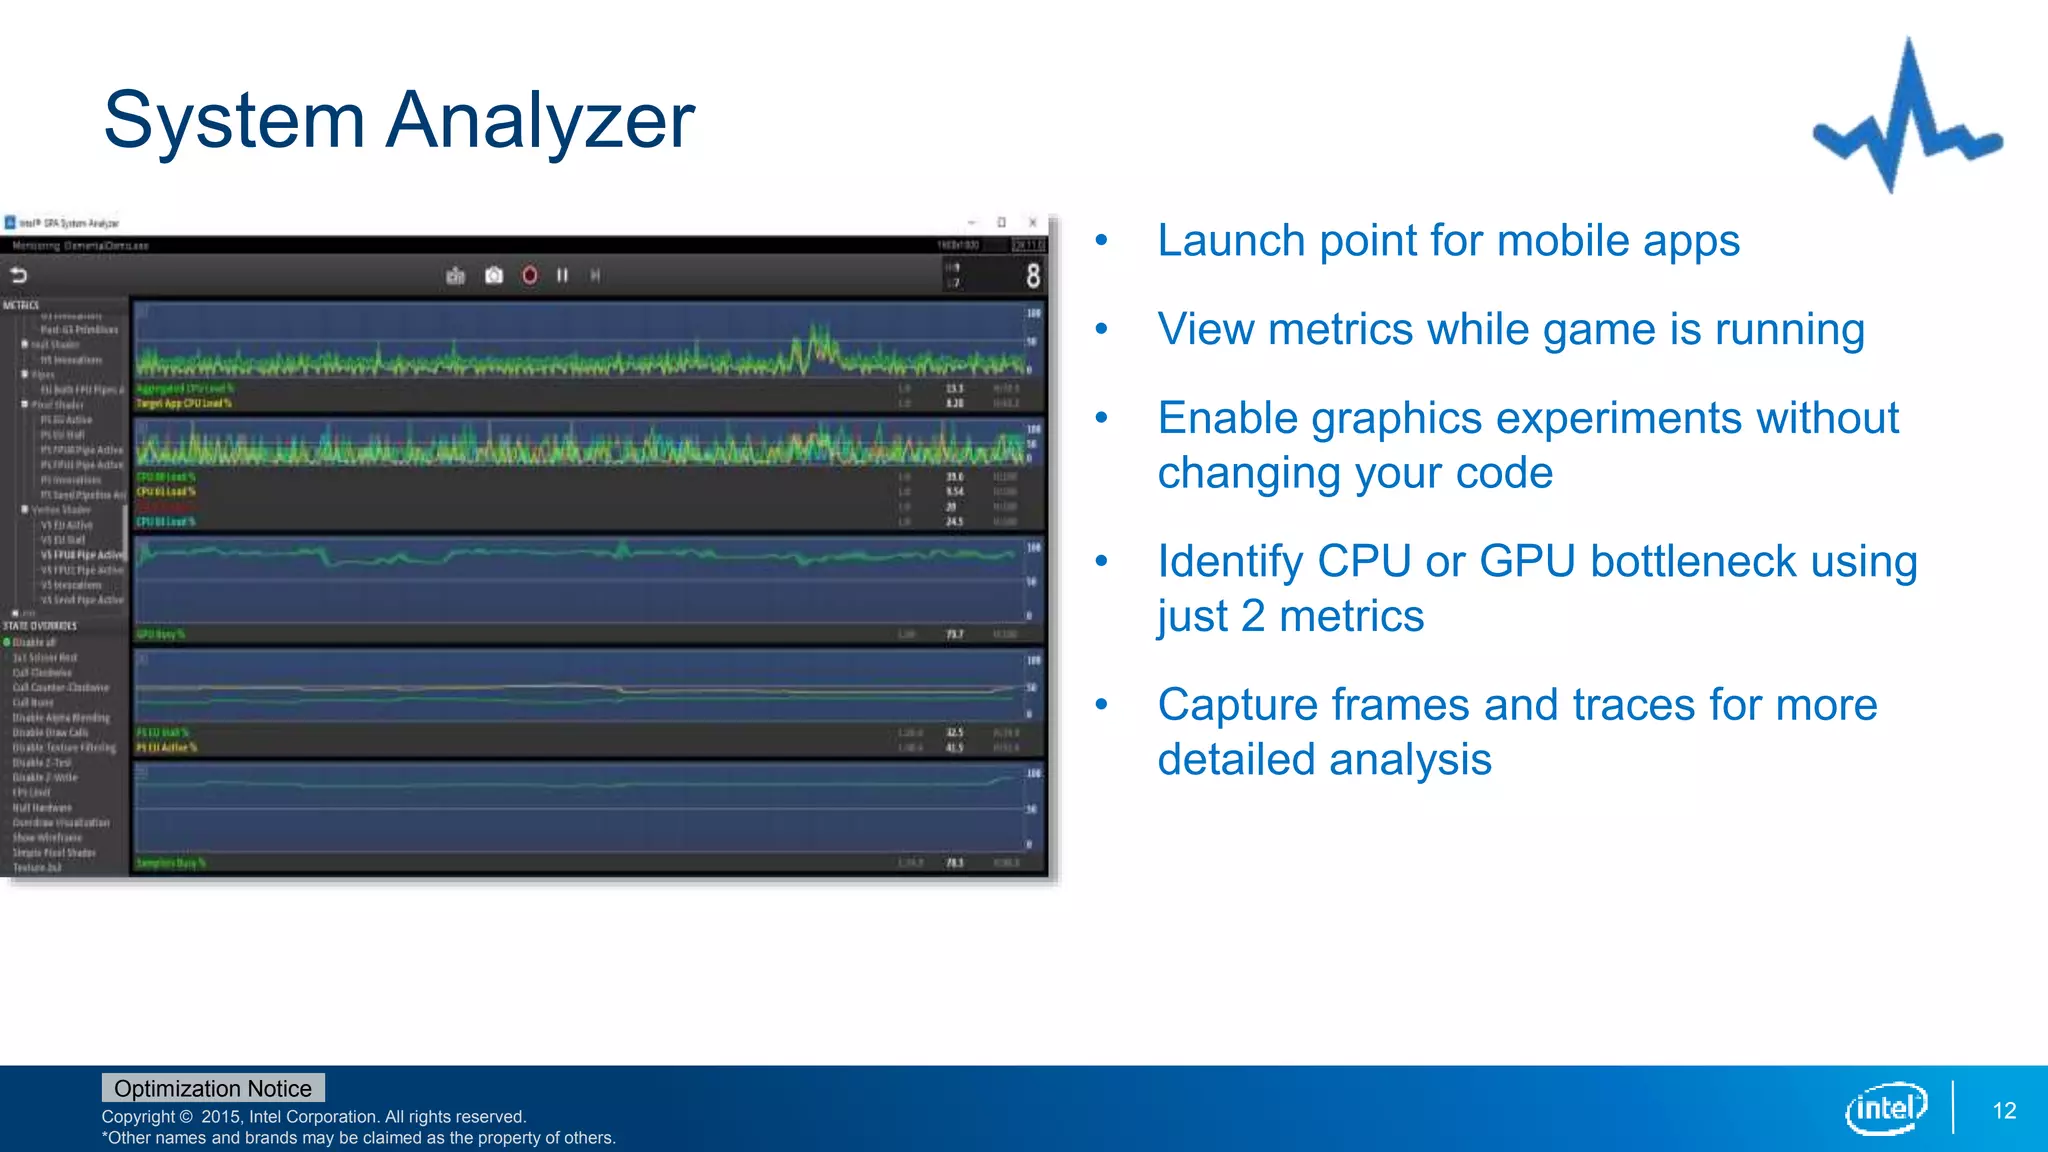
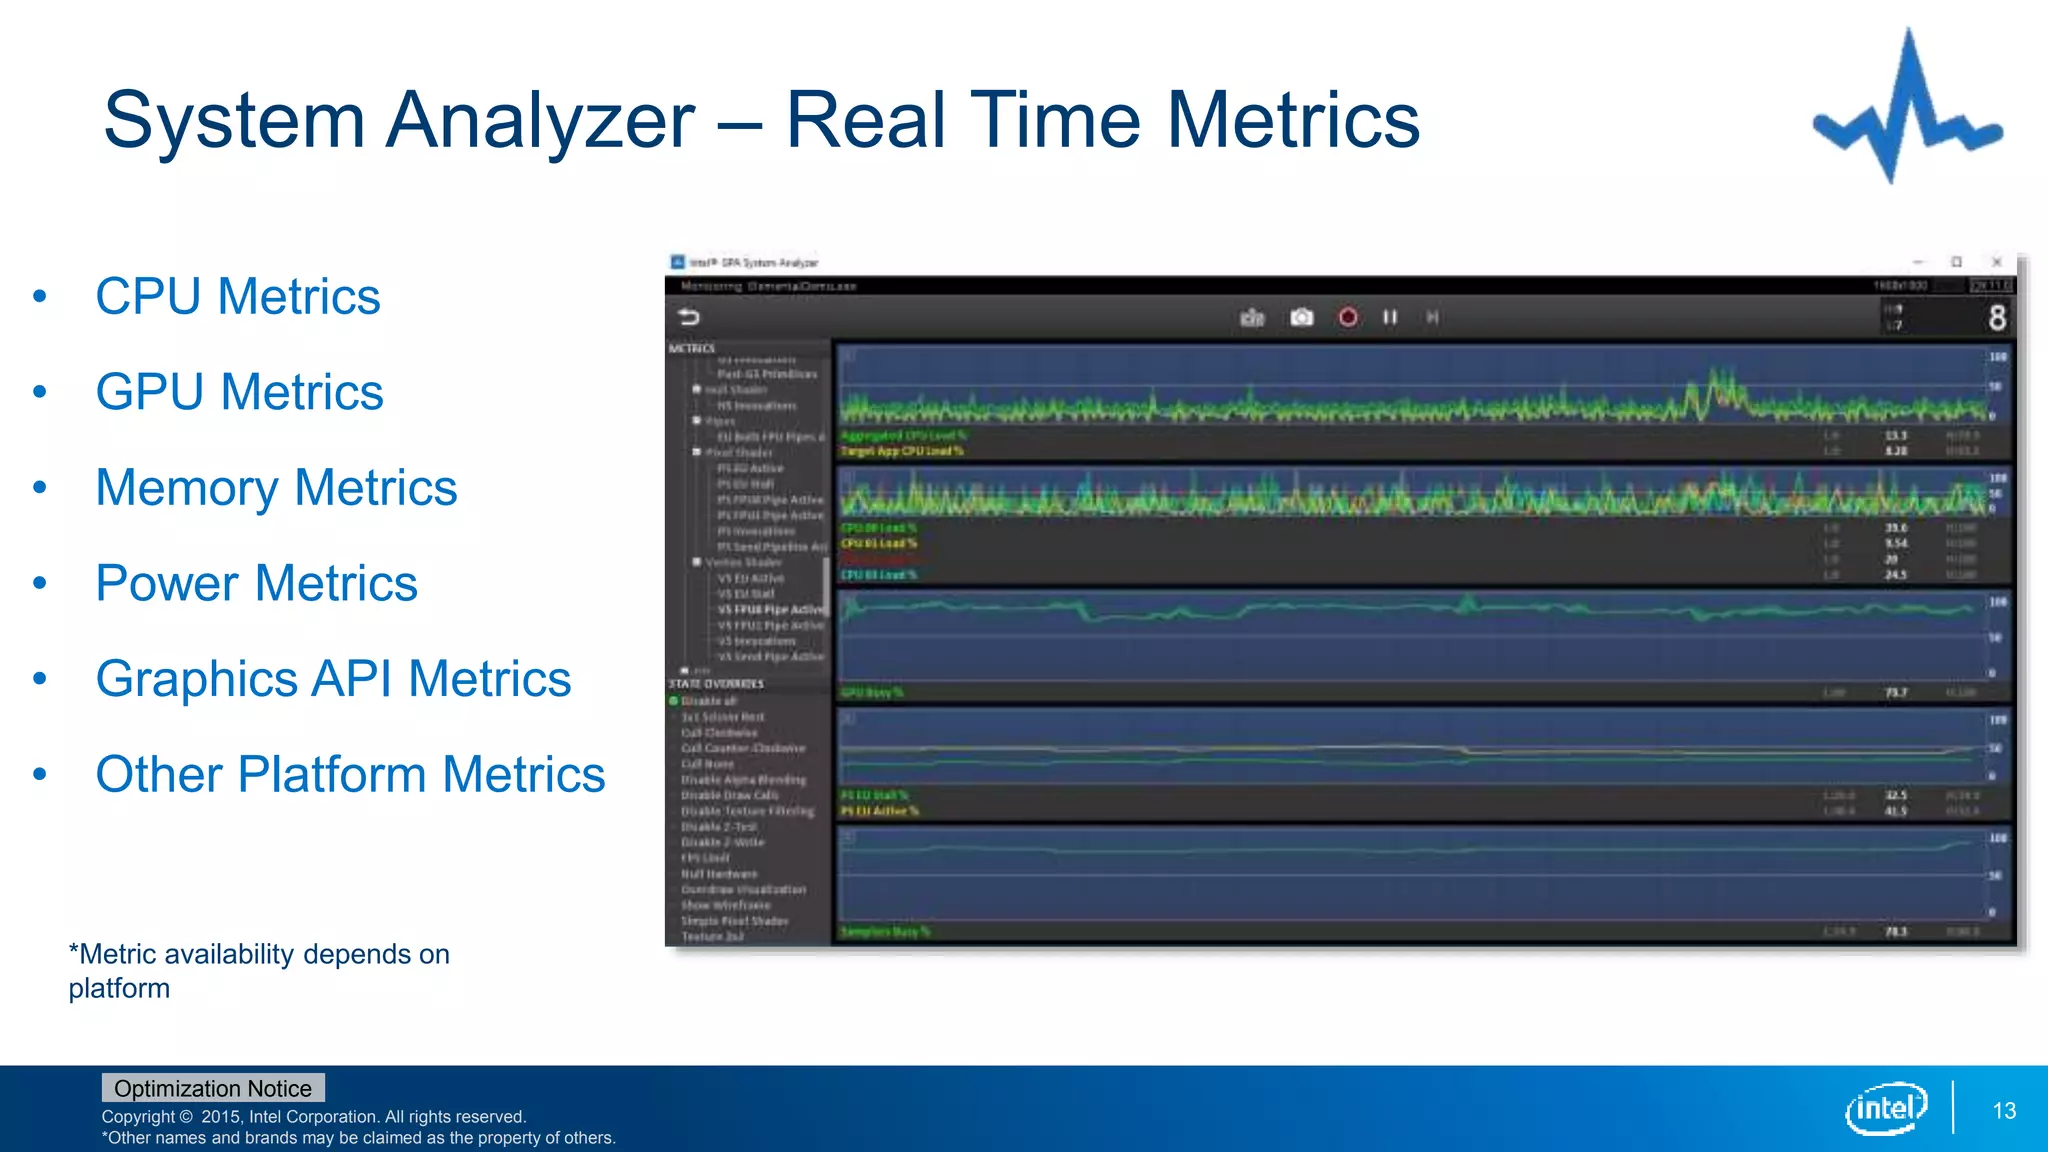
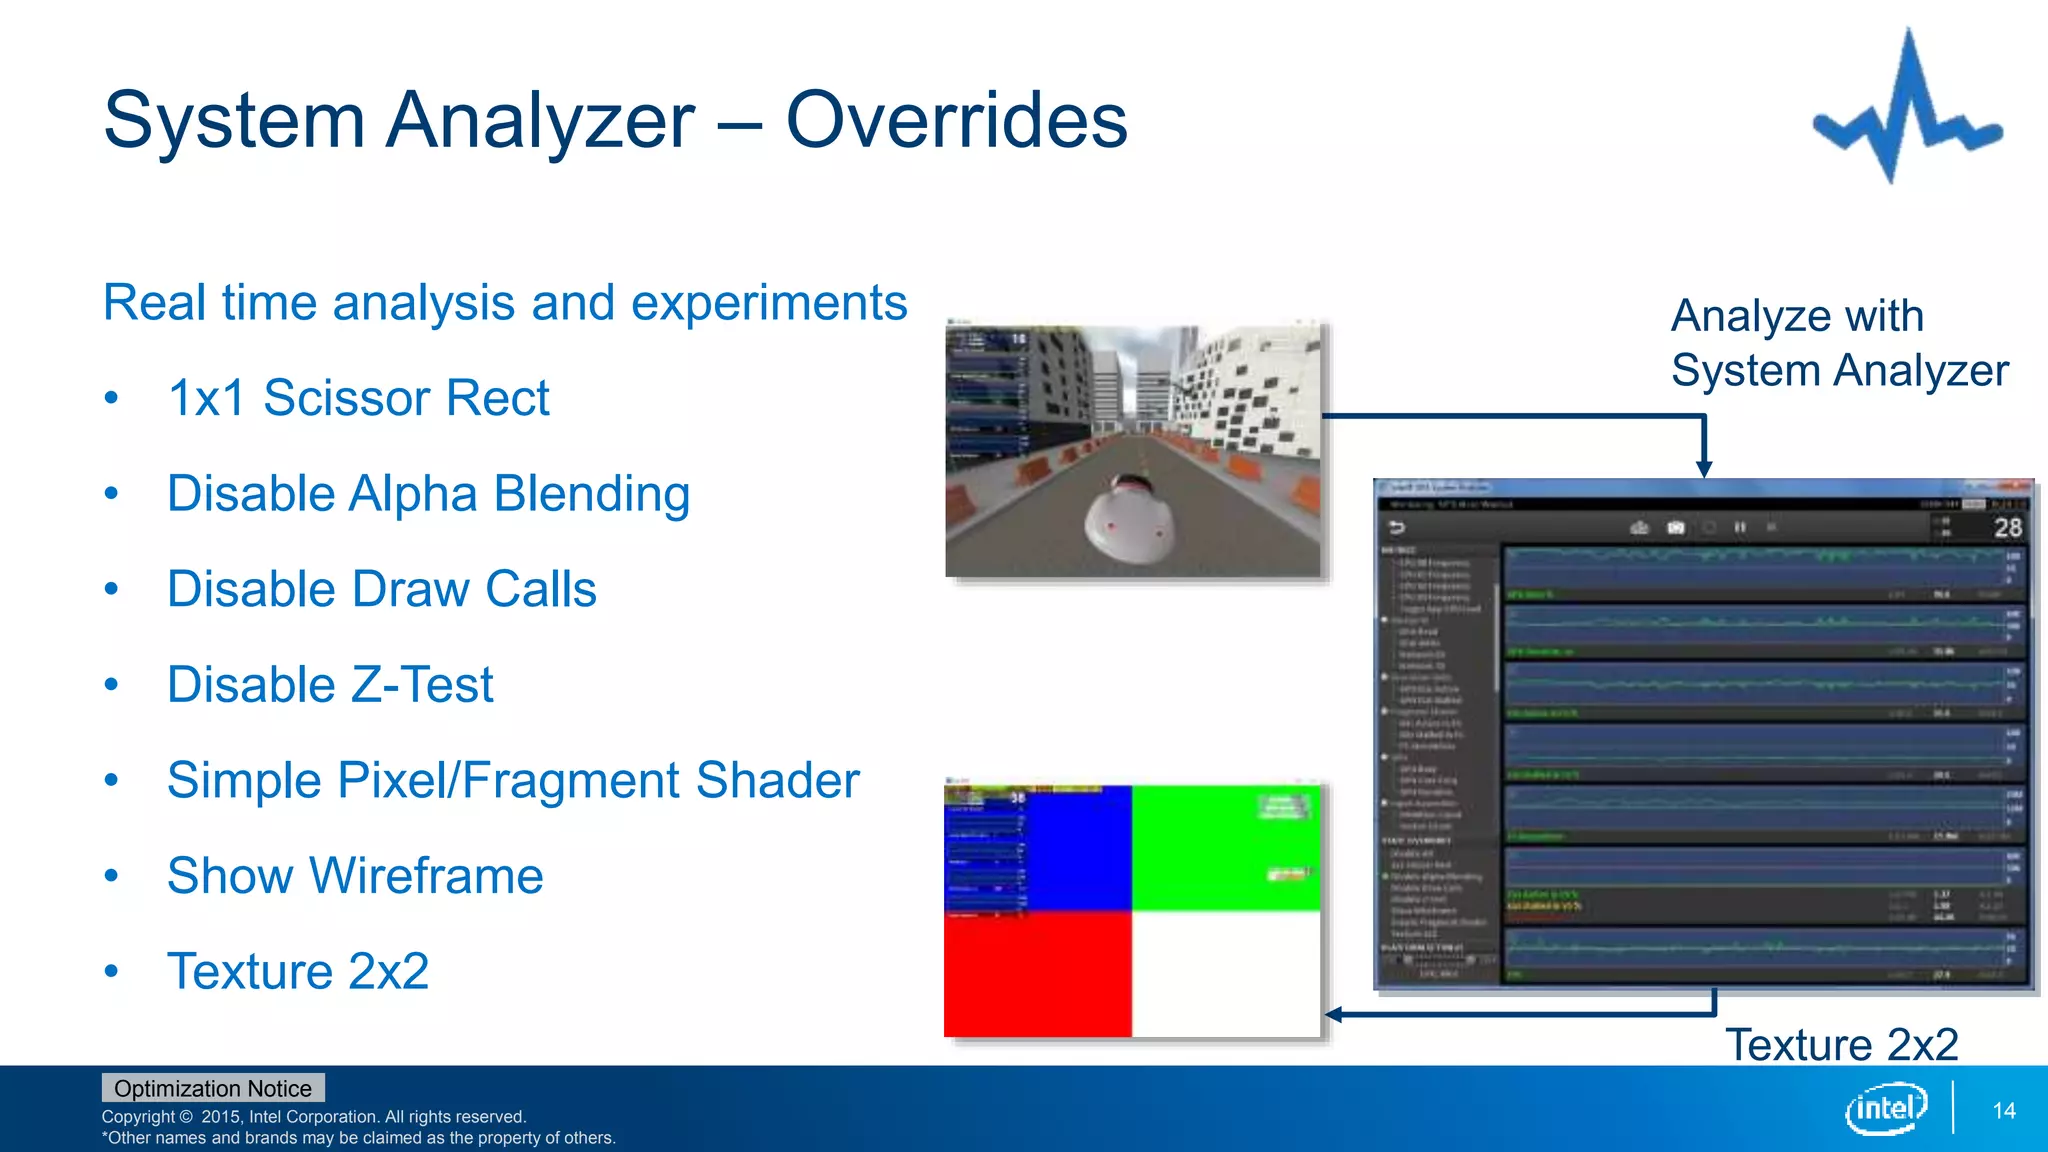
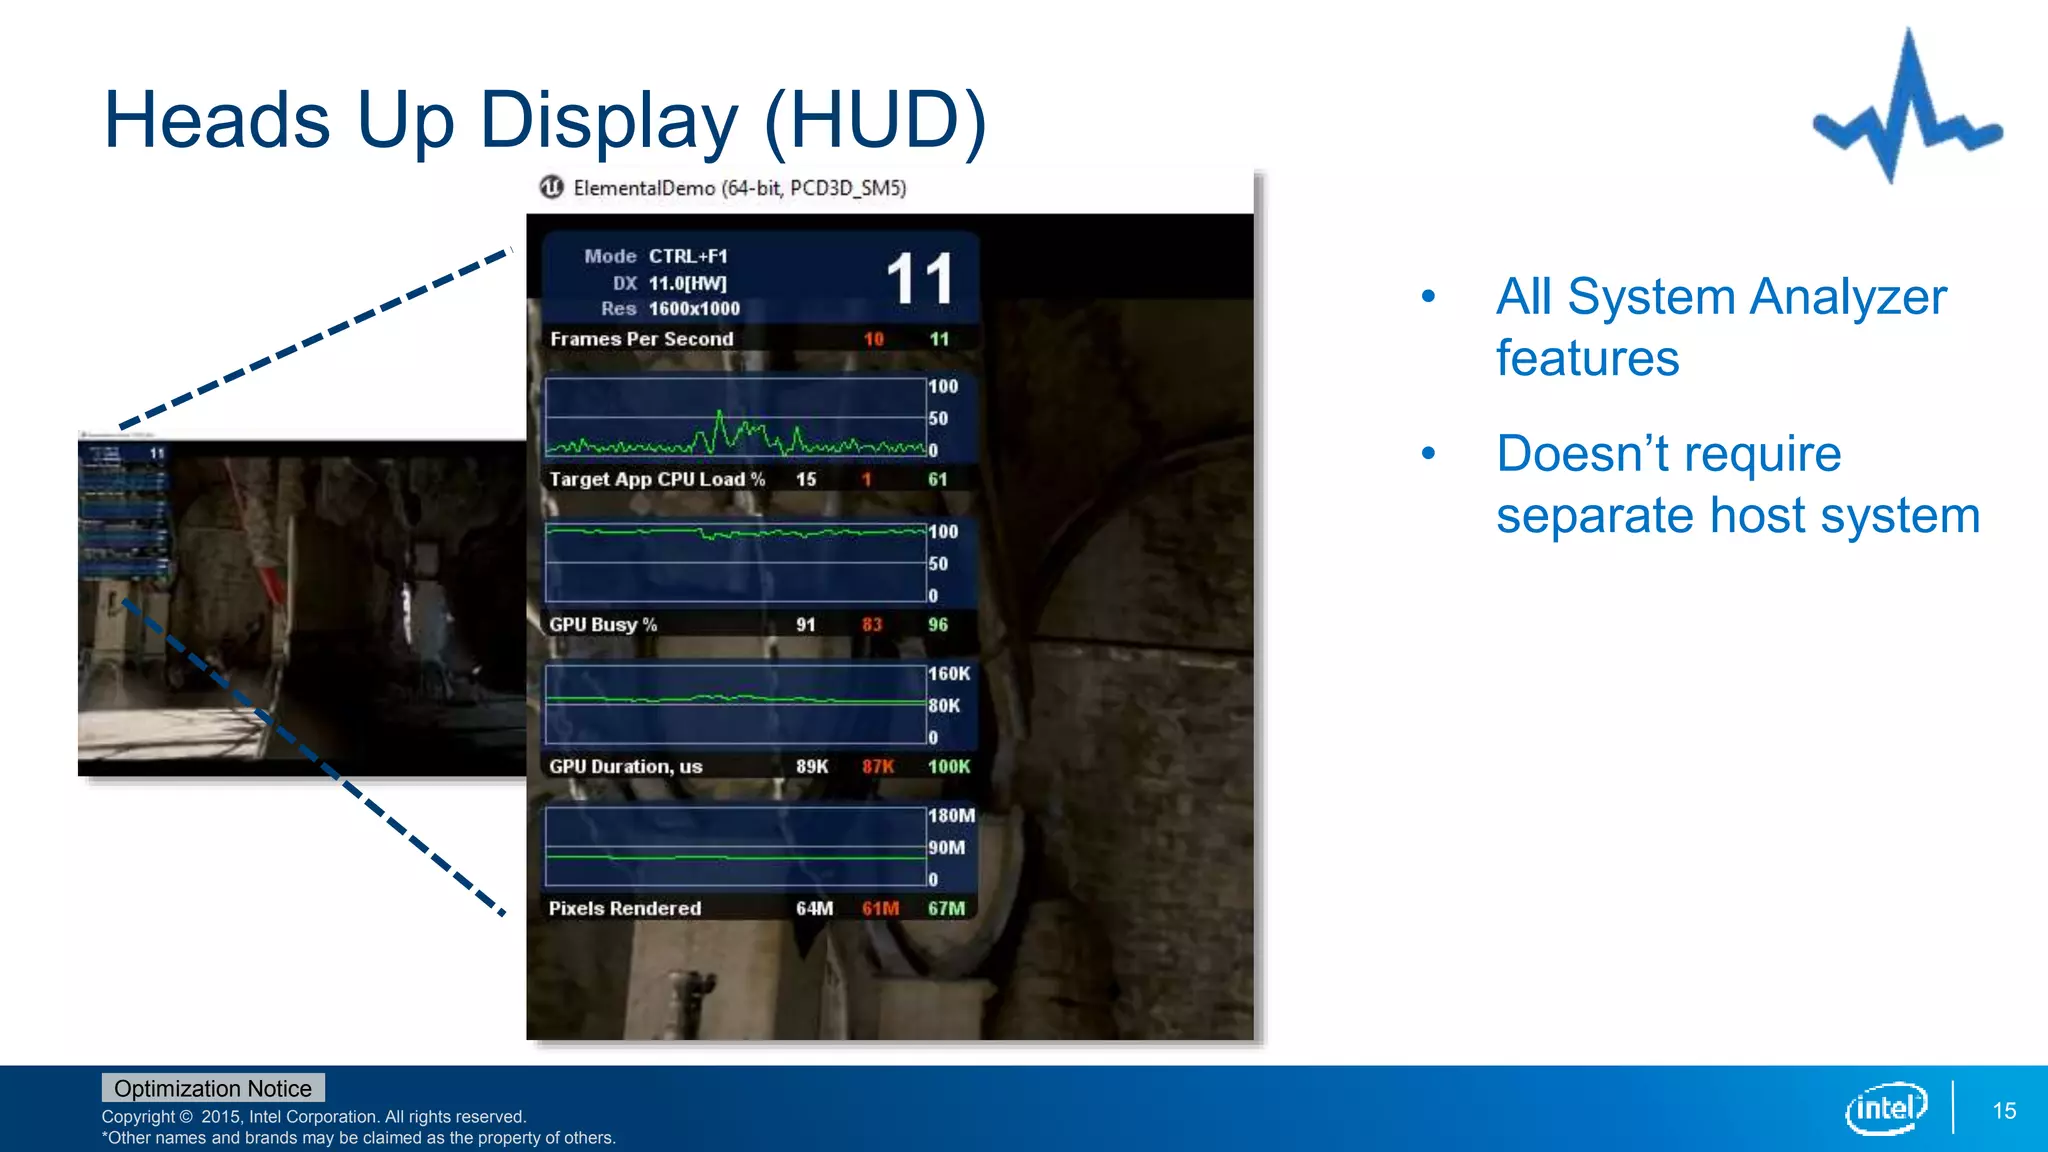
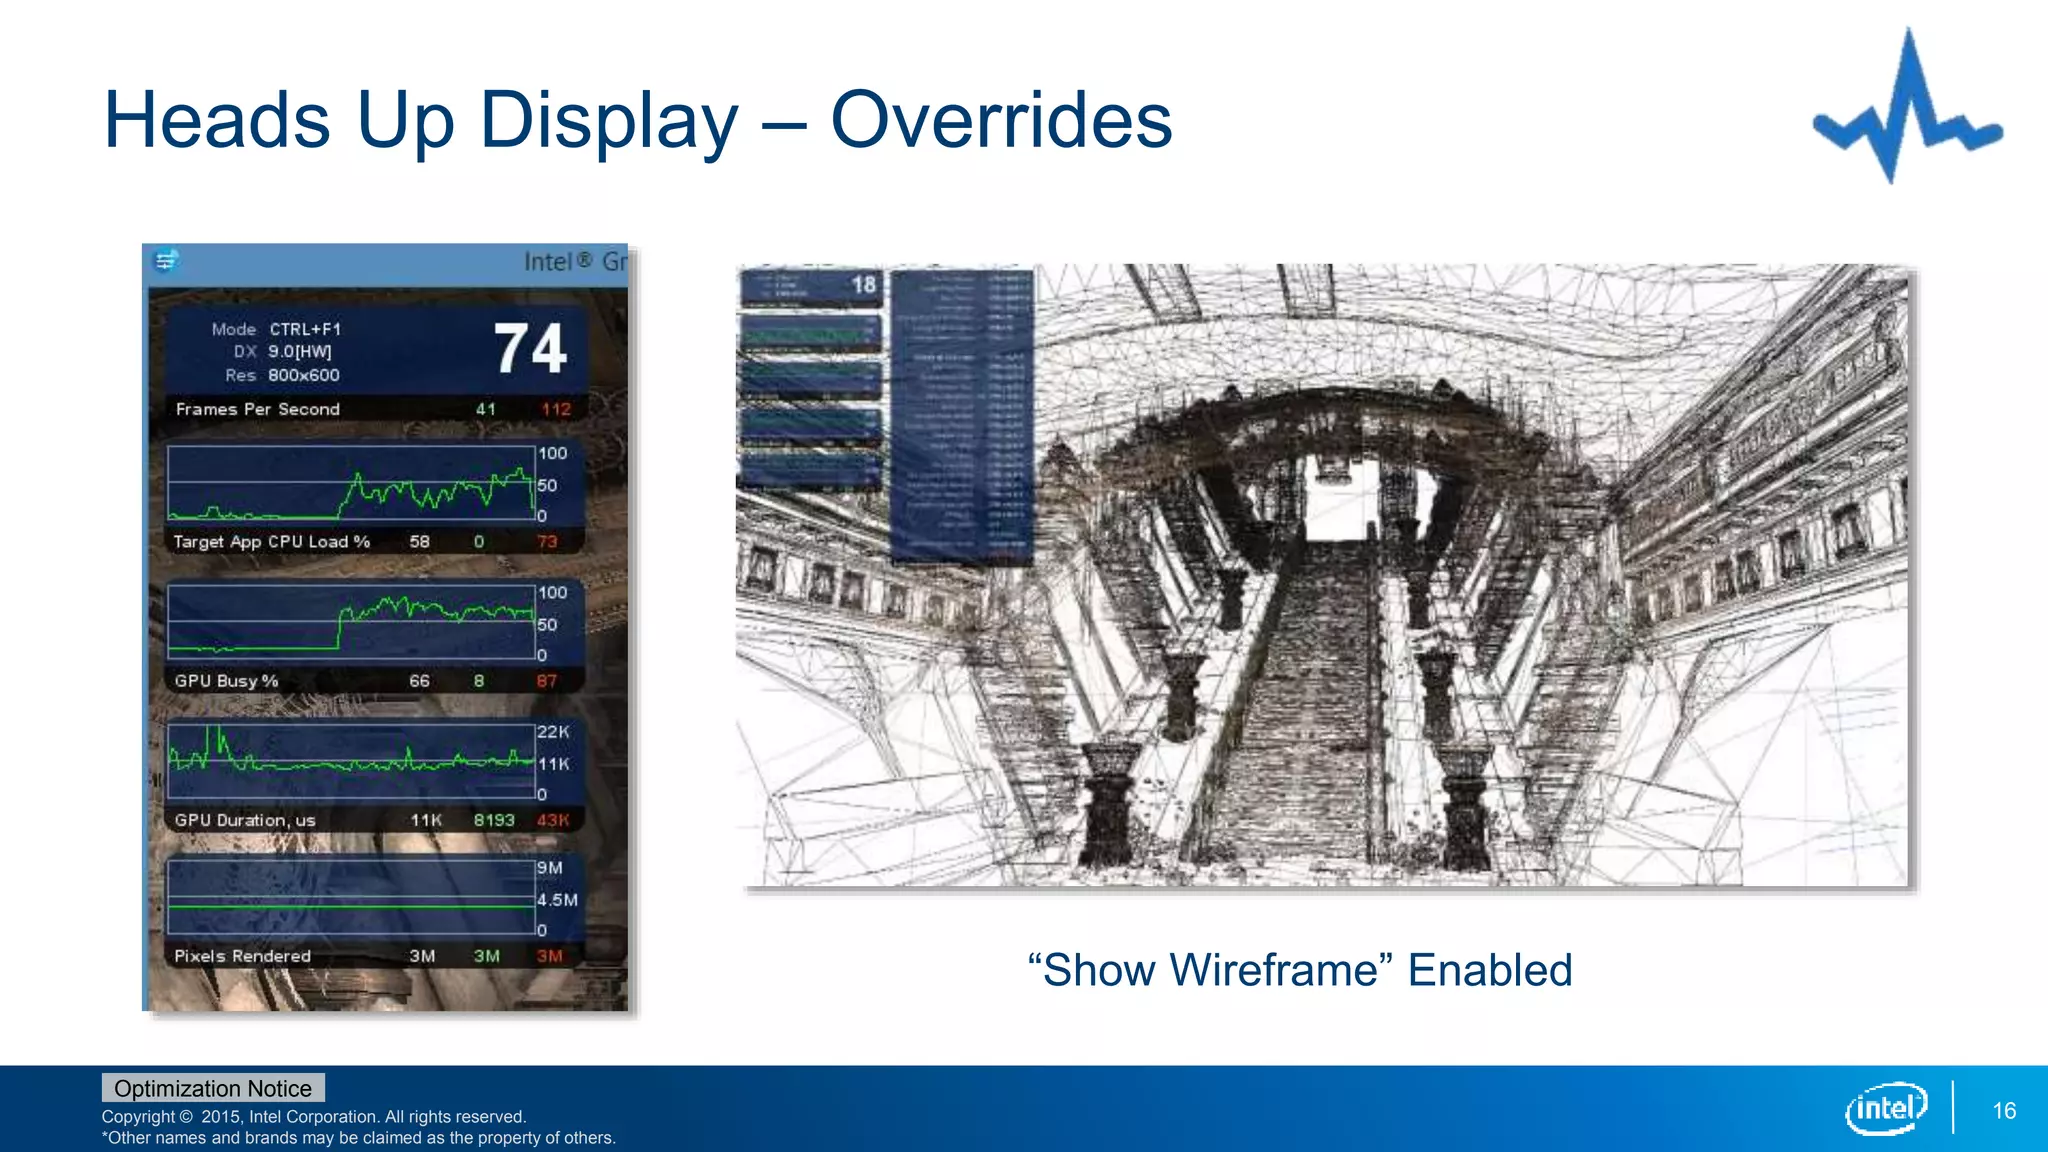
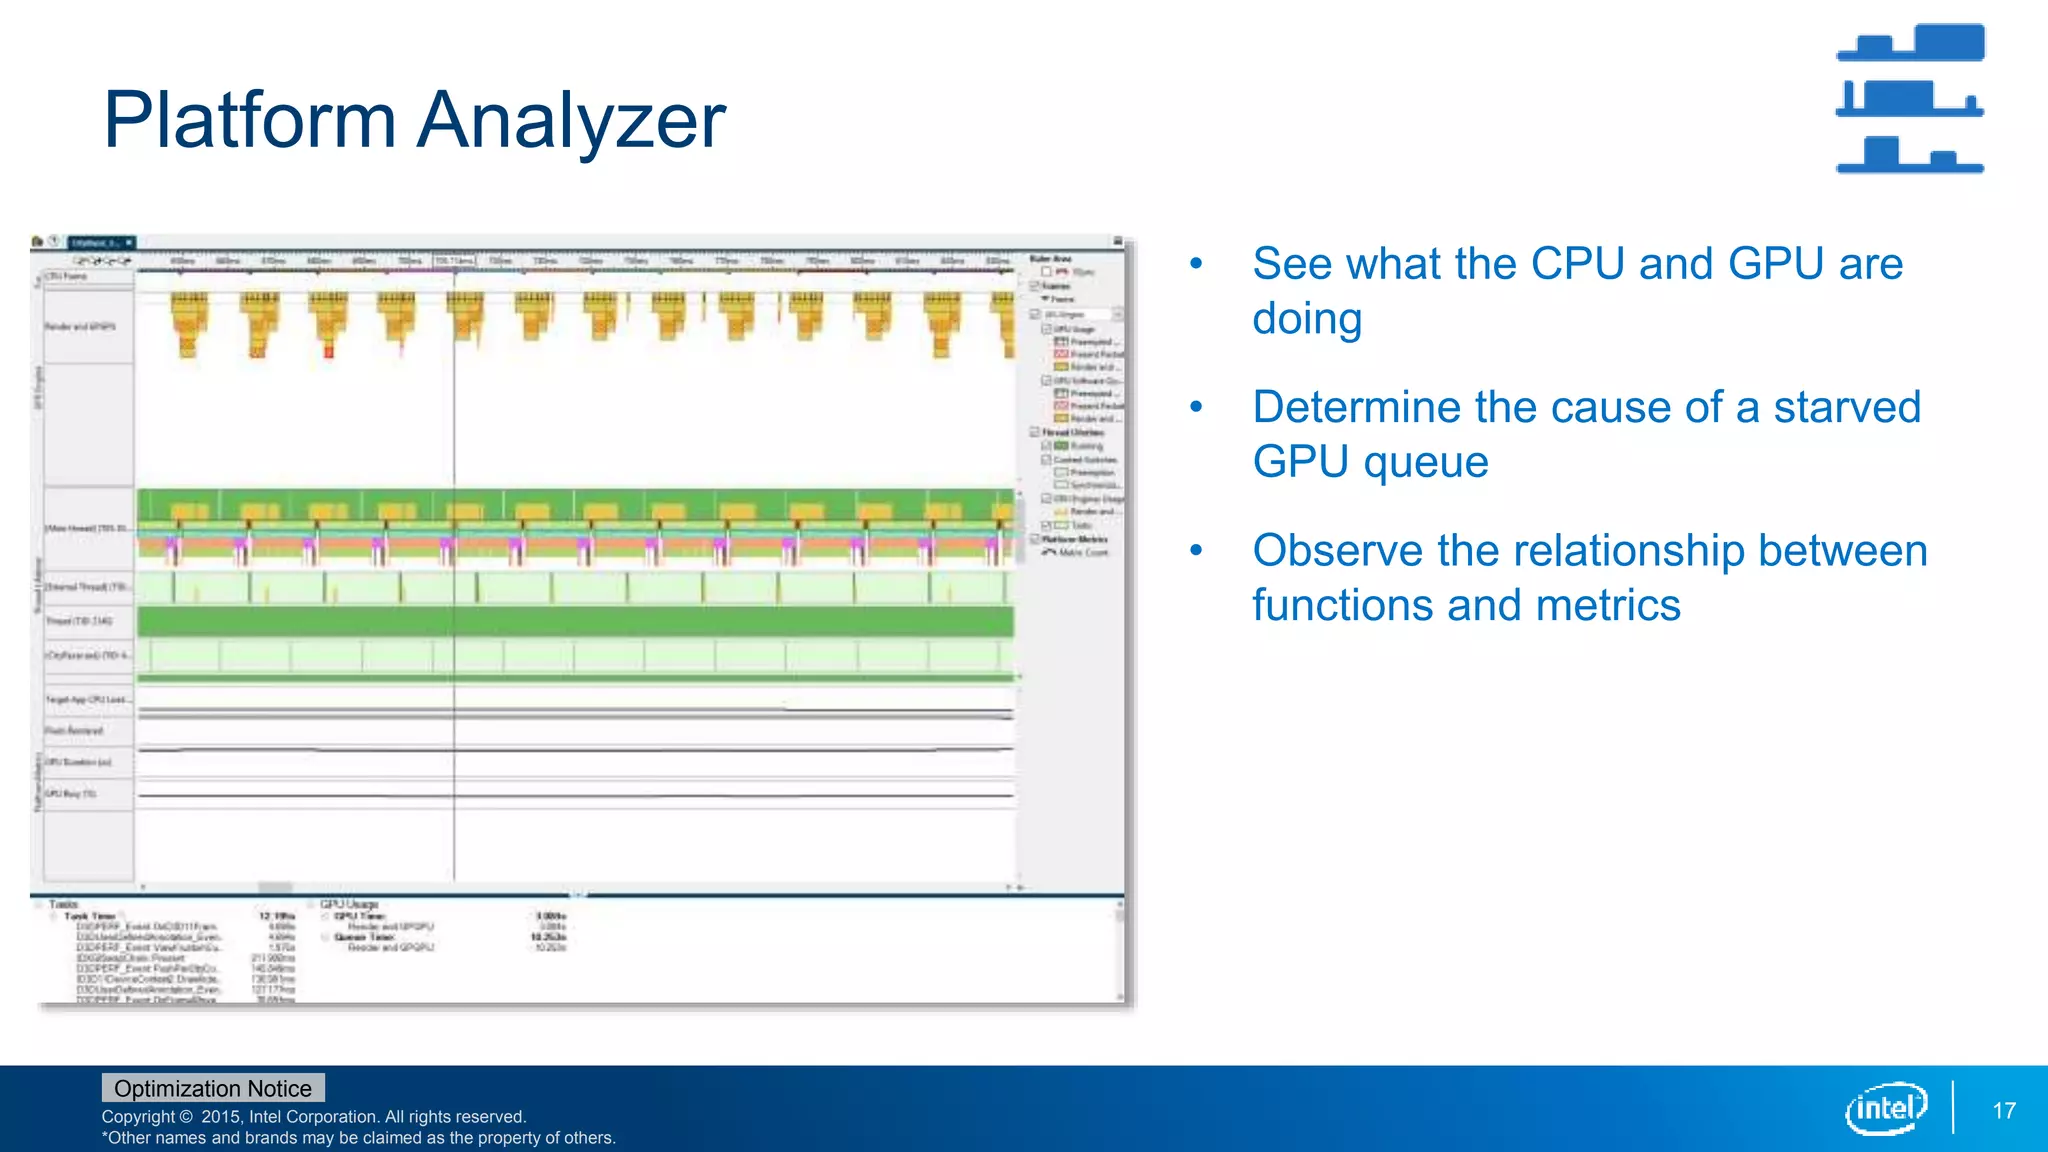
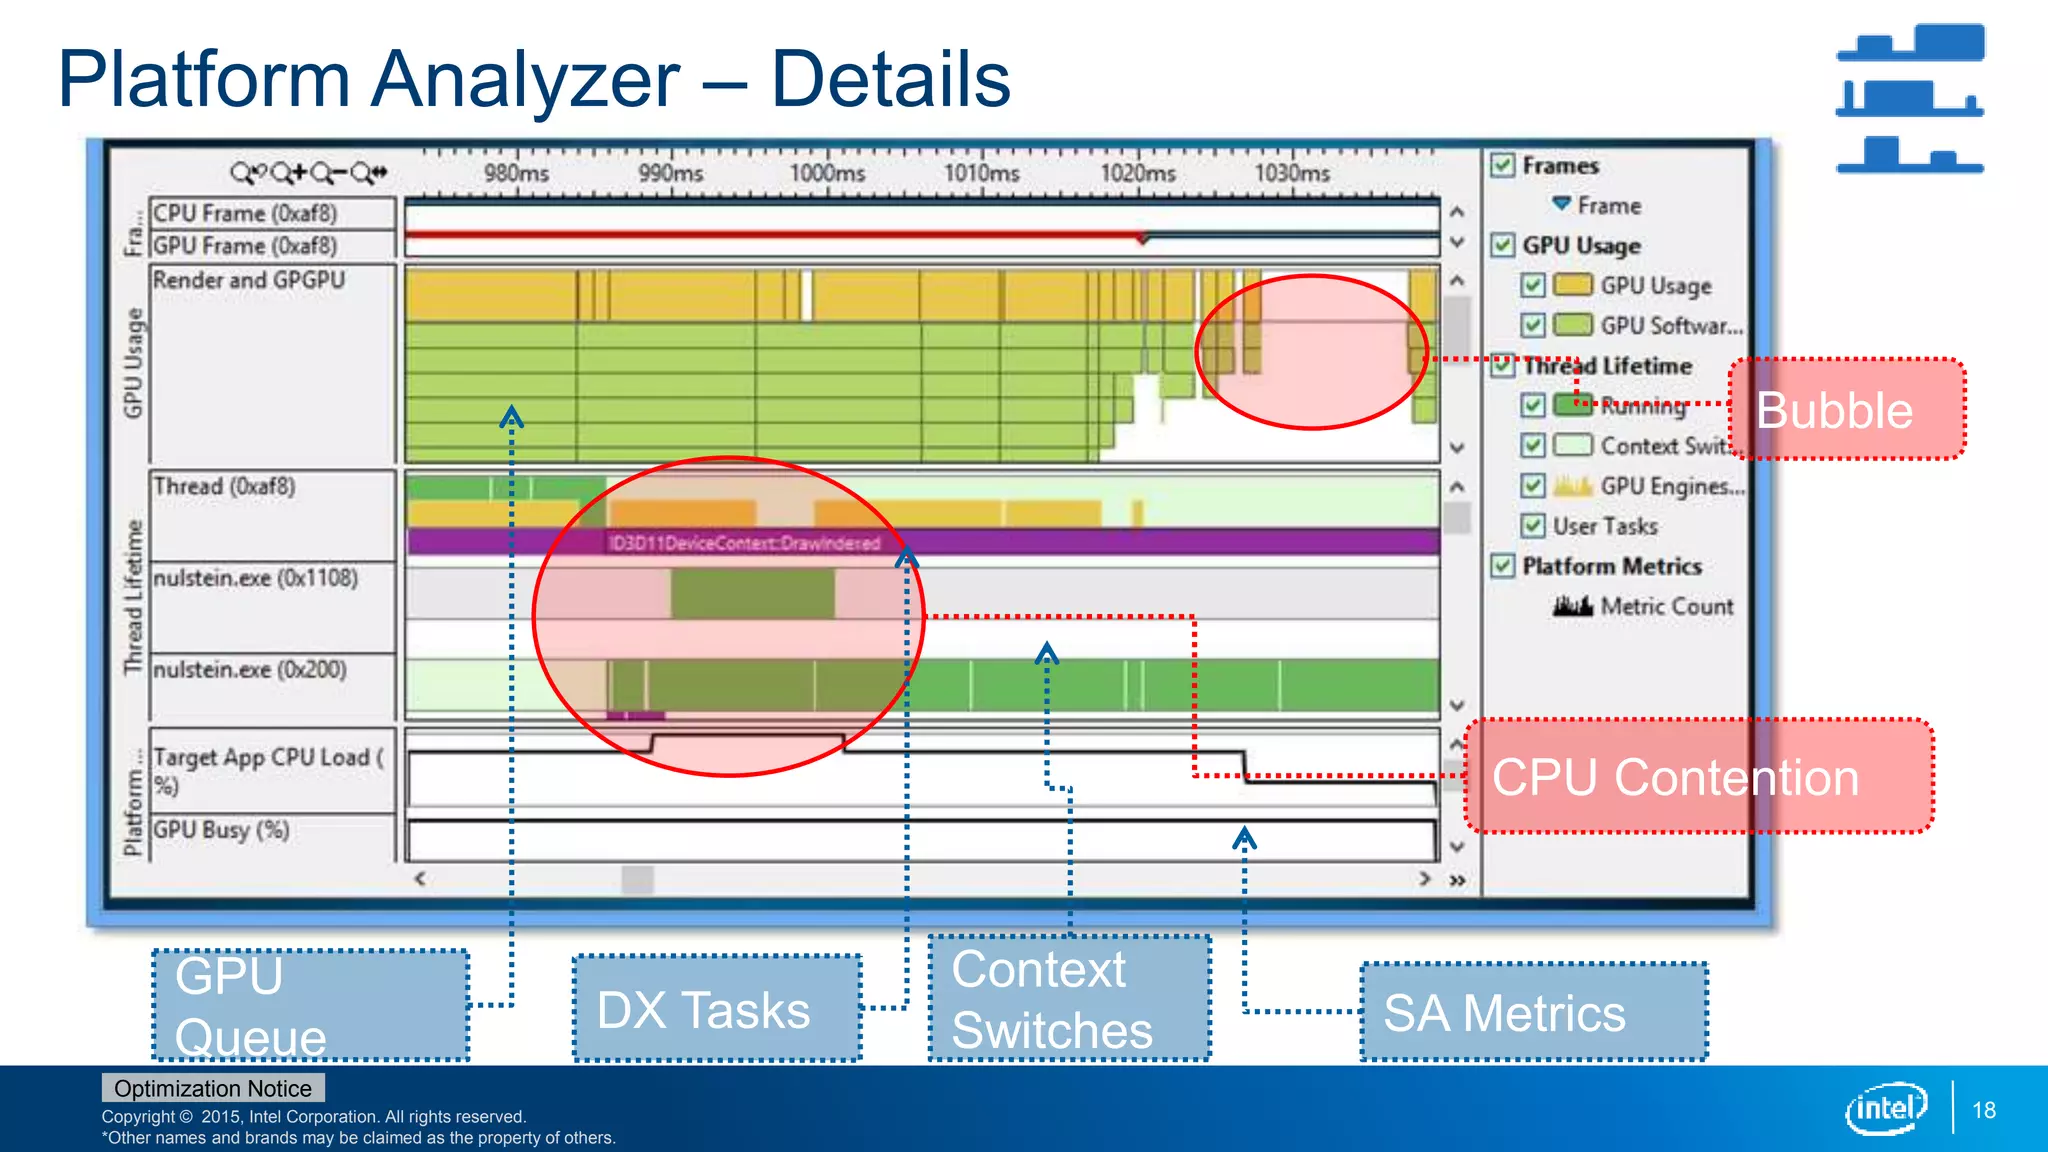
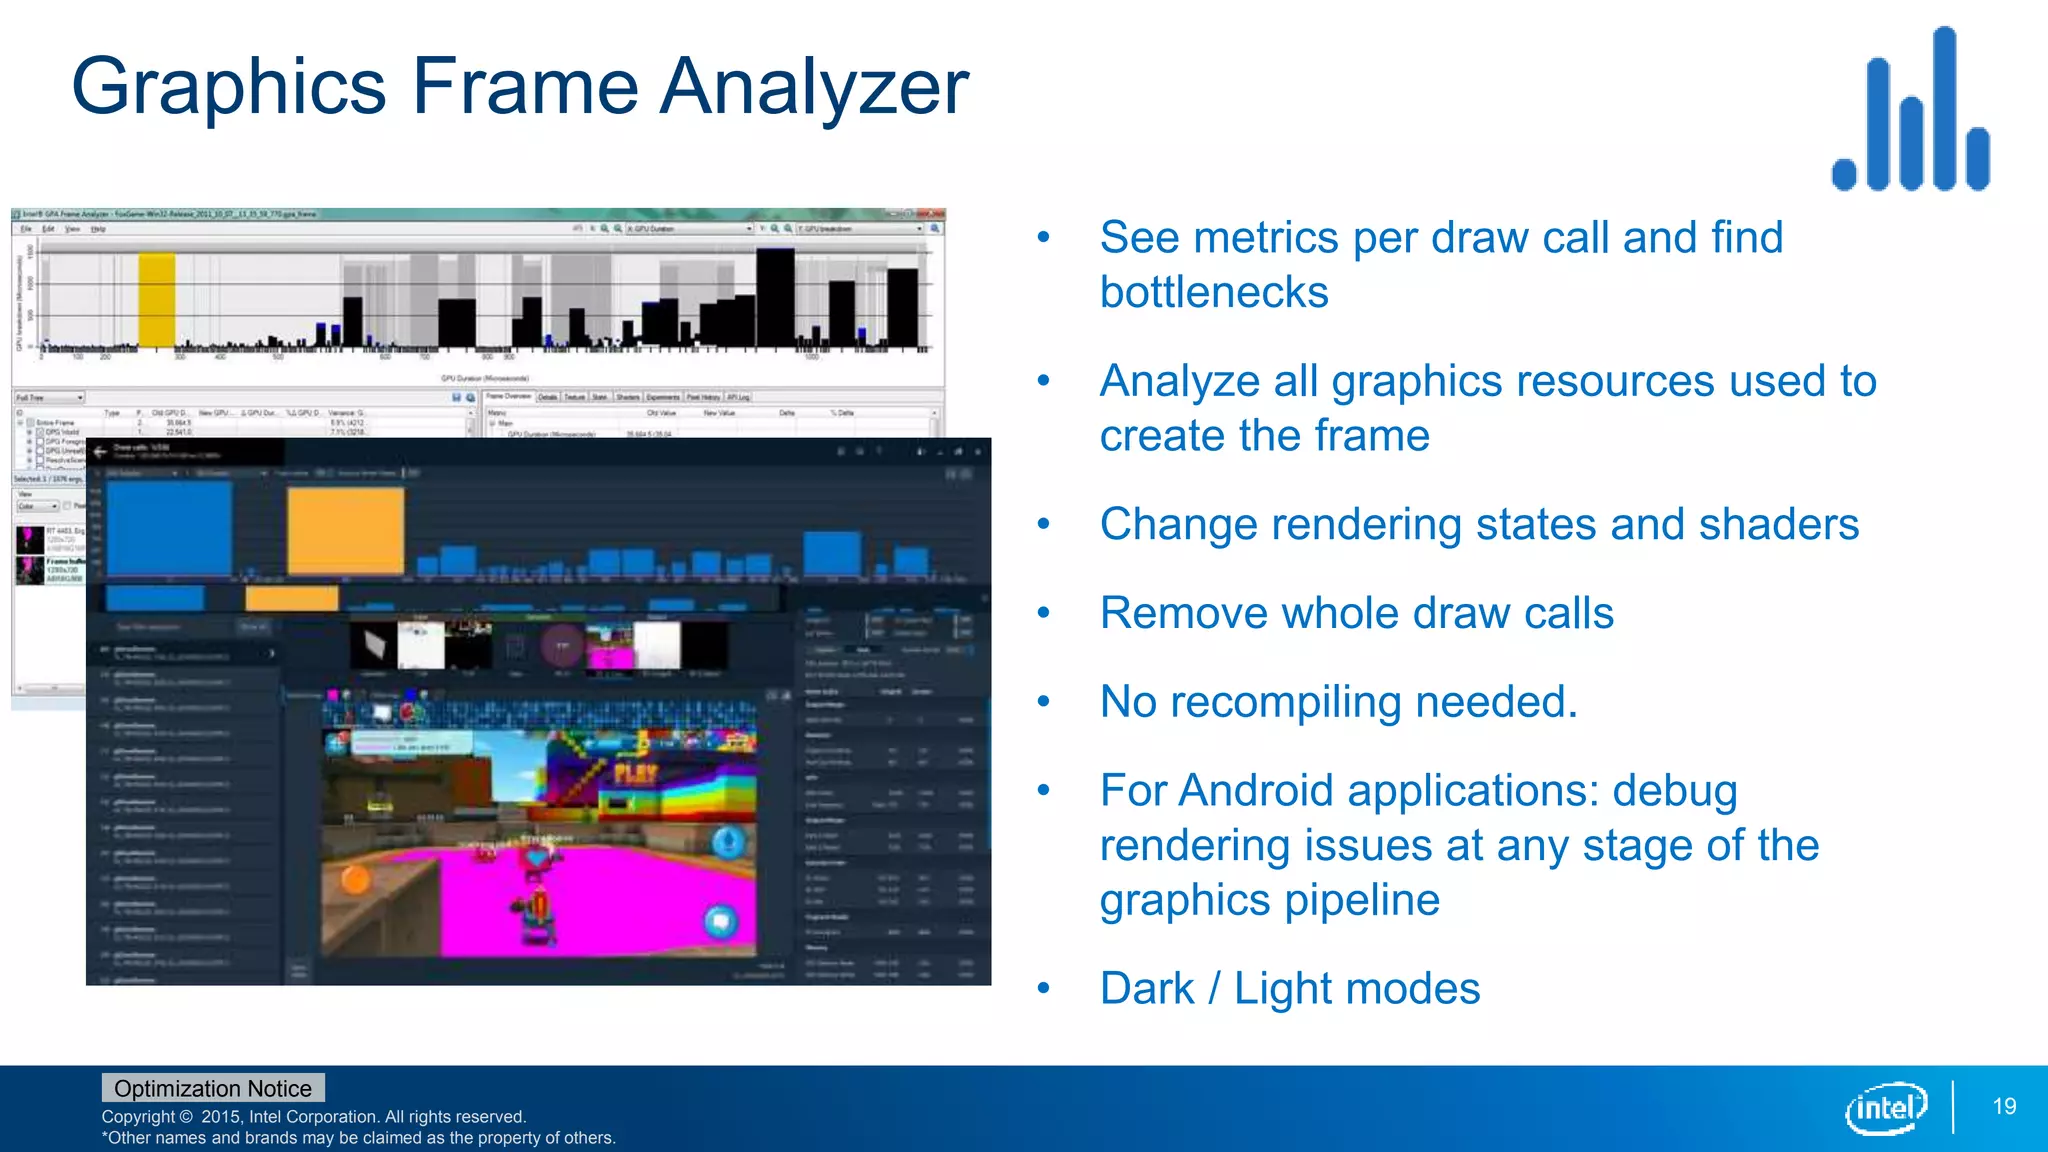
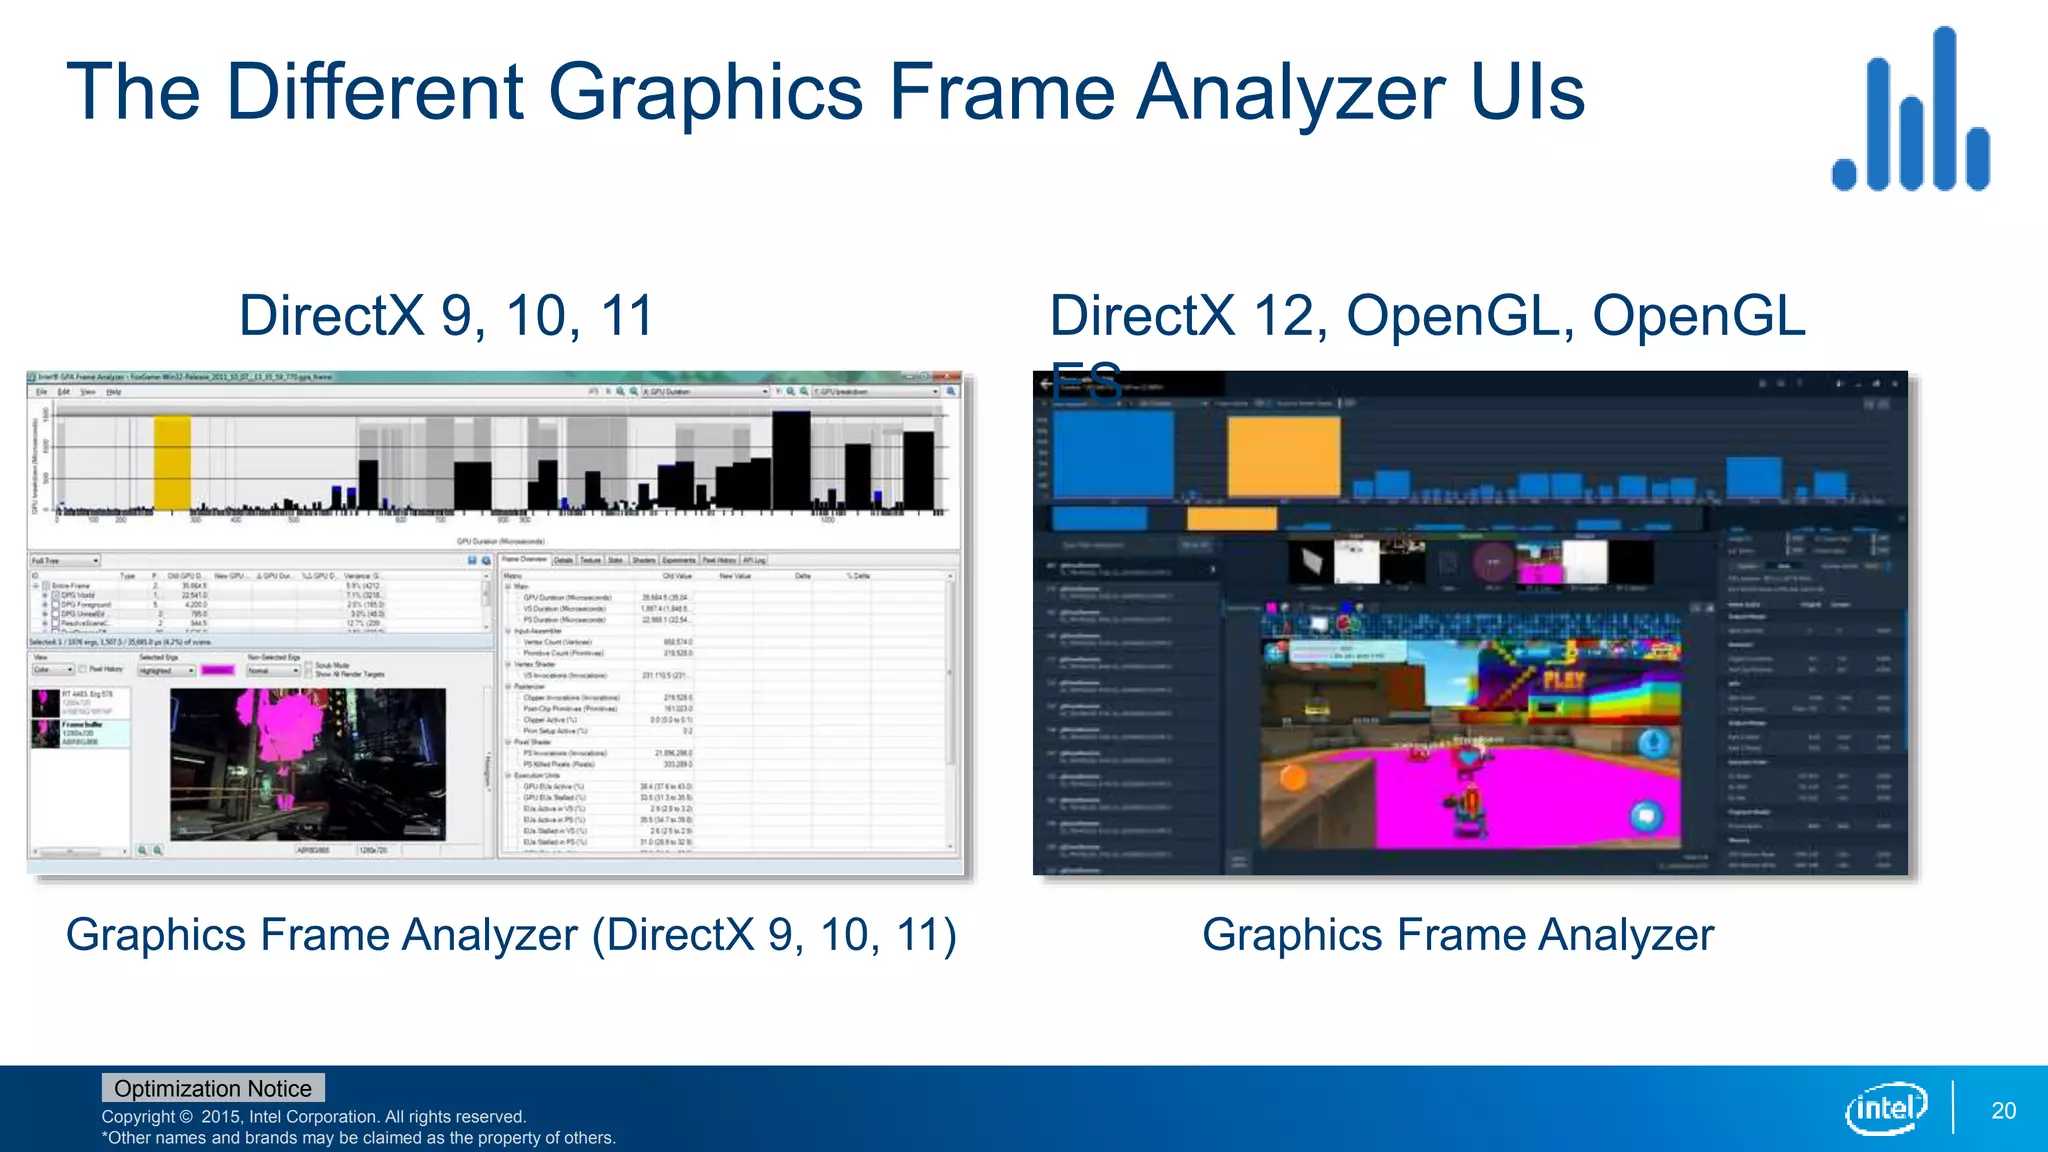
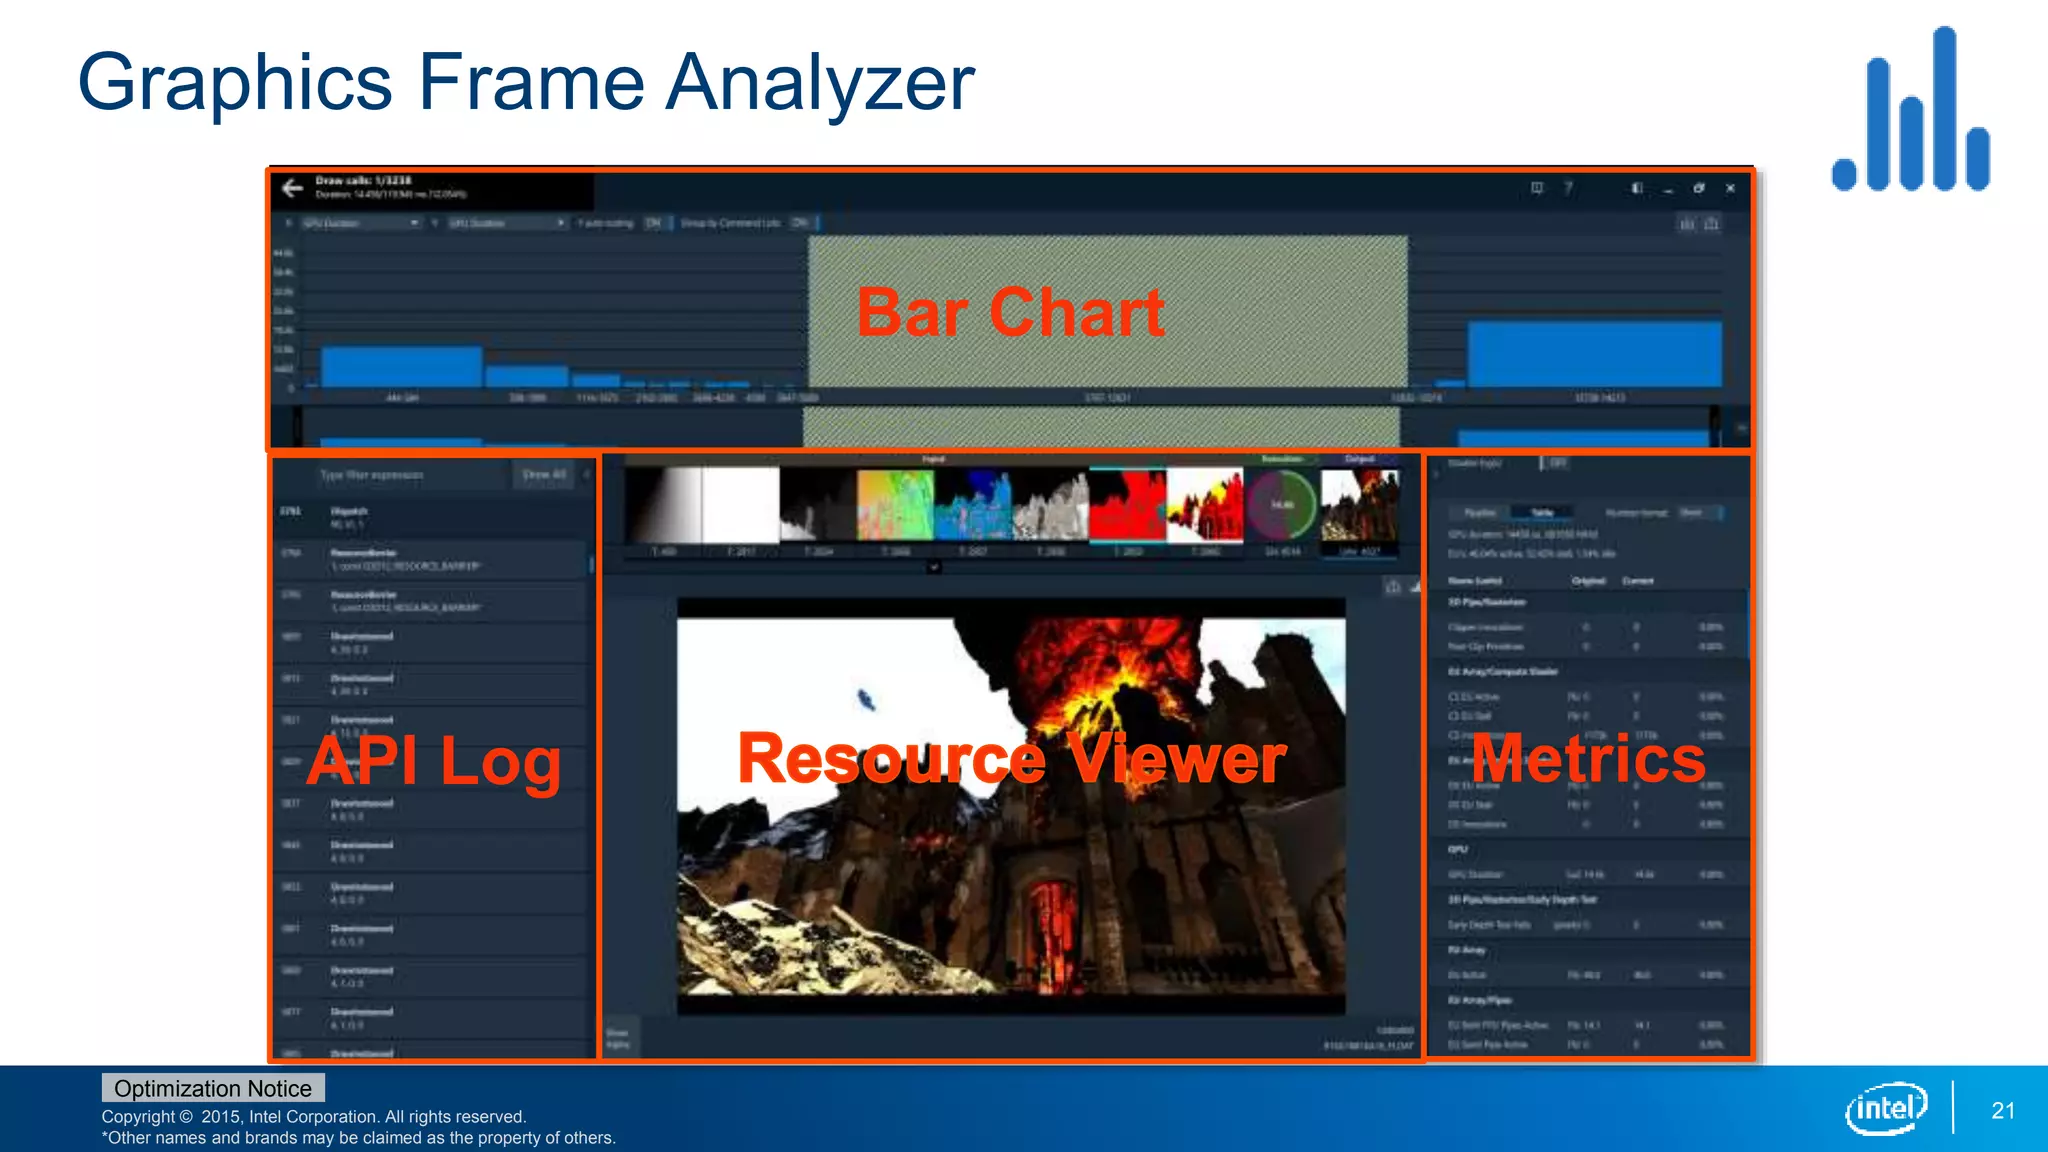
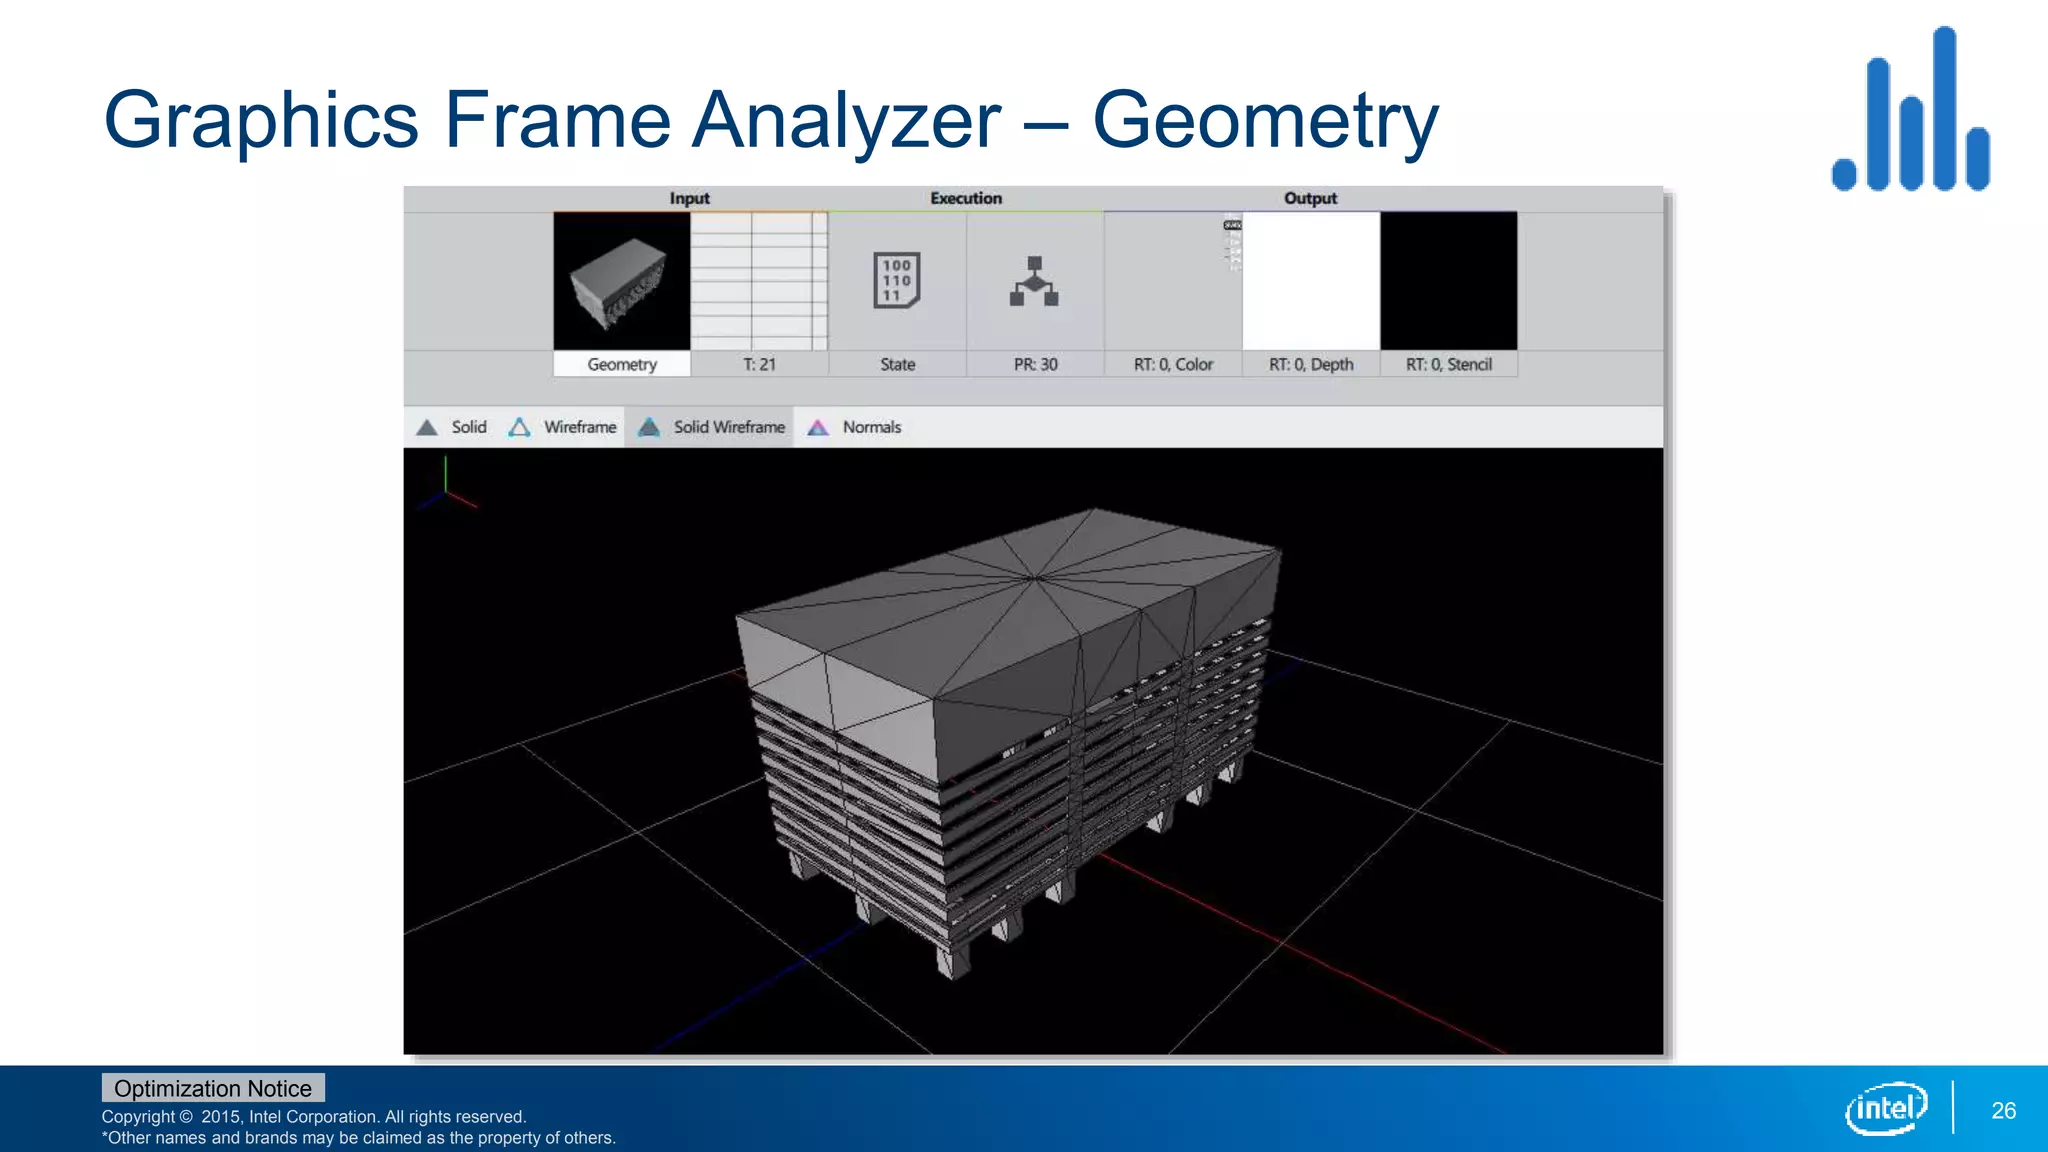
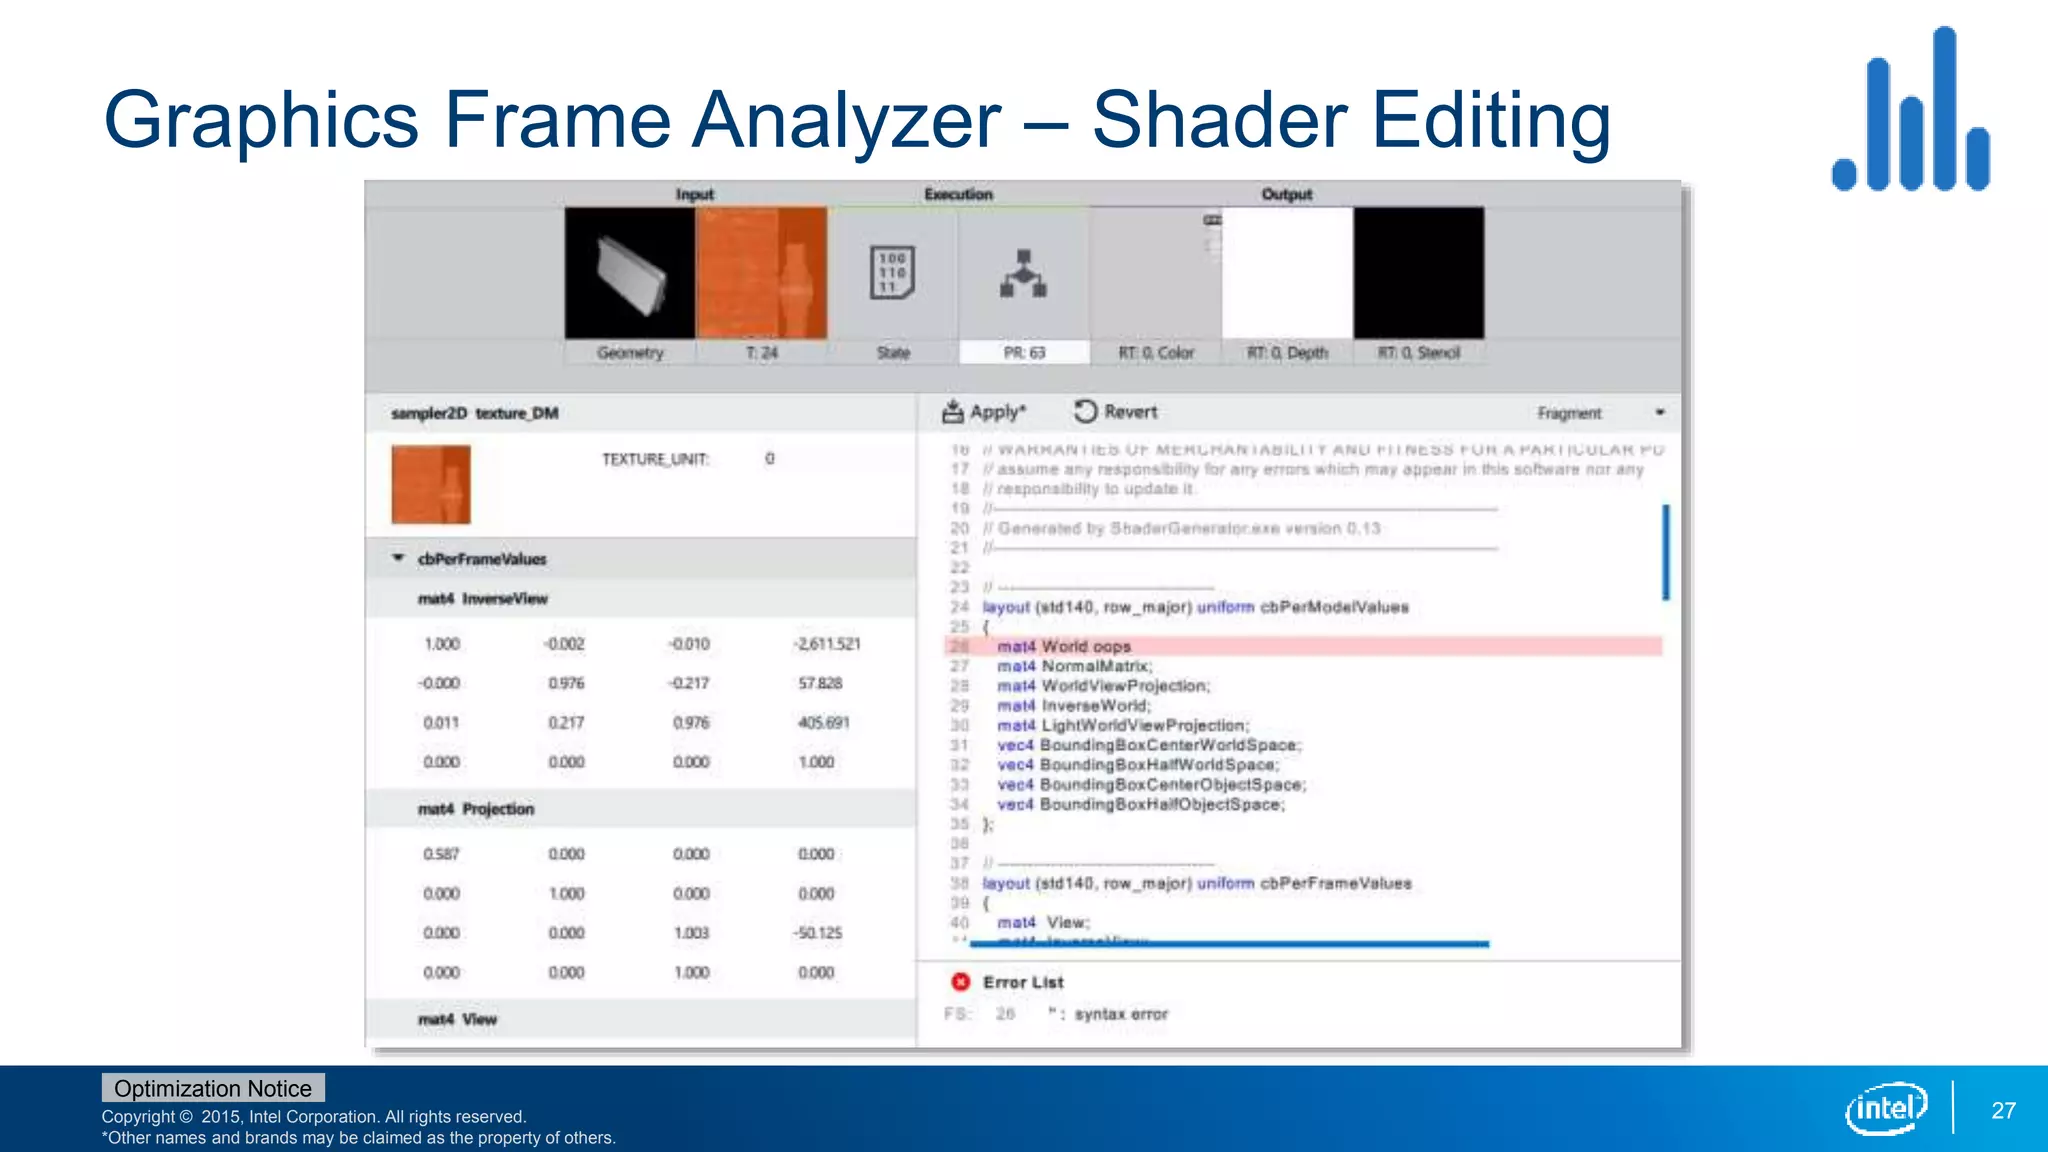
Seth Schneider, GPA Product Owner
June 2016
PC Windows* Mobile (Windows, Android*)
Copyright © 2015, Intel Corporation. All rights reserved.
*Other names and brands may be claimed as the property of others.
Optimization Notice
3
Intel® GPA - Optimize Your Graphics Applications!
High–End
GPU
Mainstream
Graphics
10fps
5fps
60+
fps
5fps
30 fps
30+
fps
Intel® Graphics
Performance
Analyzers
Copyright © 2015, Intel Corporation. All rights reserved.
*Other names and brands may be claimed as the property of others.
Optimization Notice
4
Host/Target Architecture
Host System Target System
Copyright © 2015, Intel Corporation. All rights reserved.
*Other names and brands may be claimed as the property of others.
Optimization Notice
Host OS
 Win 7, Win 8.1, Win 10
(64-bit)
DirectX
 DX 9, 9EX, 10.x, 11.0,
11.1, 12
Target Hardware
 Intel, NVidia* & AMD*
GPUs
 Windows x86 Tablets
5
Optimize Windows*, Android*, and Ubuntu* games!
Windows
Gaming
Android
Gaming
Host OS
 Windows, Ubuntu, Mac*
OSX
OpenGL ES
 1.x, 2.x, 3.x
Target Hardware
 Intel® Atom™, ARM
Android OS
 4.x, 5.x, 6.x
Ubuntu
Gaming
Host OS
 Ubuntu 14.04, 15.04
OpenGL
 3.2, 3.3, 4.0, 4.1 (Core
Profile)
Target Hardware
 Intel® HD Graphics 4k-
6k
Target OS
 Ubuntu 14.04, 15.04
Copyright © 2015, Intel Corporation. All rights reserved.
*Other names and brands may be claimed as the property of others.
Optimization Notice
6
What’s inside Intel® GPA?
System Analyzer / HUD
Graphics Frame
Analyzer
Platform Analyzer
In-game analysis
Single frame analysis
Timeline analysis
Graphics Monitor
Launch & config tool
Copyright © 2015, Intel Corporation. All rights reserved.
*Other names and brands may be claimed as the property of others.
Optimization Notice
7
How to use GPA?
HUD / System Analyzer:
Frame Analyzer:
Platform Analyzer:
CPU Limited
GPU Limited
Capture Frame
Capture Trace
?Run with
Intel®
GPA
In-Game Analysis Offline Analysis
Copyright © 2015, Intel Corporation. All rights reserved.
*Other names and brands may be claimed as the property of others.
Optimization Notice
8
How to get started?
Download for FREE at https://software.intel.com/gpa/
• No Code Changes Needed
• No Root Required*
• No Mobile App Installation
• ADB interface
* For platform analysis or debug enabled application
• No Code Changes Needed
• No Environment Changes
• No IDE Necessary
• Dual or Single System Analysis
System Analyzer, Graphics Frame Analyzer, Platform Analyzer
Copyright © 2015, Intel Corporation. All rights reserved.
*Other names and brands may be claimed as the property of others.
Optimization Notice
Graphics Monitor
10
• Launch point for Windows DirectX
Apps
• Set HUD metrics
• Set capture triggers
• View Logs and System Info
Copyright © 2015, Intel Corporation. All rights reserved.
*Other names and brands may be claimed as the property of others.
Optimization Notice
Enabling DirectX 12 Analysis
11
• Select DirectX12 in the Active API
dropdown menu in either the
Preferences section or in Analyze
Application
Copyright © 2015, Intel Corporation. All rights reserved.
*Other names and brands may be claimed as the property of others.
Optimization Notice
System Analyzer
12
• Launch point for mobile apps
• View metrics while game is running
• Enable graphics experiments without
changing your code
• Identify CPU or GPU bottleneck using
just 2 metrics
• Capture frames and traces for more
detailed analysis
Copyright © 2015, Intel Corporation. All rights reserved.
*Other names and brands may be claimed as the property of others.
Optimization Notice
System Analyzer – Real Time Metrics
13
• CPU Metrics
• GPU Metrics
• Memory Metrics
• Power Metrics
• Graphics API Metrics
• Other Platform Metrics
*Metric availability depends on
platform
Copyright © 2015, Intel Corporation. All rights reserved.
*Other names and brands may be claimed as the property of others.
Optimization Notice
System Analyzer – Overrides
14
Real time analysis and experiments
• 1x1 Scissor Rect
• Disable Alpha Blending
• Disable Draw Calls
• Disable Z-Test
• Simple Pixel/Fragment Shader
• Show Wireframe
• Texture 2x2
Analyze with
System Analyzer
Texture 2x2
Copyright © 2015, Intel Corporation. All rights reserved.
*Other names and brands may be claimed as the property of others.
Optimization Notice
Heads Up Display (HUD)
15
• All System Analyzer
features
• Doesn’t require
separate host system
Copyright © 2015, Intel Corporation. All rights reserved.
*Other names and brands may be claimed as the property of others.
Optimization Notice
Heads Up Display – Overrides
16
“Show Wireframe” Enabled
Copyright © 2015, Intel Corporation. All rights reserved.
*Other names and brands may be claimed as the property of others.
Optimization Notice
Platform Analyzer
17
• See what the CPU and GPU are
doing
• Determine the cause of a starved
GPU queue
• Observe the relationship between
functions and metrics
Copyright © 2015, Intel Corporation. All rights reserved.
*Other names and brands may be claimed as the property of others.
Optimization Notice
Platform Analyzer – Details
18
Bubble
CPU Contention
GPU
Queue
DX Tasks SA Metrics
Context
Switches
Copyright © 2015, Intel Corporation. All rights reserved.
*Other names and brands may be claimed as the property of others.
Optimization Notice
Graphics Frame Analyzer
19
• See metrics per draw call and find
bottlenecks
• Analyze all graphics resources used to
create the frame
• Change rendering states and shaders
• Remove whole draw calls
• No recompiling needed.
• For Android applications: debug
rendering issues at any stage of the
graphics pipeline
• Dark / Light modes
Copyright © 2015, Intel Corporation. All rights reserved.
*Other names and brands may be claimed as the property of others.
Optimization Notice
20
The Different Graphics Frame Analyzer UIs
DirectX 9, 10, 11 DirectX 12, OpenGL, OpenGL
ES
Graphics Frame Analyzer (DirectX 9, 10, 11) Graphics Frame Analyzer
Copyright © 2015, Intel Corporation. All rights reserved.
*Other names and brands may be claimed as the property of others.
Optimization Notice
Graphics Frame Analyzer
21
Bar Chart
API Log Metrics
Copyright © 2015, Intel Corporation. All rights reserved.
*Other names and brands may be claimed as the property of others.
Optimization Notice
Graphics Frame Analyzer – Ergs and Metrics
22
• Identify performance
bottlenecks with the
erg graph
• Select individual ergs
for further
investigation
Copyright © 2015, Intel Corporation. All rights reserved.
*Other names and brands may be claimed as the property of others.
Optimization Notice
Graphics Frame Analyzer– Experiments
23
• Immediately see performance deltas
• 2x2 Textures
• 1x1 Scissor Rect
• Simple Pixel Shader
• Disable Erg(s)
Copyright © 2015, Intel Corporation. All rights reserved.
*Other names and brands may be claimed as the property of others.
Optimization Notice
Graphics Frame Analyzer – Resource Viewer
24
Copyright © 2015, Intel Corporation. All rights reserved.
*Other names and brands may be claimed as the property of others.
Optimization Notice
Graphics Frame Analyzer – Resource History
25
• Green Sub-Bars indicate an erg is
using the selected execution
resource
• Purple sub-bars indicate an erg is writing to
the selected resource. (output)
• Orange sub-bars indicate an erg is reading
from the selected resource. (input)
Copyright © 2015, Intel Corporation. All rights reserved.
*Other names and brands may be claimed as the property of others.
Optimization Notice
Graphics Frame Analyzer – Geometry
26
Copyright © 2015, Intel Corporation. All rights reserved.
*Other names and brands may be claimed as the property of others.
Optimization Notice
Graphics Frame Analyzer – Shader Editing
27
FREE download at: https://software.intel.com/gpa
28
30
Copyright © 2015, Intel Corporation. All rights reserved.
*Other names and brands may be claimed as the property of others.
Optimization Notice
Intel Confidential 31
Intel® GPA Release Notes
https://software.intel.com/en-us/articles/intel-gpa-release-notes
Copyright © 2015, Intel Corporation. All rights reserved.
*Other names and brands may be claimed as the property of others.
Optimization Notice
Legal Disclaimer & Optimization Notice
INFORMATION IN THIS DOCUMENT IS PROVIDED “AS IS”. NO LICENSE, EXPRESS OR IMPLIED, BY ESTOPPEL OR
OTHERWISE, TO ANY INTELLECTUAL PROPERTY RIGHTS IS GRANTED BY THIS DOCUMENT. INTEL ASSUMES NO
LIABILITY WHATSOEVER AND INTEL DISCLAIMS ANY EXPRESS OR IMPLIED WARRANTY, RELATING TO THIS
INFORMATION INCLUDING LIABILITY OR WARRANTIES RELATING TO FITNESS FOR A PARTICULAR PURPOSE,
MERCHANTABILITY, OR INFRINGEMENT OF ANY PATENT, COPYRIGHT OR OTHER INTELLECTUAL PROPERTY RIGHT.
Software and workloads used in performance tests may have been optimized for performance only on Intel microprocessors.
Performance tests, such as SYSmark and MobileMark, are measured using specific computer systems, components, software,
operations and functions. Any change to any of those factors may cause the results to vary. You should consult other information
and performance tests to assist you in fully evaluating your contemplated purchases, including the performance of that product when
combined with other products.
Copyright © 2014, Intel Corporation. All rights reserved. Intel, Pentium, Xeon, Xeon Phi, Core, VTune, Cilk, and the Intel logo are
trademarks of Intel Corporation in the U.S. and other countries.
Optimization Notice
Intel’s compilers may or may not optimize to the same degree for non-Intel microprocessors for optimizations that are not unique to Intel
microprocessors. These optimizations include SSE2, SSE3, and SSSE3 instruction sets and other optimizations. Intel does not guarantee the
availability, functionality, or effectiveness of any optimization on microprocessors not manufactured by Intel. Microprocessor-dependent
optimizations in this product are intended for use with Intel microprocessors. Certain optimizations not specific to Intel microarchitecture are
reserved for Intel microprocessors. Please refer to the applicable product User and Reference Guides for more information regarding the
specific instruction sets covered by this notice.
Notice revision #20110804
32Intel Confidential
Real-Time Game Optimization with Intel® GPA

Real-Time Game Optimization with Intel® GPA

  • 1.
    Seth Schneider, GPAProduct Owner June 2016
  • 2.
    PC Windows* Mobile(Windows, Android*)
  • 3.
    Copyright © 2015,Intel Corporation. All rights reserved. *Other names and brands may be claimed as the property of others. Optimization Notice 3 Intel® GPA - Optimize Your Graphics Applications! High–End GPU Mainstream Graphics 10fps 5fps 60+ fps 5fps 30 fps 30+ fps Intel® Graphics Performance Analyzers
  • 4.
    Copyright © 2015,Intel Corporation. All rights reserved. *Other names and brands may be claimed as the property of others. Optimization Notice 4 Host/Target Architecture Host System Target System
  • 5.
    Copyright © 2015,Intel Corporation. All rights reserved. *Other names and brands may be claimed as the property of others. Optimization Notice Host OS  Win 7, Win 8.1, Win 10 (64-bit) DirectX  DX 9, 9EX, 10.x, 11.0, 11.1, 12 Target Hardware  Intel, NVidia* & AMD* GPUs  Windows x86 Tablets 5 Optimize Windows*, Android*, and Ubuntu* games! Windows Gaming Android Gaming Host OS  Windows, Ubuntu, Mac* OSX OpenGL ES  1.x, 2.x, 3.x Target Hardware  Intel® Atom™, ARM Android OS  4.x, 5.x, 6.x Ubuntu Gaming Host OS  Ubuntu 14.04, 15.04 OpenGL  3.2, 3.3, 4.0, 4.1 (Core Profile) Target Hardware  Intel® HD Graphics 4k- 6k Target OS  Ubuntu 14.04, 15.04
  • 6.
    Copyright © 2015,Intel Corporation. All rights reserved. *Other names and brands may be claimed as the property of others. Optimization Notice 6 What’s inside Intel® GPA? System Analyzer / HUD Graphics Frame Analyzer Platform Analyzer In-game analysis Single frame analysis Timeline analysis Graphics Monitor Launch & config tool
  • 7.
    Copyright © 2015,Intel Corporation. All rights reserved. *Other names and brands may be claimed as the property of others. Optimization Notice 7 How to use GPA? HUD / System Analyzer: Frame Analyzer: Platform Analyzer: CPU Limited GPU Limited Capture Frame Capture Trace ?Run with Intel® GPA In-Game Analysis Offline Analysis
  • 8.
    Copyright © 2015,Intel Corporation. All rights reserved. *Other names and brands may be claimed as the property of others. Optimization Notice 8 How to get started? Download for FREE at https://software.intel.com/gpa/ • No Code Changes Needed • No Root Required* • No Mobile App Installation • ADB interface * For platform analysis or debug enabled application • No Code Changes Needed • No Environment Changes • No IDE Necessary • Dual or Single System Analysis
  • 9.
    System Analyzer, GraphicsFrame Analyzer, Platform Analyzer
  • 10.
    Copyright © 2015,Intel Corporation. All rights reserved. *Other names and brands may be claimed as the property of others. Optimization Notice Graphics Monitor 10 • Launch point for Windows DirectX Apps • Set HUD metrics • Set capture triggers • View Logs and System Info
  • 11.
    Copyright © 2015,Intel Corporation. All rights reserved. *Other names and brands may be claimed as the property of others. Optimization Notice Enabling DirectX 12 Analysis 11 • Select DirectX12 in the Active API dropdown menu in either the Preferences section or in Analyze Application
  • 12.
    Copyright © 2015,Intel Corporation. All rights reserved. *Other names and brands may be claimed as the property of others. Optimization Notice System Analyzer 12 • Launch point for mobile apps • View metrics while game is running • Enable graphics experiments without changing your code • Identify CPU or GPU bottleneck using just 2 metrics • Capture frames and traces for more detailed analysis
  • 13.
    Copyright © 2015,Intel Corporation. All rights reserved. *Other names and brands may be claimed as the property of others. Optimization Notice System Analyzer – Real Time Metrics 13 • CPU Metrics • GPU Metrics • Memory Metrics • Power Metrics • Graphics API Metrics • Other Platform Metrics *Metric availability depends on platform
  • 14.
    Copyright © 2015,Intel Corporation. All rights reserved. *Other names and brands may be claimed as the property of others. Optimization Notice System Analyzer – Overrides 14 Real time analysis and experiments • 1x1 Scissor Rect • Disable Alpha Blending • Disable Draw Calls • Disable Z-Test • Simple Pixel/Fragment Shader • Show Wireframe • Texture 2x2 Analyze with System Analyzer Texture 2x2
  • 15.
    Copyright © 2015,Intel Corporation. All rights reserved. *Other names and brands may be claimed as the property of others. Optimization Notice Heads Up Display (HUD) 15 • All System Analyzer features • Doesn’t require separate host system
  • 16.
    Copyright © 2015,Intel Corporation. All rights reserved. *Other names and brands may be claimed as the property of others. Optimization Notice Heads Up Display – Overrides 16 “Show Wireframe” Enabled
  • 17.
    Copyright © 2015,Intel Corporation. All rights reserved. *Other names and brands may be claimed as the property of others. Optimization Notice Platform Analyzer 17 • See what the CPU and GPU are doing • Determine the cause of a starved GPU queue • Observe the relationship between functions and metrics
  • 18.
    Copyright © 2015,Intel Corporation. All rights reserved. *Other names and brands may be claimed as the property of others. Optimization Notice Platform Analyzer – Details 18 Bubble CPU Contention GPU Queue DX Tasks SA Metrics Context Switches
  • 19.
    Copyright © 2015,Intel Corporation. All rights reserved. *Other names and brands may be claimed as the property of others. Optimization Notice Graphics Frame Analyzer 19 • See metrics per draw call and find bottlenecks • Analyze all graphics resources used to create the frame • Change rendering states and shaders • Remove whole draw calls • No recompiling needed. • For Android applications: debug rendering issues at any stage of the graphics pipeline • Dark / Light modes
  • 20.
    Copyright © 2015,Intel Corporation. All rights reserved. *Other names and brands may be claimed as the property of others. Optimization Notice 20 The Different Graphics Frame Analyzer UIs DirectX 9, 10, 11 DirectX 12, OpenGL, OpenGL ES Graphics Frame Analyzer (DirectX 9, 10, 11) Graphics Frame Analyzer
  • 21.
    Copyright © 2015,Intel Corporation. All rights reserved. *Other names and brands may be claimed as the property of others. Optimization Notice Graphics Frame Analyzer 21 Bar Chart API Log Metrics
  • 22.
    Copyright © 2015,Intel Corporation. All rights reserved. *Other names and brands may be claimed as the property of others. Optimization Notice Graphics Frame Analyzer – Ergs and Metrics 22 • Identify performance bottlenecks with the erg graph • Select individual ergs for further investigation
  • 23.
    Copyright © 2015,Intel Corporation. All rights reserved. *Other names and brands may be claimed as the property of others. Optimization Notice Graphics Frame Analyzer– Experiments 23 • Immediately see performance deltas • 2x2 Textures • 1x1 Scissor Rect • Simple Pixel Shader • Disable Erg(s)
  • 24.
    Copyright © 2015,Intel Corporation. All rights reserved. *Other names and brands may be claimed as the property of others. Optimization Notice Graphics Frame Analyzer – Resource Viewer 24
  • 25.
    Copyright © 2015,Intel Corporation. All rights reserved. *Other names and brands may be claimed as the property of others. Optimization Notice Graphics Frame Analyzer – Resource History 25 • Green Sub-Bars indicate an erg is using the selected execution resource • Purple sub-bars indicate an erg is writing to the selected resource. (output) • Orange sub-bars indicate an erg is reading from the selected resource. (input)
  • 26.
    Copyright © 2015,Intel Corporation. All rights reserved. *Other names and brands may be claimed as the property of others. Optimization Notice Graphics Frame Analyzer – Geometry 26
  • 27.
    Copyright © 2015,Intel Corporation. All rights reserved. *Other names and brands may be claimed as the property of others. Optimization Notice Graphics Frame Analyzer – Shader Editing 27
  • 28.
    FREE download at:https://software.intel.com/gpa 28
  • 30.
  • 31.
    Copyright © 2015,Intel Corporation. All rights reserved. *Other names and brands may be claimed as the property of others. Optimization Notice Intel Confidential 31 Intel® GPA Release Notes https://software.intel.com/en-us/articles/intel-gpa-release-notes
  • 32.
    Copyright © 2015,Intel Corporation. All rights reserved. *Other names and brands may be claimed as the property of others. Optimization Notice Legal Disclaimer & Optimization Notice INFORMATION IN THIS DOCUMENT IS PROVIDED “AS IS”. NO LICENSE, EXPRESS OR IMPLIED, BY ESTOPPEL OR OTHERWISE, TO ANY INTELLECTUAL PROPERTY RIGHTS IS GRANTED BY THIS DOCUMENT. INTEL ASSUMES NO LIABILITY WHATSOEVER AND INTEL DISCLAIMS ANY EXPRESS OR IMPLIED WARRANTY, RELATING TO THIS INFORMATION INCLUDING LIABILITY OR WARRANTIES RELATING TO FITNESS FOR A PARTICULAR PURPOSE, MERCHANTABILITY, OR INFRINGEMENT OF ANY PATENT, COPYRIGHT OR OTHER INTELLECTUAL PROPERTY RIGHT. Software and workloads used in performance tests may have been optimized for performance only on Intel microprocessors. Performance tests, such as SYSmark and MobileMark, are measured using specific computer systems, components, software, operations and functions. Any change to any of those factors may cause the results to vary. You should consult other information and performance tests to assist you in fully evaluating your contemplated purchases, including the performance of that product when combined with other products. Copyright © 2014, Intel Corporation. All rights reserved. Intel, Pentium, Xeon, Xeon Phi, Core, VTune, Cilk, and the Intel logo are trademarks of Intel Corporation in the U.S. and other countries. Optimization Notice Intel’s compilers may or may not optimize to the same degree for non-Intel microprocessors for optimizations that are not unique to Intel microprocessors. These optimizations include SSE2, SSE3, and SSSE3 instruction sets and other optimizations. Intel does not guarantee the availability, functionality, or effectiveness of any optimization on microprocessors not manufactured by Intel. Microprocessor-dependent optimizations in this product are intended for use with Intel microprocessors. Certain optimizations not specific to Intel microarchitecture are reserved for Intel microprocessors. Please refer to the applicable product User and Reference Guides for more information regarding the specific instruction sets covered by this notice. Notice revision #20110804 32Intel Confidential

Editor's Notes

  • #9 This all sounds great, but how easy is GPA to use? It turns out - Very easy! Analyzing your desktop, laptop, or android applications requires NO code changes to your application at all. No recompiles/no filling your code with instrumentation macros, - nothing. For analyzing Android applications, you don’t even have to root your Android device. You also don’t even have to have your Andoird device drirectly connected – you can do it over the network with ADB!
  • #11 As we mentioned before, you can use the Monitor application to launch your app. Simply point Monitor at your application, launch it, and examine the performance. Monitor has it’s own set of custom configuration features that allow you to handle even complex app starting mechanisms such as launchers like Steam. Just launch your app and collect frame captures or traces, turn on/off overrides and watch the performance in the graphs. Another powerful feature of monitor is the ability to set trigger captures. Lets say you are getting random stutters in your game. On games that are running 30, 60 or more fps, it is almost impossible to trigger the capture of a problematic frame by hand. Instead, you can tell monitor that if the FPS drops below a certain threshold, to capture the frame automatically. You can set a wide variety of system triggers based on CPU and GPU data. This can be an invaluable tool for capturing hard to reproduce issues.
  • #13 As we mentioned earlier, System Analyzer is one of the first applications you’ll likely use. It allows you to connect to your application and gather real-time information. You can view highly detailed CPU and GPU activity, power metrics, and a host of other platform data – all in realtime. The realtime graphs help you quickly see not only if you are CPU or GPU bound, but if there are any activity spikes. If you have stuttering or lag issues with certain actions in your application, these graphs can help you find if it was CPU, GPU, or some other issue. The Realtime power analysis is particularly important for mobile platforms. Our biggest power hogging activities are sometimes not what we expect. Using these tools with developers, we found that one of the biggest power hog offenders for mobile devices were the menu screens. Many games run with no FPS limit. Because the title screen and menu screens are very easy to render, they often ran at hundreds of frames per second. Unfortunately, all this flipping is very power intensive. Because the menu screens only appear at certain times that aren’t usually investigated, a general analysis never caught these spikes. But they were key battery chewing parts of the application since main menu and pause screens were often displayed when a game was left idle.
  • #14 Here’s an example of some of the realtime metrics you can look at, but there are many more. Our CPU and GPU metrics are very high precision and based on internal hardware counters. Analyzing your application on an Intel CPU or GPU gives you access to these high quality metrics. Power metrics are great for android development – but are also very important for laptops and ultrabooks. As our applications and games are increasingly run on a wide range of mobile devices, power is an important concern for almost any developer.
  • #15 Another powerful feature is the ability to run realtime experiments. While you are running your game or app, you can automatically turn on or off any of these state overrides and quickly see what affect they have on frame rate, power, or cpu/gpu load. This allows you to very quickly see if you are draw call bound, texture sampling bound, or many other common problems. Last but not least, you can actually pause and single-frame step through your game in realtime. This can be invaluable for catching visual artifacts and isolating individual frame issues.
  • #16 SA is great, but what if we want to analyze a full-screen app. You can certainly monitor your application remotely, but you also get a subset of SA controls in your own game. The Monitor app allows you to launch your full-screen game and it automatically places an overlay in your game to perform many of the same operations as SA. You can see the hud overlay in blue in the upper left of this app. This is great if you need to test full-screen modes as it gives you access to almost all the same controls and overrides as System Analyzer without having a separate app or remotely monitor from a separate machine. It should be noted that because of the tiny form factor, we don’t support HUD overlays in Android Targets
  • #17 Here are some of the same kinds of realtime metrics that our HUD overlay can show you. It’s not quite as many as in System Analyzer, but still provides you a very good idea of your overall performance characteristics of your app without having to run a separate analysis tool.
  • #18 Platform analyzer is our next tool in the suite. It is used for monitoring both CPU and GPU activity at the same time. This tool helps you figure out how efficiently you’re using all your computing resources. It is often the case early in development we have unbalanced workloads. Sometimes our CPU is completely busy, but our GPU is sitting idle – or vice versa. This tool quickly shows you that information. Even more importantly, you can easily correlate CPU and GPU activity to see if there are any badly performing interactions. Again, sometimes we issue CPU or GPU commands that can stall our computing resources. This tool helps you figure out if those stalls are causing performance issues.
  • #19 Platform Analyzer gives you an amazing amount of information, too much to go over now - but here’s a little overview of what you will see in an average trace capture. Here we see our GPU and thread usages over the entire timeline of the capture. You’ll note that the GPU and CPU times are aligned so you can see how they are interacting. These flows show you exactly what was happening on both your CPU and GPU at the time you captured your trace. In the case of this frame, we see there is a GPU bubble that shows an area of poor GPU utilization. Based on the color of CPU and GPU frames we can easily see that the CPU calculations for the frame are not complete prior to the start of the GPU computations and this is likely starving the GPU pipeline. Using the threading execution view, we notice that only 1 core of the CPU is being used mot of the time. Time to see if we can add some multi-threading.
  • #20 And now on to the finale – and my favorite tool in the suite. Frame Analyzer. FA runs on both DirectX frames and OpenGL|ES frames. If you discover you are GPU bound this is where you can do a deep dive into any frame you capture. Not only can this tool tell you where your performance bottlenecks are, but it is also an amazing diagnostic and debugging tool. You can inspect any texture, render target, geometry, shader, buffer or graphics API call in your frame and run experiments to see if changing any of them helps or hurts your performance.
  • #22 Take a tour of FA
  • #23 At the top you’ll see one of the most important features – the bar chart that shows each erg and it’s performance. We use this word ‘erg’ to describe anything the app issues to the graphics API that causes the GPU to do work. As developers, we know that some DirectX or OpenGL calls don’t actually result in GPU work. For example, just setting a blend state often does not trigger actual GPU work, but a draw or present call does. The bar graph shows you all the calls that actually result in GPU work, and how long they took. If you select an individual erg, or a range of ergs, you see the selected draw calls light up in magenta in your render target view below. This all happens in realtime. If you select new ergs, then the render target immediately highlights the new calls. You can inspect each erg and discover exactly which command is being issued. Not only that, but if you look at the right, you’ll see the Frame Overview and Details tabs that has a list of metrics collected for the selected draw calls. You’ll get all kinds of information on how the CPU and GPU were performing when issuing those commands. Some of the metrics are GPU duration, the number of milliseconds each individual pixel or vertex shader took, how many pixels or vertices the shader processed, shader idle and stall times, and a whole host of other system metrics. With these two elements, you can track down a great number of your performance issues.
  • #24 If you discover issues, it would be nice to test them right away. FA, just like SA, allows you to run experiments and test for common problems. (point at them) You can turn on/off individual ergs, replace textures with very simple ones to test sampling bottlenecks, and others. Not only that – but the frame is re-run and re-sampled to give you the difference in performance immediately.
  • #25 You can also examine all your textures – just like on the desktop. Validating your texture formats and sizes can be especially important on mobile OpenGL|ES devices since they can be a common bottleneck. It is often the case that certain texture formats do not perform well on some mobile hardware platforms. If you notice that all your slow draw calls are using the same texture format, you might see if changing that format and see if it helps your performance issue. Again, you can inspect all the parameters of your texture for performance or logic errors.
  • #26 You can also examine all your textures – just like on the desktop. Validating your texture formats and sizes can be especially important on mobile OpenGL|ES devices since they can be a common bottleneck. It is often the case that certain texture formats do not perform well on some mobile hardware platforms. If you notice that all your slow draw calls are using the same texture format, you might see if changing that format and see if it helps your performance issue. Again, you can inspect all the parameters of your texture for performance or logic errors.
  • #27 You can also examine all your textures – just like on the desktop. Validating your texture formats and sizes can be especially important on mobile OpenGL|ES devices since they can be a common bottleneck. It is often the case that certain texture formats do not perform well on some mobile hardware platforms. If you notice that all your slow draw calls are using the same texture format, you might see if changing that format and see if it helps your performance issue. Again, you can inspect all the parameters of your texture for performance or logic errors.
  • #28 Here we are again, one of the most powerful and time saving features is shader editing. The OpenGL version of FA supports this as well. It allows you to view and make realtime edits to your vertex and pixel shaders. After each edit, the frame is re-run and the new metrics and render target output updated. This allows you to make changes in your shaders and see the results updated without having to recompile and re-run your application on your device.
  • #29 So that is a quick overview of GPA toolkit and its tools. Obviously there is a lot more great features, so we’ll both be available between sessions for questions. You can also go to our website and download the tools today.