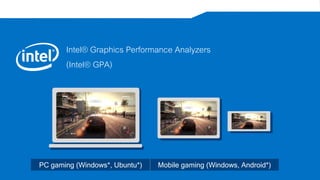
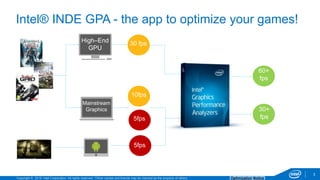
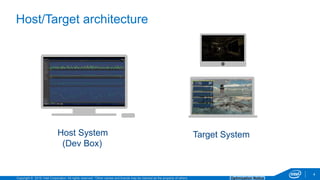
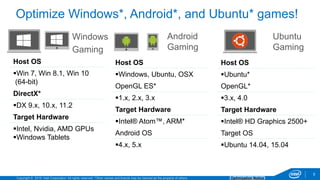
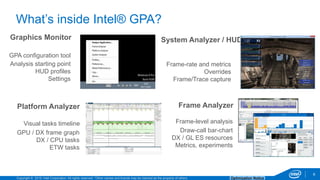
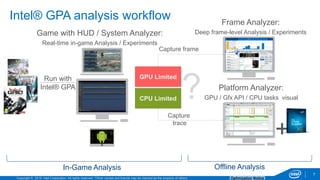
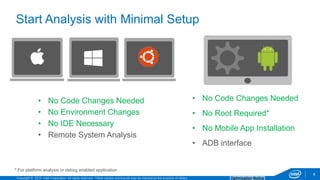
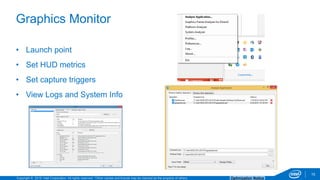
Playing low FPS games is never enjoyable. Learn how to approach game optimization and utilize industry optimization tools. Come join us for a live optimization workflow tutorial with XXX game development studio using the Intel® Graphics Performance Analyzers
Intel TCE Seth Schneider provides a technical overview, outlines the benefits for Game Optimization and answers questions regarding Intel’s Graphics Processing Analyzer.
Ultra HD Video Scaling: Low-Power HW FF vs. CNN-based Super-ResolutionIntel® Software
The visual computing world is moving to an exciting technological era of ultra HD (UHD) and wide-gamut deep colors (WCG). The new Gen9 graphics engine in the 6th generation Intel® Core™ processors is the developers’ platform choice for creating visual excellence in 4K and deep colors. The Gen9 processor graphics offers attractive solutions for high-quality and low-power video scaling that handle UHD and WCG. First, we introduce a hardware fixed-function scaler inside the new SFC (scaling and format conversion) module that provides high quality scaling in low-power platforms. Second, we present a super-resolution scaling solution based on convolutional neural network that can be implemented via OpenCL™ running on the execution units (EUs). We discuss the merits of each solution in different user environments
Build a Deep Learning Video Analytics Framework | SIGGRAPH 2019 Technical Ses...Intel® Software
Explore how to build a unified framework based on FFmpeg and GStreamer to enable video analytics on all Intel® hardware, including CPUs, GPUs, VPUs, FPGAs, and in-circuit emulators.
Whether you are an AI, HPC, IoT, Graphics, Networking or Media developer, visit the Intel Developer Zone today to access the latest software products, resources, training, and support. Test-drive the latest Intel hardware and software products on DevCloud, our online development sandbox, and use DevMesh, our online collaboration portal, to meet and work with other innovators and product leaders. Get started by joining the Intel Developer Community @ software.intel.com.
Open Source Interactive CPU Preview Rendering with Pixar's Universal Scene De...Intel® Software
Universal Scene Description* (USD) is an open source initiative developed by Pixar for fast, large scale, and universal asset management across multiple programs including Maya, Houdini, and others.
Debug, Analyze and Optimize Games with Intel Tools - Matteo Valoriani - Codem...Codemotion
Use the full potential of your favorite platform while improving a videogame's frame rate and performance with GPA (Graphic Performance Analyzer), a free tool powered by Intel. Featuring a convenient panel overlay, you can quickly identify problem areas and experiment with improvements without having to recompile the source code. System Analyzing to isolate common bottlenecks that affect your game's performance in real time. Analyze performance on a single frame down to the draw call level. Identify where you can evenly distribute workloads across the CPU and GPU.
This session showcases the integration between the Unity* game engine and the recently released Intel® Open Image Denoise library for CPU-based lightmap denoising. Learn how the library significantly improves fidelity over bilateral blur by using an AI-based denoiser, which greatly improves time-to-convergence for lightmap rendering.
Reducing Deep Learning Integration Costs and Maximizing Compute Efficiency| S...Intel® Software
oneDNN Graph API extends oneDNN with a graph interface which reduces deep learning integration costs and maximizes compute efficiency across a variety of AI hardware including AI accelerators. Get started on your AI Developer Journey @ software.intel.com/ai.
Embree Ray Tracing Kernels | Overview and New Features | SIGGRAPH 2018 Tech S...Intel® Software
Overview of the new Embree 3 ray tracing framework, including how to use the new API, supported geometry types, and ray intersection methods. Includes a look at new features like normal oriented curves, vertex grids, etc.
Learn how Intel worked with Pixar Animation Studios* and Sony Imageworks* to realize dynamic SIMD code generation of Open Shading Language shader networks, achieving 3-9x speedups with Intel® AVX-512.
The Architecture of 11th Generation Intel® Processor GraphicsIntel® Software
Scheduled for release this year, this next generation brings significant improvements over the widely used 9th generation of Intel® Processor Graphics. The talk begins with an overview of Intel® Graphics architecture, its building blocks, and their performance implications. Next, take an in-depth look at the new and innovative features of this latest generation of integrated graphics.
Tuning For Deep Learning Inference with Intel® Processor Graphics | SIGGRAPH ...Intel® Software
Deep learning based Inference on edge based devices is growing rapidly. In this talk, learn about how developers and researchers are taking advantage of Intel® Processor Graphics to get best performance.
clCaffe*: Unleashing the Power of Intel Graphics for Deep Learning AccelerationIntel® Software
In this presentation, you will hear a story about how Intel graphics can accelerate deep learning applications. The method is simple and reproducible, with impressive results of up to four times over the original CPU performance. We introduce clCaffe*, an extension of the well-known Caffe* framework with OpenCL™ standard. This OpenCL™ standard enables primitives of the convolutional neural networks (CNN) pipeline to operate on GPU (graphics processing unit), FPGA (field programmable gate array) or any device with OpenCL support. Once set up, Caffe users can seamlessly toggle to clCaffe to take advantage of Intel graphics acceleration. Compared with original CPUs, Intel graphics presents 2.5x speedup (AlexNet classification), or 4.0x (GoogleNet classification) on 5th or 6th generation Intel® Core™ processors. Finally, we give a detailed analysis of clCaffe performance, and identify the lacking components in Intel Graphics software stack that impair its performance in the deep learning support.
Software AI Accelerators: The Next Frontier | Software for AI Optimization Su...Intel® Software
Software AI Accelerators deliver orders of magnitude performance gain for AI across deep learning, classical machine learning, and graph analytics and are key to enabling AI Everywhere. Get started on your AI Developer Journey @ software.intel.com/ai.
Advanced Single Instruction Multiple Data (SIMD) Programming with Intel® Impl...Intel® Software
Explore practical elements, such as performance profiling, debugging, and porting advice. Get an overview of advanced programming topics, like common design patterns, SIMD lane interoperability, data conversions, and more.
Review state-of-the-art techniques that use neural networks to synthesize motion, such as mode-adaptive neural network and phase-functioned neural networks. See how next-generation CPUs with reinforcement learning can offer better performance.
Streamed Cloud Gaming Solutions for Android* and PC GamesIntel® Software
Cloud gaming is getting a lot of press lately. As the leading cloud service provider in China, Tencent is embracing the cloud to deliver graphic-intensive PC and mobile games, as well as core developer solutions.
Efficient Rendering with DirectX* 12 on Intel® GraphicsGael Hofemeier
DirectX 12 is coming, and it brings significant improvements to the performance and power efficiency of rendering. In this session, attendees will learn how to best exploit these gains on Intel graphics hardware. We will discuss how the new API maps to 4th and 5th generation Intel® Core™ graphics hardware and give examples of how to minimize overhead and maximize efficiency on both the CPU and GPU.
Software Development Tools for Intel® IoT PlatformsIntel® Software
This talk familiarizes participants with the benefits of using the Intel® software development tools and libraries for developing end-to-end IoT solutions.
Optimizing Direct X On Multi Core Architecturespsteinb
This slide set covers best practices in designing threaded rendering in PC games. Examples of current PC titles will be used throughout the talk to highlight the various points.
With the advent of world class engines like Unity, game development has never been easier. Developers can make deploy to multiple platforms quickly and easily, and optimize for all. Come learn to identify performance issues and their sources using Unity tools and the Intel Graphics Performance Analyzer. Along the way, we will cover some key optimization tips and Unity game development methods to keep your game fast and fantastic
How to create a high quality, fast texture compressor using ISPC Gael Hofemeier
Due to demand, we have been looking into effective compression of the new DirectX* 11 texture formats (BC7, BC6H). This led us to publish a highly efficient ISPC-based texture compressor, under a permissive license, that has now been integrated into several content pipelines. We’ll present how these formats work, why you want to use them, and how our implementation is an improvement over previous software (including some running on discrete GPUs!). We’ll perform a deep dive into the algorithms that enable us to achieve high efficiency and the way we used ISPC to leverage SIMD processing on a wide array of platforms, then discuss future plans.
Learn how to improve performance and quality of your game on Intel® Processor Graphics, including scaling from 1080p to 4k, with dynamic resolution rendering and checkerboard rendering (CBR).
What are latest new features that DPDK brings into 2018?Michelle Holley
We will provide an overview of the new features of the latest DPDK release including source code browsing and API listing of top two new features of latest DPDK release. And on top of that, there will be a hands-on lab, on the Intel® microarchitecture servers, to learn how getting started with DPDK will become much simpler and powerful.
Apache CarbonData & Spark meetup
"QATCodec: past, present and future" if from INTEL
Apache Spark™ is a unified analytics engine for large-scale data processing.
CarbonData is a high-performance data solution that supports various data analytic scenarios, including BI analysis, ad-hoc SQL query, fast filter lookup on detail record, streaming analytics, and so on. CarbonData has been deployed in many enterprise production environments, in one of the largest scenario it supports queries on single table with 3PB data (more than 5 trillion records) with response time less than 3 seconds!
Accelerate Your Python* Code through Profiling, Tuning, and Compilation Part ...Intel® Software
Learn about the latest developments and tools for high-performance Python*, which are used with scikit-learn, NumPy, SciPy, pandas, mpi4py, and Numba*. Apply low-overhead profiling tools, including Intel® VTune™ Amplifier, to analyze mixed C, C++, and Python applications to detect performance bottlenecks in the code and to pinpoint hotspots as the target for performance tuning. Get the best performance from your Python application with the best-known methods, tools, and libraries.
Similar to Intel® Graphics Performance Analyzers (20)
AI for All: Biology is eating the world & AI is eating Biology Intel® Software
Advances in cell biology and creation of an immense amount of data are converging with advances in Machine learning to analyze this data. Biology is experiencing its AI moment and driving the massive computation involved in understanding biological mechanisms and driving interventions. Learn about how cutting edge technologies such as Software Guard Extensions (SGX) in the latest Intel Xeon Processors and Open Federated Learning (OpenFL), an open framework for federated learning developed by Intel, are helping advance AI in gene therapy, drug design, disease identification and more.
Python Data Science and Machine Learning at Scale with Intel and AnacondaIntel® Software
Python is the number 1 language for data scientists, and Anaconda is the most popular python platform. Intel and Anaconda have partnered to bring scalability and near-native performance to Python with simple installations. Learn how data scientists can now access oneAPI-optimized Python packages such as NumPy, Scikit-Learn, Modin, Pandas, and XGBoost directly from the Anaconda repository through simple installation and minimal code changes.
Streamline End-to-End AI Pipelines with Intel, Databricks, and OmniSciIntel® Software
Preprocess, visualize, and Build AI Faster at-Scale on Intel Architecture. Develop end-to-end AI pipelines for inferencing including data ingestion, preprocessing, and model inferencing with tabular, NLP, RecSys, video and image using Intel oneAPI AI Analytics Toolkit and other optimized libraries. Build at-scale performant pipelines with Databricks and end-to-end Xeon optimizations. Learn how to visualize with the OmniSci Immerse Platform and experience a live demonstration of the Intel Distribution of Modin and OmniSci.
AI for good: Scaling AI in science, healthcare, and more.Intel® Software
How do we scale AI to its full potential to enrich the lives of everyone on earth? Learn about AI hardware and software acceleration and how Intel AI technologies are being used to solve critical problems in high energy physics, cancer research, financial inclusion, and more. Get started on your AI Developer Journey @ software.intel.com/ai
Advanced Techniques to Accelerate Model Tuning | Software for AI Optimization...Intel® Software
Learn about the algorithms and associated implementations that power SigOpt, a platform for efficiently conducting model development and hyperparameter optimization. Get started on your AI Developer Journey @ software.intel.com/ai.
AWS & Intel Webinar Series - Accelerating AI ResearchIntel® Software
Scale your research workloads faster with Intel on AWS. Learn how the performance and productivity of Intel Hardware and Software help bridge the gap between ideation and results in Data Science. Get started on your AI Developer Journey @ software.intel.com/ai.
RenderMan*: The Role of Open Shading Language (OSL) with Intel® Advanced Vect...Intel® Software
This talk focuses on the newest release in RenderMan* 22.5 and its adoption at Pixar Animation Studios* for rendering future movies. With native support for Intel® Advanced Vector Extensions, Intel® Advanced Vector Extensions 2, and Intel® Advanced Vector Extensions 512, it includes enhanced library features, debugging support, and an extensive test framework.
ANYFACE*: Create Film Industry-Quality Facial Rendering & Animation Using Mai...Intel® Software
ANYFACE* brings film industry-quality facial rendering and animation to mainstream PC platforms using novel approaches to create face details and control microsurfaces. The solution enables users to create high-fidelity game character facial models using photogrammetry.
Ray Tracing with Intel® Embree and Intel® OSPRay: Use Cases and Updates | SIG...Intel® Software
Explore practical examples of Intel® Embree and Intel® OSPRay in production rendering and the best practices of using the kernels in typical rendering pipelines.
Use Variable Rate Shading (VRS) to Improve the User Experience in Real-Time G...Intel® Software
Variable-rate shading (VRS) is a new feature of Microsoft DirectX* 12 and is supported on the 11th generation of Intel® graphics hardware. Get an overview and learn best practices, recommendations, and how to modify traditional 3D effects to take advantage of VRS.
Bring the Future of Entertainment to Your Living Room: MPEG-I Immersive Video...Intel® Software
Explore the proposed Metadata for Immersive Video (MIV) standard specification. MIV enables real-world content captured by cameras to be viewed by users with Six Degrees of Freedom (6DoF) movement, similar to a VR experience with synthetic content.
In this presentation, we describe a heuristic for modifying the structure of sparse deep convolutional networks during training. The heuristic allows us to train sparse networks directly to reach accuracies on par with accuracies obtained through compressing/pruning of big dense models. We show that exploring the network structure during training is essential to reach best accuracies, even when the optimal network structure is known a-priori.
A Comprehensive Look at Generative AI in Retail App Testing.pdfkalichargn70th171
Traditional software testing methods are being challenged in retail, where customer expectations and technological advancements continually shape the landscape. Enter generative AI—a transformative subset of artificial intelligence technologies poised to revolutionize software testing.
In software engineering, the right architecture is essential for robust, scalable platforms. Wix has undergone a pivotal shift from event sourcing to a CRUD-based model for its microservices. This talk will chart the course of this pivotal journey.
Event sourcing, which records state changes as immutable events, provided robust auditing and "time travel" debugging for Wix Stores' microservices. Despite its benefits, the complexity it introduced in state management slowed development. Wix responded by adopting a simpler, unified CRUD model. This talk will explore the challenges of event sourcing and the advantages of Wix's new "CRUD on steroids" approach, which streamlines API integration and domain event management while preserving data integrity and system resilience.
Participants will gain valuable insights into Wix's strategies for ensuring atomicity in database updates and event production, as well as caching, materialization, and performance optimization techniques within a distributed system.
Join us to discover how Wix has mastered the art of balancing simplicity and extensibility, and learn how the re-adoption of the modest CRUD has turbocharged their development velocity, resilience, and scalability in a high-growth environment.
Gamify Your Mind; The Secret Sauce to Delivering Success, Continuously Improv...Shahin Sheidaei
Games are powerful teaching tools, fostering hands-on engagement and fun. But they require careful consideration to succeed. Join me to explore factors in running and selecting games, ensuring they serve as effective teaching tools. Learn to maintain focus on learning objectives while playing, and how to measure the ROI of gaming in education. Discover strategies for pitching gaming to leadership. This session offers insights, tips, and examples for coaches, team leads, and enterprise leaders seeking to teach from simple to complex concepts.
Prosigns: Transforming Business with Tailored Technology SolutionsProsigns
Unlocking Business Potential: Tailored Technology Solutions by Prosigns
Discover how Prosigns, a leading technology solutions provider, partners with businesses to drive innovation and success. Our presentation showcases our comprehensive range of services, including custom software development, web and mobile app development, AI & ML solutions, blockchain integration, DevOps services, and Microsoft Dynamics 365 support.
Custom Software Development: Prosigns specializes in creating bespoke software solutions that cater to your unique business needs. Our team of experts works closely with you to understand your requirements and deliver tailor-made software that enhances efficiency and drives growth.
Web and Mobile App Development: From responsive websites to intuitive mobile applications, Prosigns develops cutting-edge solutions that engage users and deliver seamless experiences across devices.
AI & ML Solutions: Harnessing the power of Artificial Intelligence and Machine Learning, Prosigns provides smart solutions that automate processes, provide valuable insights, and drive informed decision-making.
Blockchain Integration: Prosigns offers comprehensive blockchain solutions, including development, integration, and consulting services, enabling businesses to leverage blockchain technology for enhanced security, transparency, and efficiency.
DevOps Services: Prosigns' DevOps services streamline development and operations processes, ensuring faster and more reliable software delivery through automation and continuous integration.
Microsoft Dynamics 365 Support: Prosigns provides comprehensive support and maintenance services for Microsoft Dynamics 365, ensuring your system is always up-to-date, secure, and running smoothly.
Learn how our collaborative approach and dedication to excellence help businesses achieve their goals and stay ahead in today's digital landscape. From concept to deployment, Prosigns is your trusted partner for transforming ideas into reality and unlocking the full potential of your business.
Join us on a journey of innovation and growth. Let's partner for success with Prosigns.
Top Features to Include in Your Winzo Clone App for Business Growth (4).pptxrickgrimesss22
Discover the essential features to incorporate in your Winzo clone app to boost business growth, enhance user engagement, and drive revenue. Learn how to create a compelling gaming experience that stands out in the competitive market.
First Steps with Globus Compute Multi-User EndpointsGlobus
In this presentation we will share our experiences around getting started with the Globus Compute multi-user endpoint. Working with the Pharmacology group at the University of Auckland, we have previously written an application using Globus Compute that can offload computationally expensive steps in the researcher's workflows, which they wish to manage from their familiar Windows environments, onto the NeSI (New Zealand eScience Infrastructure) cluster. Some of the challenges we have encountered were that each researcher had to set up and manage their own single-user globus compute endpoint and that the workloads had varying resource requirements (CPUs, memory and wall time) between different runs. We hope that the multi-user endpoint will help to address these challenges and share an update on our progress here.
Providing Globus Services to Users of JASMIN for Environmental Data AnalysisGlobus
JASMIN is the UK’s high-performance data analysis platform for environmental science, operated by STFC on behalf of the UK Natural Environment Research Council (NERC). In addition to its role in hosting the CEDA Archive (NERC’s long-term repository for climate, atmospheric science & Earth observation data in the UK), JASMIN provides a collaborative platform to a community of around 2,000 scientists in the UK and beyond, providing nearly 400 environmental science projects with working space, compute resources and tools to facilitate their work. High-performance data transfer into and out of JASMIN has always been a key feature, with many scientists bringing model outputs from supercomputers elsewhere in the UK, to analyse against observational or other model data in the CEDA Archive. A growing number of JASMIN users are now realising the benefits of using the Globus service to provide reliable and efficient data movement and other tasks in this and other contexts. Further use cases involve long-distance (intercontinental) transfers to and from JASMIN, and collecting results from a mobile atmospheric radar system, pushing data to JASMIN via a lightweight Globus deployment. We provide details of how Globus fits into our current infrastructure, our experience of the recent migration to GCSv5.4, and of our interest in developing use of the wider ecosystem of Globus services for the benefit of our user community.
May Marketo Masterclass, London MUG May 22 2024.pdfAdele Miller
Can't make Adobe Summit in Vegas? No sweat because the EMEA Marketo Engage Champions are coming to London to share their Summit sessions, insights and more!
This is a MUG with a twist you don't want to miss.
Exploring Innovations in Data Repository Solutions - Insights from the U.S. G...Globus
The U.S. Geological Survey (USGS) has made substantial investments in meeting evolving scientific, technical, and policy driven demands on storing, managing, and delivering data. As these demands continue to grow in complexity and scale, the USGS must continue to explore innovative solutions to improve its management, curation, sharing, delivering, and preservation approaches for large-scale research data. Supporting these needs, the USGS has partnered with the University of Chicago-Globus to research and develop advanced repository components and workflows leveraging its current investment in Globus. The primary outcome of this partnership includes the development of a prototype enterprise repository, driven by USGS Data Release requirements, through exploration and implementation of the entire suite of the Globus platform offerings, including Globus Flow, Globus Auth, Globus Transfer, and Globus Search. This presentation will provide insights into this research partnership, introduce the unique requirements and challenges being addressed and provide relevant project progress.
Large Language Models and the End of ProgrammingMatt Welsh
Talk by Matt Welsh at Craft Conference 2024 on the impact that Large Language Models will have on the future of software development. In this talk, I discuss the ways in which LLMs will impact the software industry, from replacing human software developers with AI, to replacing conventional software with models that perform reasoning, computation, and problem-solving.
Developing Distributed High-performance Computing Capabilities of an Open Sci...Globus
COVID-19 had an unprecedented impact on scientific collaboration. The pandemic and its broad response from the scientific community has forged new relationships among public health practitioners, mathematical modelers, and scientific computing specialists, while revealing critical gaps in exploiting advanced computing systems to support urgent decision making. Informed by our team’s work in applying high-performance computing in support of public health decision makers during the COVID-19 pandemic, we present how Globus technologies are enabling the development of an open science platform for robust epidemic analysis, with the goal of collaborative, secure, distributed, on-demand, and fast time-to-solution analyses to support public health.
Listen to the keynote address and hear about the latest developments from Rachana Ananthakrishnan and Ian Foster who review the updates to the Globus Platform and Service, and the relevance of Globus to the scientific community as an automation platform to accelerate scientific discovery.
Enhancing Research Orchestration Capabilities at ORNL.pdfGlobus
Cross-facility research orchestration comes with ever-changing constraints regarding the availability and suitability of various compute and data resources. In short, a flexible data and processing fabric is needed to enable the dynamic redirection of data and compute tasks throughout the lifecycle of an experiment. In this talk, we illustrate how we easily leveraged Globus services to instrument the ACE research testbed at the Oak Ridge Leadership Computing Facility with flexible data and task orchestration capabilities.
Cyaniclab : Software Development Agency Portfolio.pdfCyanic lab
CyanicLab, an offshore custom software development company based in Sweden,India, Finland, is your go-to partner for startup development and innovative web design solutions. Our expert team specializes in crafting cutting-edge software tailored to meet the unique needs of startups and established enterprises alike. From conceptualization to execution, we offer comprehensive services including web and mobile app development, UI/UX design, and ongoing software maintenance. Ready to elevate your business? Contact CyanicLab today and let us propel your vision to success with our top-notch IT solutions.
Check out the webinar slides to learn more about how XfilesPro transforms Salesforce document management by leveraging its world-class applications. For more details, please connect with sales@xfilespro.com
If you want to watch the on-demand webinar, please click here: https://www.xfilespro.com/webinars/salesforce-document-management-2-0-smarter-faster-better/
Unleash Unlimited Potential with One-Time Purchase
BoxLang is more than just a language; it's a community. By choosing a Visionary License, you're not just investing in your success, you're actively contributing to the ongoing development and support of BoxLang.
Navigating the Metaverse: A Journey into Virtual Evolution"Donna Lenk
Join us for an exploration of the Metaverse's evolution, where innovation meets imagination. Discover new dimensions of virtual events, engage with thought-provoking discussions, and witness the transformative power of digital realms."
…inside the Integrated Native Development Experience package… or INDE
For those of you that have not used GPA, GPA stands for Graphics Performance Analyzers. GPA is a suite of individual tools that you can run on your favorite development environments: Windows, OS X, and Ubuntu. These tools allow you to analyze your Windows, Ubuntu, and Android applications and isolate and fix any performance issues.
As developers, we’ve all had the experience that once you have your primary functionality complete and start testing it on a number platforms, you might discover performance issues. We all have performance goals, but these goals are even more difficult to hit on the wide variety of hardware out there today. Low fps, lag, and stuttering are all serious issues. And we as developers want to provide the best experience when people play our apps and games – no matter what platform they use. GPA can help you identify your hot spots and reach your performance goals, no matter which devices you are targeting.
So, how do our tools work? Because we run on such a wide variety of platforms, our tools have a host/target architecture. The reason for this is twofold. First, everyone has their favorite development environment. The second is because small handheld devices do not lend themselves to interactive debugging tools. when developing with low-power/low-compute devices, the monitoring tools themselves can get in the way of accurate measurements and affect the performance. So in order to get the best results, we run a small collector on the target system but have our powerful analysis and investigation tools on your favorite development environment. Even if you are a purely desktop developer, this mechanism give you the ability to remotely monitor/collect data from other desktop systems as well.
Here is a more exhaustive list of platforms we run on. As you can see, it is quite a few! We support a wide variety of host operating systems for our powerful analysis and evaluation tools and also support a wide variety of target hardware as well.
As you can see, you can collect all your favorite DirectX versions on Windows, collect OpenGL on Ubuntu, and collect performance data from android targets from Windows, Mac, or Ubuntu hosts.
So what’s inside GPA? Here we see the 4 major analysis applications:
1. First there is system analyzer which allows you to connect to an application and not only monitor realtime metrics, but also override state, trigger captures of individual frames, and make traces
2. Graphics monitor is our lightweight monitoring and launching tool. This component allows you to launch applications, monitor them via a simple HUD, collect frames and traces, set triggered events, and manage the configuration of apps you wish to collect data from.
3. Platform analyzer is our GPU/CPU workload visualization tool. It allows you to see GPU and CPU workloads at the same time, which lets you spot difficult CPU/GPU interaction issues or discover if you are CPU or GPU bound.
4. Finally, there is Frame Analyzer which is our powerful frame analysis tool. You can capture individual frames from your game, inspect all aspects of them, and find performance issues at the individual draw call level.
Ok, don’t let this slide daunt you too much. There is a wide variety of ways to find your performance bottlenecks, but this is one of the most methodical ways to isolate what you are looking for if you really don’t know where to start. At a high level – our first objective is to find out if we CPU or GPU limited. After we discover that, we can start making the right kinds of performance optimizations. After all, you don’t want to spend valuable time optimizing your GPU code if the performance issue is on the CPU or vice versa..
First, we do online or realtime analysis. Lets say you have a performance issue in your game. For desktop applications, you can start your analysis either on the system you are using or remotely. For android, you use your development system to connect to your android application. You then run your game under analysis using either System Analyzer or monitor to capture frames and activity traces.
So, lets talk a little about frame and trace captures. A Frame capture collects all the graphics API calls for an individual frame. A Trace capture collect both CPU and GPU activity and give you an overall picture of what the system is doing. We can capture any number of these at any part of our application or game. If one particular level is causing you issues, you can go to that level and only capture frames and traces for that part of your game.
After we have captured our frames and traces, we then use our analysis tools to figure out where our problem lies. We first analyze our traces with Platform Analyzer. This quickly tells us if we are spending the majority of our time on the cpu or gpu. If you find you’re a CPU bound, you can discover which actions are causing your CPU bottlenecks in Platform Analyzer or dig in even further by using Intel’s Vtune analyzer.
For cases when you are GPU bound, you can use Frame Analyzer to discover what is taking up your GPU time. You can inspect your frame 1 api call at a time and run experiments to figure out which graphics calls are causing performance issues.
This all sounds great, but how easy is GPA to use? It turns out - Very easy! Analyzing your desktop, laptop, or android applications requires NO code changes to your application at all. No recompiles/no filling your code with instrumentation macros, - nothing. For analyzing Android applications, you don’t even have to root your Android device. You also don’t even have to have your Andoird device drirectly connected – you can do it over the network with ADB!
So now that we’ve seen the overall workflow, lets look at each tool individually and how it can help you find performance bottlenecks.
As we mentioned before, you can use the Monitor application to launch your app. Simply point Monitor at your application, launch it, and examine the performance. Monitor has it’s own set of custom configuration features that allow you to handle even complex app starting mechanisms such as launchers like Steam. Just launch your app and collect frame captures or traces, turn on/off overrides and watch the performance in the graphs.
Another powerful feature of monitor is the ability to set trigger captures. Lets say you are getting random stutters in your game. On games that are running 30, 60 or more fps, it is almost impossible to trigger the capture of a problematic frame by hand. Instead, you can tell monitor that if the FPS drops below a certain threshold, to capture the frame automatically. You can set a wide variety of system triggers based on CPU and GPU data. This can be an invaluable tool for capturing hard to reproduce issues.
As we mentioned earlier, System Analyzer is one of the first applications you’ll likely use. It allows you to connect to your application and gather real-time information. You can view highly detailed CPU and GPU activity, power metrics, and a host of other platform data – all in realtime. The realtime graphs help you quickly see not only if you are CPU or GPU bound, but if there are any activity spikes. If you have stuttering or lag issues with certain actions in your application, these graphs can help you find if it was CPU, GPU, or some other issue.
The Realtime power analysis is particularly important for mobile platforms. Our biggest power hogging activities are sometimes not what we expect. Using these tools with developers, we found that one of the biggest power hog offenders for mobile devices were the menu screens. Many games run with no FPS limit. Because the title screen and menu screens are very easy to render, they often ran at hundreds of frames per second. Unfortunately, all this flipping is very power intensive. Because the menu screens only appear at certain times that aren’t usually investigated, a general analysis never caught these spikes. But they were key battery chewing parts of the application since main menu and pause screens were often displayed when a game was left idle.
Here’s an example of some of the realtime metrics you can look at, but there are many more. Our CPU and GPU metrics are very high precision and based on internal hardware counters. Analyzing your application on an Intel CPU or GPU gives you access to these high quality metrics.
Power metrics are great for android development – but are also very important for laptops and ultrabooks. As our applications and games are increasingly run on a wide range of mobile devices, power is an important concern for almost any developer.
Not only can you monitor what your application or game is doing in realtime, but there are also some really powerful tools in System Analyzer. You not only get realtime system-wide information – but on Intel platforms – the tool also allows you to limit and override your CPU frequency. This lets you to test your application on a range of processors without having to buy a whole test bed of different speed machines.
Another powerful feature is the ability to run realtime experiments. While you are running your game or app, you can automatically turn on or off any of these state overrides and quickly see what affect they have on frame rate, power, or cpu/gpu load. This allows you to very quickly see if you are draw call bound, texture sampling bound, or many other common problems.
Last but not least, you can actually pause and single-frame step through your game in realtime. This can be invaluable for catching visual artifacts and isolating individual frame issues.
SA is great, but what if we want to analyze a full-screen app. You can certainly monitor your application remotely, but you also get a subset of SA controls in your own game. The Monitor app allows you to launch your full-screen game and it automatically places an overlay in your game to perform many of the same operations as SA. You can see the hud overlay in blue in the upper left of this app. This is great if you need to test full-screen modes as it gives you access to almost all the same controls and overrides as System Analyzer without having a separate app or remotely monitor from a separate machine.
It should be noted that because of the tiny form factor, we don’t support HUD overlays in Android Targets
Here are some of the same kinds of realtime metrics that our HUD overlay can show you. It’s not quite as many as in System Analyzer, but still provides you a very good idea of your overall performance characteristics of your app without having to run a separate analysis tool.
Platform analyzer is our next tool in the suite. It is used for monitoring both CPU and GPU activity at the same time. This tool helps you figure out how efficiently you’re using all your computing resources. It is often the case early in development we have unbalanced workloads. Sometimes our CPU is completely busy, but our GPU is sitting idle – or vice versa. This tool quickly shows you that information.
Even more importantly, you can easily correlate CPU and GPU activity to see if there are any badly performing interactions. Again, sometimes we issue CPU or GPU commands that can stall our computing resources. This tool helps you figure out if those stalls are causing performance issues.
Platform Analyzer gives you an amazing amount of information, too much to go over now - but here’s a little overview of what you will see in an average trace capture.Here we see our GPU and thread usages over the entire timeline of the capture. You’ll note that the GPU and CPU times are aligned so you can see how they are interacting. These flows show you exactly what was happening on both your CPU and GPU at the time you captured your trace.
In the case of this frame, we see there is a GPU bubble that shows an area of poor GPU utilization. Based on the color of CPU and GPU frames we can easily see that the CPU calculations for the frame are not complete prior to the start of the GPU computations and this is likely starving the GPU pipeline. Using the threading execution view, we notice that only 1 core of the CPU is being used mot of the time. Time to see if we can add some multi-threading.
And now on to the finale – and my favorite tool in the suite. Frame Analyzer. FA runs on both DirectX frames and OpenGL|ES frames.
If you discover you are GPU bound this is where you can do a deep dive into any frame you capture. Not only can this tool tell you where your performance bottlenecks are, but it is also an amazing diagnostic and debugging tool. You can inspect any texture, render target, geometry, shader, buffer or graphics API call in your frame and run experiments to see if changing any of them helps or hurts your performance.
This is what FA looks like in DX. DX and OpenGL have a slightly different workflow, but the elements will be very similar and the functionality almost identical. As you can see, there is a lot in the tool. Lets break this up and do a little deeper dive into the various things you can do with FA.
At the top you’ll see one of the most important features – the bar chart that shows each erg and it’s performance. We use this word ‘erg’ to describe anything the app issues to the graphics API that causes the GPU to do work. As developers, we know that some DirectX or OpenGL calls don’t actually result in GPU work. For example, just setting a blend state often does not trigger actual GPU work, but a draw or present call does. The bar graph shows you all the calls that actually result in GPU work, and how long they took.
If you select an individual erg, or a range of ergs, you see the selected draw calls light up in magenta in your render target view below. This all happens in realtime. If you select new ergs, then the render target immediately highlights the new calls. You can inspect each erg and discover exactly which command is being issued.
Not only that, but if you look at the right, you’ll see the Frame Overview and Details tabs that has a list of metrics collected for the selected draw calls. You’ll get all kinds of information on how the CPU and GPU were performing when issuing those commands. Some of the metrics are GPU duration, the number of milliseconds each individual pixel or vertex shader took, how many pixels or vertices the shader processed, shader idle and stall times, and a whole host of other system metrics. With these two elements, you can track down a great number of your performance issues.
Textures are some of the largest resources we use in graphics applications and games. Sometimes our performance bottlenecks are because we are using very large textures, accidently leave the wrong textures bound, or use texture formats that are poorly optimized for your target hardware. You can select your ergs and inspect all the textures that were bound for those draw calls.
Another very useful feature is the ability to analyze the geometry of your rendered objects. Again, sometimes we have performance issues because our models are not optimized or we are rendering objects we shouldn’t be. You can also check all the mesh parameters such as topology, formats, and visualize them in realtime to see if there are issues.
A tremendously powerful feature of the tool is the ability to inspect, edit, and even replace your shaders. Obviously you can’t change the bindings for shader inputs, but you can edit your shader and immediately see the results. If shader source is available, you can edit in HLSL. If your shader source is not available, you can even modify the shader assembly. You can also edit the shader and replace it with another shader file. You can also inspect the constants and uniforms you are sending to your shader. You get to see the results visually and in the metrics in realtime - all without needing to recompile or re-run your application.
If you discover issues, it would be nice to test them right away. FA, just like SA, allows you to run experiments and test for common problems. (point at them) You can turn on/off individual ergs, replace textures with very simple ones to test sampling bottlenecks, and others. Not only that – but the frame is re-run and re-sampled to give you the difference in performance immediately.
The version of FA we have been showing you is for DirectX. But we also have FA for OpenGL ES. The layout is slightly different, but you’ll see that almost all the same features are available. Just like the new visual studio, you can toggle between light and dark color schemes.
Again, we have the ability to perform experiments on our OpenGL ES Android frames just like on the desktop. This allows you to test out a variety of common problems without having to recompile and re-run your app on your target device. A great time saving technique. There is no need to rebuild your game, transport it to your android device and re-collect data from it. Just push the experiment button and FA for OpenGL|ES will do all the work of re-running with the new settings automatically.
You can also examine all your textures – just like on the desktop. Validating your texture formats and sizes can be especially important on mobile OpenGL|ES devices since they can be a common bottleneck. It is often the case that certain texture formats do not perform well on some mobile hardware platforms. If you notice that all your slow draw calls are using the same texture format, you might see if changing that format and see if it helps your performance issue. Again, you can inspect all the parameters of your texture for performance or logic errors.
Here we are again, one of the most powerful and time saving features is shader editing. The OpenGL version of FA supports this as well. It allows you to view and make realtime edits to your vertex and pixel shaders. After each edit, the frame is re-run and the new metrics and render target output updated. This allows you to make changes in your shaders and see the results updated without having to recompile and re-run your application on your device.
So that is a quick overview of GPA toolkit and its tools. Obviously there is a lot more great features, so we’ll both be available between sessions for questions. You can also go to our website and download the tools today.