Download to read offline
![IJRET: International Journal of Research in Engineering and Technology eISSN: 2319-1163 | pISSN: 2321-7308
__________________________________________________________________________________________
Volume: 03 Issue: 03 | Mar-2014, Available @ http://www.ijret.org 328
The controller using here is PID controller, which is
describing function based PID controller and the process is
control valve. If stiction is present in the valve then we won’t
get desired output that is stem position, which is converted
into voltage by using sliding m mode potentiometer that
voltage is compared with set point value and reduced the error
by describing function method.
3. MATHEMATICAL MODELLING
Modelling steps is based on Newton’s second law. Newton’s
2nd
law is given by
Where,
m= mass of moving part
x =stem position
Pressure = pressure exerted
Sa=diaphragm area
P= applied pressure
Spring=force applied on spring = Kmx
Where,
Km=spring constant
Friction=frictional force
4. CONTROLLER IMPLEMENTATION
4.1 PID Controller
A proportional-integral-derivative controller (PID controller)
is a generic control loop feedback mechanism (controller)
widely used in industrial control systems. A PID controller
calculates an "error" value as the difference between a
measured process variable and a desired set point. Adjusting
the process control input the controller attempts to minimize
the error. The PID controller calculation algorithm involves
three separate constant parameter the proportional,the integral
and derivative values denoted P, I, and D. P depends on the
present error, I on the past errors, and D is a prediction of
future errors..[1] The sum of these three actions is used to
adjust the process via a control element such as the position of
a control valve, a damper, or the power supplied process. PID
controller has been considered to be the best controller. By
tuning the parameters the PID controller can provide control
action designed for specific process requirements. Note that
the use of the PID algorithm for control does not guarantee
optimal control of the system or system stability.
4.2 Describing Function Method
Final control element used in industries is control valve. One
third of poorly performing control loops are caused by
nonlinearities present in the control valves, one of which is
static friction, due to the effect of nonlinearities oscillations
will be present in the process variables. Since industrial plants
include numerous interacting loops, the oscillations will be
transmitting to the entire system. Repairing the faulty valves
will be the only solution to this problem, which is possible
only during process shut down. But, as shutting down the
process to isolate the faulty valve for maintenance purposes is
not economical, this solution does not count as the primary
one. So, there is a need for a method to compensate the
destructive effect of the stiction phenomenon in the control
valve, when maintenance is not available.
Describing function provides a linear approximation to the
non linear elements, based on the assumption that input to the
non linear element is sinusoid of known constant amplitude.
The signals are given depending upon the controller output.
Fig-3: Block diagram of non-linearity
It is an appropriate procedure for analyzing certain non linear
control problems. It is a mathematical tool for analyzing limit
cycle in the closed loop controllers, this method predicts
weather limit cycle oscillation will exist or not and gives
numerical estimates of oscillation frequency and amplitude
when limit cycle are predicted. Basically this method is an
approximation extension of frequency response method to non
linear system. Gc(s) and G1(s) are linear elements and n(x) is
non linear element. Describing function provides a linear
approximation to the non linear elements, based on the
assumption that input to the non linear element is sinusoid of
known constant amplitude. To find steady state value and
amplitude the fundamental harmonic is compared with phase
relation. This relation is used for the describing function for
the nonlinear element.
5. CONTROLLER DESIGN
5.1 PID Controller Design
From the Zeigler Nichols open loop tuning
28.3% of the steady state value = t1 = 0.283k = 1.05sec
63.2% of the steady state value = t2 = 0.63k = 1.08sec
mx Forces
pressure spring frictionmx F F F ](https://image.slidesharecdn.com/describingfunctionbasedcontrollerforstiction-140812033745-phpapp01/85/Describing-function-based-controller-for-stiction-2-320.jpg)
![IJRET: International Journal of Research in Engineering and Technology eISSN: 2319-1163 | pISSN: 2321-7308
__________________________________________________________________________________________
Volume: 03 Issue: 03 | Mar-2014, Available @ http://www.ijret.org 330
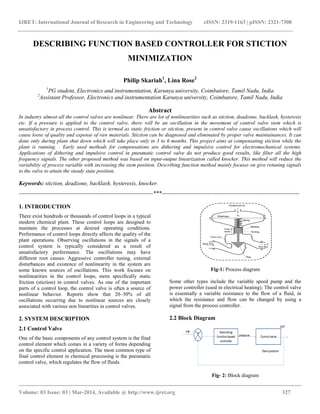
6.3 Block Diagram of Describing Function
6.4 Response of Describing Function
7. RESULTS
Table-1: Comparison of describing function with PID
controller
Controller
Rise time
(sec)
Settling
time(sec)
Over
shoot (%)
PID 1.91 6.5 5.73
Describing
function
based
0.056 0.02 0
8. CONCLUSIONS
Nonlinearities in the control valve where studied in which
stiction is found to be the most affecting nonlinearity for a
control valve. Hence stiction reduction methods were
introduced. Based on the modelling equation the transfer
function of the process is calculated and controller was
designed. A PID controller is designed and the values of the
proportional derivative and integral are obtained. The
controller based on the describing function was also
determined depending on the parameters of nonlinearity. Both
the controller responses were compared. Describing function
based controller provides a response which is of reduced
oscillations
REFERENCES
[1]. S.Sivagamasundari, D.Sivakumar ;A New Methodology
to Compensate Stiction in Pneumatic Control Valves;
International Journal of Soft Computing and Engineering
(IJSCE) ISSN: 2231-2307, Volume-2, Issue-6, January 2013
[2]. B. Halimi, Y. Suh Kune, Analysis of nonlinearities
compensation for control valves, in: Proceedings of
International Congress on Advances in Nuclear Power Plants
(ICAPP 2010), June 13–17, San Diego, CA, USA, 2010.
[3]. Z.X. Ivan, S. Lakshminarayanan, A new unified approach
to valve stiction quantification and compensation, Industrial
and Engineering Chemistry Research 48 (2009) 3474–3483.
[4]. T. Hägglund, A friction compensator for pneumatic
control valves, Journal of Process Control 12 (2002) 897–904
[5]. T. Miao, D.E. Seborg, Automatic detection of excessively
oscillatory control loops, in: Proceedings of the 1999
IEEE International Conference on Control Applications,
Hawaii, USA, 1999.
[6]. M. Ale Mohammad, B. Huang, Frequency analysis and
experimental validation for stiction phenomenon in multi-loop
processes, Journal of Process Control 21 (4) (2011) 437–447.
[7]. K. Hamiti*, A. Voda-Besanqon** and H. Roux-
Buisson*;POSITION CONTROL OF A PNEUMATIC
ACTUATOR UNDER THE INFLUENCE OF STICTION
Control Eng. Practice, Vol. 4, No. 8, pp. 1079-1088,1996
Copyright © 1996 Elsevier Science Ltd Printed in Great
Britain.
[8]. D.P.Atherton; INTRODUCTION TO DESCRIBING
FUNCTION METHOD Control system robotics and
automation-vol3
[9].W.B. Dunbar, R.A. de Califon and J.B. Kosmatka;
Coulomb and viscous friction fault detection with application
to a pneumatic actuator; University of California, San Diego
Dept. of Mechanical and Aerospace Engineering 9500 Gilman
Drive, La Jolla, CA 92093-0411, U.S.A
dunbar@cds.caltech.edu, jkosmatkg@ucsd.edu
0 1000 2000 3000 4000 5000 6000 7000 8000 9000 10000
0
0.5
1
1.5
timeinsec
stemposition(mm)](https://image.slidesharecdn.com/describingfunctionbasedcontrollerforstiction-140812033745-phpapp01/85/Describing-function-based-controller-for-stiction-4-320.jpg)


The document presents a method for compensating stiction in control valves, which leads to oscillations that degrade process control in industrial settings. It explores the describing function method and PID controller design to mitigate the effects of nonlinearities in control loops. The results indicate that the describing function-based controller significantly reduces oscillations compared to the traditional PID controller.