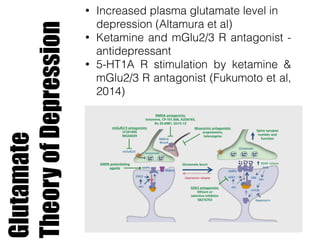
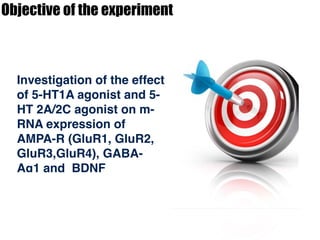
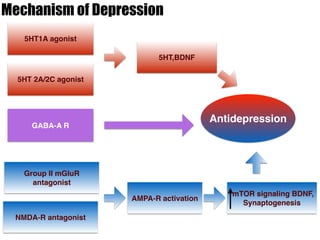
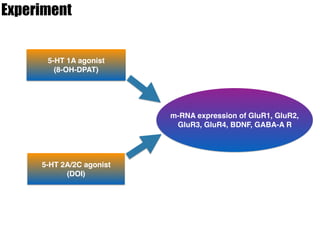
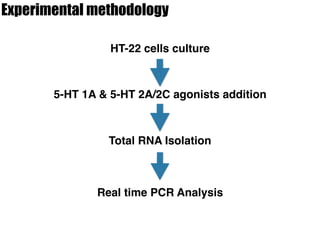
1) The study investigated the effects of serotonin receptor agonists on mRNA expression levels of genes related to glutamate and GABA systems in mouse cortical neurons and HT-22 cells.
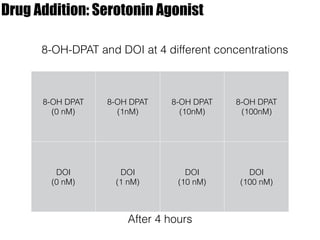
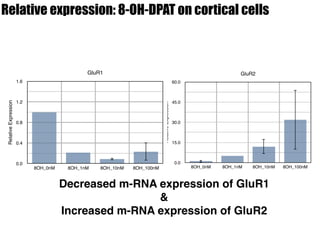
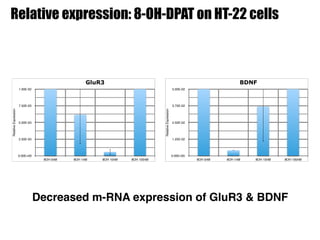
2) Treatment with the 5-HT1A agonist 8-OH-DPAT decreased mRNA levels of GluR1 and GluR3 while increasing GluR2 mRNA levels in cortical neurons. It also decreased GluR3 and BDNF mRNA levels in HT-22 cells.
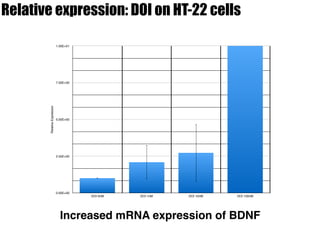
3) Treatment with the 5-HT2A/2C agonist DOI increased BDNF mRNA levels in HT-22 cells.
4) The results suggest serotonin receptor agonists can modulate glutamate and BD