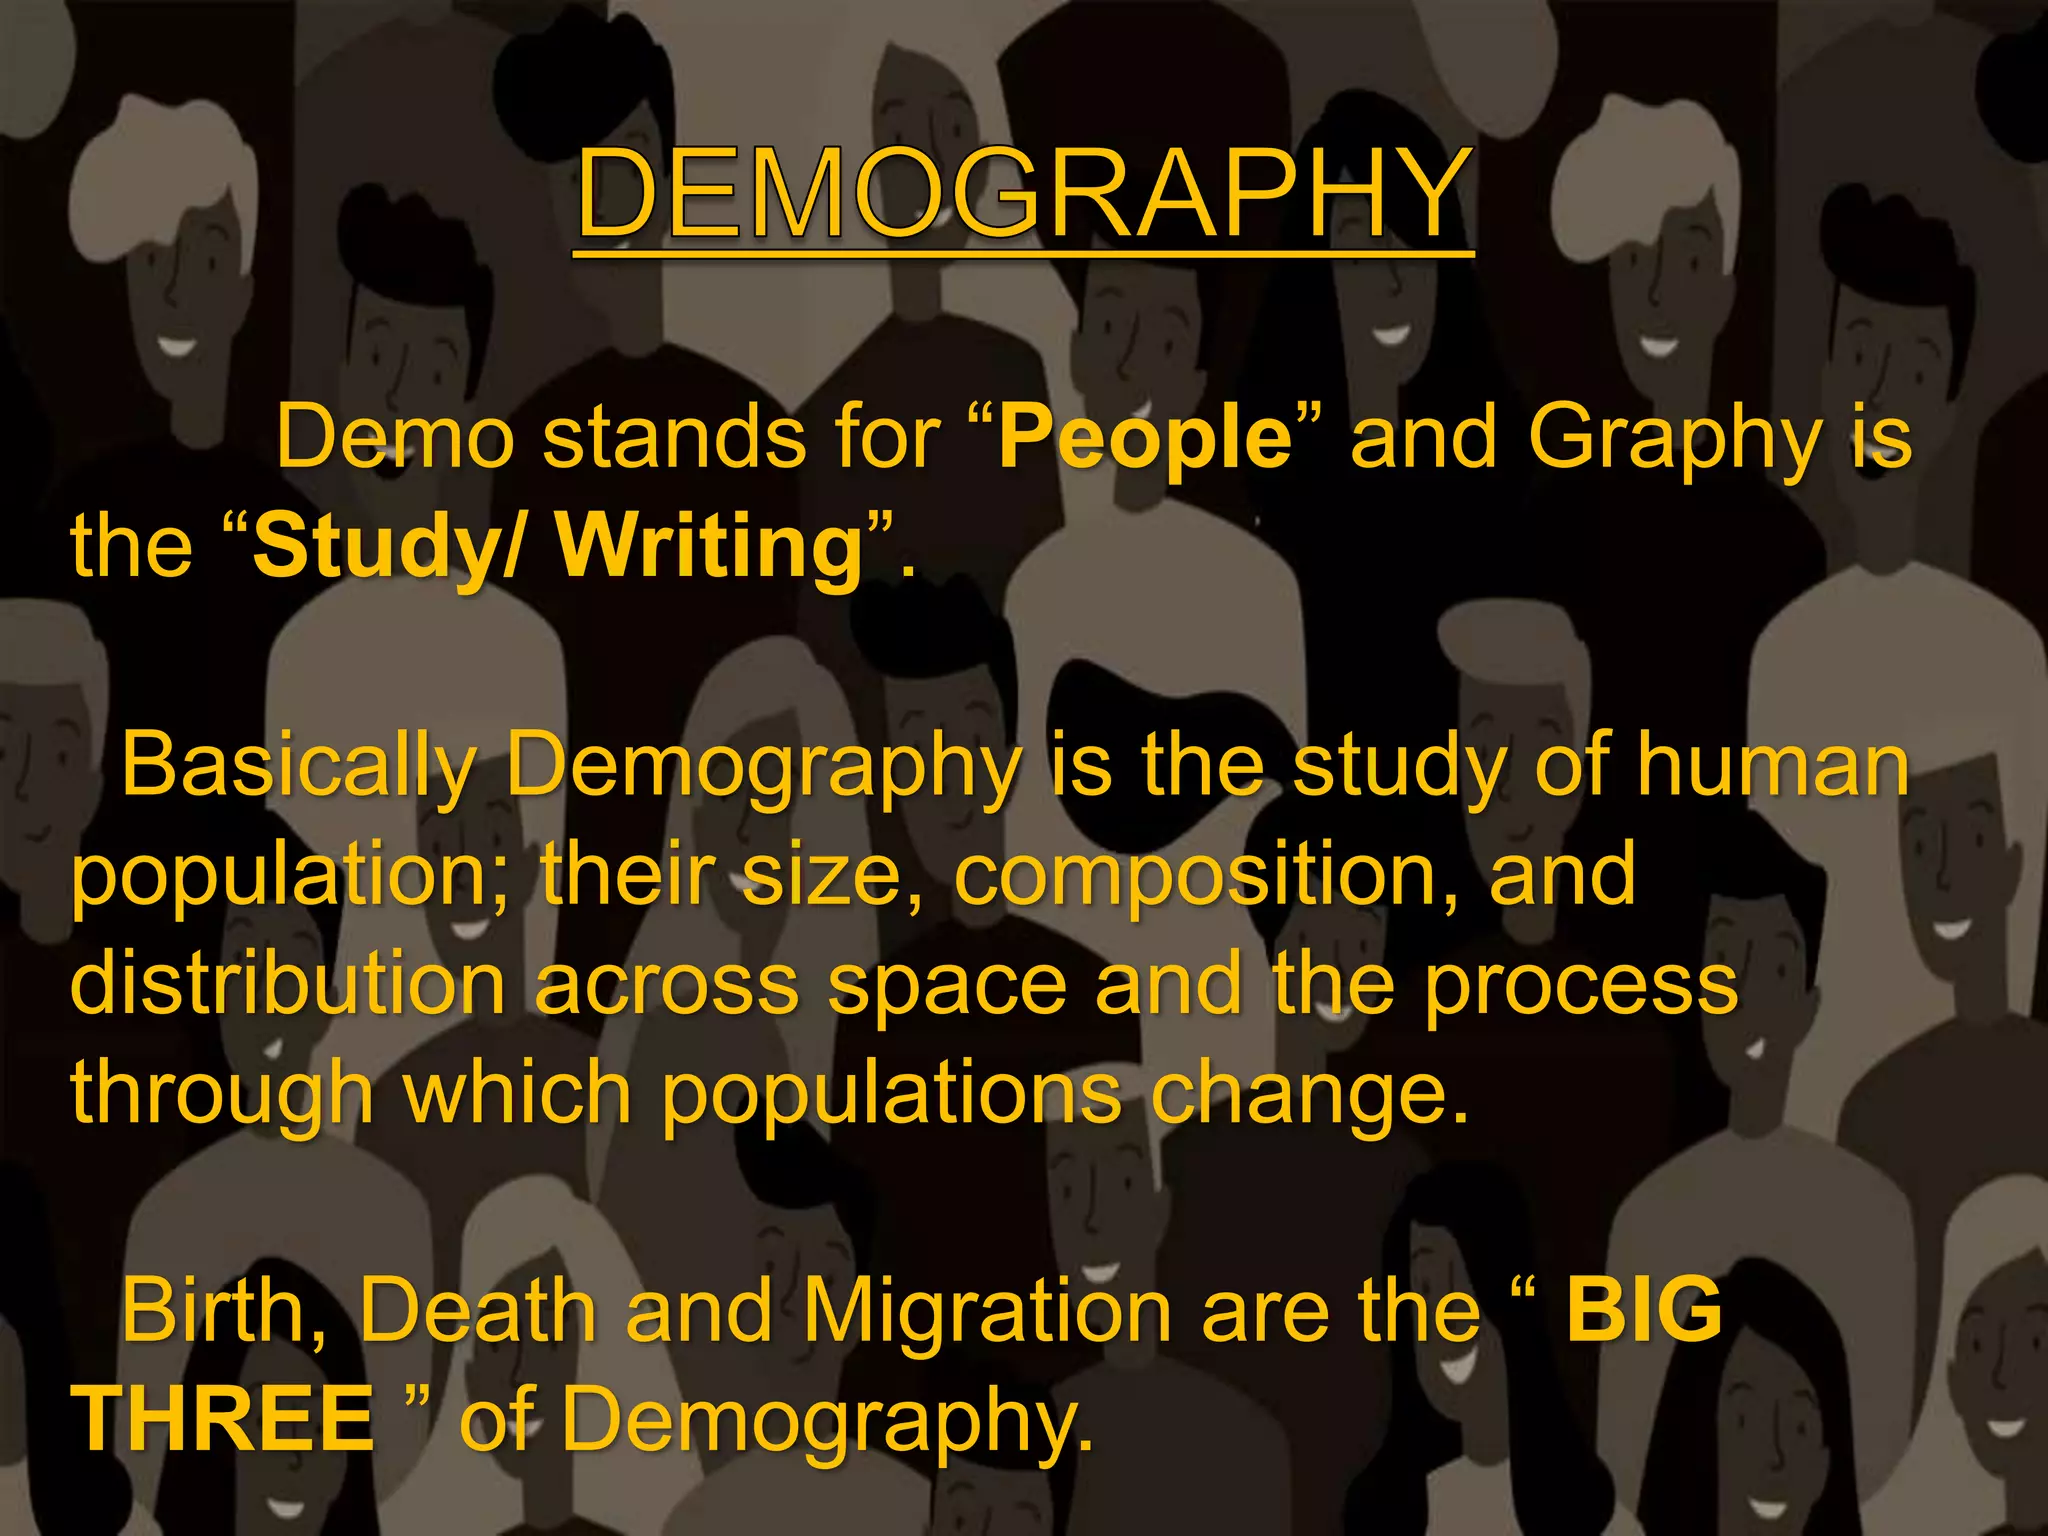
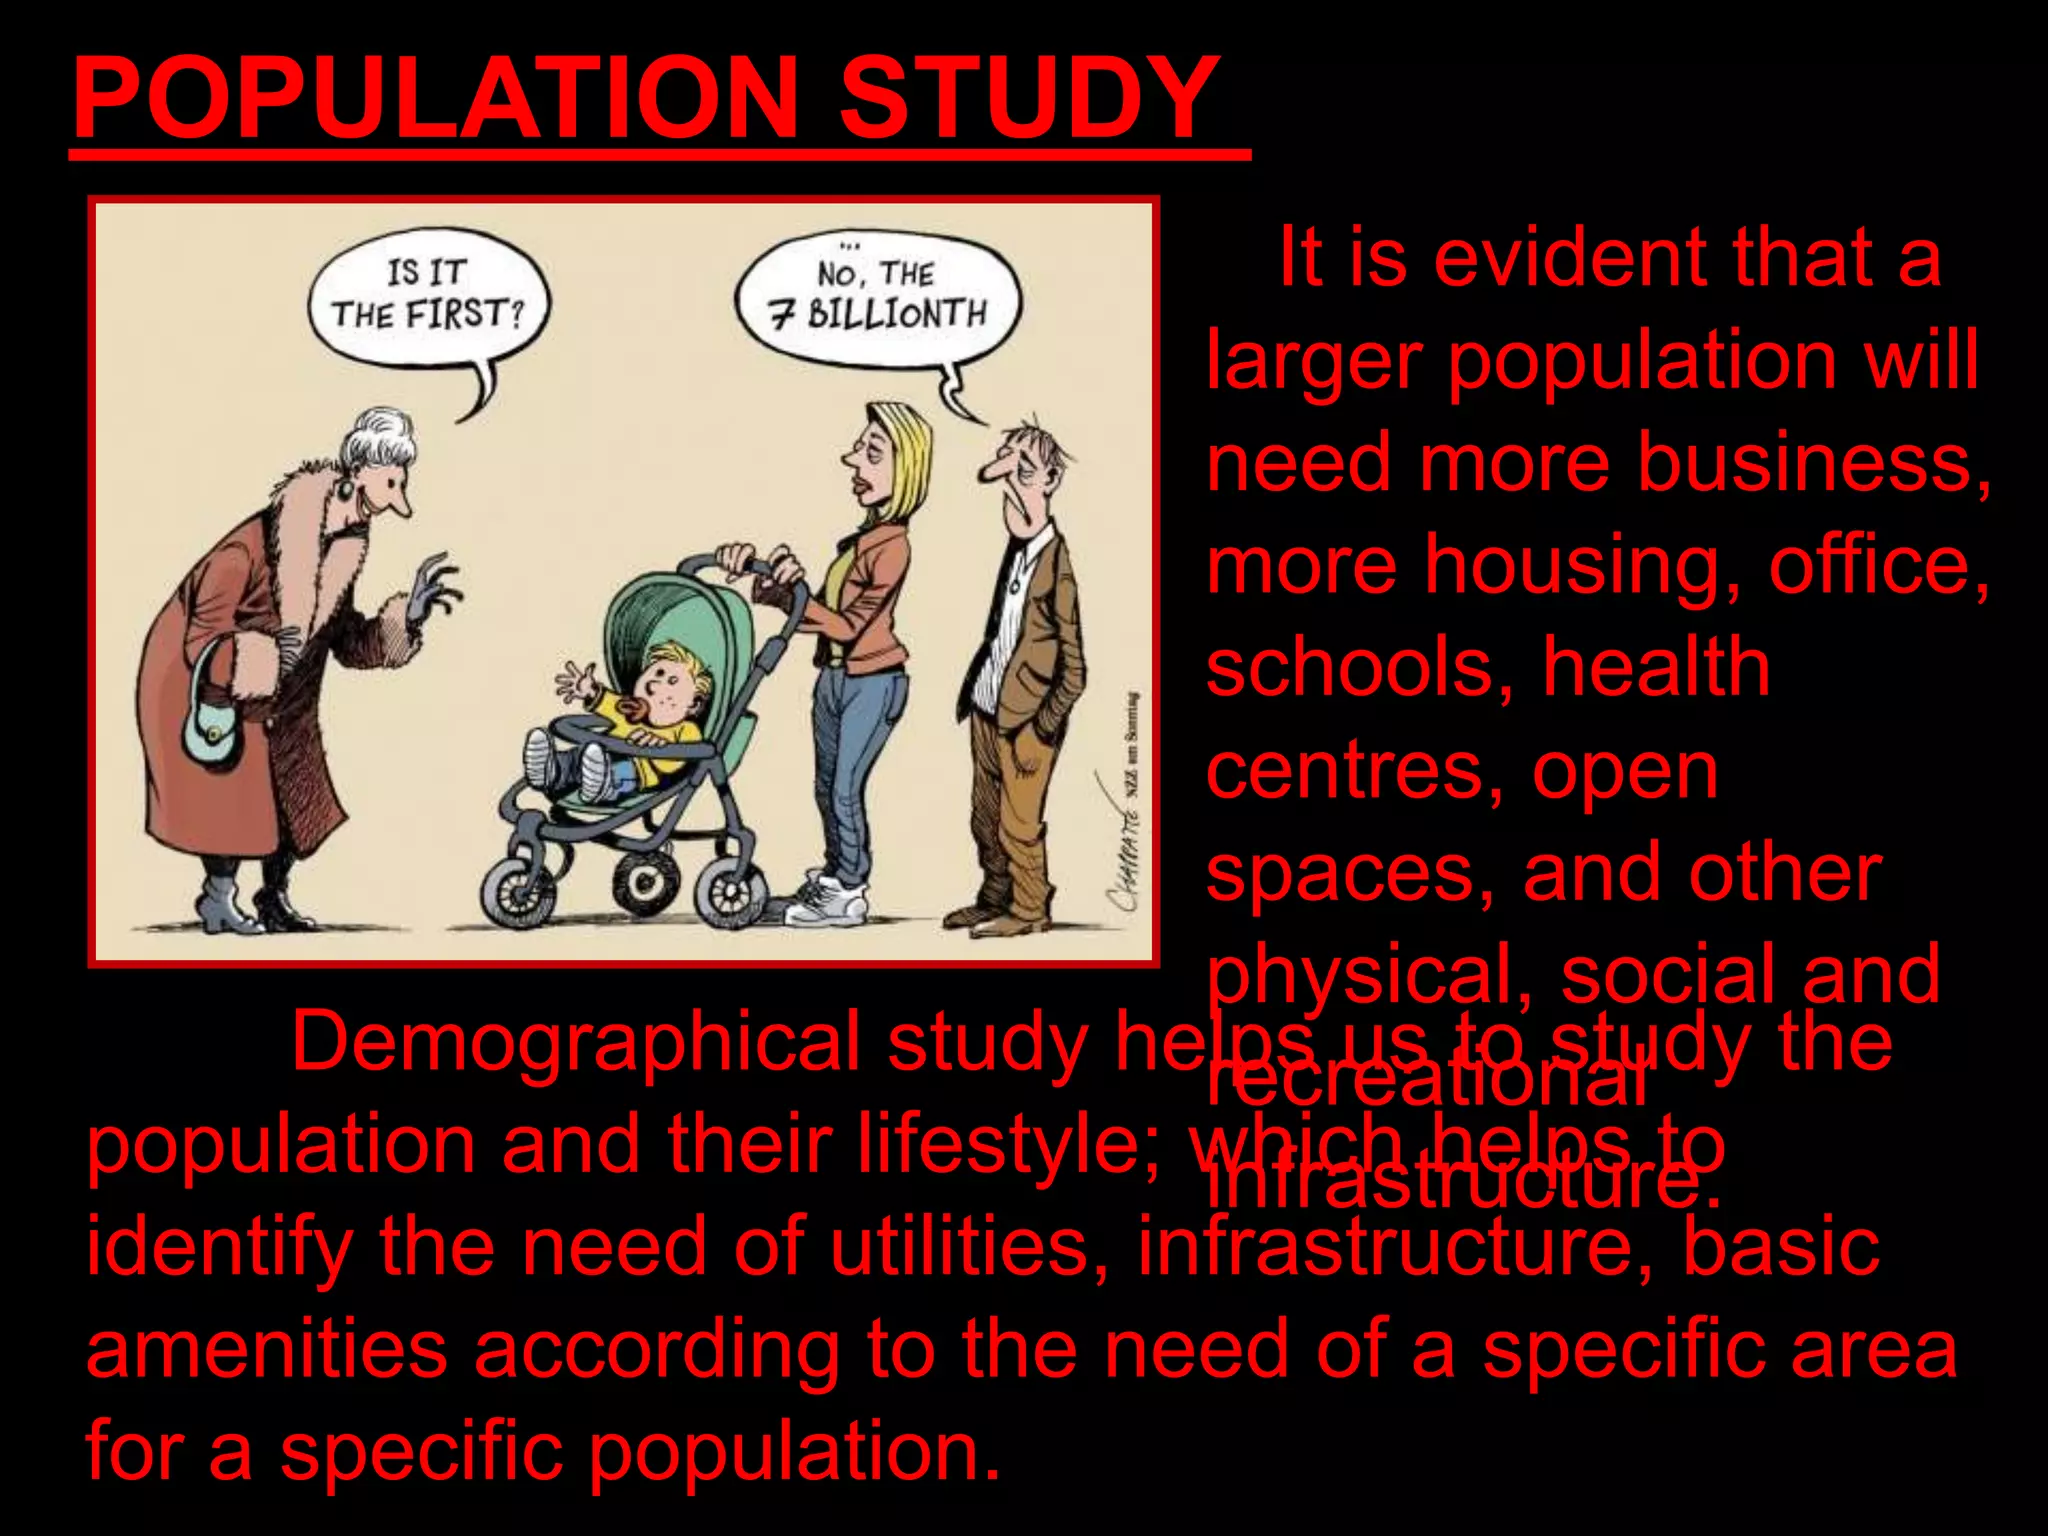
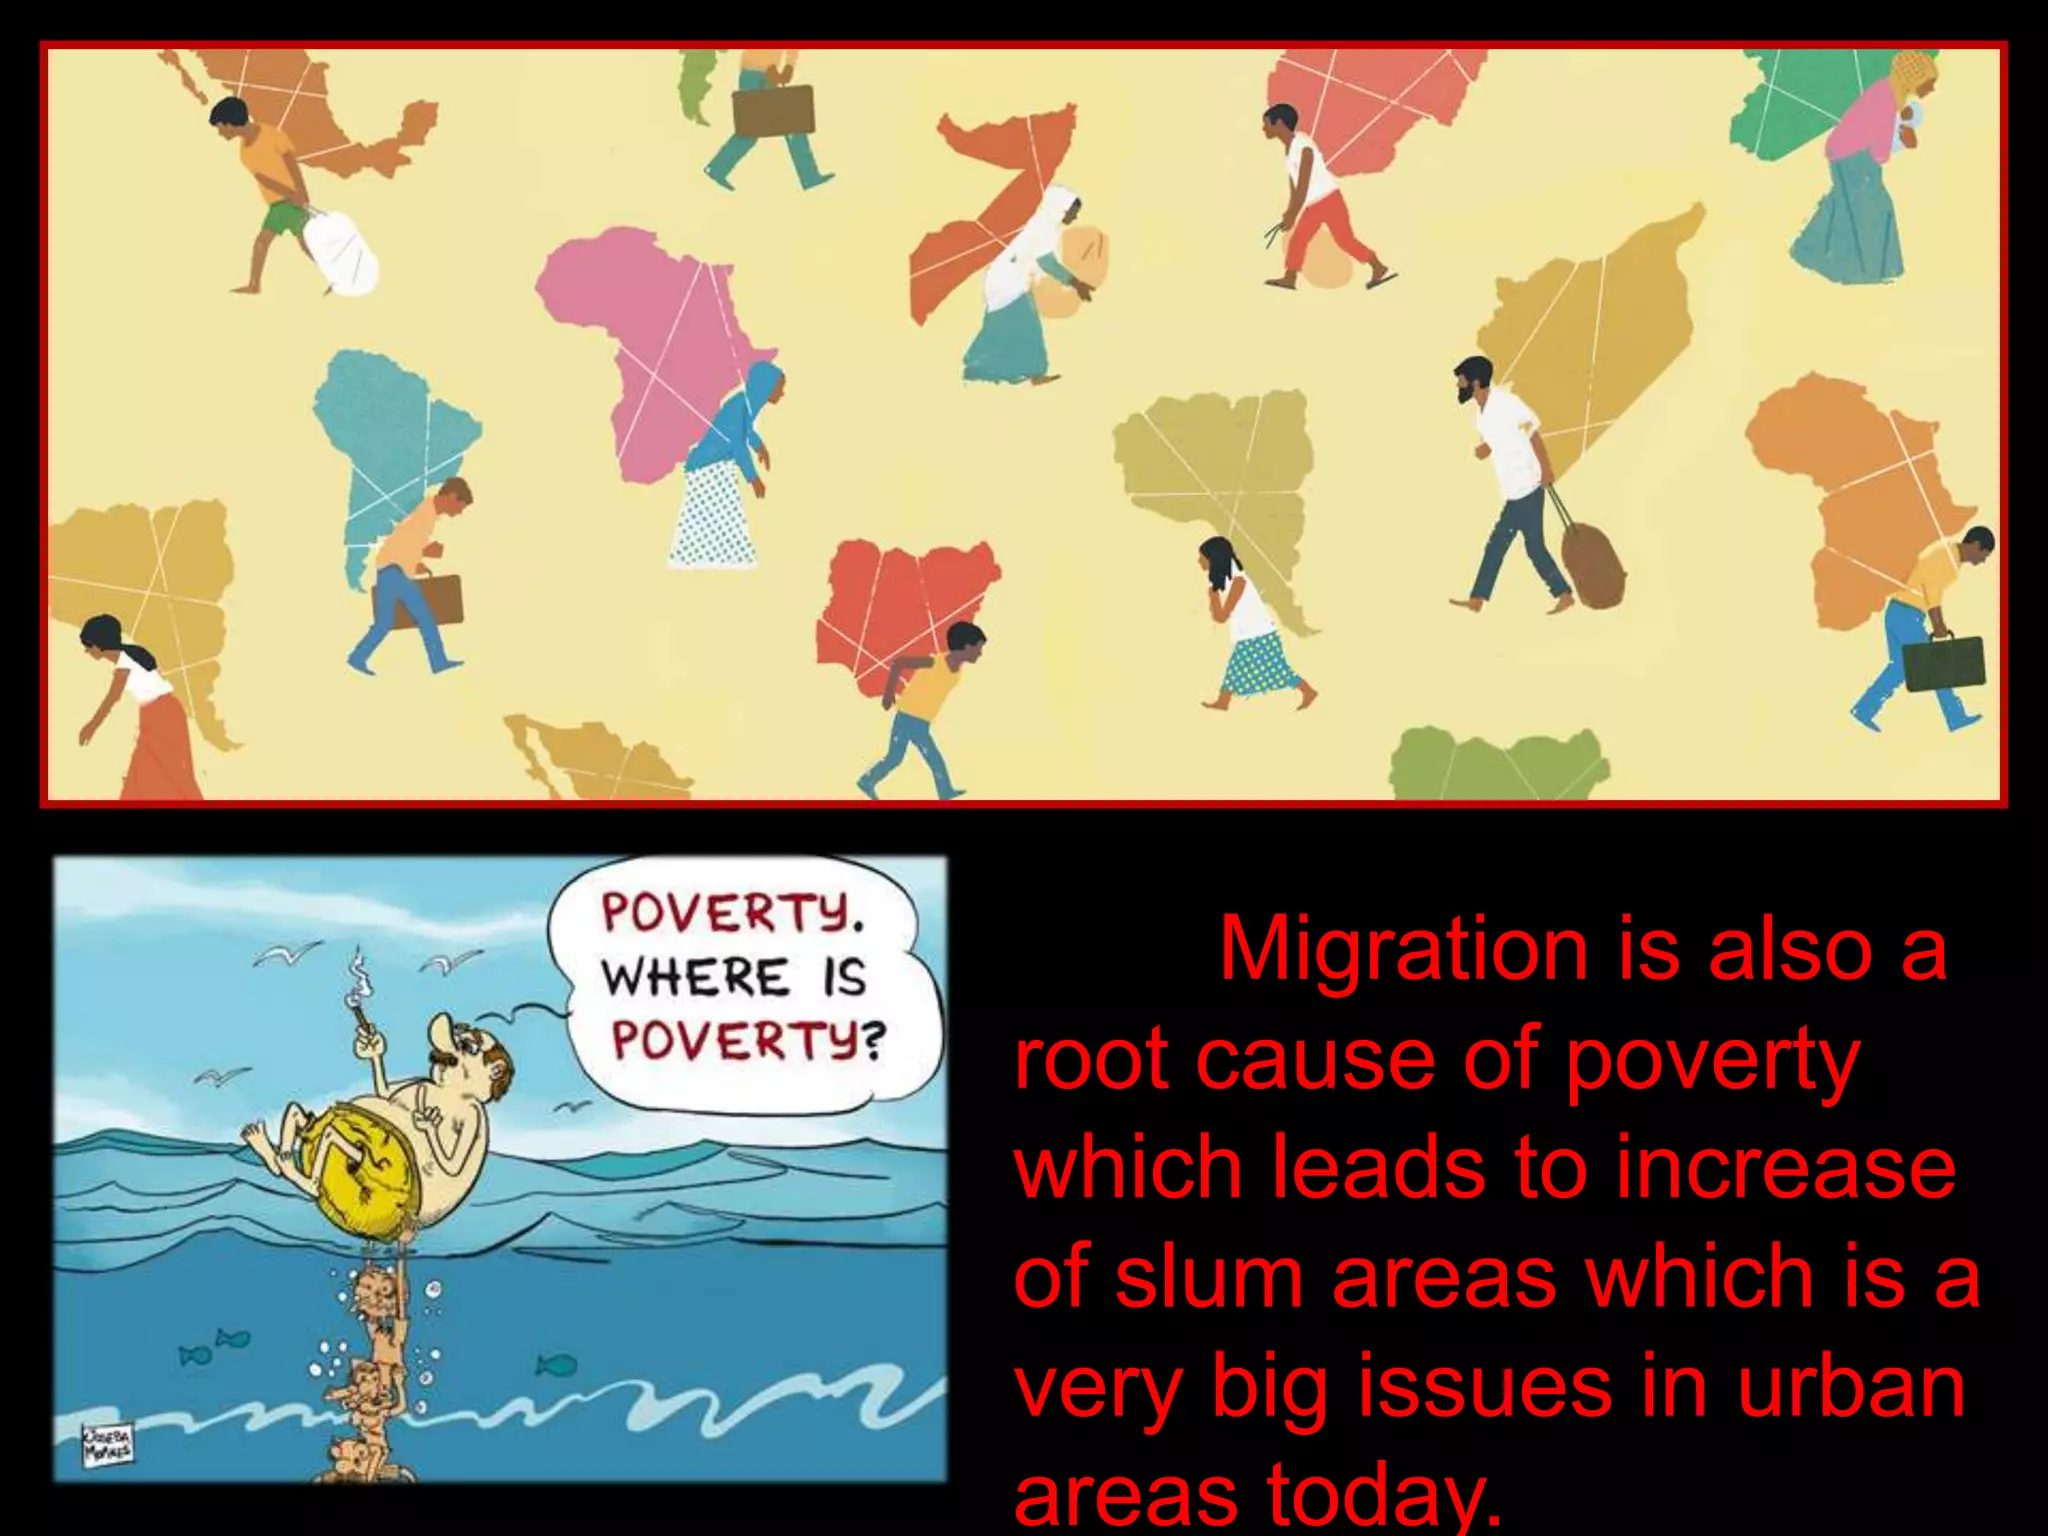
Demography is the study of human populations and how they change over time due to births, deaths, and migration. For city planners, demographic information from censuses is essential for planning housing, schools, hospitals, transportation, and other infrastructure needs. Population size, density, age distribution, and migration patterns affect what facilities a city requires. Planners must understand population characteristics to adequately plan utilities, amenities, and services for an area's residents. Demographic data helps identify the demand for healthcare, schools, parks and other resources based on a population's size, density, and age profile.
To plan a city/region, we require base data on which information extrapolation & decisions may happen. Hence, Identify ‘data needed’, and Identify ‘needs of data’ collection
Inspection survey:
A) Direct :
Observe traffic count/ situation
Observe housing quality
Observe economic activity
Observe social parameters, etc.
B) Indirect:
Clubbing of directly observed ‘indicators’ to generate area’s possible ‘proxy’.
For e.g. housing condition + plot sizes + no. & types of vehicles + consumer goods = income range
. Personal interview/ Dialogue:
A questionnaire is designed beforehand at appropriate scale:
Nominal Scale : Yes or No
Ordinal Scale : Possible options or multiple choice questions
Interval Scale : Range/ intervals like age group or income group
Structured questions are precise and one-way
Semi-structure survey is a two-way information flow. It’s an informal dialogue in which the surveyor might receive new information from respondent/s. however, it depends on;
Behavioural factors of surveyor and respondents
Questions not to be ambiguous or long
Managing conversation and seeking pin-point answers
Judging responses without bias
Recording interview
Avoiding errors
Cross-checking with other respondents
Major land uses to be identified for analysing physical distribution and existing conditions:
Developed
Under-developed
Un-developed
Major uses marked on map are as per the defined regional/city level plans, like;
Urbanizable zone
Industrial zone
Transportation & Communication zone
roads, railways, MRTS, Seaports, Dockyards, Airports, Bus depots/ terminals, freight complexes, transmission and communication
Primary activity zone
Agriculture, poultry, rural settlements, brick kilns, extraction areas
Open area zone
Recreation zone, green buffer zone
Protected/ Eco-sensitive zone
Water bodies, forests, sanctuaries, coastal zone, wetlands, marshy zone
special area zone
Heritage & conservation zone, scenic value, tourism zone, defence area/ zone, border conflict zone
Data regarding demographic characteristics;
Population growth (natural, induced)
Population size (age-wise)
Population density
Population distribution
Gender ratio
Socio-Economic status
Religion
Marital status
Education ratio
School dropouts
Gender-wise enrolment in schools, colleges
Mortality rate (age-wise)
Birth rate
Health rate (in some surveys)
Sample types for doing household/ demographic surveys;
Simple Random sampling
Systematic sampling
Stratified sampling
Cluster sampling
Multistage sampling
There are nine steps involved in the development of a questionnaire:
Decide the information required.
Define the target respondents.
Choose the method(s) of reaching your target respondents.
Decide on question content.
Develop simple & clear wording of questions
Put the questions into a meaningful order and format.
Check the length of the questionnaire.
Pre-test the questionnaire
Develop the final survey form.
types and contents for regional planning for block,district,state and nationgayathrysatheesan1
level planning framework. All planning activities at the district level will be with a single planning body at the district level. This body will be in line with Planning Boards at the state level and Planning Commission at the national level.
types and contents for regional planning for block,district,state and nation ppt
Land use and land value theory ppt
William Alonso In location theory William Alonso (Location and Land Use: Toward a General Theory of Land Rent, 1964) built upon the Thünen model to account for intra-urban variations in land use. He attempted to apply accessibility requirements to the city centre for various types of land use (housing, commercial,…
land use and land value theory of william alonso ppt
william alonso
TERMS OF DEMOGRAPHIC DATA SOURCES
Demography : study of statistical description and analysis of human population.
Population : summation of all the organism of the same group in a particular geographical area.
Population census : a complete population count at a point in time within a particular area.
Vital registration : registration on live Births, Deaths, Fetal deaths, Marriages, and Divorces.
Sample Survey: representative portion of the population .
DEMOGRAPHIC DATA
Demographic data is the study of the population its static and dynamic aspects.
Static aspect (age, sex, race etc.)
Dynamic aspect (fertility, morality, migration)
URBAN SPRAWL AND ITS CHANGING PARADIGMS A CASE STUDY OF JAIPUR CITYJournal For Research
There is widespread concern about understanding and curbing urban sprawl, which has been cited for its negative impacts on natural resources, economic development and quality of life of the society. There is not, however, a universally accepted definition of urban sprawl. It has been described using quantitative measures, qualitative terms, attitudinal explanations, and landscapes patterns. The increasing pace of urbanization is usually associated with and driven by the population concentration in an urban area over the periods. The extent of urbanization and its growth drives the change in land use land cover patterns results to urban areas continue to expand over the periods. So, this present study deals with the quantifying the spatial patterns in Jaipur city, analysis based on primary and secondary data collected from different sources, using the spatial analysis technique like Entropy Model for the detection of change in spatial and temporal variability of urban sprawl and the degree of spatial concentration or dispersion of geospatial variable. The boundary less cities are the new paradigms of development and Jaipur is no exception. The process of urban sprawl has been resulted due to the continuous industrial and economic development in the rural – urban fringe of the study area.
Von thunen’s model of agricultural land useThe Urban Unit
This presentation is based on a agricultural land use model around the city. This is the theory of urban Geography it describe the agricultural pattern and how should the agricultural activities perform around the city. basically this Model was put forwarded before industrialization and when there was no roads networks and this Model is not applicable in real word but is gives great ideas for developing new towns and cities.
Slides from ICWSM'17 workshop on Social Media for Demographic Research (Montreal, May 2017)
Overview of demography
How can demographers contribute to the analysis of big data (social media)? How can social media contribute to population studies?
Concerns over data quality.
Data Revolution and the SDGs: overview and value, huge challenges for attaining a economic-demographic-
environment balance, and the urgent need for data scientists and demographers to work on these issues.
Levelwise PageRank with Loop-Based Dead End Handling Strategy : SHORT REPORT ...Subhajit Sahu
Abstract — Levelwise PageRank is an alternative method of PageRank computation which decomposes the input graph into a directed acyclic block-graph of strongly connected components, and processes them in topological order, one level at a time. This enables calculation for ranks in a distributed fashion without per-iteration communication, unlike the standard method where all vertices are processed in each iteration. It however comes with a precondition of the absence of dead ends in the input graph. Here, the native non-distributed performance of Levelwise PageRank was compared against Monolithic PageRank on a CPU as well as a GPU. To ensure a fair comparison, Monolithic PageRank was also performed on a graph where vertices were split by components. Results indicate that Levelwise PageRank is about as fast as Monolithic PageRank on the CPU, but quite a bit slower on the GPU. Slowdown on the GPU is likely caused by a large submission of small workloads, and expected to be non-issue when the computation is performed on massive graphs.
Chatty Kathy - UNC Bootcamp Final Project Presentation - Final Version - 5.23...John Andrews
SlideShare Description for "Chatty Kathy - UNC Bootcamp Final Project Presentation"
Title: Chatty Kathy: Enhancing Physical Activity Among Older Adults
Description:
Discover how Chatty Kathy, an innovative project developed at the UNC Bootcamp, aims to tackle the challenge of low physical activity among older adults. Our AI-driven solution uses peer interaction to boost and sustain exercise levels, significantly improving health outcomes. This presentation covers our problem statement, the rationale behind Chatty Kathy, synthetic data and persona creation, model performance metrics, a visual demonstration of the project, and potential future developments. Join us for an insightful Q&A session to explore the potential of this groundbreaking project.
Project Team: Jay Requarth, Jana Avery, John Andrews, Dr. Dick Davis II, Nee Buntoum, Nam Yeongjin & Mat Nicholas
As Europe's leading economic powerhouse and the fourth-largest hashtag#economy globally, Germany stands at the forefront of innovation and industrial might. Renowned for its precision engineering and high-tech sectors, Germany's economic structure is heavily supported by a robust service industry, accounting for approximately 68% of its GDP. This economic clout and strategic geopolitical stance position Germany as a focal point in the global cyber threat landscape.
In the face of escalating global tensions, particularly those emanating from geopolitical disputes with nations like hashtag#Russia and hashtag#China, hashtag#Germany has witnessed a significant uptick in targeted cyber operations. Our analysis indicates a marked increase in hashtag#cyberattack sophistication aimed at critical infrastructure and key industrial sectors. These attacks range from ransomware campaigns to hashtag#AdvancedPersistentThreats (hashtag#APTs), threatening national security and business integrity.
🔑 Key findings include:
🔍 Increased frequency and complexity of cyber threats.
🔍 Escalation of state-sponsored and criminally motivated cyber operations.
🔍 Active dark web exchanges of malicious tools and tactics.
Our comprehensive report delves into these challenges, using a blend of open-source and proprietary data collection techniques. By monitoring activity on critical networks and analyzing attack patterns, our team provides a detailed overview of the threats facing German entities.
This report aims to equip stakeholders across public and private sectors with the knowledge to enhance their defensive strategies, reduce exposure to cyber risks, and reinforce Germany's resilience against cyber threats.
2. Demo stands for “People” and Graphy is
the “Study/ Writing”.
Basically Demography is the study of human
population; their size, composition, and
distribution across space and the process
through which populations change.
Birth, Death and Migration are the “ BIG
THREE ” of Demography.
4. Demographic Process observes intimately
the structure, size and distribution of the
population by the above five studies.
SIZE – It is the number of persons in the
population.
STRUCTURE – Distribution of population
among its sex and age groupings.
DISTRIBUTION – The arrangement of the
population in space at a given time.
5. For planners, census information is used
in just about all planning decisions.
Census provides information like age, sex
distribution, household composition their size
etc.
The census of housing allows planners to
access changes in the quality of housing and
related facilities and plan for future housing
needs.
From Census, we get some vital aspects
of demography, which are essential elements
for planning a city.
6. POPULATION STUDY
It is evident that a
larger population will
need more business,
more housing, office,
schools, health
centres, open
spaces, and other
physical, social and
recreational
infrastructure.
Demographical study helps us to study the
population and their lifestyle; which helps to
identify the need of utilities, infrastructure, basic
amenities according to the need of a specific area
for a specific population.
7. POPULATION DENSITY
Some times it is
observed that
population density in
a study area is a big
problem rather than
high population.
It is due to higher
density in a
respectively smaller
area with limited
facilities.
Population density can grow and shrink a
particular city, and can result vertical or horizontal
growth of that city.
Hence density study makes planners aware
of the future of a particular city and some
8.
9. Migration is also a
root cause of poverty
which leads to increase
of slum areas which is a
very big issues in urban
areas today.
10. AGE PATTERN
Age pattern study is basically related with
fertility, mortality, infant mortality, marriage etc.
and driven by natural, environmental characters
also.
11. Demography also
includes the study of
different age
categories.
The issues of aging is
related with different
social, political and
financial issues.
Based on financial and economic view, a
very important issue is the demand, health and
consumption pattern of elderly people. This
survey is mainly analyzed by marketing
scientists, health care sectors.
Example : Suppose a place contains relatively
higher number of elderly people. So during the
area’s spatial plan, medical facilities must be
12. Likewise in an area where children are more
in number, must provides with parks, schools,
playgrounds etc.