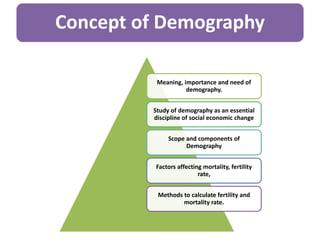
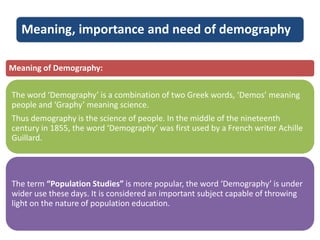
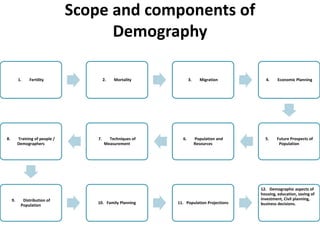
Marketing Management Business Plan_My Sweet Creations
Business Demography PowerPoint presentation
1. Business Demography
Dr. Mangesh M. Bhople,
Asst. Professor,
Department of BBA and BBA IB, MAEER’s MIT Arts
Commerce and Science College Alandi Pune
2. Program objectives
1. To give proper
understanding regarding
concept of demography in
modern economic setup
2. To study how population
and structure changes
affecting quality of life and
business
3. To develop clarity of
concept regarding social
economic process and
urbanization and its impact on
society
3. Concept of Demography
Meaning, importance and need of
demography.
Study of demography as an essential
discipline of social economic change
Scope and components of
Demography
Factors affecting mortality, fertility
rate,
Methods to calculate fertility and
mortality rate.
4. Meaning, importance and need of demography
Meaning of Demography:
The word ‘Demography’ is a combination of two Greek words, ‘Demos’ meaning
people and ‘Graphy’ meaning science.
Thus demography is the science of people. In the middle of the nineteenth
century in 1855, the word ‘Demography’ was first used by a French writer Achille
Guillard.
The term “Population Studies” is more popular, the word ‘Demography’ is under
wider use these days. It is considered an important subject capable of throwing
light on the nature of population education.
5. Definitions of Demography
The term demography has been defined both in a narrow and
broad sense.
The Oxford Dictionary of Economics defines demography as “The
study of the characteristics of human populations.” According to
the UN Multilingual Demographic Dictionary, “Demography is the
scientific study of human populations, primarily with respect to
their size, their structure and their development.”
According to Barckley, “The numerical portrayal of human
population is known as demography.”
6. Definitions of Demography
According to Hauser and Duncan, “Demography is the
study of size, territorial distribution and composition of
population, changes therein, and the components of such
changes, which may be identified as natality, mortality,
territorial movement (migration), and social mobility
(change of status).”
According to Frank Lorimer, “In broad sense, demography
includes both demographic analysis and population
studies. A broad study of demography studies both
qualitative and quantitative aspects of population.”
7. Importance and need of Demography
(1) For the Economy: The study of demography is of immense importance to an economy. Population studies help us to know how far the
growth rate of the economy is keeping pace with the growth rate of population. If population is increasing at a faster rate, the pace of
development of the economy will be slow. The government can undertake appropriate measures to control the growth of population and to
accelerate the development of the economy. Rapid population growth reduces per capita income, lowers the standard of living, plunges the
economy into mass unemployment and under employment, brings environmental damage and puts a burden on existing social infrastructure.
Population studies highlight these problems of the economy to be solved by the government.
(2) For Society: Population studies have much importance for the society. When population is increasing rapidly, the society is faced with
innumerable problems. Shortages of basic services like water, electricity, transport and communications, public health, education, etc. arise.
Along with these, problems of migration and urbanization are associated with the growing population which further lead to the law and order
problem. Faced with such problems which are the concomitant result of population growth, the state and non-government social
organizations can adopt appropriate measures to solve them.
(3) For Economic Planning: Data relating to the present trend in population growth help the planners in formulating policies for the economic
plan of the country. They are kept in view while fixing targets of agricultural and industrial products, of social and basic services like schools
and other educational institutions, hospitals, houses, electricity, transport, etc. Population data are also used by the planners to project future
trends in fertility and to formulate policy measures to control the birth rate. Based on population data, projections are made about the
increase in labour force, and the number of people in the age-groups 1-15 years, 15-50 years and above in order to estimate the labour force
available for productive employment. This, in turn, helps in making estimates regarding employment to be generated during the plan period.
(4) For Administrators: Population studies are also useful for administrators who run the government. In under-developed countries, almost
all social and economic problems are associated with the growth of population. The administrator has to tackle and find solutions to the
problems arising from the growth of population. They are migration and urbanization which lead to the coming up of shanty towns, pollution,
drainage, water, electricity, transport, etc. in cities. These require improvement of environmental sanitation, removal of stagnant and polluted
water, slum clearance, better housing, efficient transport system, clean water supply, better sewerage facilities, control of communicable
diseases, provision of medical and health services, especially in maternal and child welfare by opening health centers, opening of schools, etc.
(5) For Political System: The knowledge of demography is of immense importance for a democratic political system. It is on the basis of the
census figures pertaining to different areas that the demarcation of constituencies is done by the election commission of a country. The
addition to the number of voters after each election helps to find out how many have migrated from other places and regions of the country.
Political parties are able to find out from the census data the number of male and female voters, their level of education, their age structure,
their level of earning, etc. On these basis, political parties can raise issues and promise solutions in their election manifestos at the time of
elections.
8. Subject Matter of Demography
Size and Shape of Population
Aspects Related to Birth Rate and Death Rate
Migration of the people
Composition and Density of Population
Socio-Economic Problems:
Quantitative and Qualitative Aspects elated to population:
Distribution of Population
Sex ratio
Literacy
https://www.youtube.com/watch?v=1aiI-D-XIng
9. Population studies include:
Theoretical Models: There are vast
theoretical aspects of population
studies which include the various
theories of population propounded by
sociologists, biologists, demographers
and economists, and theories of
migration and urbanisation.
Practical Aspects: Practical aspects
of population studies relate to the
various methods of measuring
population changes such as the
census methods, age pyramids,
population projections, etc.
Population Policy: Population
policy is an important subject of
demography especially in the context
of developing countries. It includes
policies for population control, and
family planning strategies;
reproductive health, maternal
nutrition and child health policies;
policies for human development of
different social groups, etc., and the
effects of such policies on the total
population of the country.
Micro vs Macro Study: The true
scope of demography relates to
whether it is a micro or macro study.
Micro Demography: Micro
demography is the narrow view of
population studies. Among others,
Hauser and Duncan include the
study of fertility, mortality,
distribution, migration, etc. of an
individual, a family or group of a
particular city or area or community.
Macro Demography: A majority of
writers take the macro view of
population studies and include the
qualitative aspects of demography.
To them, demography includes the
interrelationships between
population and social, economic and
cultural conditions of the country
and their effects on population
growth.
https://www.youtube.com/
watch?v=PUwmA3Q0_OE
https://www.youtube.com/watch
?v=ZiO6UyfZy9A&feature=youtu.
be Amazon policy
10. Scope and components of
Demography
1. Fertility 2. Mortality 3. Migration 4. Economic Planning
5. Future Prospects of
Population
6. Population and
Resources
7. Techniques of
Measurement
8. Training of people /
Demographers
9. Distribution of
Population
10. Family Planning 11. Population Projections
12. Demographic aspects of
housing, education, saving of
investment, Civil planning,
business decisions.
11. Business Demography
Business demography entails the application of
demographic concepts, data, and techniques to the
practical concerns of business decision makers.
This loosely organized field includes but is not
limited to site selection, sales forecasting, financial
planning, market assessment, consumer profiles,
target marketing, legal process support, and labor
force analysis.
Specific applications have evolved over time,
reflecting changes in data sources, computer
technology, statistical techniques, and the business
environment.
12. Need and Importance of Demographic
studies for business
Business
Demograph
ic Studies
Human
Resource
Manageme
nt Business
Site
selection
Business
Investment
Marketing
and Retail
Chain
Future
Opportunitie
s
Product
Selection
Expansion
Strategies
Purchase
Power
13. Fertility and Mortality
Birth rate and Death rate
• Fertility is measured by a
combination of four classical
parameters:
1. Birthrate (number of births
per 1,000 total population);
2. Fertility rate (birthrate per
1,000 women fifteen to
forty-nine years old)
3. Reproduction rate (average
number of girls born per
woman),
4. Actual fertility (average
total number of births per
woman).
• Mortality, the number of
deaths per 1,000
population
14. Fertility and Mortality
The crude birth rate, the annual number of live births per 1,000 people. Crude Birth Rate = No. of Births / 1000 Population
The general fertility rate, the annual number of live births per 1,000 women of childbearing age (often taken to be from 15 to 49 years old, but sometimes from 15 to 44).
The age-specific fertility rates, the annual number of live births per 1,000 women in particular age groups (usually age 15–19, 20-24 etc.)
The crude death rate, the annual number of deaths per 1,000 people. . Crude Death Rate = No. of Deaths / 1000 Population
Maternal death or maternal mortality is defined by the World Health Organization (WHO) as "the death of a woman while pregnant or within 42 days of termination
of pregnancy, irrespective of the duration and site of the pregnancy, from any cause related to or aggravated by the pregnancy or its management but not from accidental or
incidental causes.
The infant mortality rate, the annual number of deaths of children less than 1 year old per 1,000 live births.
The expectation of life (or life expectancy), the number of years that an individual at a given age could expect to live at present mortality levels.
The total fertility rate, the number of live births per woman completing her reproductive life, if her childbearing at each age reflected current age-specific fertility rates.
The replacement level fertility, the average number of children women must have in order to replace the population for the next generation.
The gross reproduction rate, the number of daughters who would be born to a woman completing her reproductive life at current age-specific fertility rates.
The net reproduction ratio is the expected number of daughters, per newborn prospective mother, who may or may not survive to and through the ages of childbearing.
A stable population, one that has had constant crude birth and death rates for such a long period of time that the percentage of people in every age class remains constant,
or equivalently, the population pyramid has an unchanging structure.
A stationary population, one that is both stable and unchanging in size (the difference between crude birth rate and crude death rate is zero).
15. Demographic Chart of India
Largest cities or towns in India
2011 Census of India
Rank Name State/UT Pop. Rank Name State/UT Pop.
1 Mumbai Maharashtra 12,478,447 11 Kanpur Uttar Pradesh 2,920,067
2 Delhi Delhi 11,007,835 12 Lucknow Uttar Pradesh 2,901,474
3 Bangalore Karnataka 8,425,970 13 Nagpur Maharashtra 2,405,421
4 Hyderabad Telangana 6,809,970 14 Indore Madhya Pradesh 1,960 521
5 Ahmedabad Gujarat 5,570,585 15 Thane Maharastra 1,818,872
6 Chennai Tamil Nadu 4,681,087 16 Bhopal Madhya Pradesh 1,795,648
7 Kolkata West Bengal 4,486,679 17 Visakhapatnam Andhra Pradesh 1,730,320
8 Surat Gujarat 4,462,002 18
Pimpri-
Chinchwad
Maharashtra 1,729,359
9 Pune Maharashtra 3,115,431 19 Patna Bihar 1,683,200
10 Jaipur Rajasthan 3,073,350 20 Ludhiana Punjab 1,613,878
16. Structure of the population
Population by age group
Age group Male Female Total Percentage (%)
0–4 58,632,074 54,174,704 112,806,778 9.32
5–9 66,300,466 60,627,660 126,928,126 10.48
10–14 69,418,835 63,290,377 132,709,212 10.96
15–19 63,982,396 56,544,053 120,526,449 9.95
20–24 57,584,693 53,839,529 111,424,222 9.20
25–29 51,344,208 50,069,757 101,413,965 8.38
30–34 44,660,674 43,934,277 88,594,951 7.32
35–39 42,919,381 42,221,303 85,140,684 7.03
40–44 37,545,386 34,892,726 72,438,112 5.98
45–49 32,138,114 30,180,213 62,318,327 5.15
50–54 25,843,266 23,225,988 49,069,254 4.05
55–59 19,456,012 19,690,043 39,146,055 3.23
60–64 18,701,749 18,961,958 37,663,707 3.11
65–69 12,944,326 13,510,657 26,454,983 2.18
70–74 9,651,499 9,557,343 19,208,842 1.59
75–79 4,490,603 4,741,900 9,232,503 0.76
80–84 2,927,040 3,293,189 6,220,229 0.51
85–89 1,120,106 1,263,061 2,383,167 0.20
90–94 652,465 794,069 1,446,534 0.12
95–99 294,759 338,538 633,297 0.05
100+ 289,325 316,453 605,778 0.05
Unknown 2,372,881 2,116,921 4,489,802 0.37
Total 623,270,258 587,584,719 1,210,854,977 100.00
Structure of the population (9 February 2011) (Census) age wise are shown below:
17. Factors affecting Fertility and Mortality
Fertility
Demographic Factors such as Age, sex etc.
Biological factors such as health other
issues
Social factors such as early and late
marriages, family size, education etc
Cultural factors such preferences to boy or
girl babies
Economic factors such as income, lifestyle,
capacity to grow up children
Environmental Factors such as air, water,
food, pollution, disasters etc.
Urbanization and Industrialization
Mortality
Environmental Factors such as air, water,
food, pollution, disasters etc.
Demographic Factors such as Age, sex etc.
Biological factors such as health other issues,
spread of diseases, immunity power
Occupational risks
Urbanization and Industrialization
Economic conditions
Cultural factors / taboos
18. Migration
• Human migration involves the movement of
people from one place to another with intentions
of settling, permanently or temporarily, at a new
location (geographic region)
• Lee's laws divide factors causing migrations into
two groups of factors: push and pull factors.
• Push factors are things that are unfavourable
about the area that one lives in, and pull factors
are things that attract one to another area
20. Class Activity
• What factor attracts/distracts you for migrating
to other places
• https://www.mentimeter.com/s/32639b2a2723
816fed82732e0ac9a56a
• https://www.menti.com/qqmmwtyb2w
21.
22.
23. Push Factors
• Not enough jobs
• Few opportunities
• Inadequate conditions
• Desertification
• Famine or drought
• Political fear Slavery or forced labor
• Poor medical care
• Loss of wealth
• Natural disasters
• Death threats
• Desire for more political or religious freedom
• Pollution
• Poor housing
• Landlord/tenant issues
• Bullying
• Mentality
• Discrimination
• Poor chances of marrying
• Condemned housing (radon gas, etc.)
• War
• Radiation
• Disease
Pull Factors
• Job opportunities
• Better living conditions
• The feeling of having more
political or religious freedom
• Enjoyment
• Education
• Better medical care
• Attractive climates
• Security
• Family links
• Industry
• Better chances of marrying
24. Some important References
• https://www.youtube.com/watch?v=gFftIDb6C6E
Population from 1950 -2020
• https://censusindia.gov.in/2011census/migration.html
• https://en.wikipedia.org/wiki/Demographics_of_India
• https://shodhganga.inflibnet.ac.in/bitstream/10603/16673
4/13/13_chapter%206.pdf Methods to Calculate Birth rate
and death rate
• https://www.worldbank.org/en/research
• https://www.censusindia.gov.in/2011census/censusdata2k
11.aspx
• http://udise.schooleduinfo.in/dashboard/demography#/
25. Unit 2 - Distribution of population
and population growth
Density and
population
distribution
Concept of over
and under
population
Method of
assessment of
population growth
26. • Population distribution is the spread of people across
the world, ie where people live.
• Population density is the number of people living in a
particular area – usually 1 square kilometre – and can
be written as total population/land area.
• The population of the world is now over 7 billion
people, the vast majority of whom live in the
developing world. The world’s population is spread
unevenly across the globe with concentrations of large
numbers of people living in the same area. The world
as a whole has more ‘empty’ areas than ‘crowded’
areas.
• https://www.youtube.com/watch?v=lZAYOR6k_U0
• https://www.youtube.com/watch?v=yM45jMmLdls
27. • India’s population is 17 percent of the global
population. Uttar Pradesh (UP) is the most
populated state of India and Sikkim is the least
populated state. There are several factors
affecting the distribution of the population
28. • The main factors determining population distribution are
• climate,
• landforms,
• topography,
• soil,
• energy and mineral resources,
• accessibility like distance from sea coast,
• natural harbours, navigable rivers or canals, cultural factors, political
boundaries, controls on migration and trade, government policies, types
of economic activities, technology including type of farming and
transportation facilities, social organization and but not the least,
demographic factors like changes in natural increase and migration.
• Adverse physical conditions and lack of sufficient opportunities for
means of livelihood have been mainly responsible for discouraging
inhabitation in certain areas. Climatic conditions are perhaps the most
important of all the geographic influences on population distribution.
Apart from physical factors several social, demographic, economic,
political and historical factors affect population distribution.
29. Topography People prefer living on plains rather than plateaus and mountains since these areas are suitable for
agriculture, manufacturing and also service activities. The Ganga Plains are one of the most
densely populated areas of the world whereas mountains like the Alps, Andes and the Himalayas
are thinly populated.
Climate People generally stay away from extreme climates (very cold or very hot) like the Sahara desert, the
Russian Polar regions, Canada and Antarctica.
Soil Fertile soils offer optimal land for farming. Fertile plains like Brahmaputra and Ganga and in India,
the Nile in Egypt, Hwang-He and Chang Jiang in China are highly populated.
Water People prefer to live in those places where freshwater is easily available. So, the river valleys are
densely populated and the deserts have less population.
Minerals Places with deposits of mineral are naturally more populated. Diamond mines of South Africa and
discovery of oil in the Middle East led to people settling down in these areas. In India, the areas of
the Chhota Nagpur Plateau in Jharkhand and nearby areas of Odisha see a high population
distribution because of the presence of huge mineral deposits.
Factors affecting the Population Distribution and Density:
Geographical Factors
30. Other factors the population
distribution and Density
• Social, Cultural and Economic Factors
• Social: Areas with better housing, health facilities and
education are more populated e.g., Pune. Better
transport facilities also contribute to the increased
population of any region.
• Cultural: Places with cultural or/and religious import
attract people. Example: Varanasi, Jerusalem and
Vatican city.
• Economic: Industrial areas offer employment
opportunities. A large number of people make their
way into these areas. Examples: Mumbai in India and
Osaka in Japan.