Demand
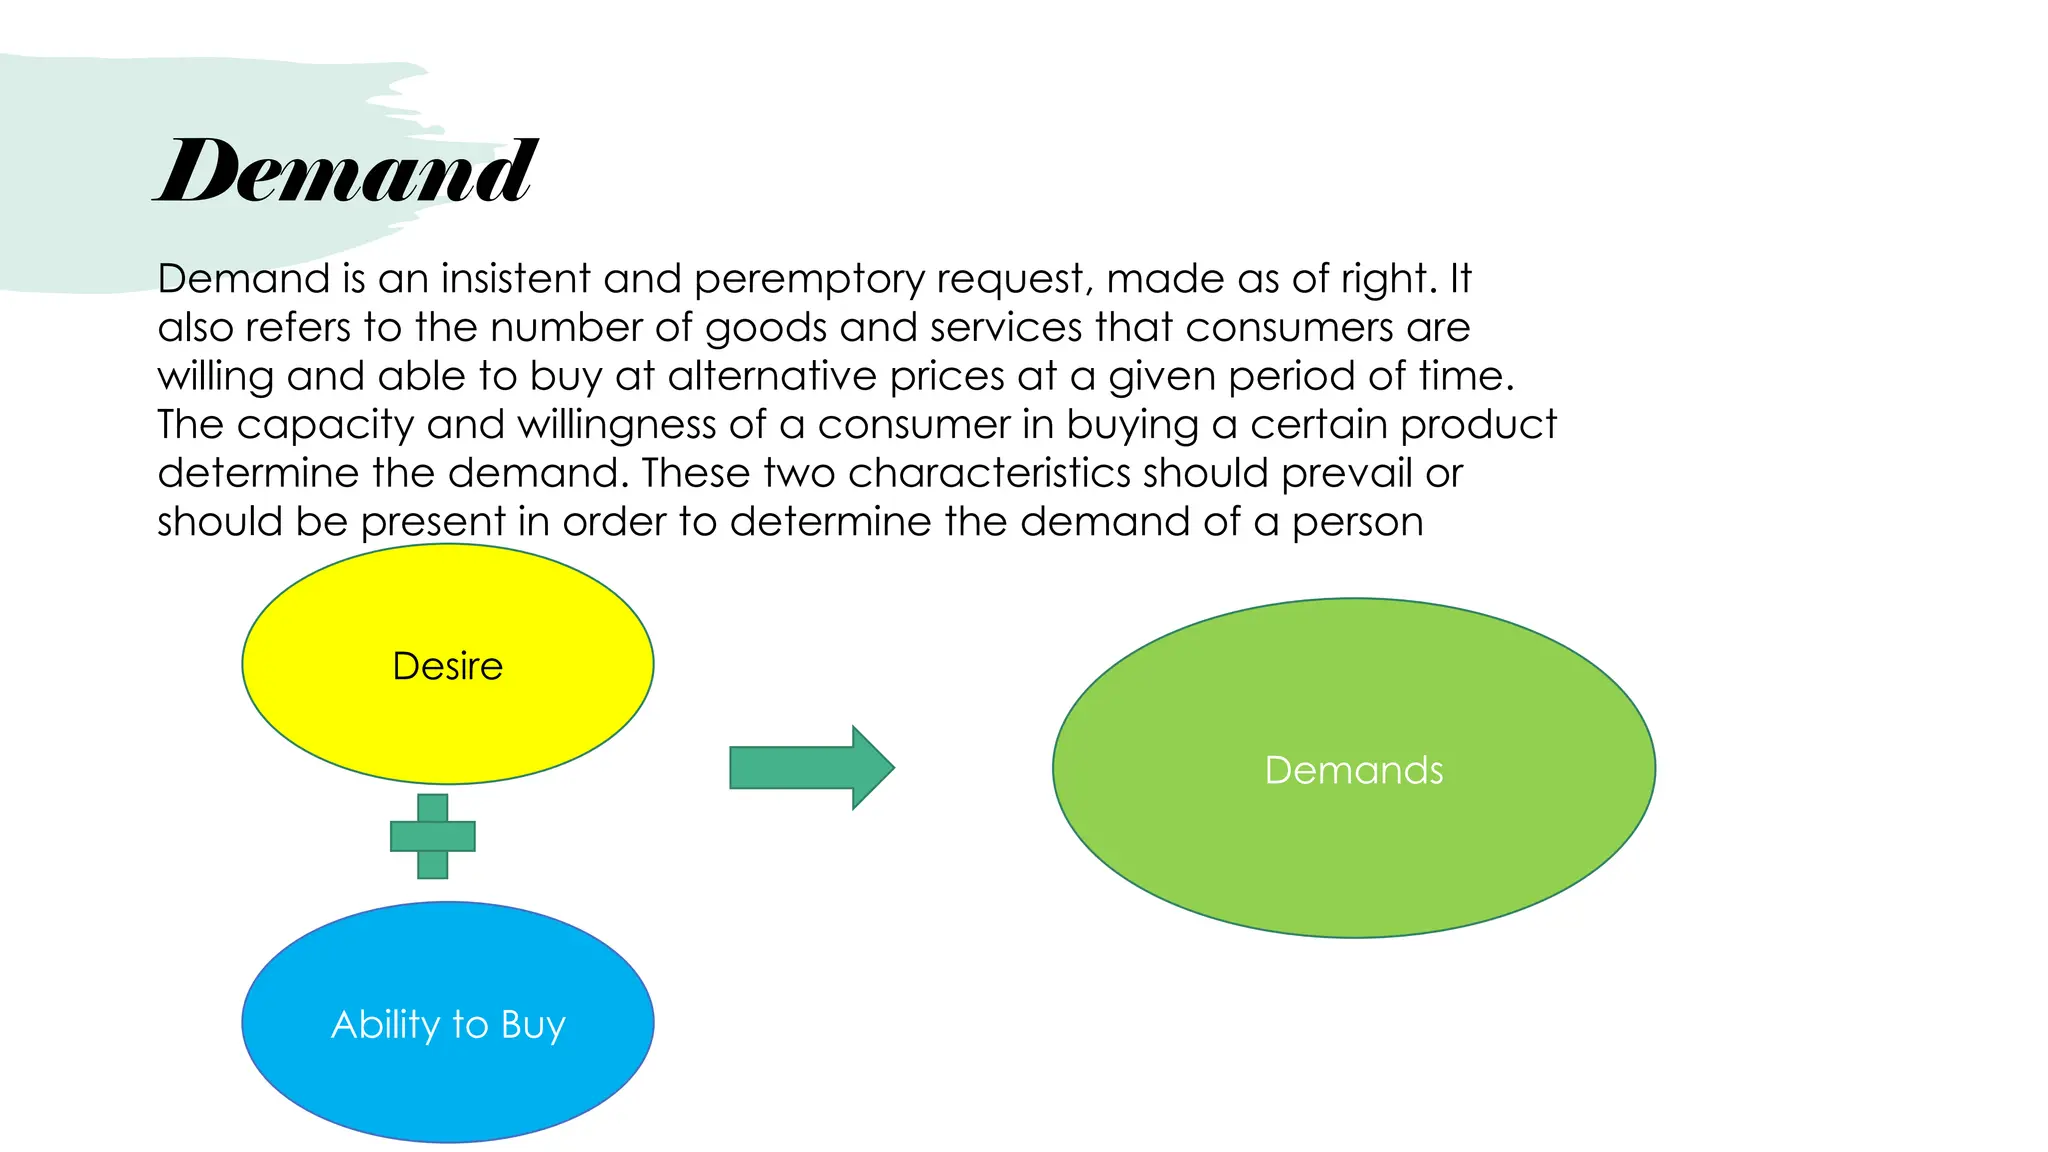
Demand is aninsistent and peremptory request, made as of right. It
also refers to the number of goods and services that consumers are
willing and able to buy at alternative prices at a given period of time.
The capacity and willingness of a consumer in buying a certain product
determine the demand. These two characteristics should prevail or
should be present in order to determine the demand of a person
Desire
Ability to Buy
Demands
3.
Demand
Function
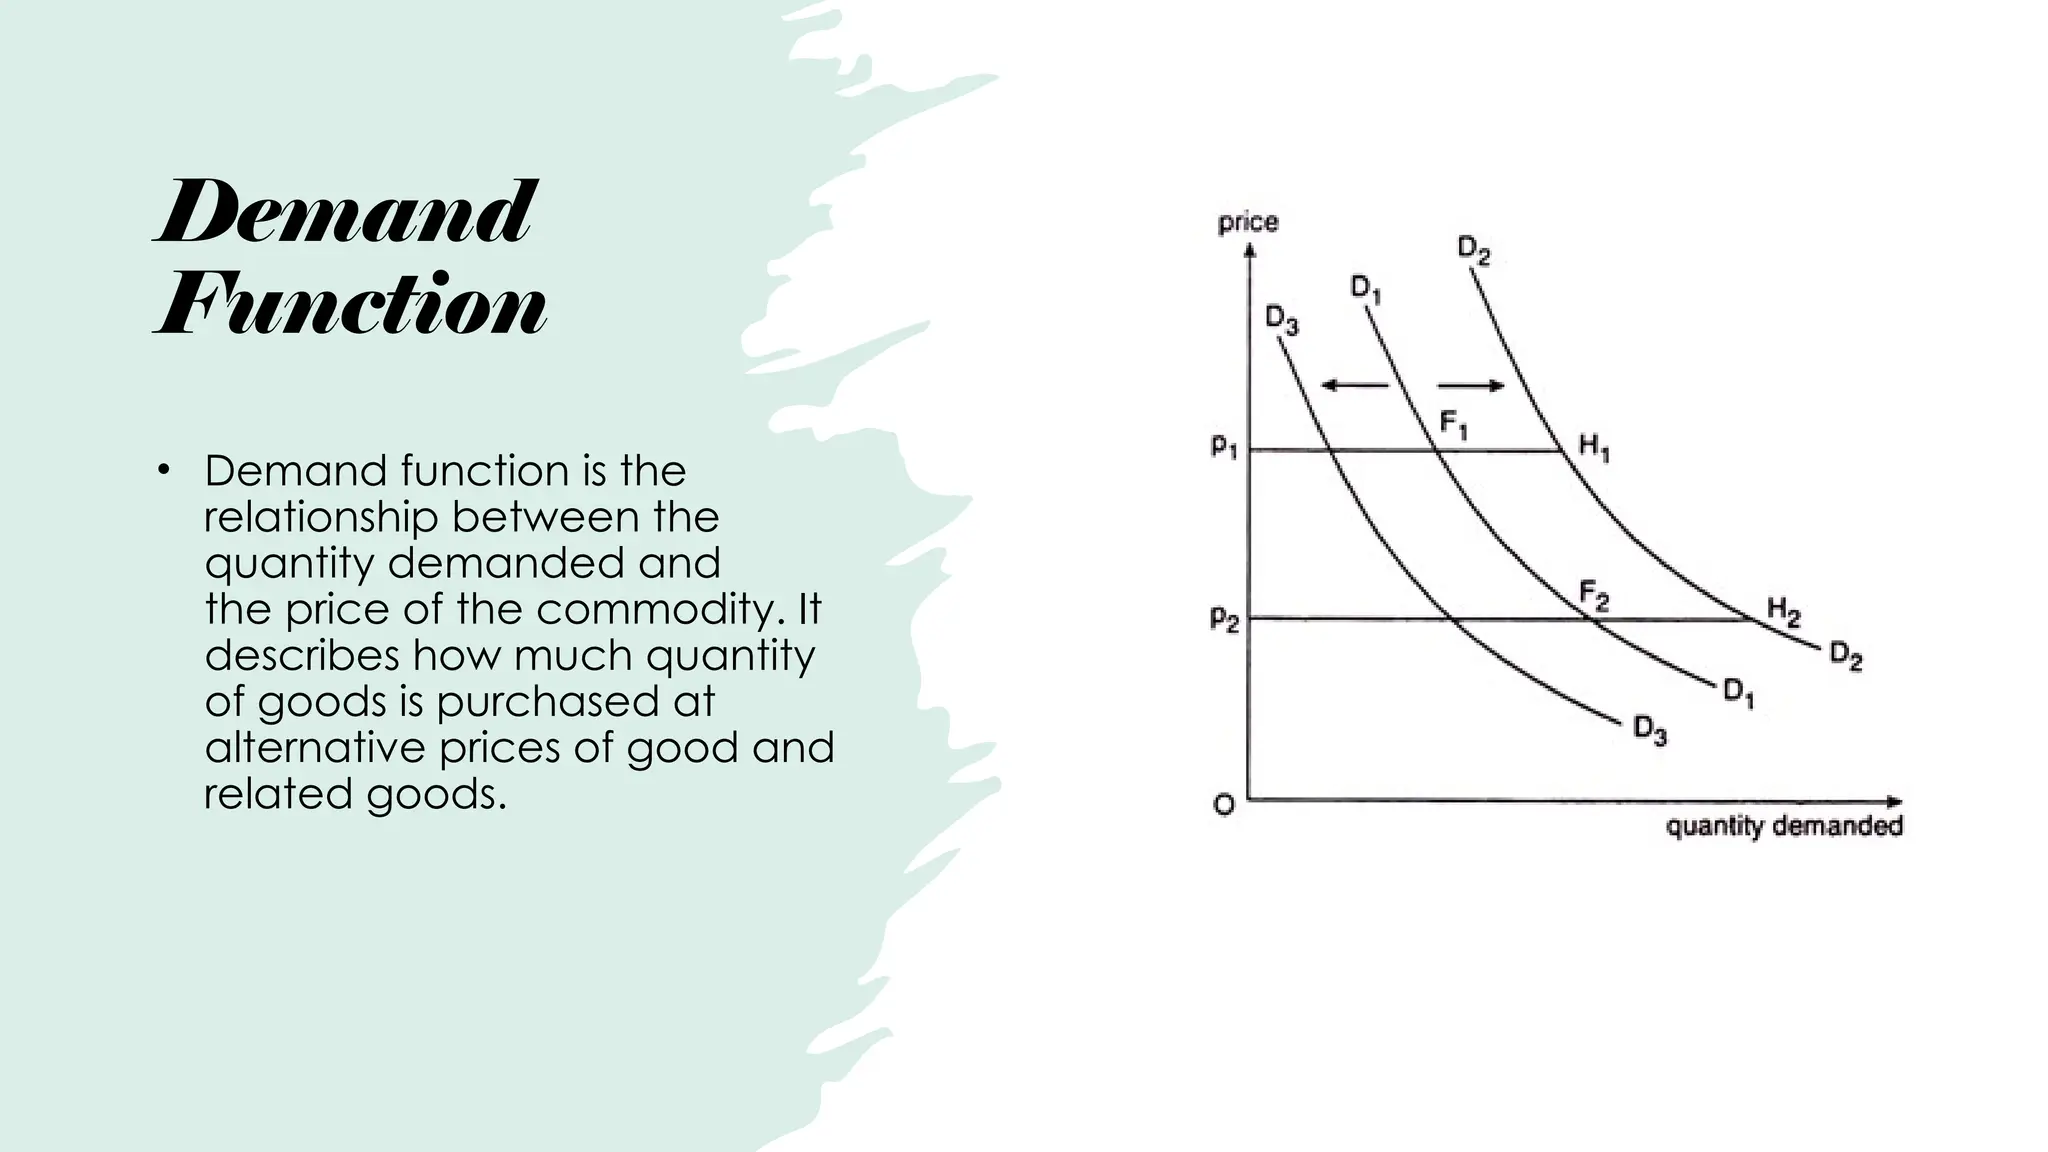
• Demand functionis the
relationship between the
quantity demanded and
the price of the commodity. It
describes how much quantity
of goods is purchased at
alternative prices of good and
related goods.
4.
•The demand functiontakes the
form Qd= a – bP, and this states how
the price (P) of a good or service
determines the quantity demanded
(Qd).
•Example:
•A consumer does not want to buy
because the price is so high, which is
$50. As we recall what the demand
function says, that a consumer will
only buy a product if the price is lower
than $50. The value of 4P in equation
Qd= 200 – 4P, the price of the soursop
is $50. The Qd is 0, if the price
becomes $45, Qd is 20 pieces,
replace the price $45;$45 in P of
equation.
5.
Demand
Schedule
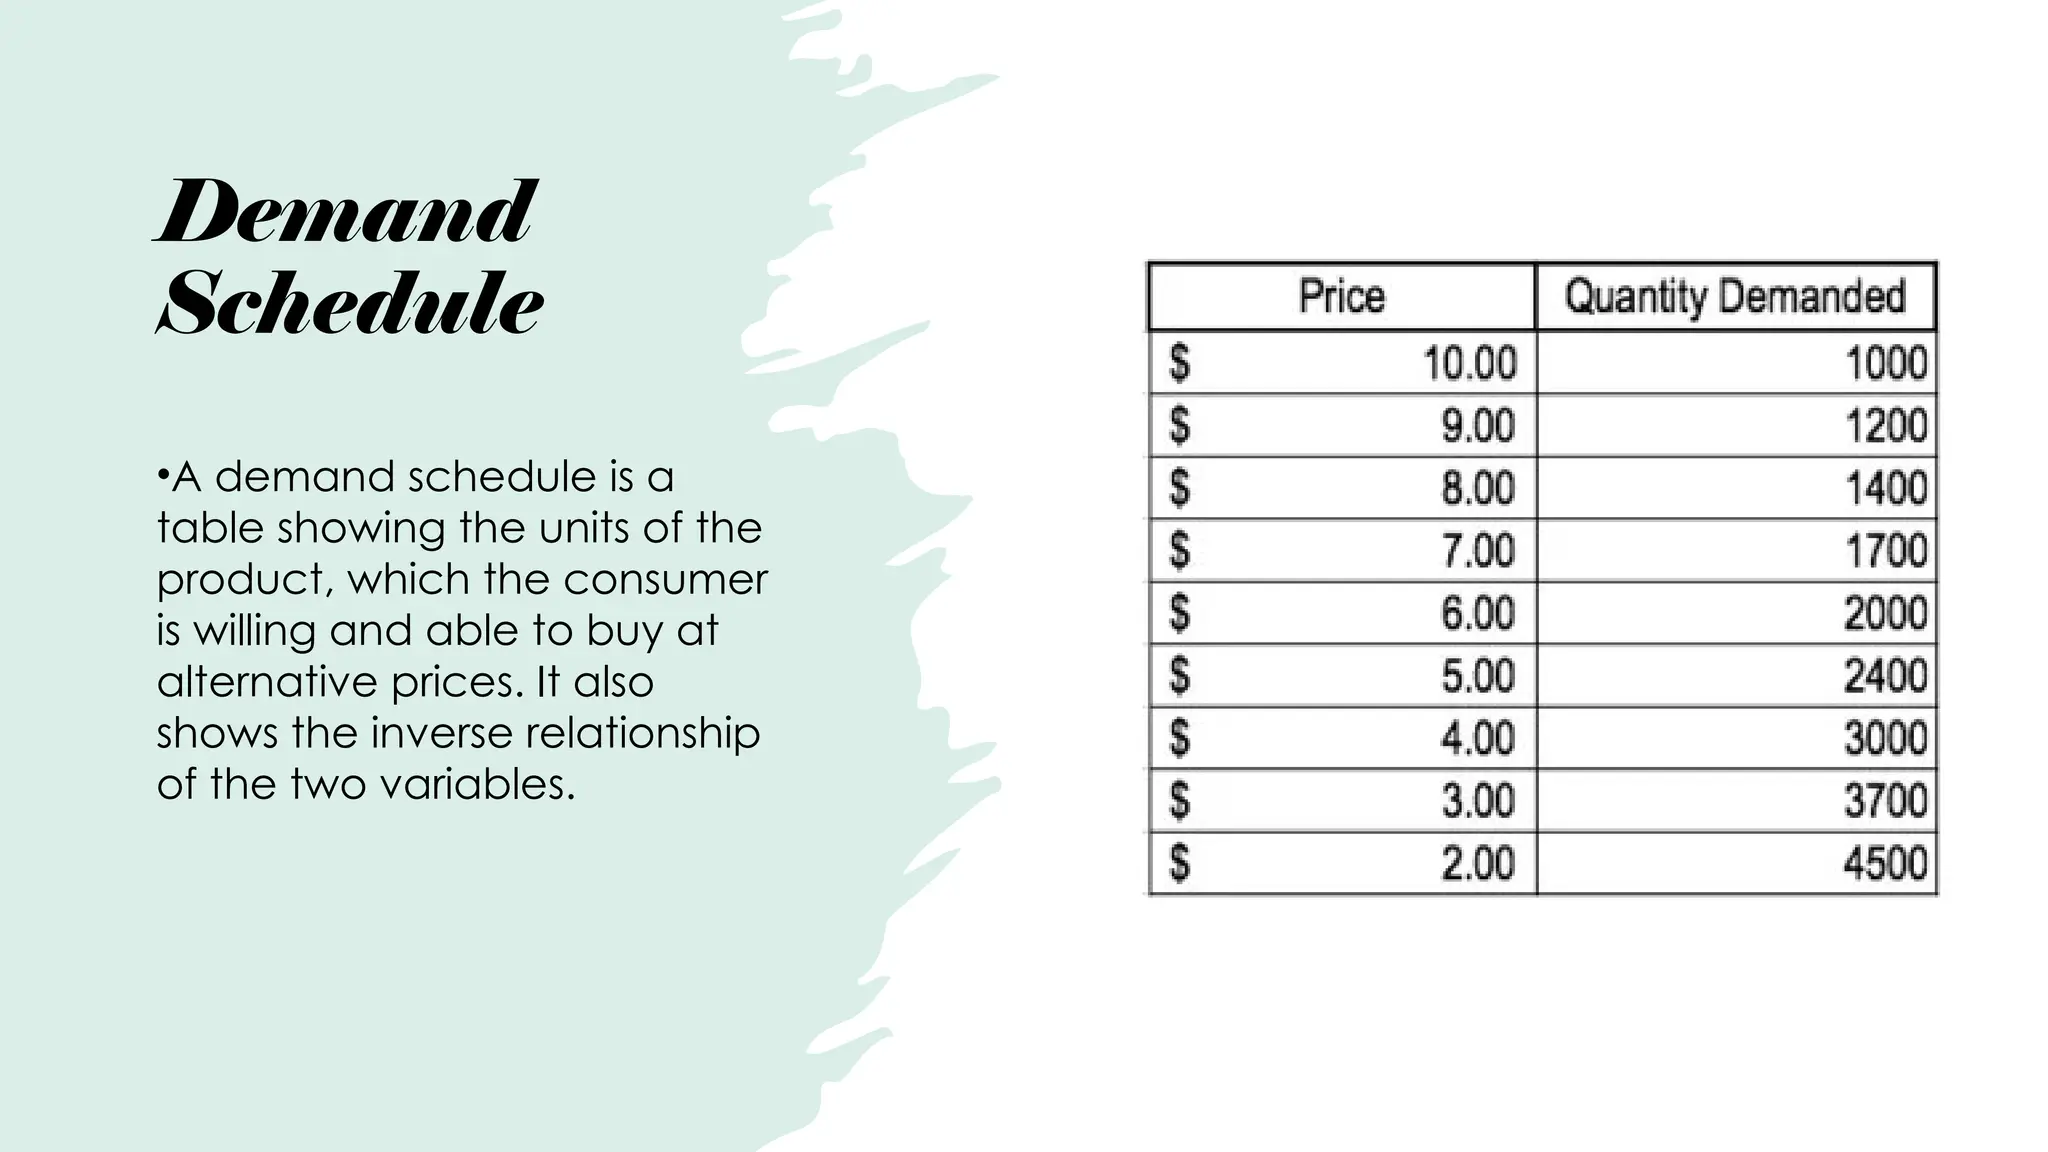
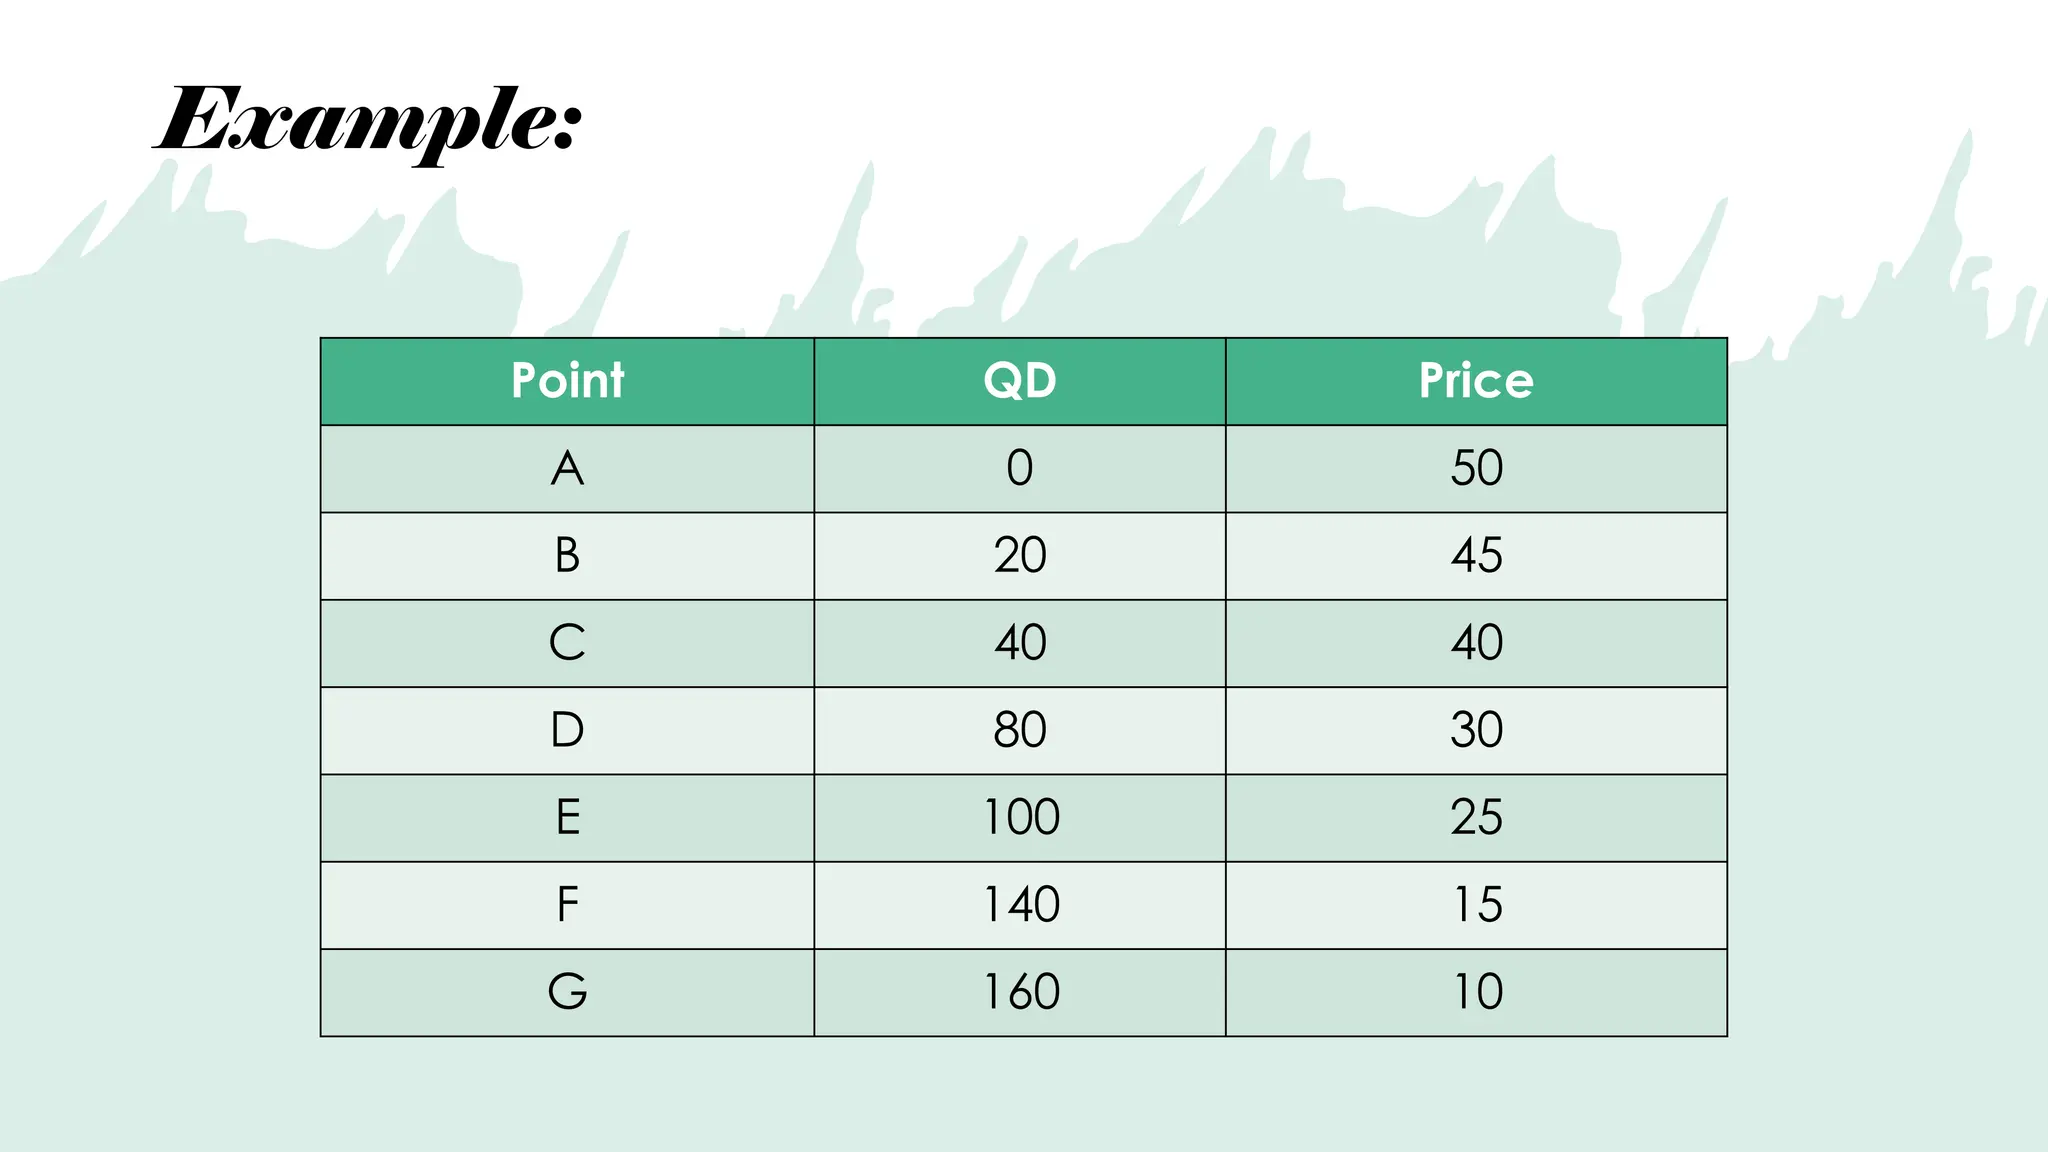
•A demand scheduleis a
table showing the units of the
product, which the consumer
is willing and able to buy at
alternative prices. It also
shows the inverse relationship
of the two variables.
Demand
Curve
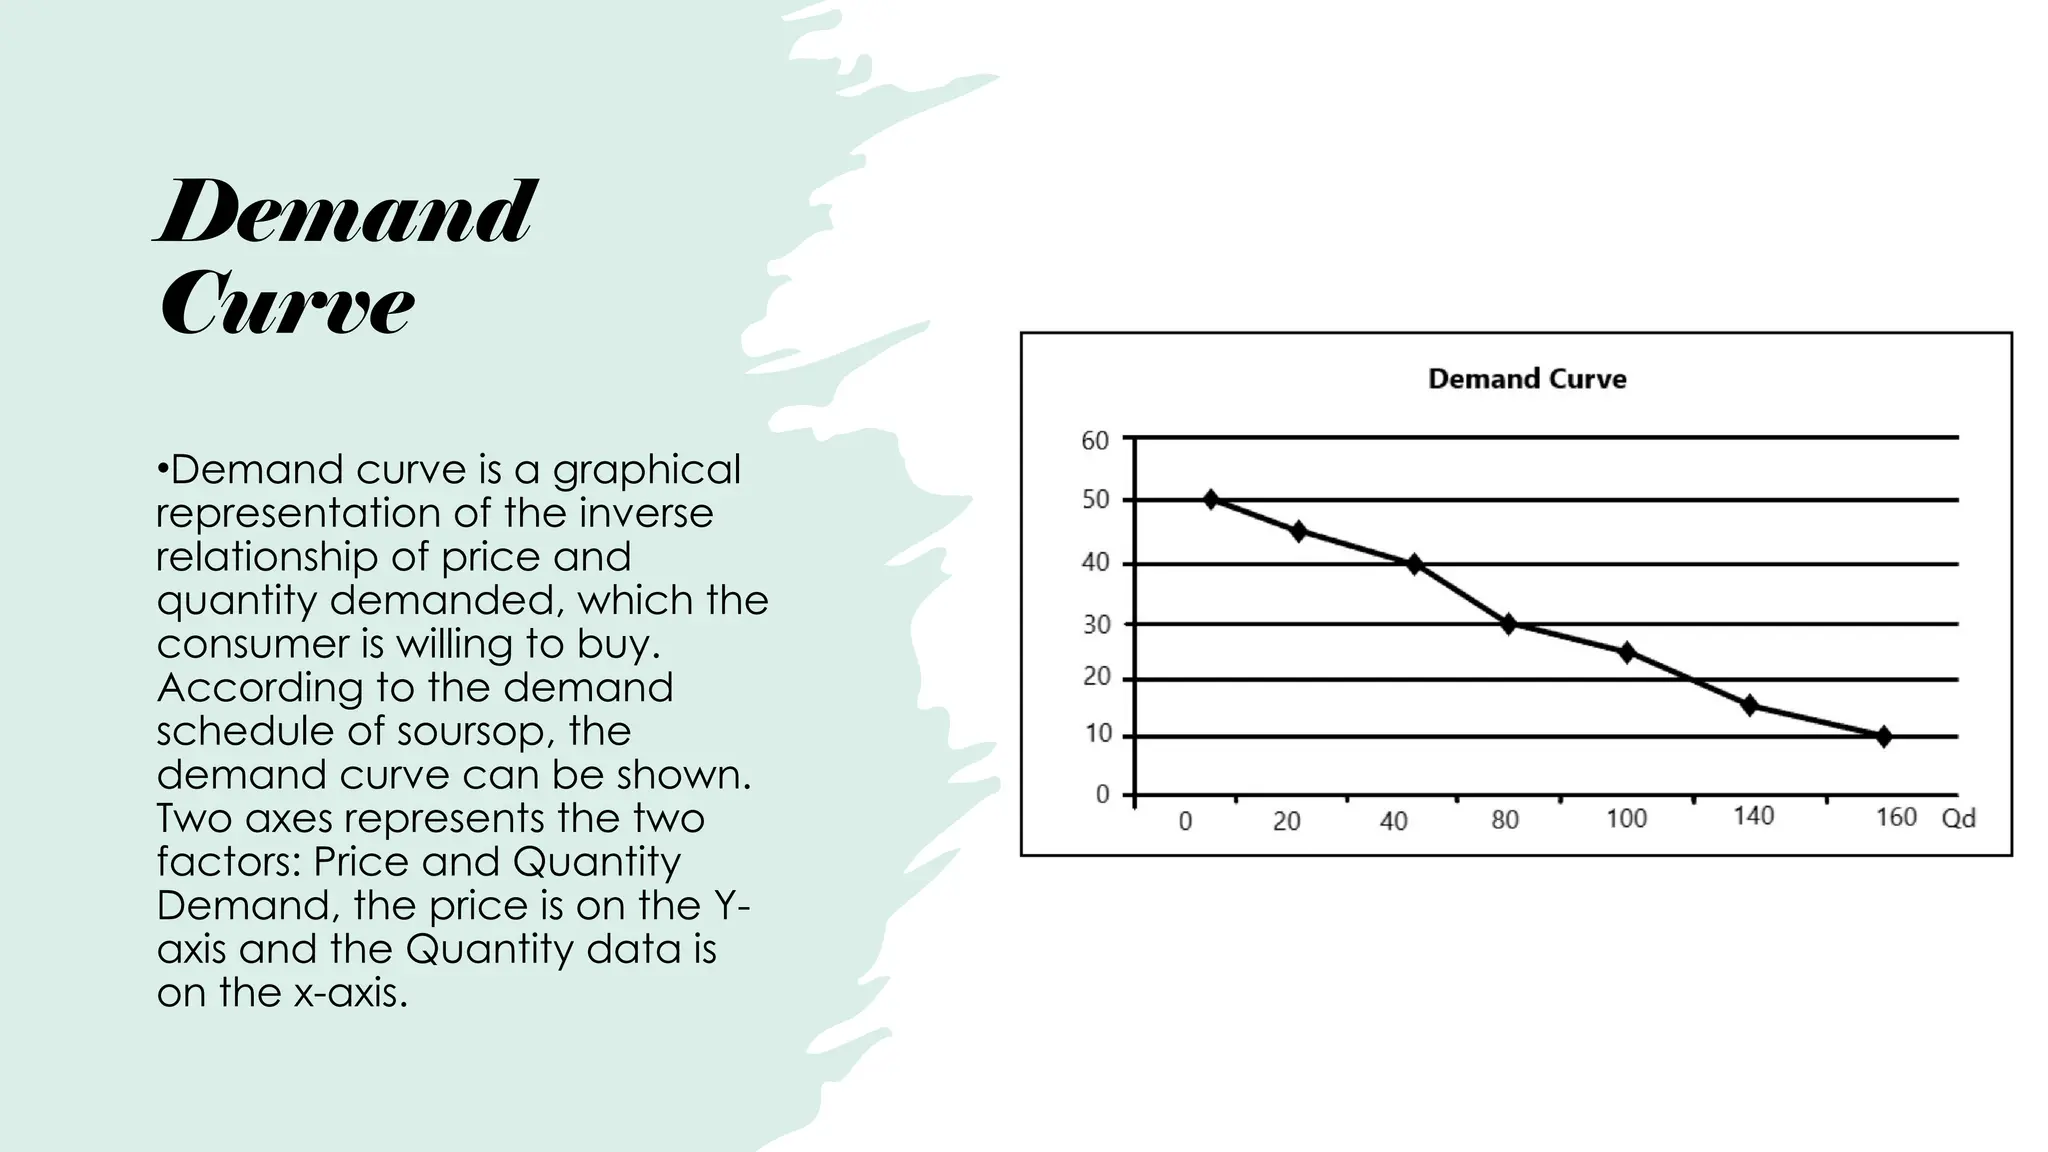
•Demand curve isa graphical
representation of the inverse
relationship of price and
quantity demanded, which the
consumer is willing to buy.
According to the demand
schedule of soursop, the
demand curve can be shown.
Two axes represents the two
factors: Price and Quantity
Demand, the price is on the Y-
axis and the Quantity data is
on the x-axis.
8.
Law of Demand
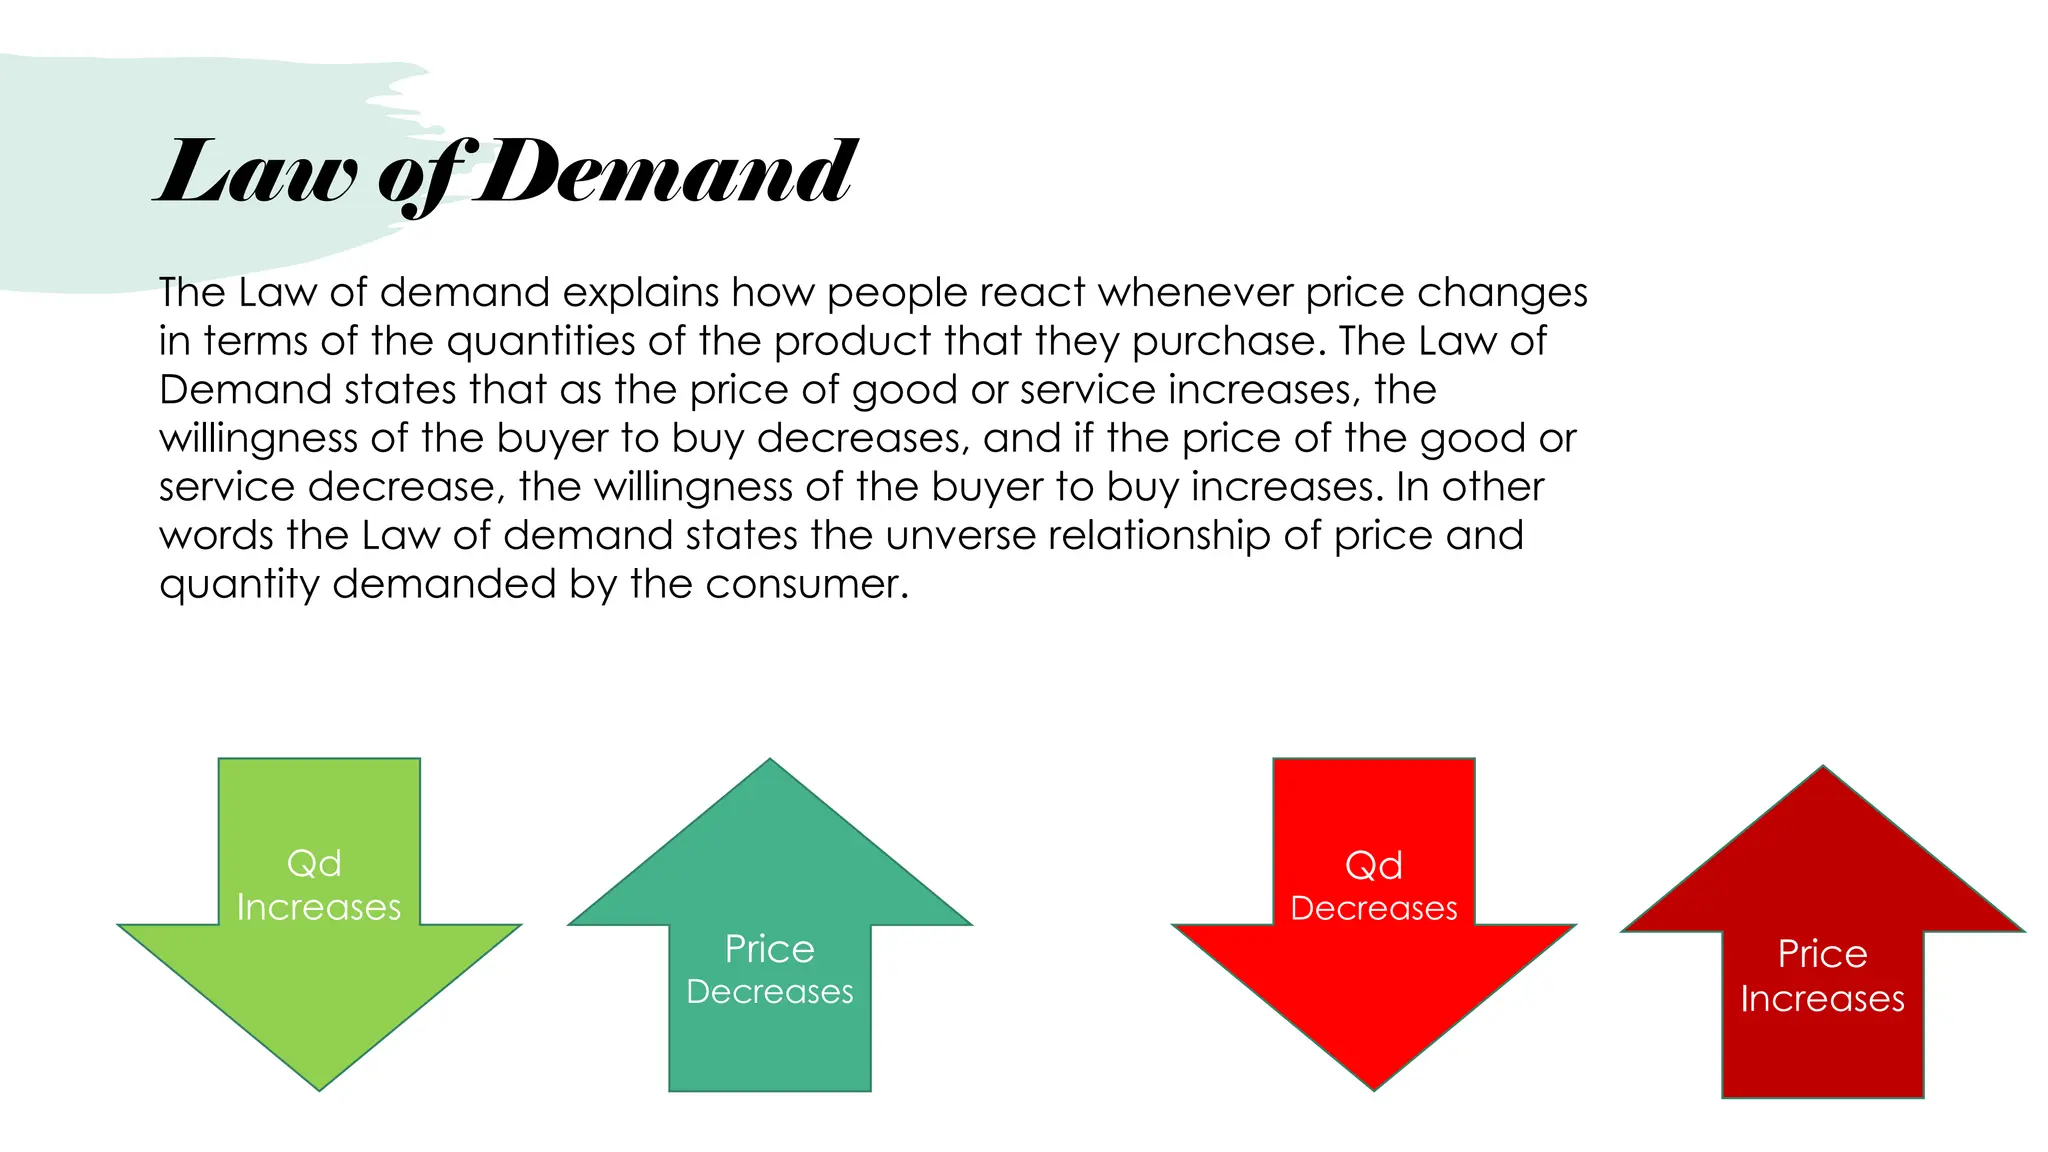
TheLaw of demand explains how people react whenever price changes
in terms of the quantities of the product that they purchase. The Law of
Demand states that as the price of good or service increases, the
willingness of the buyer to buy decreases, and if the price of the good or
service decrease, the willingness of the buyer to buy increases. In other
words the Law of demand states the unverse relationship of price and
quantity demanded by the consumer.
Qd
Increases
Qd
Decreases
Price
Decreases
Price
Increases
9.
Market
Demand
• Market demandis the total quantity
demanded across all consumers in a
market for a given good. Basically
it describes the demand for a given
product and who wants to purchase it.
• For example, if the total market size for
a product was 3 people and at $30
none would purchase the product. The
aggregate demand would be 0 at
that price. Next at $25, the Customer 1
would buy 5, Customer 2 wouldn't buy
any, and Customer 3 would buy 1. At
$25, the aggregate demand would be
6 units.
10.
Determinants of Demand
Priceisn't the only factor that can affect demands
• 1. Population
• 2. Expectation
• 3. Income
• 4. Preference
• 5. Occasion
• 6. Price of Related Products
11.
Population
• As thepopulation increases,
the number of consumers also
increases, hence the demand
for products and services also
increases. Take this for
example, a family of 5
consumes 7 kilos of rice every
week, the numbers of the
family increased by one and
now they consume 9 kilos of
rice a week. In short as one
member increase the amount
of demand for products also
increases.
12.
Expectation
• When aconsumer hears about political
unrest or trouble happening in some parts
of the country or even around the world,
he/she would assume that the economy
would be affected. The fear of product
shortage and price increase might occur,
many people would resort to panick
buying.
• Basically, If a buyer expects the price of a
good to go down in the future, they hold
off buying it today, so the demand for
that good today decreases. On the other
hand, if a buyer expects the price to go
up in the future, the demand for the good
today increases.
13.
Income
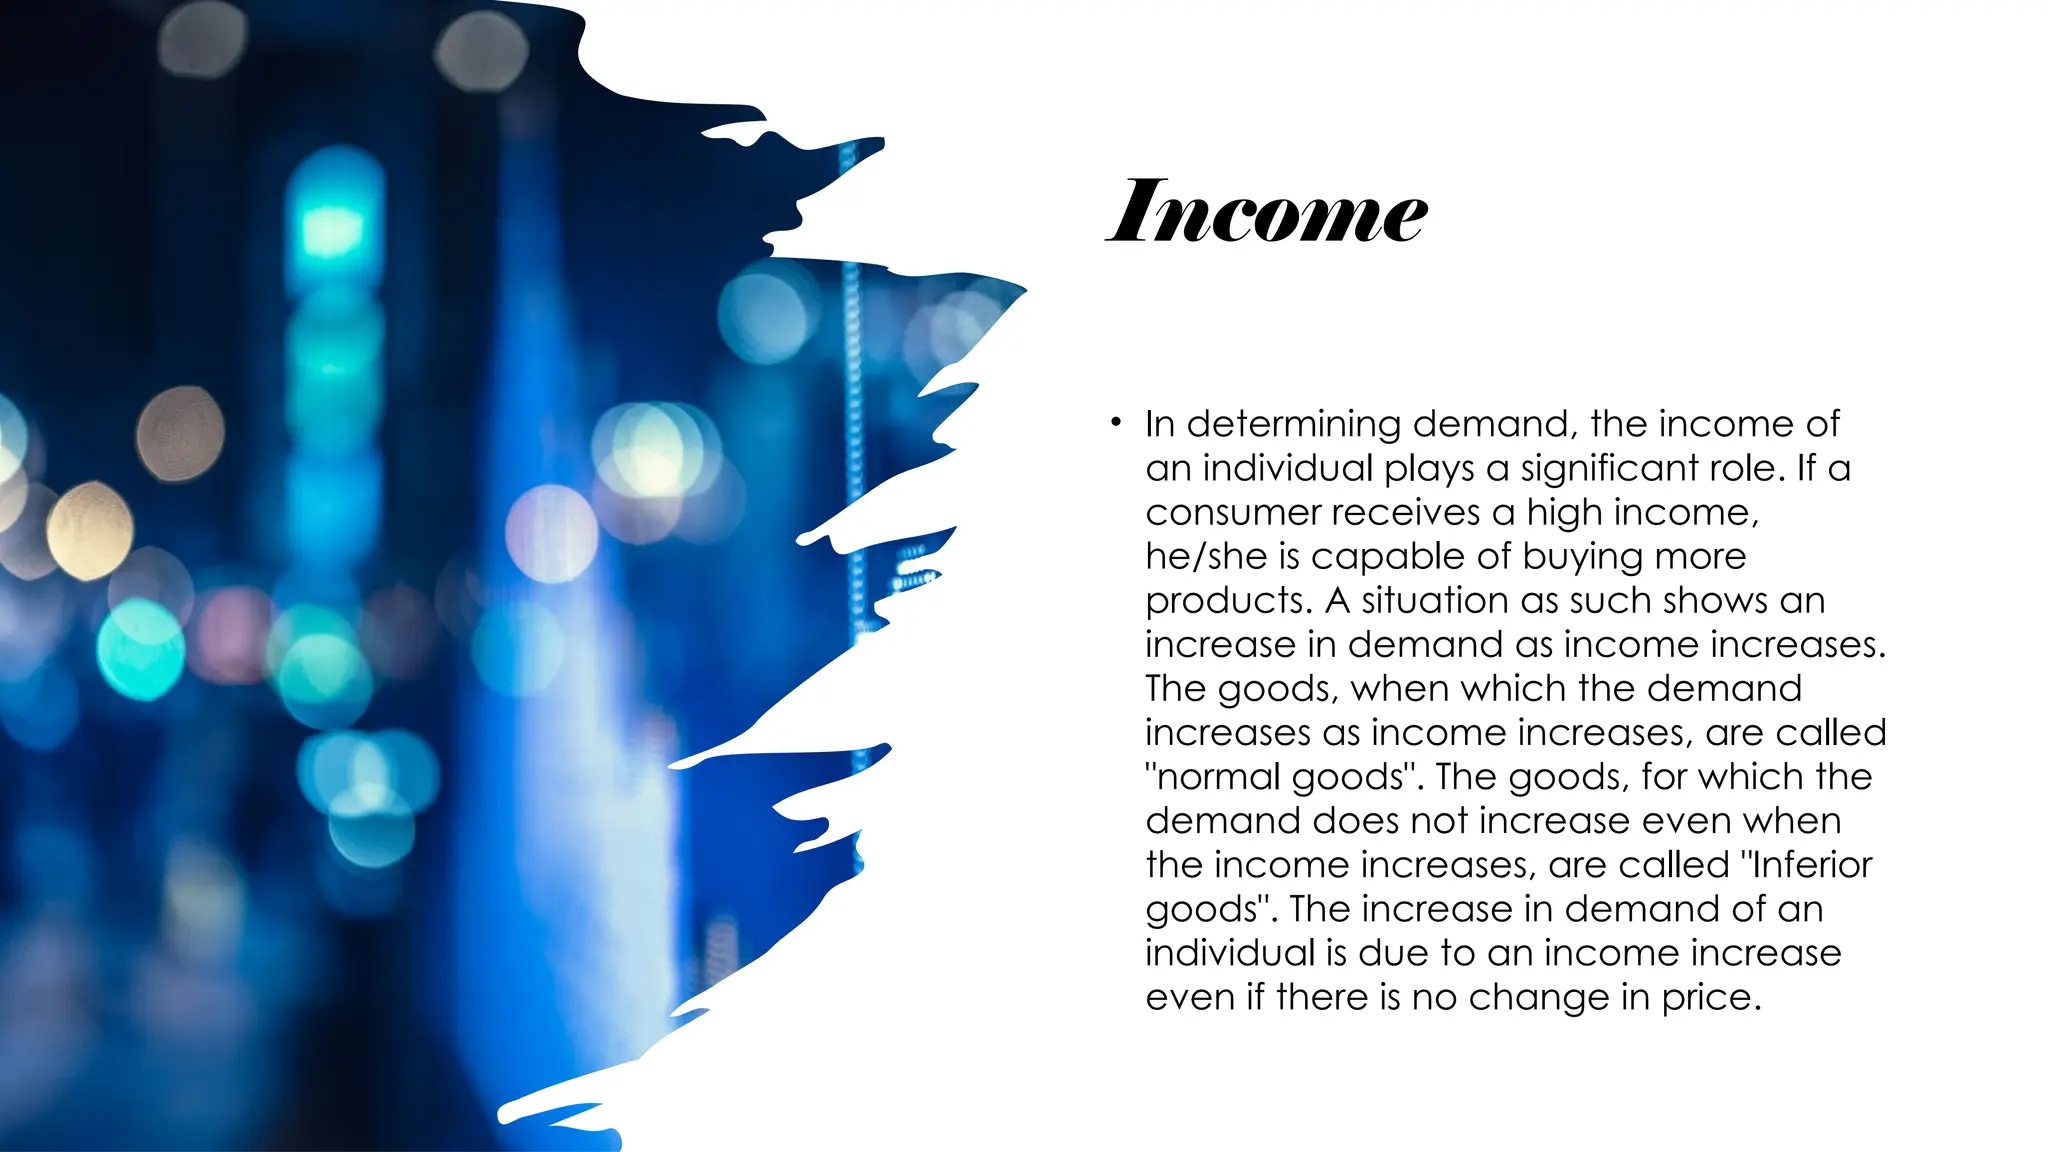
• In determiningdemand, the income of
an individual plays a significant role. If a
consumer receives a high income,
he/she is capable of buying more
products. A situation as such shows an
increase in demand as income increases.
The goods, when which the demand
increases as income increases, are called
"normal goods". The goods, for which the
demand does not increase even when
the income increases, are called "Inferior
goods". The increase in demand of an
individual is due to an income increase
even if there is no change in price.
14.
Preference
• Change intaste and preference for
a particular brand affects the
demand for products.
Advertisements and endorsers
somehow influence the consumers'
preference. Especially when
people see the benefits and quality
of the advertised product.
15.
Occasion
• Whenever thereis a celebration,
demand for products that are used
for the occasion increases, such as
food, decorations, invitations, and
venues when there is a party.
16.
Price of Related
Products
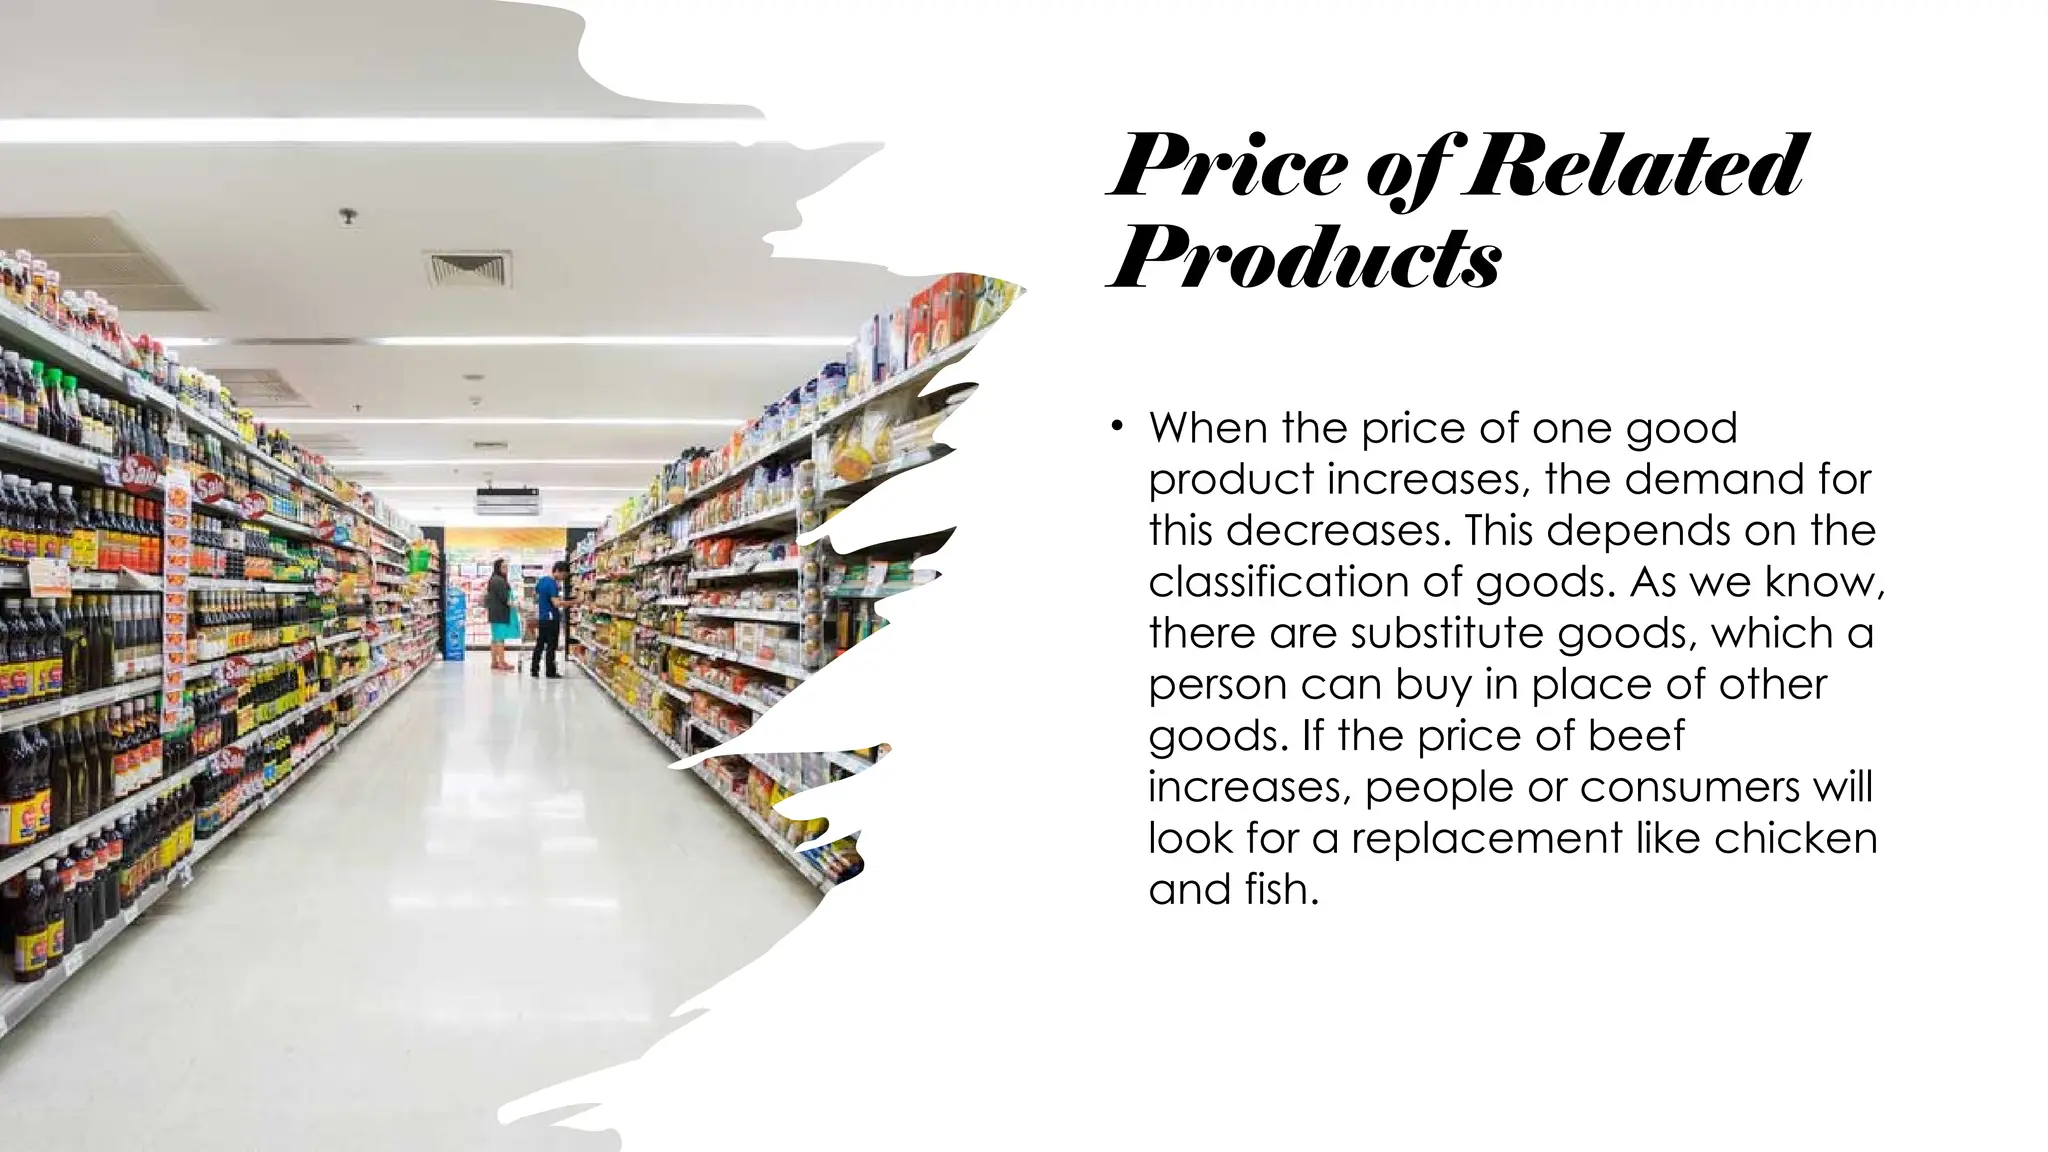
•When the price of one good
product increases, the demand for
this decreases. This depends on the
classification of goods. As we know,
there are substitute goods, which a
person can buy in place of other
goods. If the price of beef
increases, people or consumers will
look for a replacement like chicken
and fish.
17.
Change in
Price and
Quantity
Demanded
•A change in quantity demanded refers
to a change in the specific quantity of
a product that buyers are willing and
able to buy. This change in quantity
demanded is caused by a change in
the price.
18.
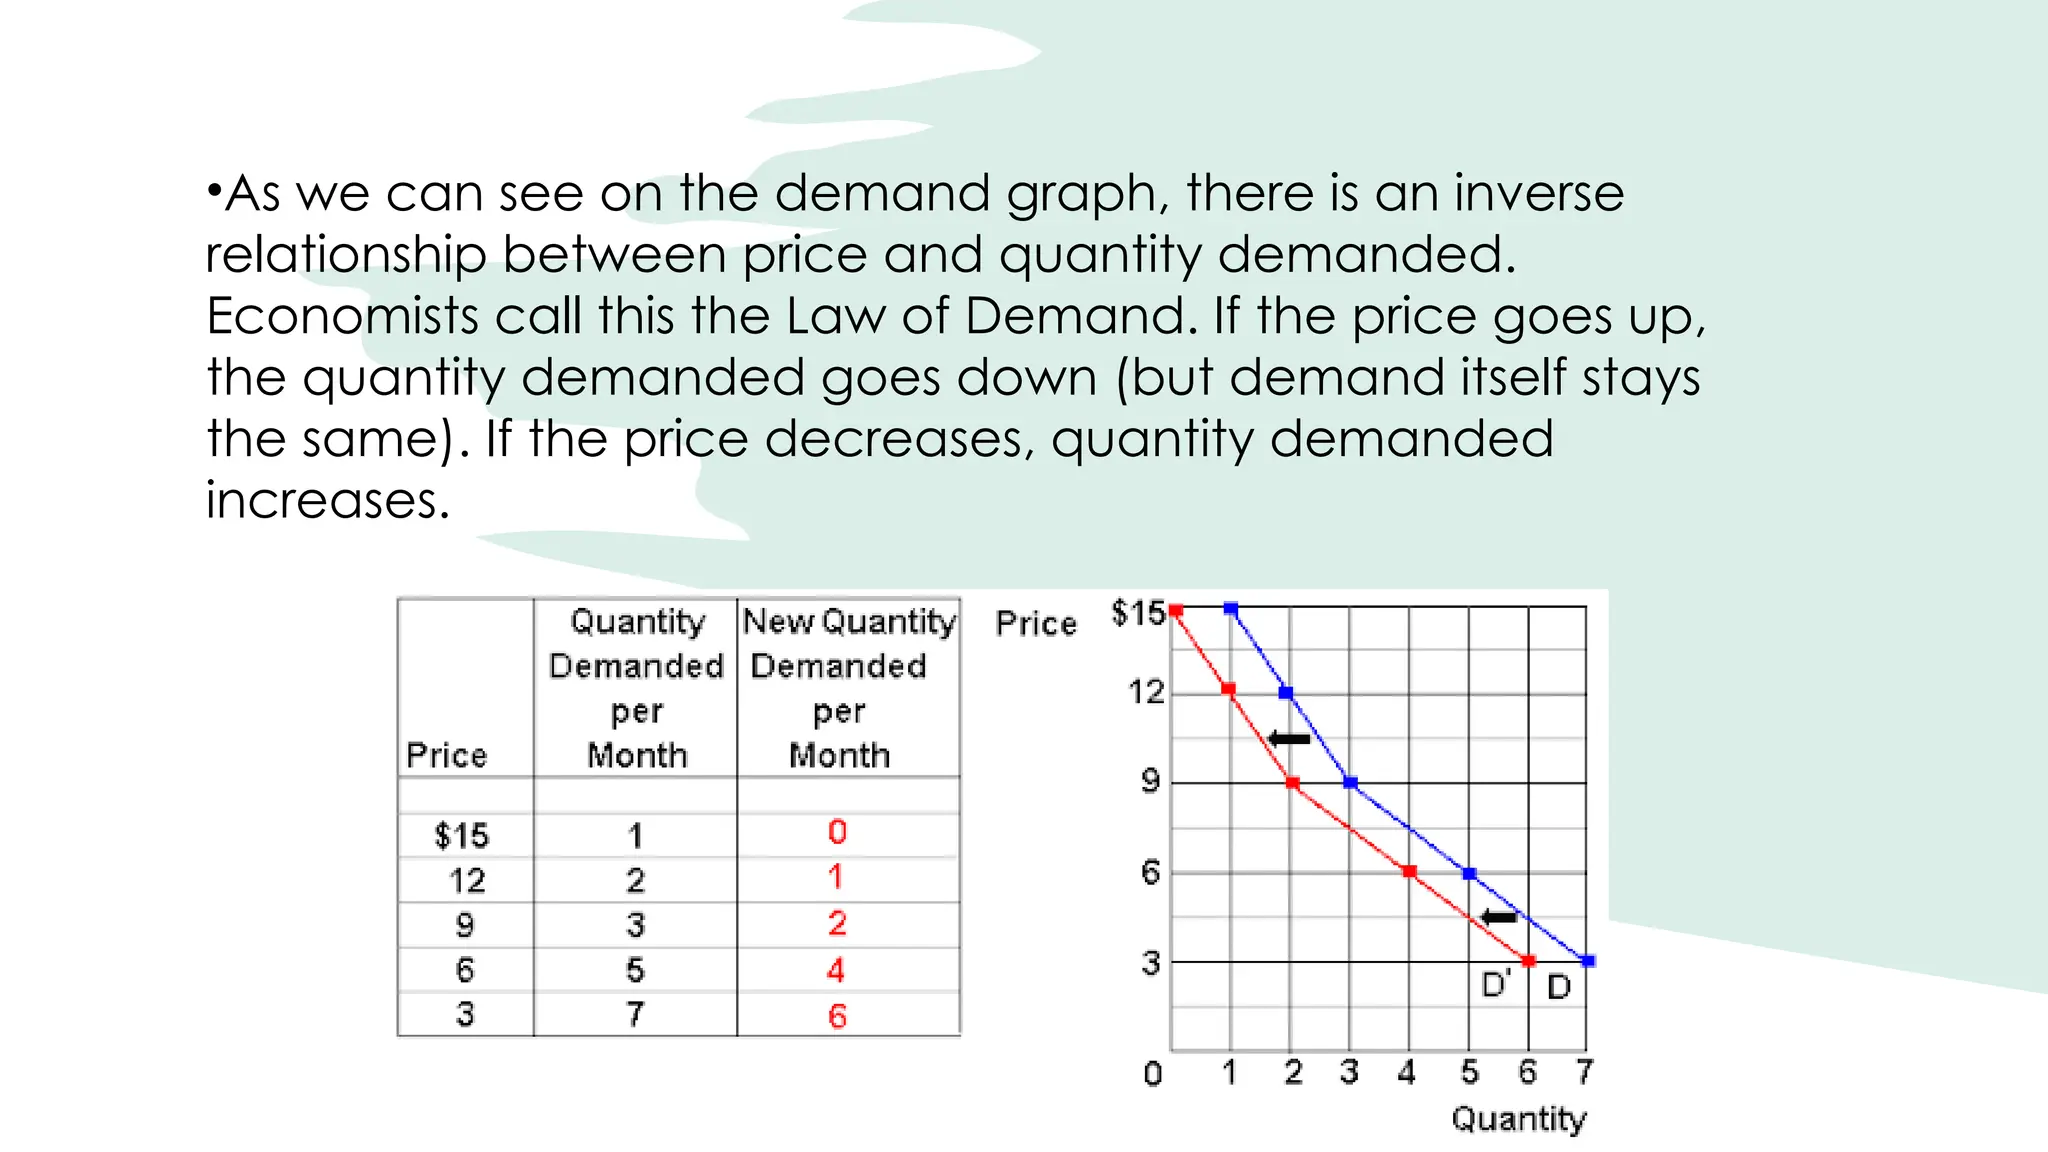
•As we cansee on the demand graph, there is an inverse
relationship between price and quantity demanded.
Economists call this the Law of Demand. If the price goes up,
the quantity demanded goes down (but demand itself stays
the same). If the price decreases, quantity demanded
increases.
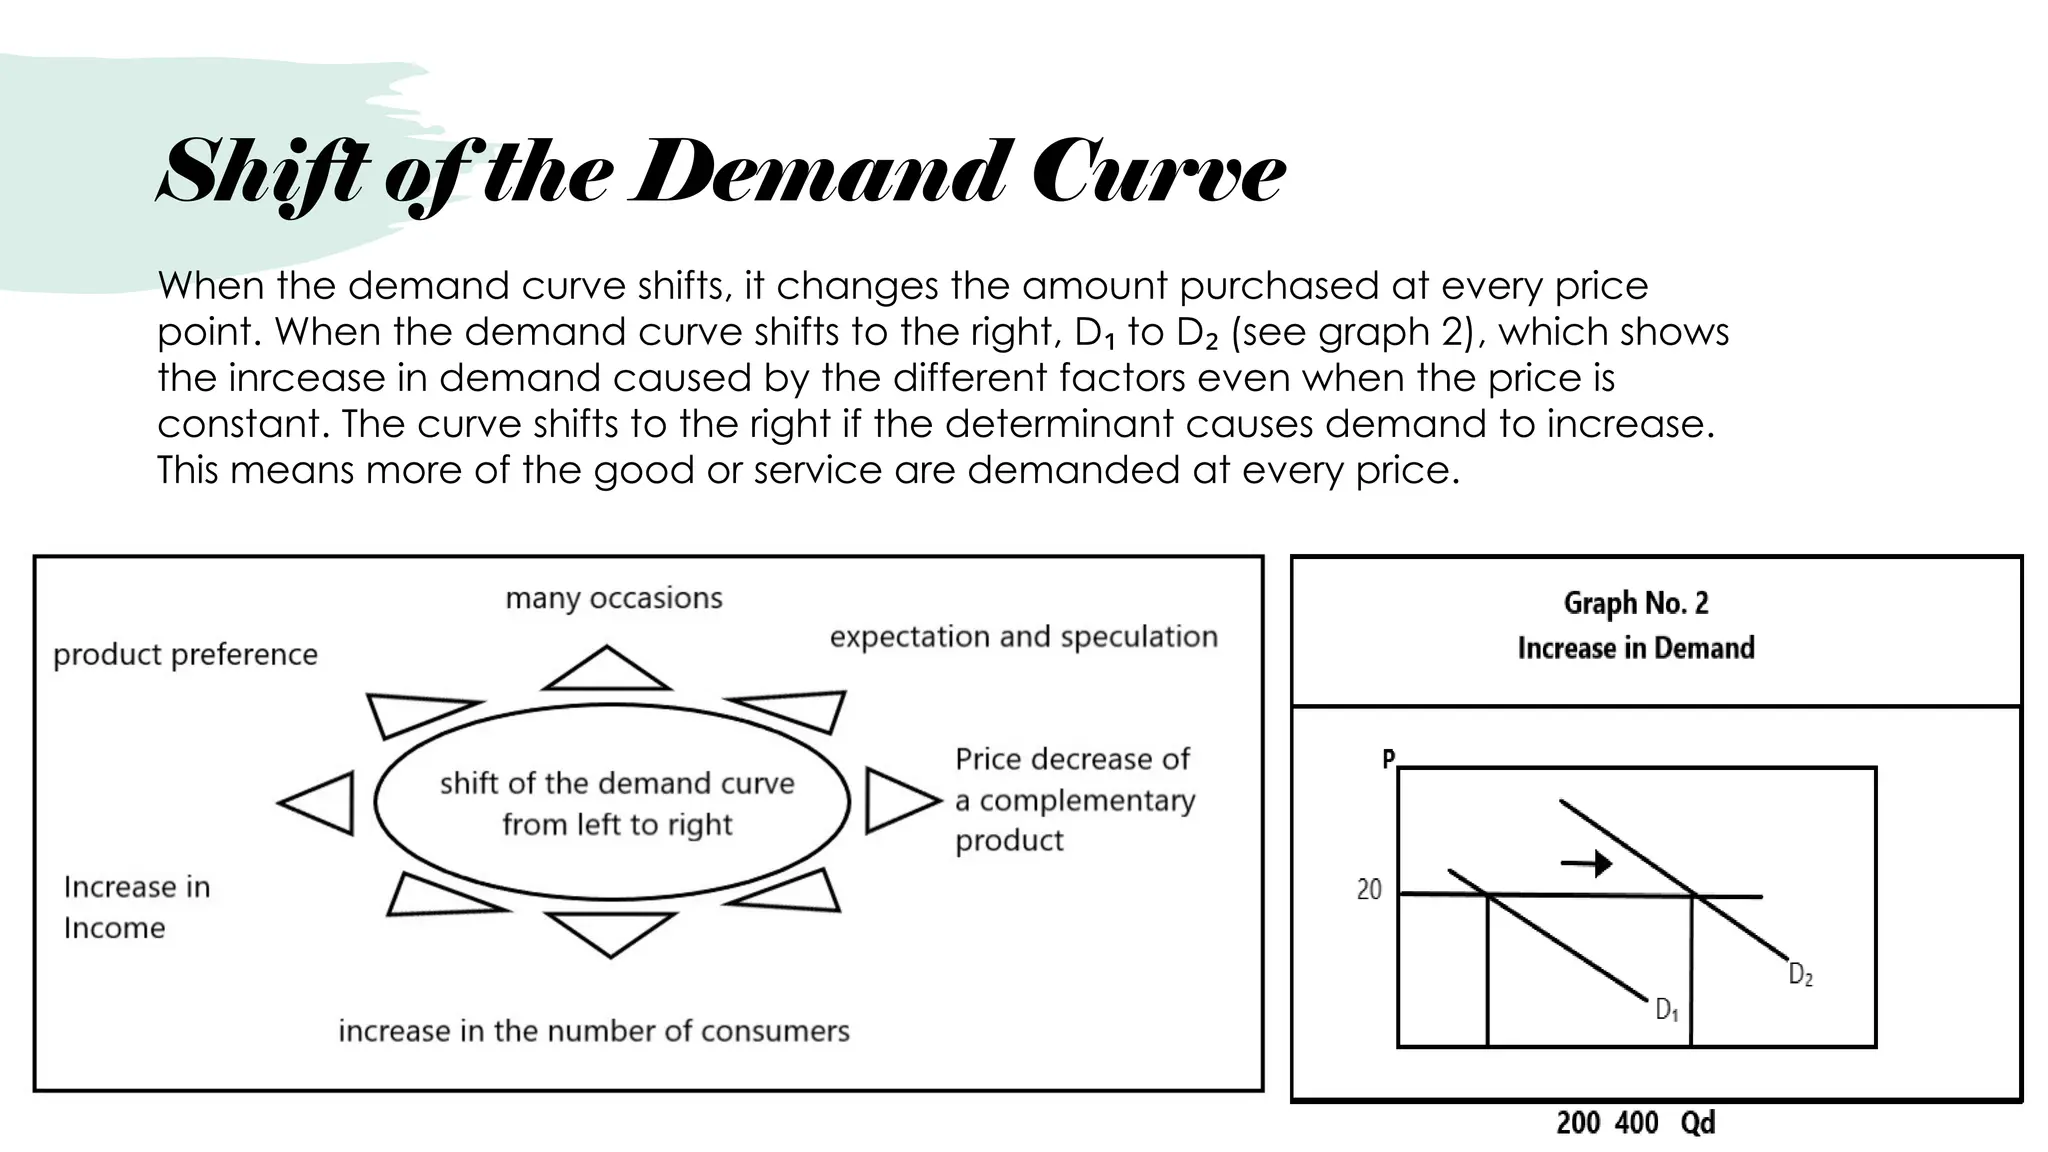
Shift of theDemand Curve
When the demand curve shifts, it changes the amount purchased at every price
point. When the demand curve shifts to the right, D to D (see graph 2), which shows
₁ ₂
the inrcease in demand caused by the different factors even when the price is
constant. The curve shifts to the right if the determinant causes demand to increase.
This means more of the good or service are demanded at every price.
21.
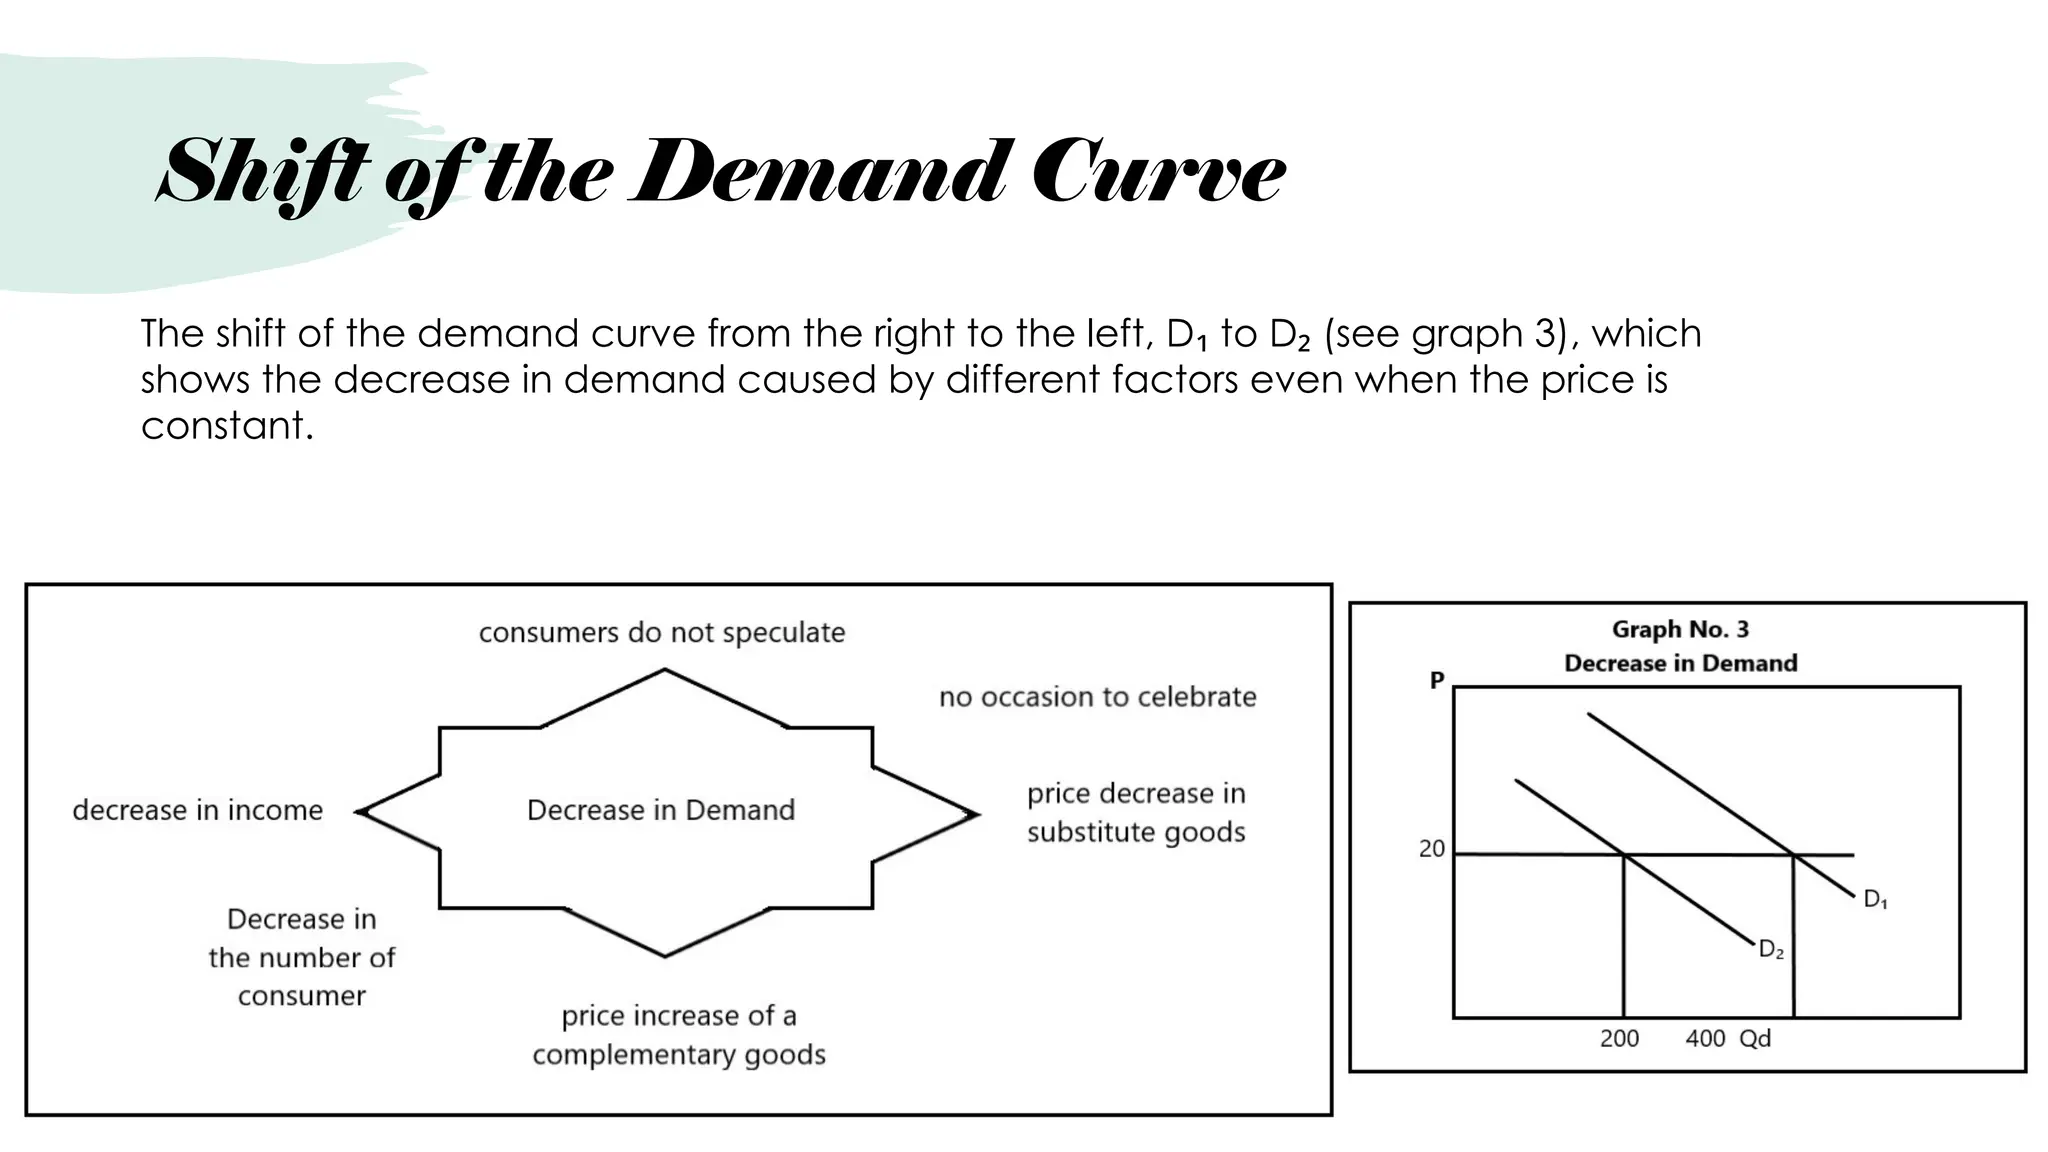
The shift ofthe demand curve from the right to the left, D to D (see graph 3), which
₁ ₂
shows the decrease in demand caused by different factors even when the price is
constant.
Shift of the Demand Curve
22.
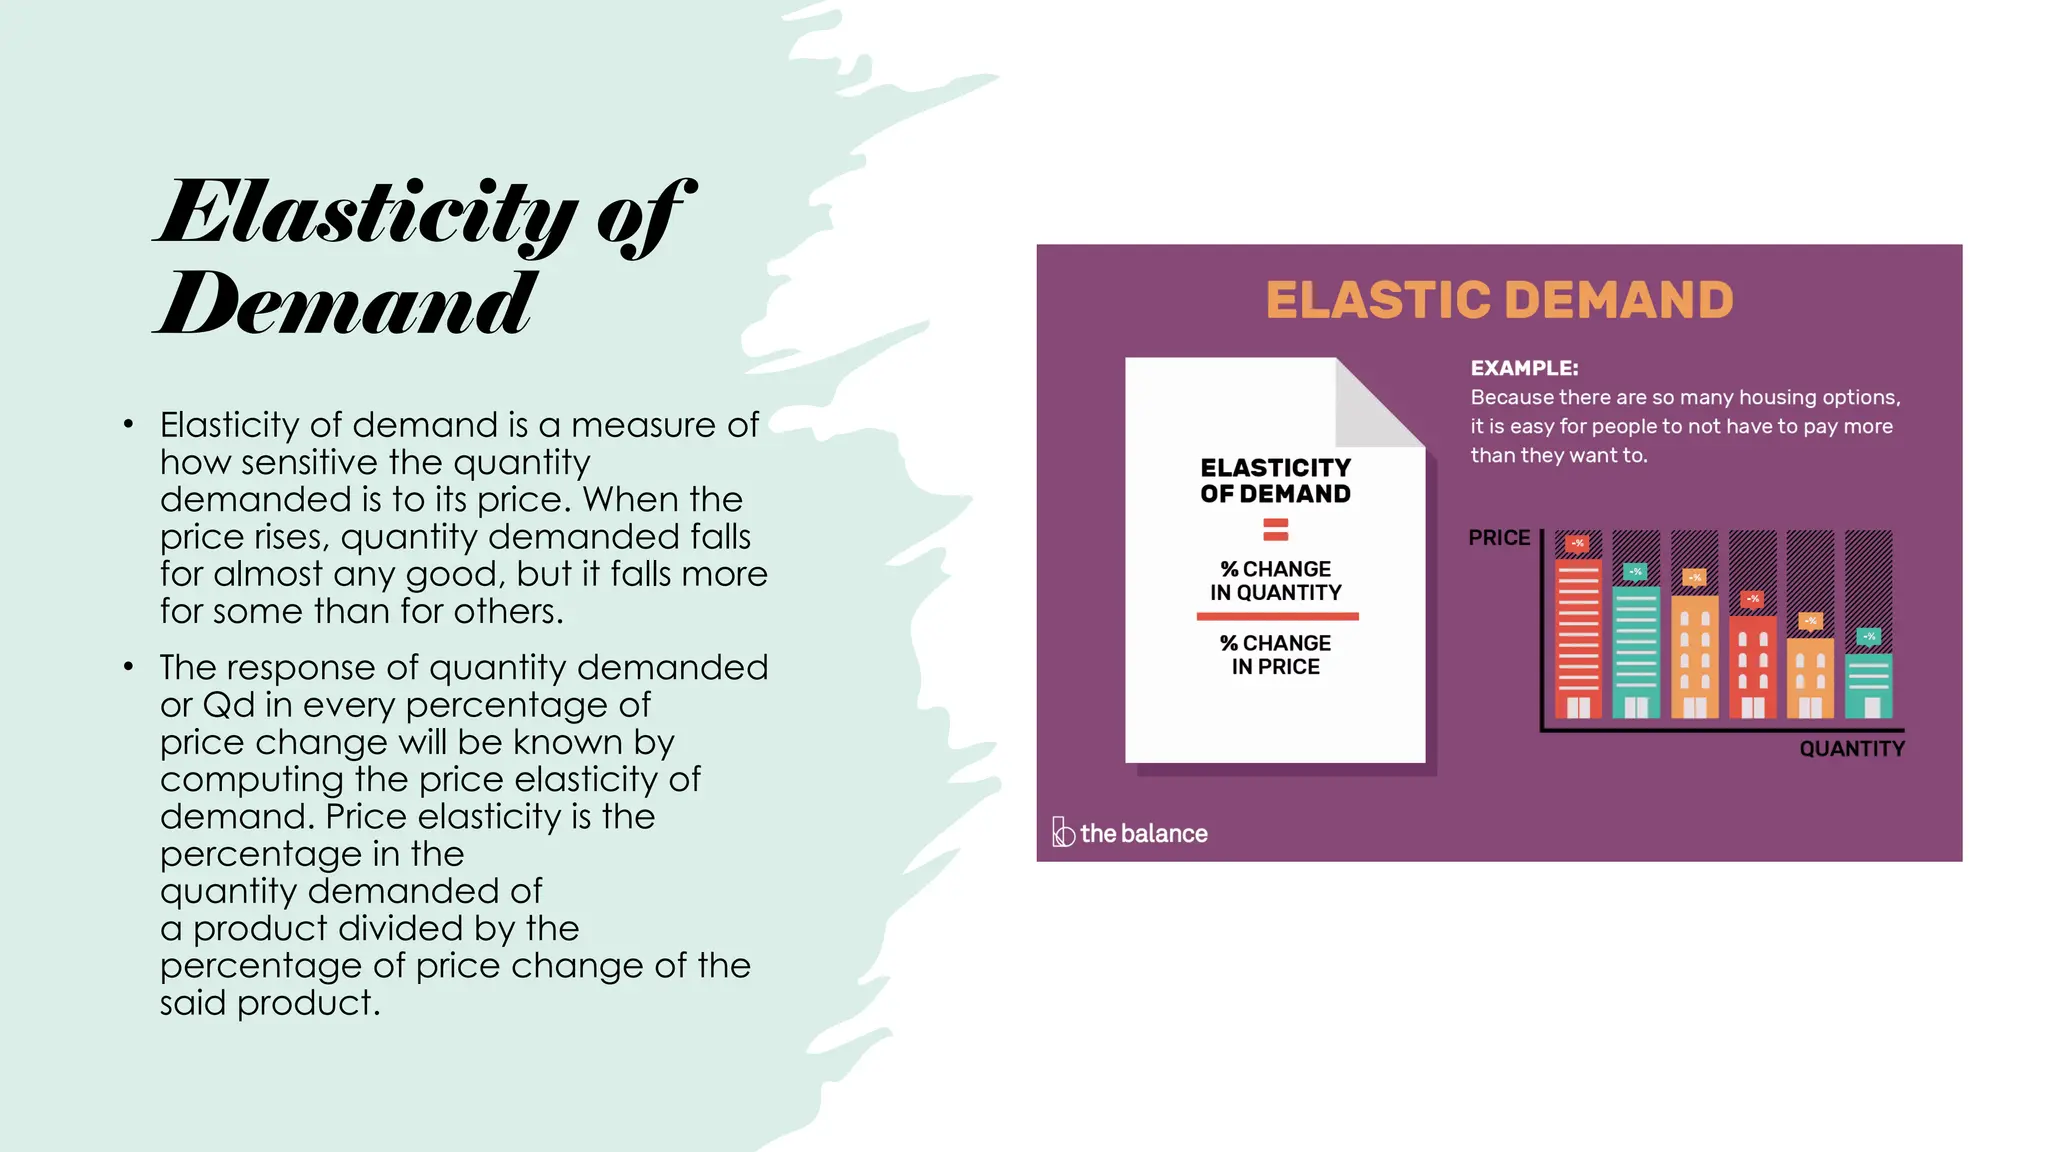
Elasticity of
Demand
• Elasticityof demand is a measure of
how sensitive the quantity
demanded is to its price. When the
price rises, quantity demanded falls
for almost any good, but it falls more
for some than for others.
• The response of quantity demanded
or Qd in every percentage of
price change will be known by
computing the price elasticity of
demand. Price elasticity is the
percentage in the
quantity demanded of
a product divided by the
percentage of price change of the
said product.
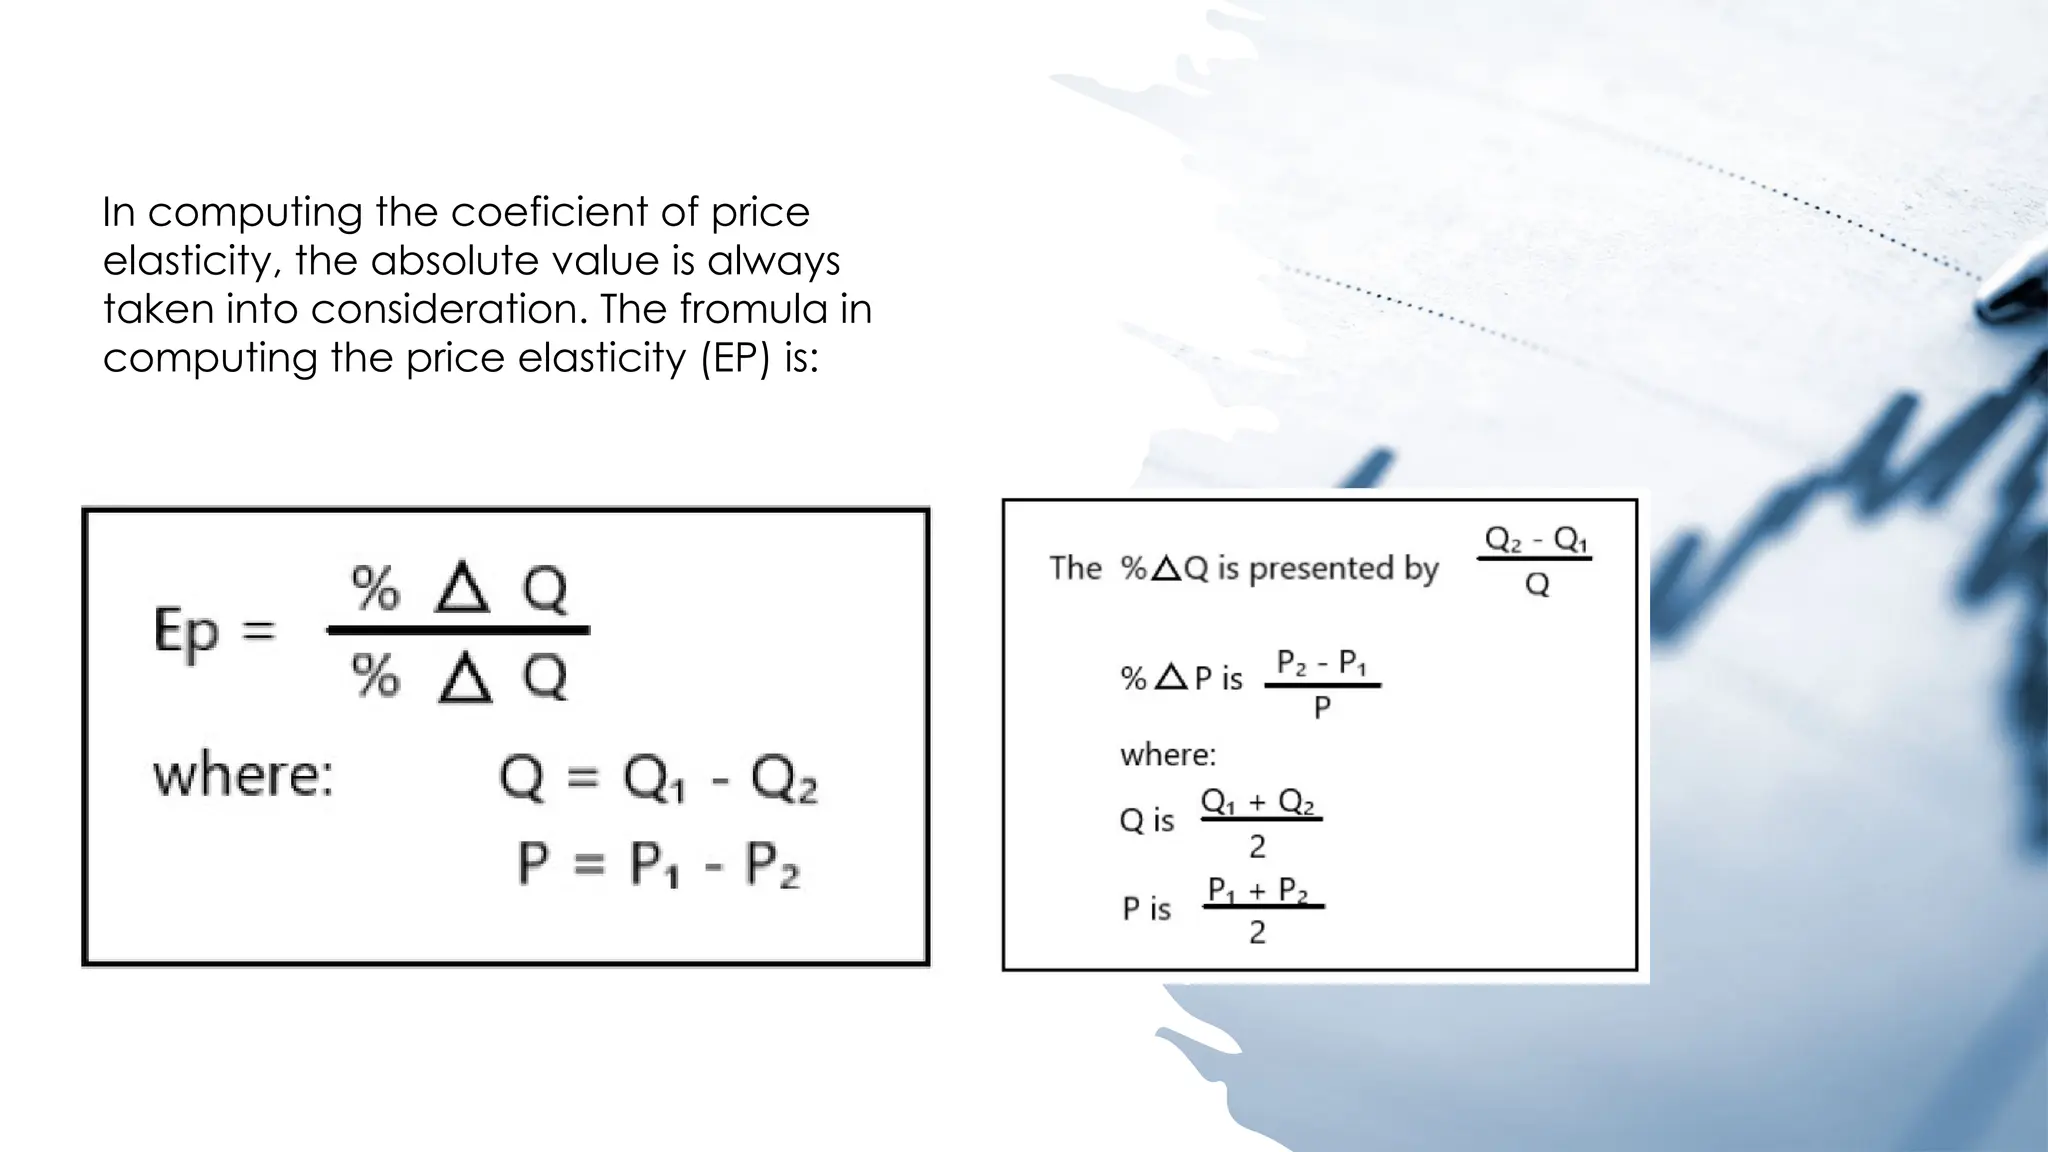
In computing thecoeficient of price
elasticity, the absolute value is always
taken into consideration. The fromula in
computing the price elasticity (EP) is:
25.
The common formulafor the coefficient
of price elasticity is:
₂
₂
₂
₂
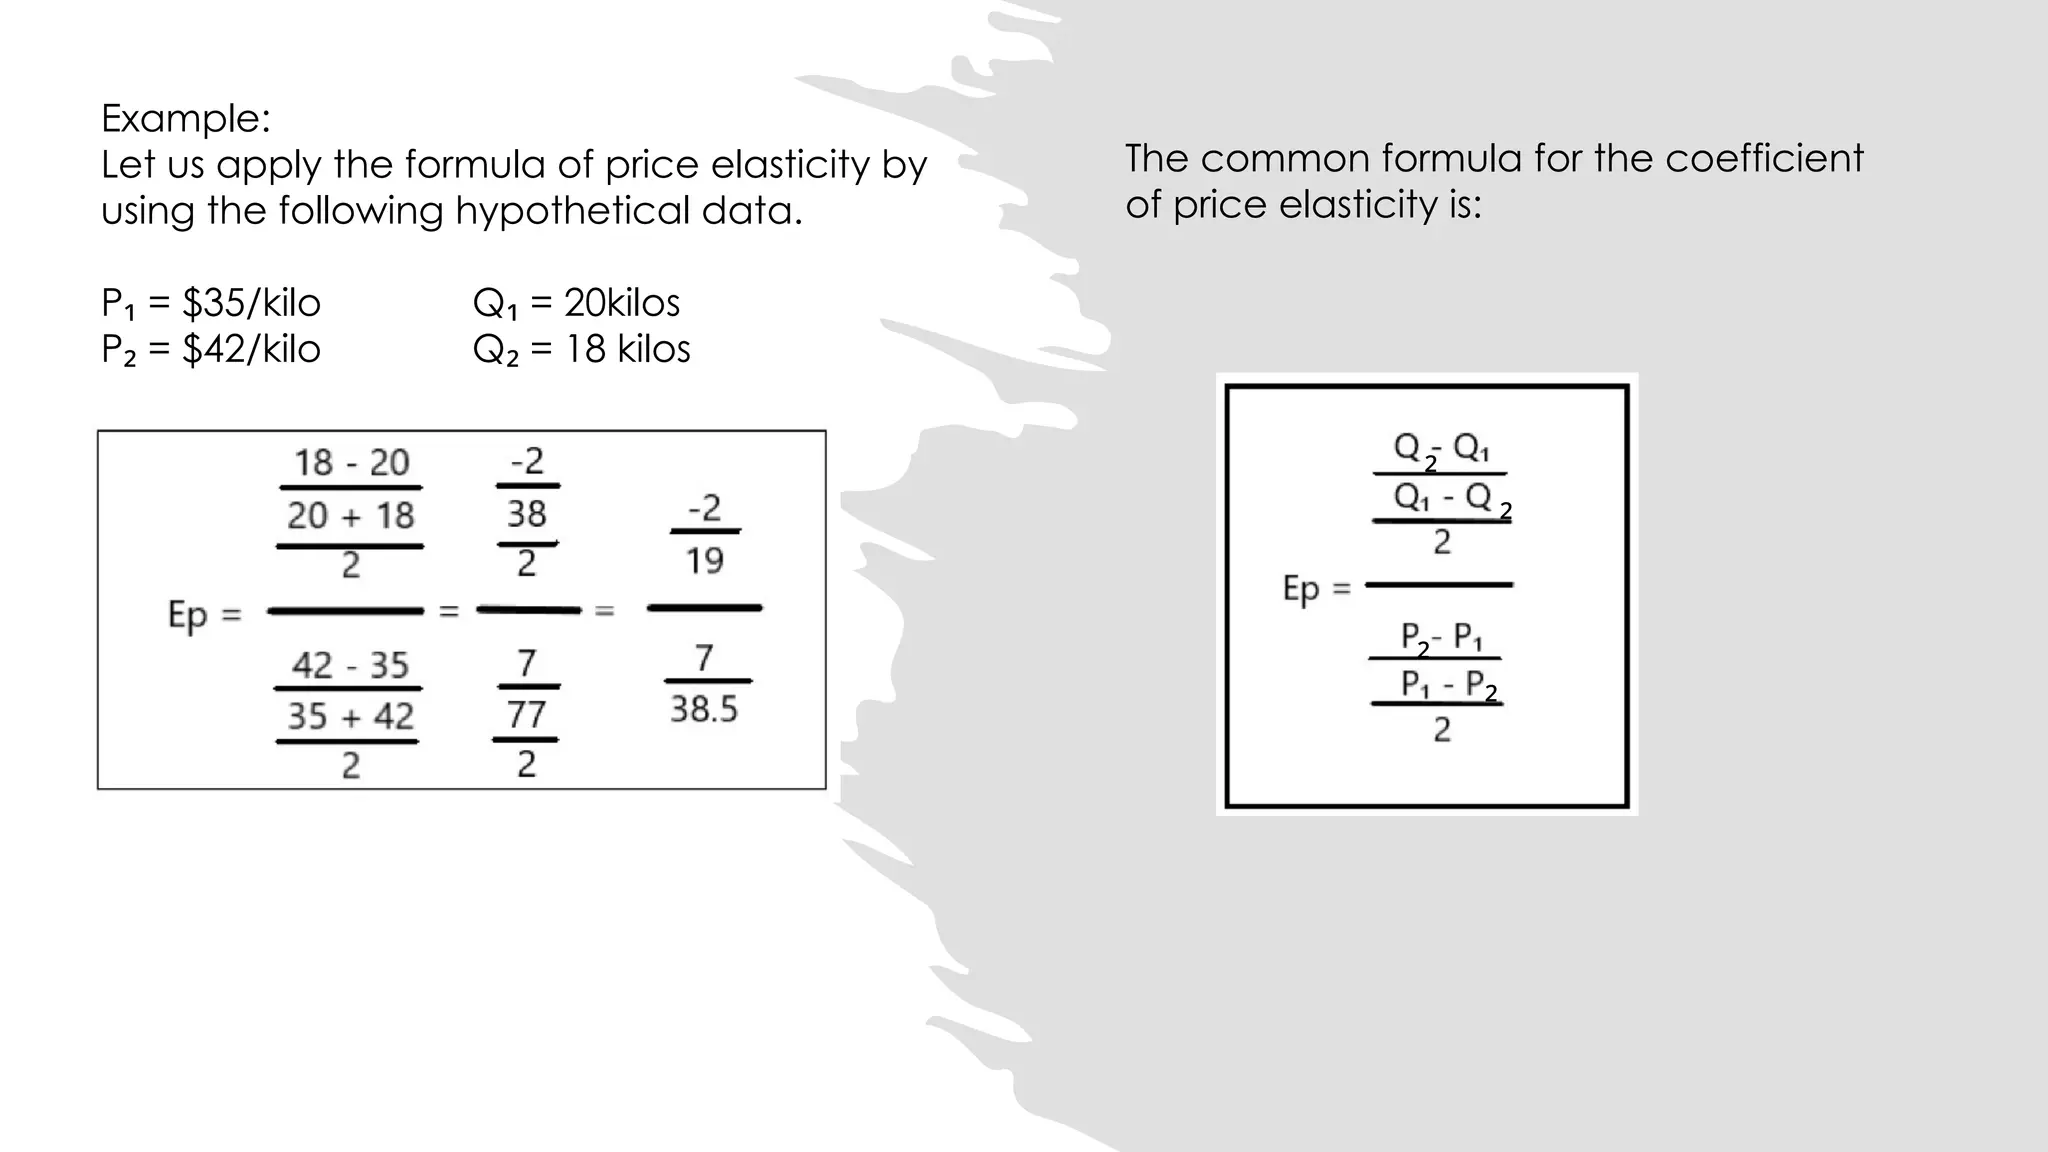
Example:
Let us apply the formula of price elasticity by
using the following hypothetical data.
P = $35/kilo Q = 20kilos
₁ ₁
P = $42/kilo Q = 18 kilos
₂ ₂
26.
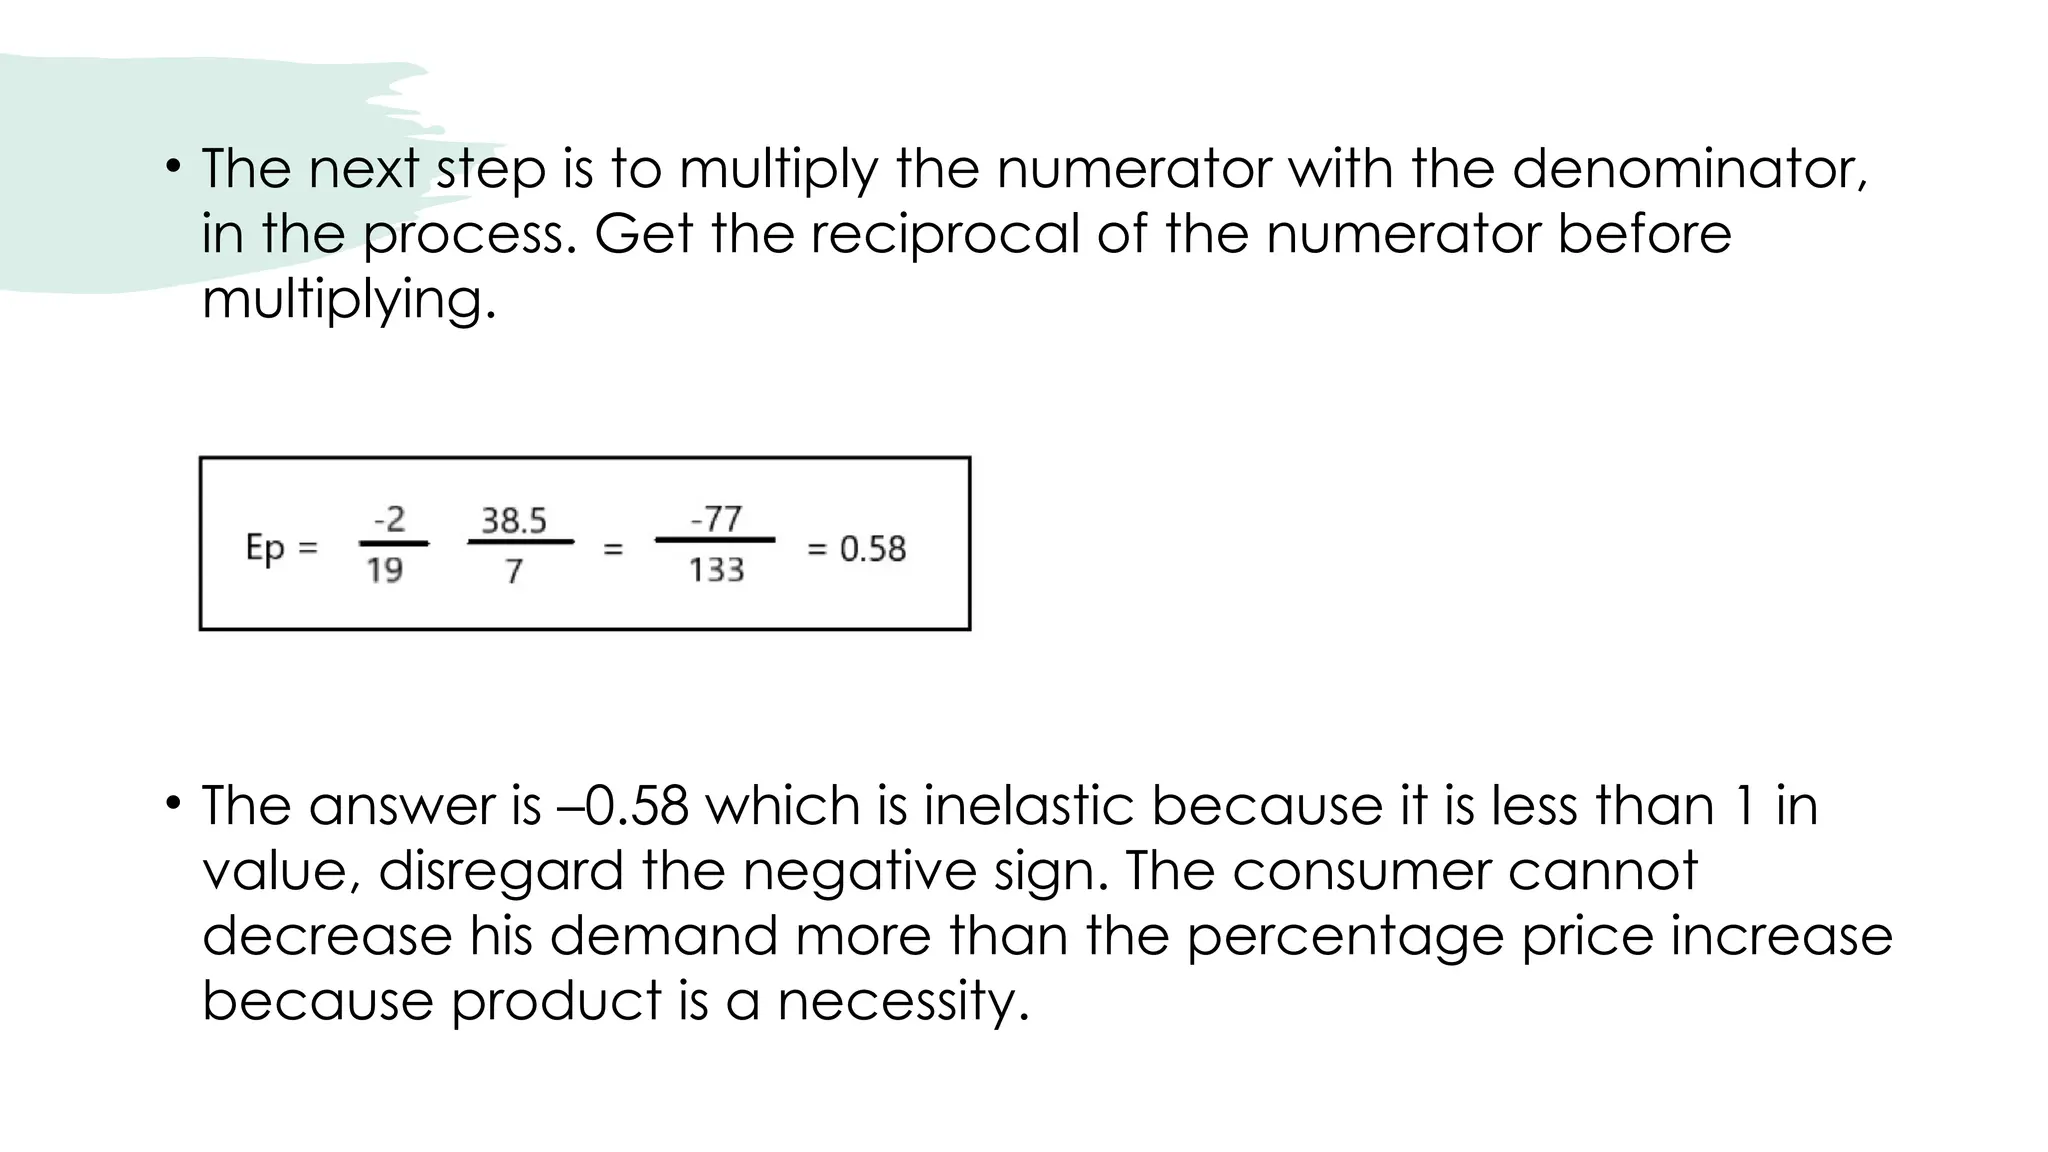
• The nextstep is to multiply the numerator with the denominator,
in the process. Get the reciprocal of the numerator before
multiplying.
• The answer is –0.58 which is inelastic because it is less than 1 in
value, disregard the negative sign. The consumer cannot
decrease his demand more than the percentage price increase
because product is a necessity.
27.
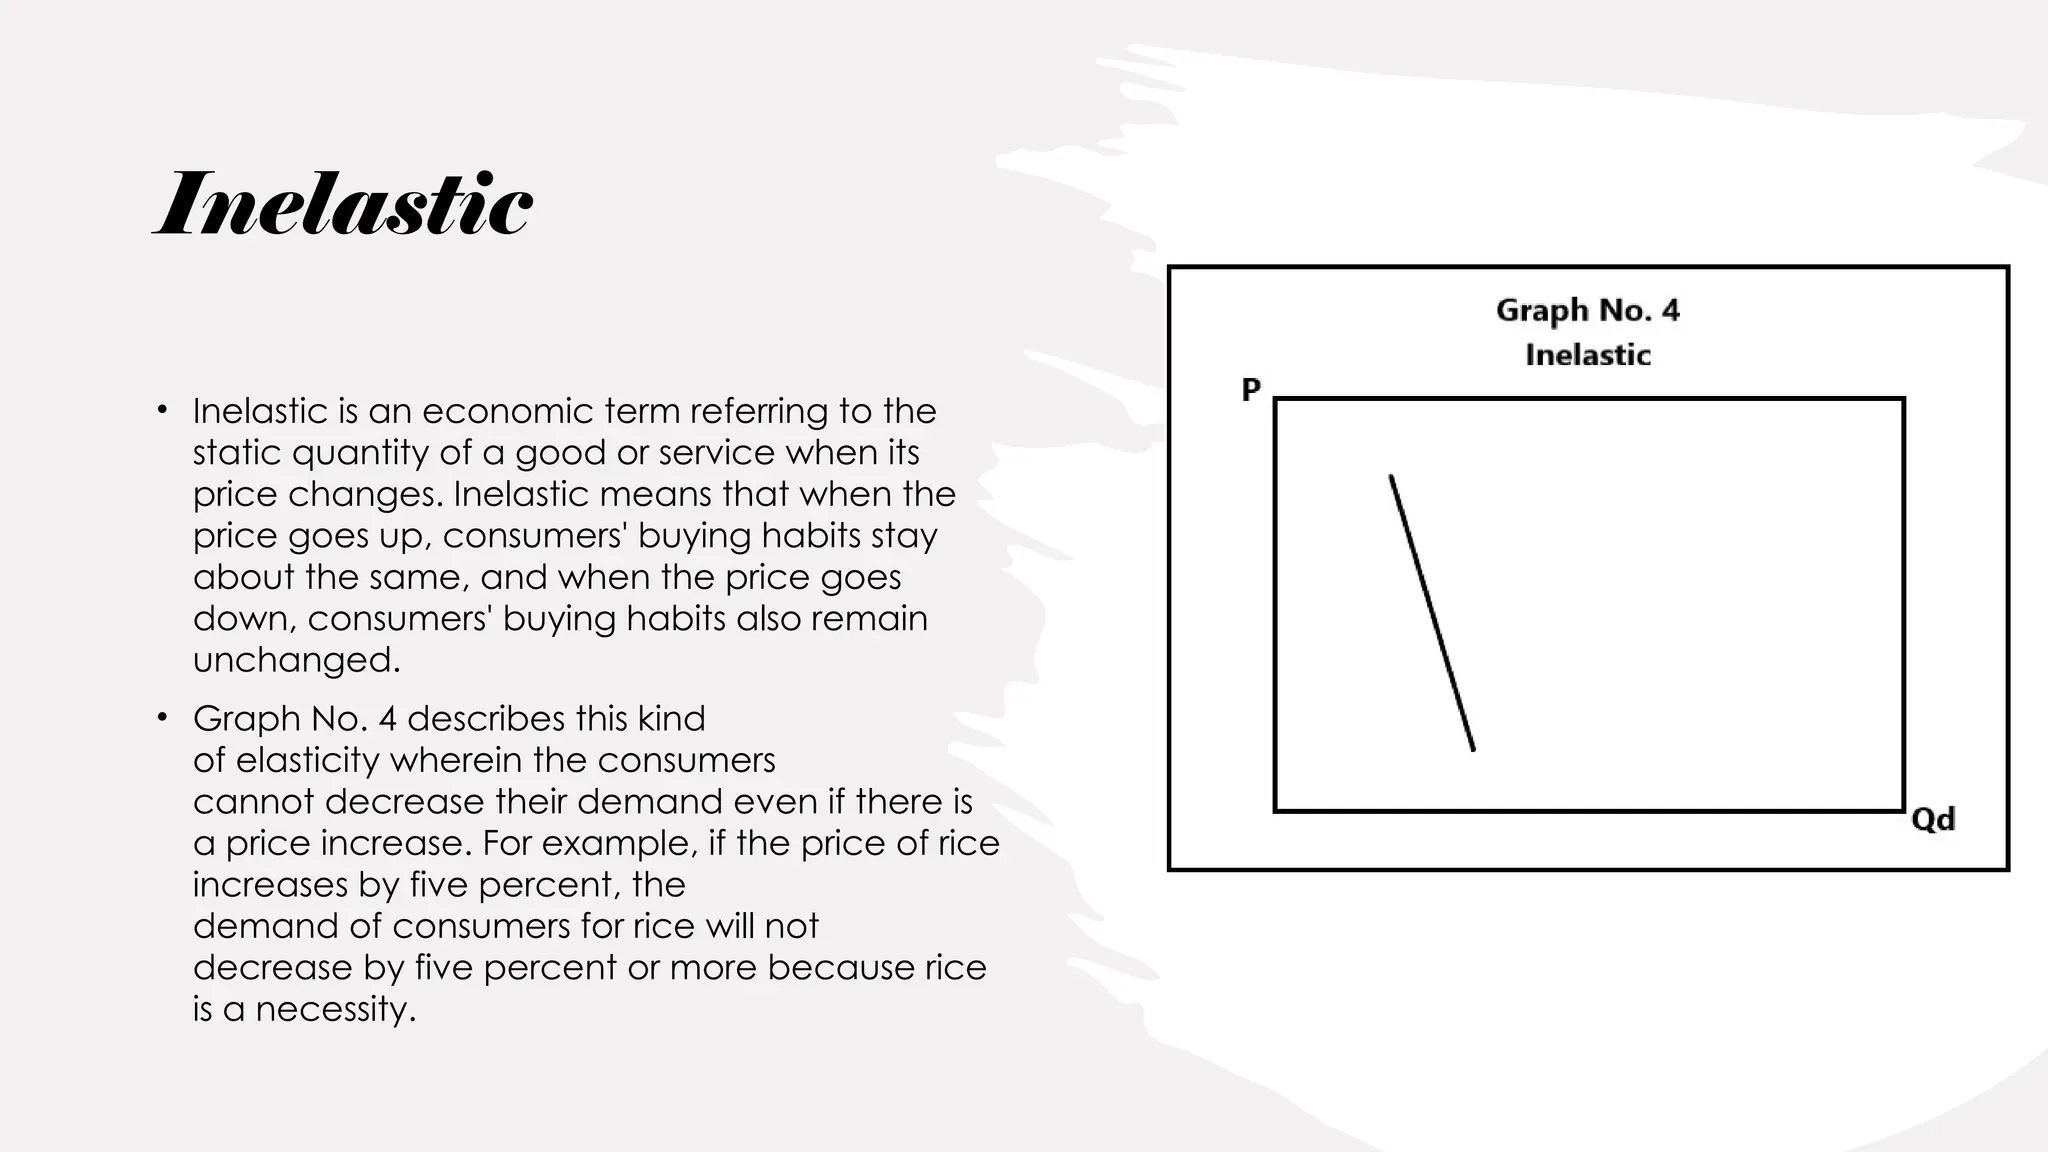
Inelastic
• Inelastic isan economic term referring to the
static quantity of a good or service when its
price changes. Inelastic means that when the
price goes up, consumers' buying habits stay
about the same, and when the price goes
down, consumers' buying habits also remain
unchanged.
• Graph No. 4 describes this kind
of elasticity wherein the consumers
cannot decrease their demand even if there is
a price increase. For example, if the price of rice
increases by five percent, the
demand of consumers for rice will not
decrease by five percent or more because rice
is a necessity.
28.
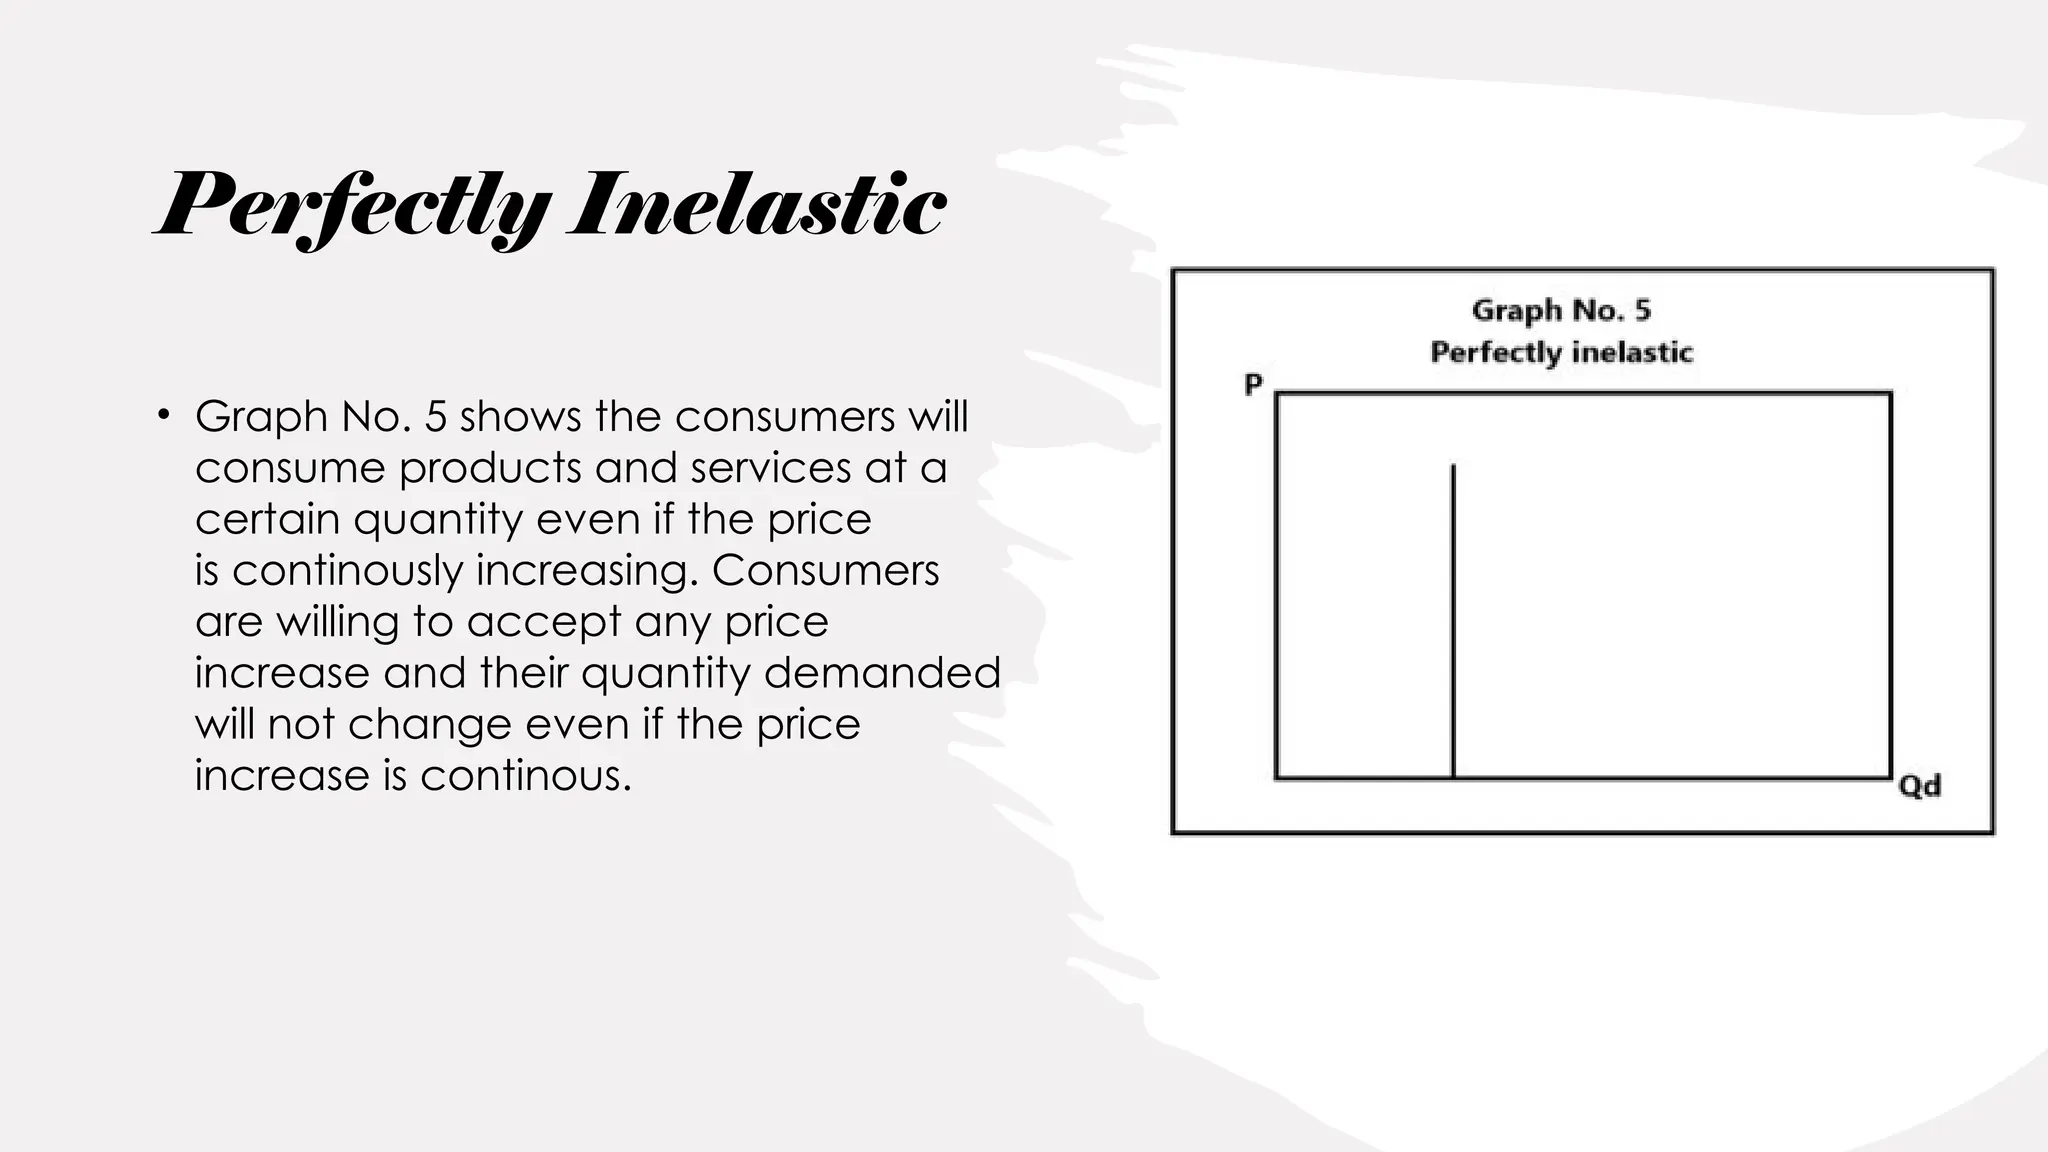
• Graph No.5 shows the consumers will
consume products and services at a
certain quantity even if the price
is continously increasing. Consumers
are willing to accept any price
increase and their quantity demanded
will not change even if the price
increase is continous.
Perfectly Inelastic
29.
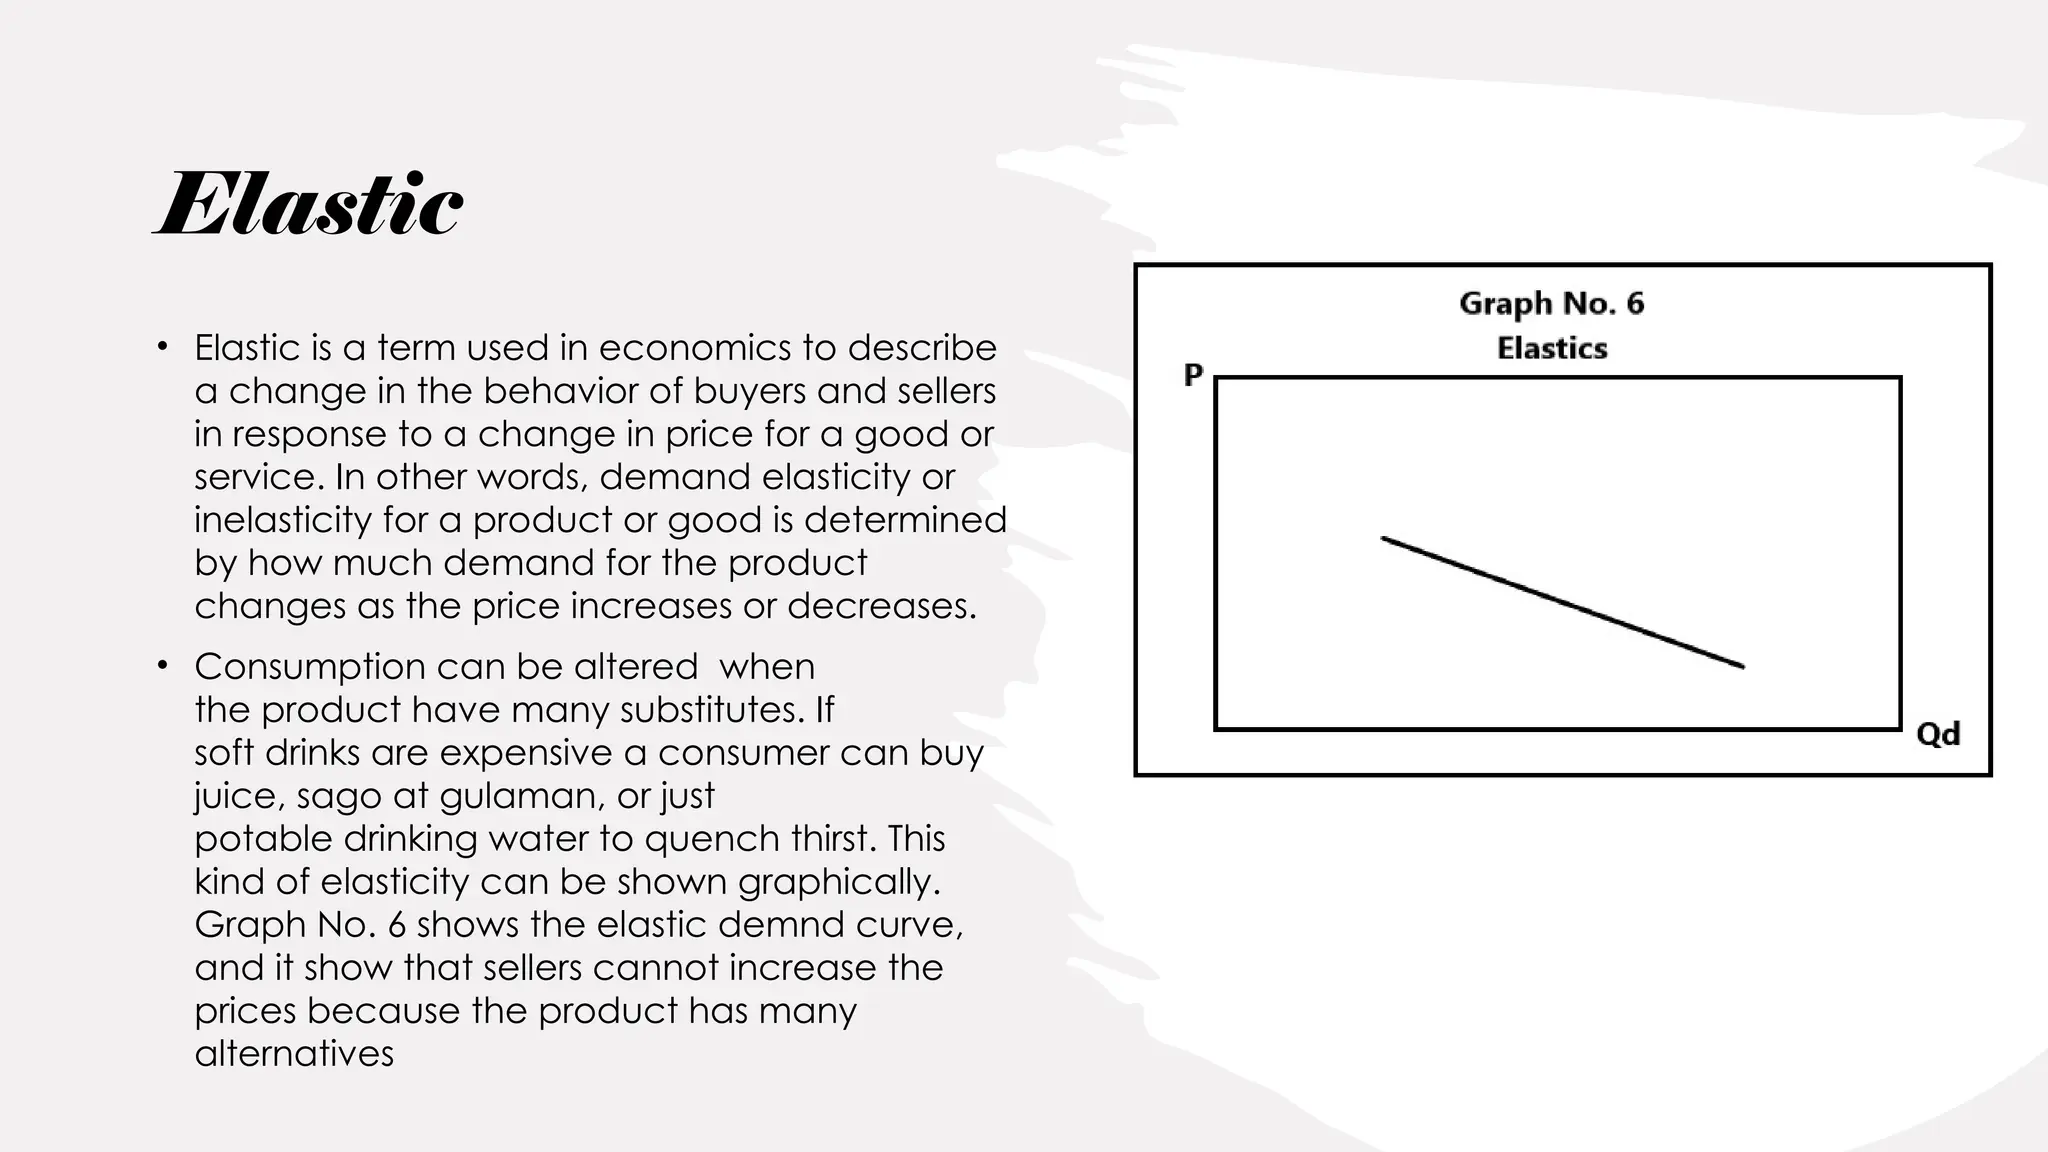
Elastic
• Elastic isa term used in economics to describe
a change in the behavior of buyers and sellers
in response to a change in price for a good or
service. In other words, demand elasticity or
inelasticity for a product or good is determined
by how much demand for the product
changes as the price increases or decreases.
• Consumption can be altered when
the product have many substitutes. If
soft drinks are expensive a consumer can buy
juice, sago at gulaman, or just
potable drinking water to quench thirst. This
kind of elasticity can be shown graphically.
Graph No. 6 shows the elastic demnd curve,
and it show that sellers cannot increase the
prices because the product has many
alternatives
30.
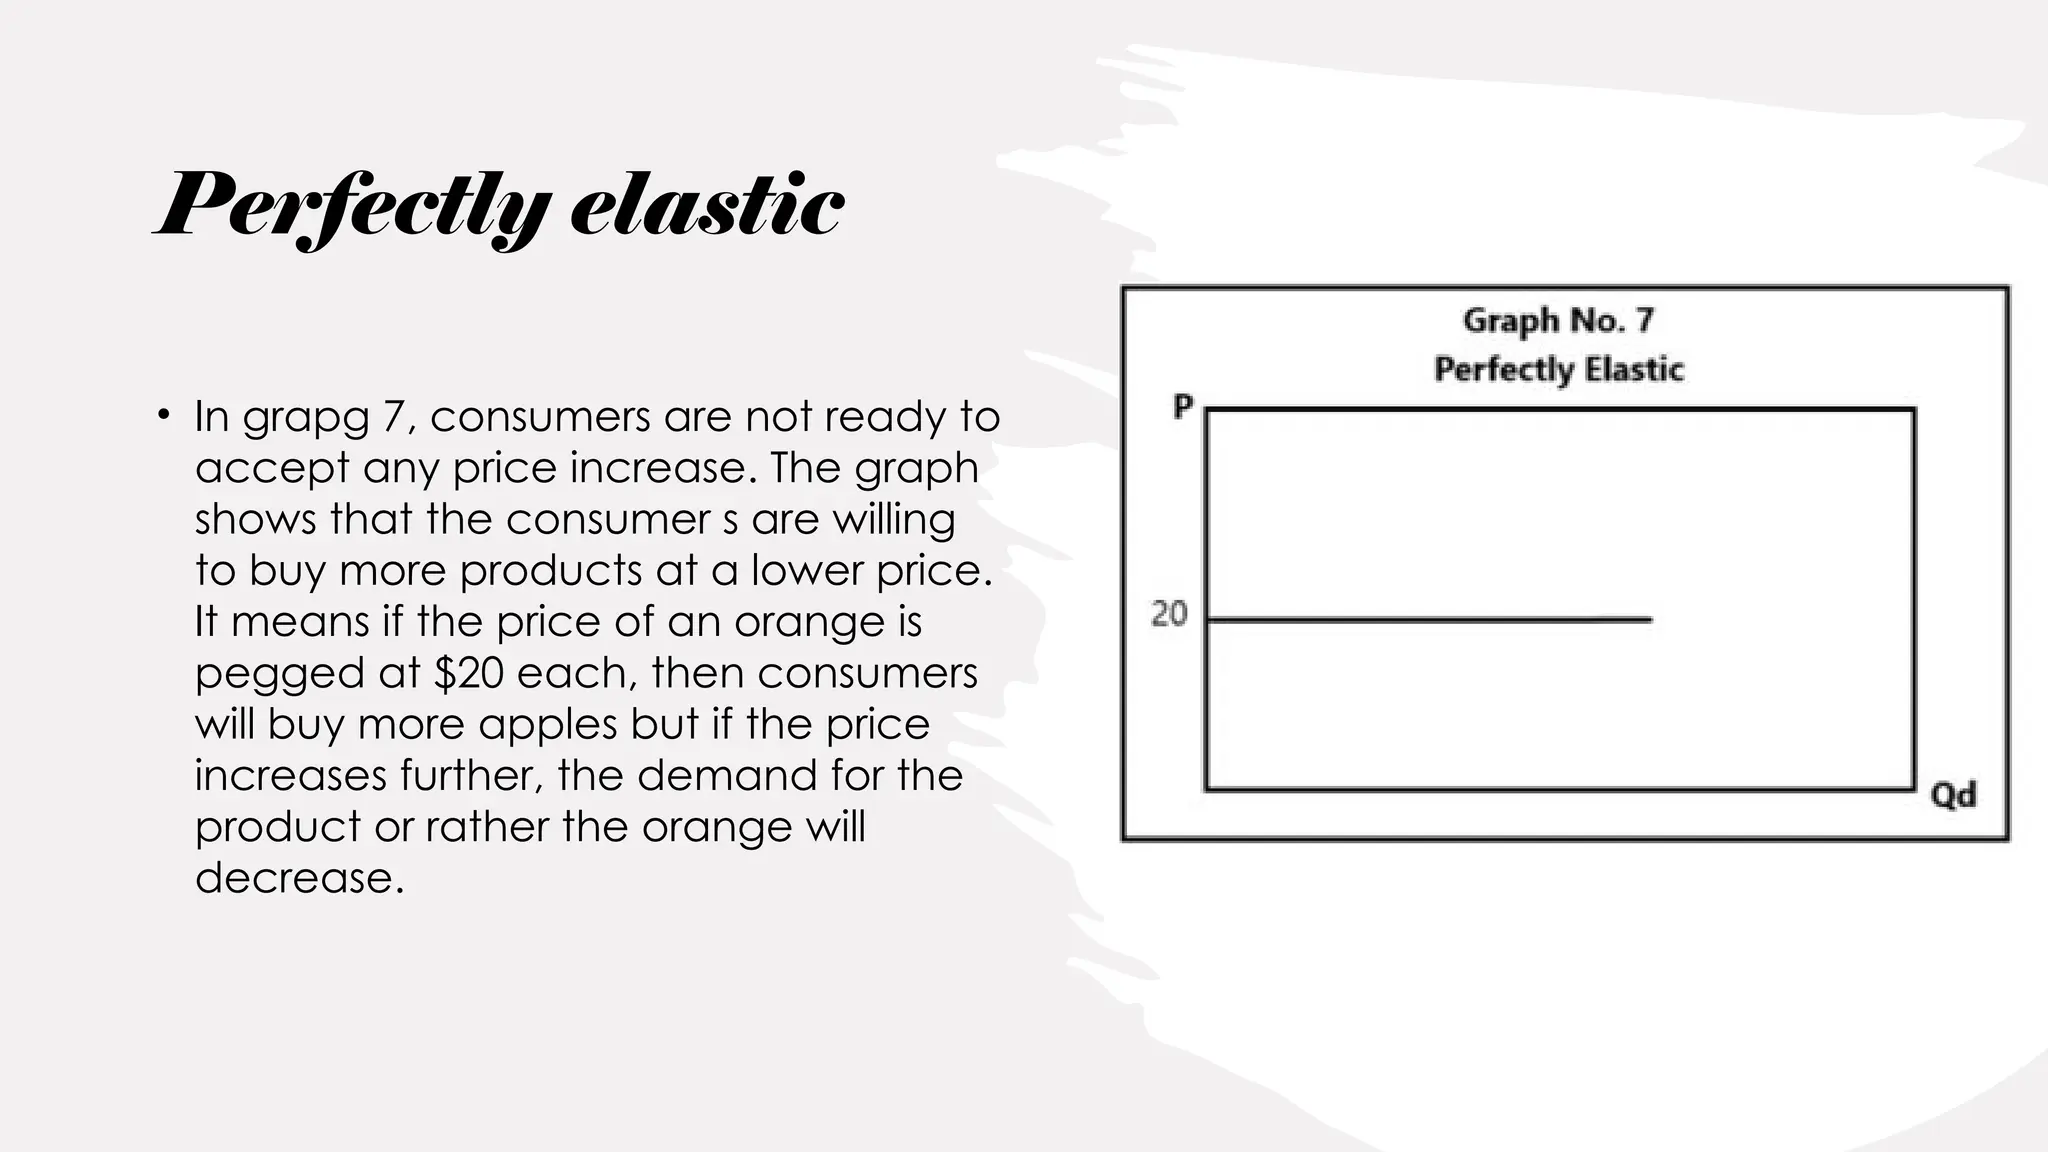
Perfectly elastic
• Ingrapg 7, consumers are not ready to
accept any price increase. The graph
shows that the consumer s are willing
to buy more products at a lower price.
It means if the price of an orange is
pegged at $20 each, then consumers
will buy more apples but if the price
increases further, the demand for the
product or rather the orange will
decrease.
31.
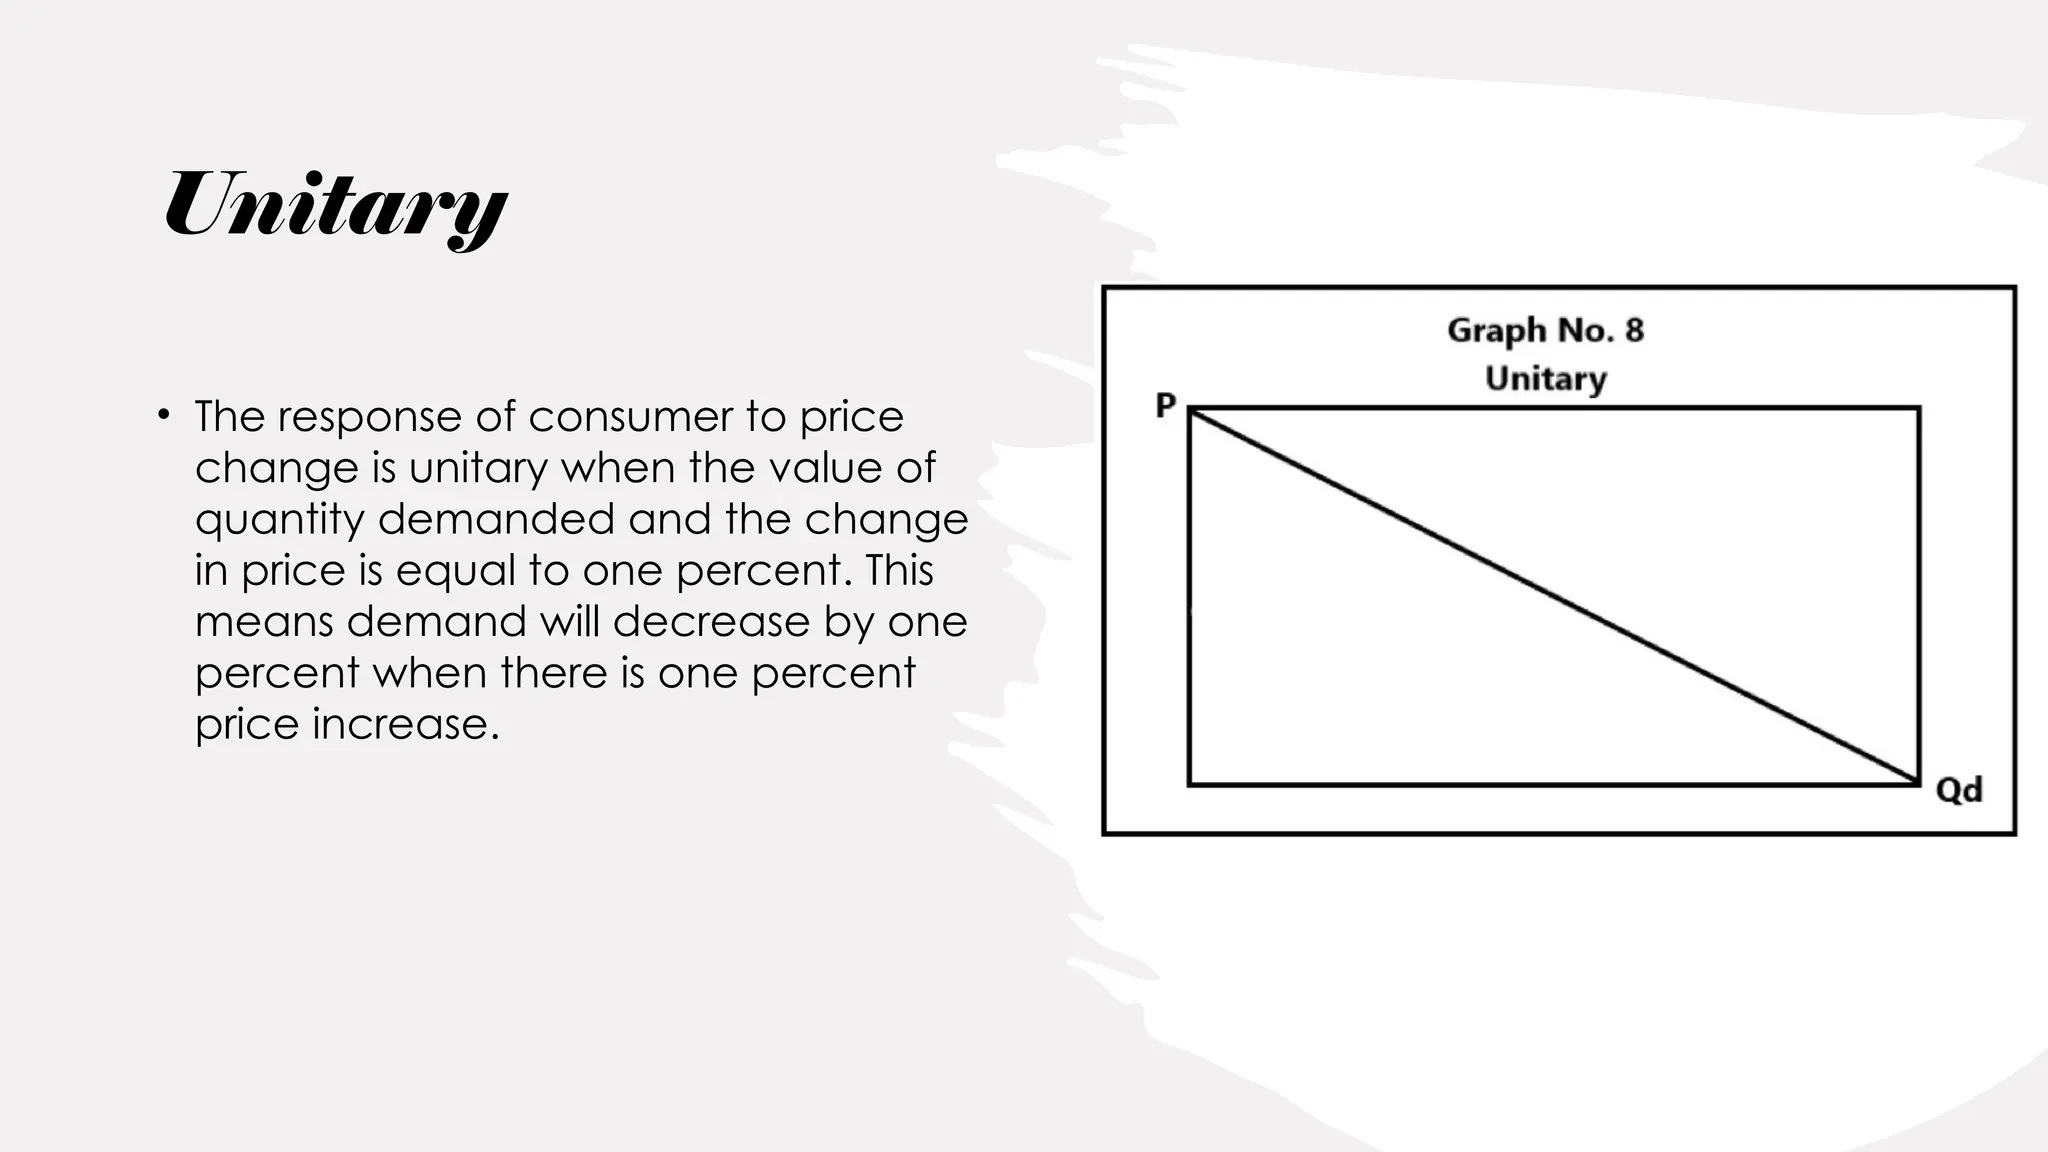
Unitary
• The responseof consumer to price
change is unitary when the value of
quantity demanded and the change
in price is equal to one percent. This
means demand will decrease by one
percent when there is one percent
price increase.