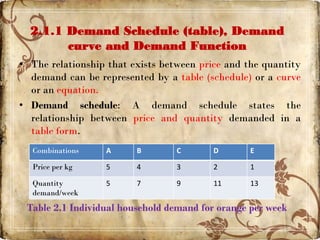
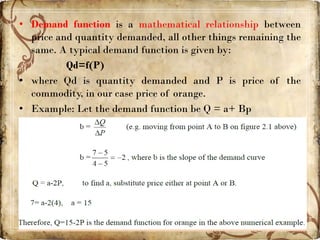
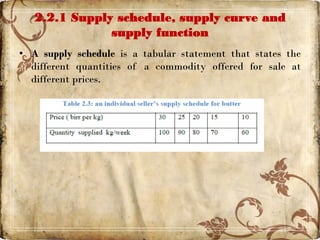
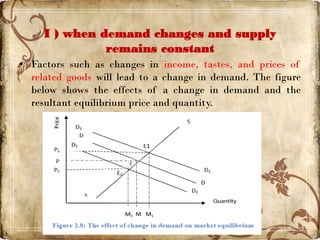
SlideShare a Scribd company logo
MAIN TITLE
• YOUR BUSINESS PURPOSE
YOUR
BUSINESS
NAME
Theory of Demand and
Supply
CHAPTER
Two
2.1 Theory of demand
1. Are demand and want similar? Why?
2. Why can’t we purchase all that we need or we desire to have?
3. Can we say that, with a decrease in the price of a commodity, a
consumer normally buys more of it? Why?
4. Explain why demand curves always slope downwards from left
to right. Are there any exceptions to this?
• Demand is one of the forces determining prices.
• The theory of demand is related to the economic activities
of consumers-consumption.
• The purpose of the theory of demand is to determine the
various factors that affect demand.
• Demand implies more than a mere desire to purchase a
commodity.
• Demand states that the consumer must be willing and able to
purchase the commodity, which he/she desires.
• These two essential factors are.
 If a consumer is willing to buy but is not able to pay, his/her
desire will not become demand.
 Similarly, if the consumer has the ability to pay but is not
willing to pay, his/her desire will not be called demand.
• Demand refers to various quantities of a commodity or
service that a consumer would purchase at a given time in a
market at various prices, given other things unchanged
(ceteris paribus).
• The quantity demanded of a particular commodity depends
on the price of that commodity.
• Law of demand: This is the principle of demand, which
states that , price of a commodity and its quantity
demanded are inversely related i.e., as price of a commodity
increases (decreases) quantity demanded for that
commodity decreases (increases), ceteris paribus.
2.1.1 Demand Schedule (table), Demand
curve and Demand Function
• The relationship that exists between price and the quantity
demand can be represented by a table (schedule) or a curve
or an equation.
• Demand schedule: A demand schedule states the
relationship between price and quantity demanded in a
table form.
Table 2.1 Individual household demand for orange per week
Combinations A B C D E
Price per kg 5 4 3 2 1
Quantity
demand/week
5 7 9 11 13
• Demand curve is a graphical representation of the
relationship between different quantities of demanded by
an individual at different prices per time period.
• Demand function is a mathematical relationship between
price and quantity demanded, all other things remaining the
same. A typical demand function is given by:
Qd=f(P)
• where Qd is quantity demanded and P is price of the
commodity, in our case price of orange.
• Example: Let the demand function be Q = a+ Bp
Market Demand
• Market Demand: The market demand schedule, curve or
function is derived by horizontally adding the quantity
demanded for the product by all buyers at each price.
• The following graph depicts market demand curve at price
equal to 3
• Numerical Example: Suppose the individual demand
function of a product is given by: P=10 - Q /2 and there are
about 100 identical buyers in the market. Then the market
demand function is given by:
• P= 10 - Q /2
• Q /2 =10-P
• Q= 20 - 2P
• Qm = (20 – 2P) 100
• = 2000-200P
2.1.2 Determinants of Demand
• The demand for a product is influenced by many factors.
I. Price of the product
II. Taste or preference of consumers
III.Income of the consumers
IV. Price of related goods
V. Consumers expectation of income and price
VI. Number of buyers in the market
• Note. When we state the law of demand, we kept all the
factors to remain constant except the price of the good.
• Those factors listed above except price are called demand
shifters. A change in own price is only a movement along the
same demand curve
Changes in demand
• Changes in demand: a change in any determinant of
demand—except price causes the demand curve to shift.
• If buyers choose to purchase more at any price, the demand
curve shifts rightward—an increase in demand.
• If buyers choose to purchase less at any price, the demand
curve shifts leftward—a decrease in demand.
I. Taste or preference
• When the taste of a consumer changes in favor of a good,
her/his demand will increase and the opposite is true.
II. Income of the consumer
• Goods are classified into two categories depending on how a
change in income affects their demand.
• These are normal goods and inferior goods.
• Normal Goods are goods whose demand increases as income
increase, while inferior goods are those whose demand is
inversely related with income.
• In general, inferior goods are poor quality goods with
relatively lower price and buyers of such goods are expected
to shift to better quality goods as their income increases.
III. Price of related goods
 Two goods are said to be related if a change in the price of
one good affects the demand for another good.
 There are two types of related goods. These are substitute
and complimentary goods.
 Substitute goods are goods which satisfy the same desire of the
consumer. For example, tea and coffee or Pepsi and Coca-Cola
are substitute goods.
 If two goods are substitutes, then price of one and the
demand for the other are directly related.
 Complimentary goods, on the other hand, are those goods
which are jointly consumed. For example, car and fuel or tea
and sugar are considered as compliments.
 If two goods are complements, then price of one and the
demand for the other are inversely related.
IV. Consumer expectation of income and price
 Higher price expectation will increase demand while a lower
future price expectation will decrease the demand for the
good.
V. Number of buyer in the market
 An increase in the number of buyers will increase demand
while a decrease in the number of buyers will decrease
demand.
2.1.3 Elasticity of Demand
• Elasticity is a measure of responsiveness of a dependent
variable to changes in an independent variable.
• Accordingly, we have the concepts of elasticity of demand
and elasticity of supply.
 Elasticity of demand refers to the degree of responsiveness
of quantity demanded of a good to a change in its price, or
change in income, or change in prices of related goods.
 Commonly, there are three kinds of demand elasticity:
 Price elasticity
 Income elasticity
 Cross elasticity
I. Price Elasticity of Demand
• Price elasticity of demand means degree of responsiveness
of demand to change in price.
• It indicates how consumers react to changes in price.
• The greater the reaction the greater will be the elasticity,
and the lesser the reaction, the smaller will be the elasticity.
• Computed as the percentage change in quantity demanded
divided by the percentage change in price.
• Demand for commodities like clothes, fruit etc. changes
when there is even a small change in their price.
• Demand for commodities which are basic necessities of life,
like salt, food grains etc., may not change even if price
changes
• Price elasticity demand can be measured in two ways. These
are point and arc elasticity.
A. Point Price Elasticity of Demand
• This is calculated to find elasticity at a given point. The
price elasticity of demand can be determined by the
following formula.
B. Arc price elasticity of demand
 In arc price elasticity of demand, the midpoints of the old
and the new values of both price and quantity demanded
are used.
 It measures a portion or a segment of the demand curve
between the two points.
 An arc is a portion of a curve line, hence, a portion or
segment of a demand curve.
• A numerical example to illustrate arc elasticity. Suppose
that the price of a commodity is Br. 5 and the quantity
demanded at that price is 100 units of a commodity. Now
assume that the price of the commodity falls to Br. 4 and
the quantity demanded rises to 110 units. In terms of the
above formula, the value of the arc elasticity will be
• Elasticity of demand is unit free because it is a ratio of
percentage change.
• Elasticity of demand is usually a negative number because
of the law of demand.
Determinants of price Elasticity of Demand
I. The availability of substitutes: the more substitutes
available for a product, the more elastic will be the price
elasticity of demand.
II. Time: In the long- run, price elasticity of demand tends to
be elastic. Because:
 More substitute goods could be produced.
 People tend to adjust their consumption pattern.
III. The proportion of income consumers spend for a
product:-the smaller the proportion of income spent for a
good, the less price elastic will be.
IV. The importance of the commodity in the consumers’
budget :
 Luxury goods tend to be more elastic, example: gold.
 Necessity goods tend to be less elastic example: Salt.
ii. Income Elasticity of Demand
• It is a measure of responsiveness of demand to change in
income
iii. Cross price Elasticity of Demand
• Measures how much the demand for a product is affected by
a change in price of another good.
• Example: Consider the following data which shows the
changes in quantity demanded of good X in response to
changes in the price of good Y.
• Calculate the cross –price elasticity of demand between the
two goods. What can you say about the two goods?
2.2 Theory of Supply
• Supply indicates various quantities of a product that sellers
(producers) are willing and able to provide at different prices
in a given period of time, other things remaining
unchanged.
• The law of supply: states that, as price of a product
increase, quantity supplied of the product increases, and as
price decreases, quantity supplied decreases, ceteris paribus.
• It tells us there is a positive relationship between price and
quantity supplied.
2.2.1 Supply schedule, supply curve and
supply function
• A supply schedule is a tabular statement that states the
different quantities of a commodity offered for sale at
different prices.
• A supply curve conveys the same information as a supply
schedule. But it shows the information graphically rather
than in a tabular form.
• Supply function is mathematical representation
• S = f(P), where S is quantity supplied and P is price of the
commodity
• Market supply: It is derived by horizontally
adding the quantity supplied of the product
by all sellers at each price.
2.2.2 Determinants of Supply
• the supply of a particular product is determined by:
I ) price of inputs ( cost of inputs)
II) technology
III) prices of related goods
IV) sellers‘ expectation of price of the product
V) taxes & subsidies
VI) number of sellers in the market
VII) weather, etc.
I ) Effect of change in input price on supply of a product
• An increase in the price of inputs such as labour, raw
materials, capital, etc causes a decrease in the supply of the
product which is represented by a leftward shift of the
supply curve.
II ) Effect of change in Technology
• Technological advancement enables a firm to produce and
supply more in the market. This shifts the supply curve
outward.
III) Effect of change in weather condition
• A change in weather condition will have an impact on the
supply of a number of products, especially agricultural
products
2.2.3 Elasticity of supply
• It is the degree of responsiveness of the supply to change in
price.
• It is the percentage change in quantity supplied divided by
the percentage change in price.
• The point price elasticity of supply can be calculated as the
ratio of proportionate change in quantity supplied of a
commodity to a given proportionate change in its price.
• Like elasticity of demand, price elasticity of supply can be
elastic, inelastic, unitary elastic, perfectly elastic or perfectly
inelastic.
 The supply is elastic when a small change on price leads to
great change in supply.
 It is inelastic or less elastic when a great change in price
induces only a slight change in supply.
 If the supply is perfectly inelastic, it will be represented by a
vertical line shown as below.
 If supply is perfectly elastic it will be represented by a
horizontal straight line as in second diagram.
2.3 Market Equilibrium
• Market equilibrium occurs when market demand equals
market supply.
Numerical example:
• Given market demand: Qd= 100-2P, and market supply:
P =( Qs /2) + 10
• a) Calculate the market equilibrium price and quantity
• b) Determine, whether there is surplus or shortage at P= 25
and P= 35.
Effects of shift in demand and supply on
equilibrium
• Given demand and supply the equilibrium price and
quantity are stable.
• Changes in demand and supply bring about changes in the
equilibrium price level and the equilibrium quantity.
I ) when demand changes and supply
remains constant
• Factors such as changes in income, tastes, and prices of
related goods will lead to a change in demand. The figure
below shows the effects of a change in demand and the
resultant equilibrium price and quantity.
ii. When supply changes and demand
remains constant
• Changes in supply are brought by changes in technical
knowledge and factor prices. The following graph explains
the effects of changes in supply.
III) Effects of combined changes in demand
and supply
 When both demand and supply increase, the quantity of the
product will increase definitely. But it is not certain whether
the price will rise or fall.
I. If an increase in demand is more than an increase in
supply, then the price goes up.
II. If an increase in supply is more than an increase in
demand, the price falls.
III.If the increase in demand and supply is same, then the
price remains the same.
 When demand and supply decline, the quantity decreases.
But the change in price will depend upon the relative fall in
demand and supply.
I. When the fall in demand is more than the fall in supply,
the price will decrease.
II. when the fall in supply is more than the fall in demand,
the price will rise.
III. If both demand and supply decline in the same ratio,
there is no change in the equilibrium price, but the
quantity decreases.
END…

More Related Content

Similar to Economics 2.pdf

Demand
DemandDemand
Demand
UdayDasArko
 
Theory Of Demand for business studies.pptx
Theory Of Demand for business studies.pptxTheory Of Demand for business studies.pptx
Theory Of Demand for business studies.pptx
AyushmanMishra41
 
Chapter 2 Demand and Supply.docx
Chapter 2 Demand and Supply.docxChapter 2 Demand and Supply.docx
Chapter 2 Demand and Supply.docx
TsegayeAndualem
 
DEMAND AND ELASTICITY OF DEMAND.pptx
DEMAND AND ELASTICITY OF DEMAND.pptxDEMAND AND ELASTICITY OF DEMAND.pptx
DEMAND AND ELASTICITY OF DEMAND.pptx
ArjavJain69
 
General Economics
General EconomicsGeneral Economics
General Economics
Dhina Karan
 
General Economics
General EconomicsGeneral Economics
General Economics
Dhina Karan
 
General Economics
General EconomicsGeneral Economics
General Economics
Dhina Karan
 
16.terms used in_economics_viz_demand_and_supply_
16.terms used in_economics_viz_demand_and_supply_16.terms used in_economics_viz_demand_and_supply_
16.terms used in_economics_viz_demand_and_supply_
Noshad Ahmed Wahocho
 
Demand.
Demand.Demand.
Demand.
ramesh kumar
 
Lecture 3 understanding demand
Lecture 3 understanding demandLecture 3 understanding demand
Lecture 3 understanding demand
Mohammed Shefin
 
Introduction to Supply and Demand and Market Equilibrium.pptx
Introduction to Supply and Demand and Market Equilibrium.pptxIntroduction to Supply and Demand and Market Equilibrium.pptx
Introduction to Supply and Demand and Market Equilibrium.pptx
NonSy1
 
demand.pptx
demand.pptxdemand.pptx
demand.pptx
karunikaruni
 
demand& the elasticity and degrees of .PPT
demand& the elasticity  and degrees of .PPTdemand& the elasticity  and degrees of .PPT
demand& the elasticity and degrees of .PPT
RichaGoel44
 
Lect 9.pptx
Lect 9.pptxLect 9.pptx
Lect 9.pptx
SayaleeSalunkhe
 
Elasticity of Demand, Price and Income- Micro and Macro Economics
 Elasticity of Demand, Price and Income- Micro and Macro Economics Elasticity of Demand, Price and Income- Micro and Macro Economics
Elasticity of Demand, Price and Income- Micro and Macro Economics
Momina Riaz
 
Plus 2 Chapter 2 Economics Jessy Joseph .pptx
Plus 2 Chapter 2 Economics  Jessy Joseph .pptxPlus 2 Chapter 2 Economics  Jessy Joseph .pptx
Plus 2 Chapter 2 Economics Jessy Joseph .pptx
Richiees Tuition Centre
 
demand curve
demand curvedemand curve
demand curve
Jyothi P
 
Chapter Two ppt.pdf managerial economics
Chapter Two ppt.pdf managerial economicsChapter Two ppt.pdf managerial economics
Chapter Two ppt.pdf managerial economics
hamdiabdrhman
 
Demand analysis ppts
Demand  analysis pptsDemand  analysis ppts
Demand analysis ppts
giripratibha
 

Similar to Economics 2.pdf (20)

Demand
DemandDemand
Demand
 
Theory Of Demand for business studies.pptx
Theory Of Demand for business studies.pptxTheory Of Demand for business studies.pptx
Theory Of Demand for business studies.pptx
 
Chapter 2 Demand and Supply.docx
Chapter 2 Demand and Supply.docxChapter 2 Demand and Supply.docx
Chapter 2 Demand and Supply.docx
 
DEMAND AND ELASTICITY OF DEMAND.pptx
DEMAND AND ELASTICITY OF DEMAND.pptxDEMAND AND ELASTICITY OF DEMAND.pptx
DEMAND AND ELASTICITY OF DEMAND.pptx
 
General Economics
General EconomicsGeneral Economics
General Economics
 
General Economics
General EconomicsGeneral Economics
General Economics
 
General Economics
General EconomicsGeneral Economics
General Economics
 
16.terms used in_economics_viz_demand_and_supply_
16.terms used in_economics_viz_demand_and_supply_16.terms used in_economics_viz_demand_and_supply_
16.terms used in_economics_viz_demand_and_supply_
 
Demand.
Demand.Demand.
Demand.
 
Lecture 3 understanding demand
Lecture 3 understanding demandLecture 3 understanding demand
Lecture 3 understanding demand
 
Introduction to Supply and Demand and Market Equilibrium.pptx
Introduction to Supply and Demand and Market Equilibrium.pptxIntroduction to Supply and Demand and Market Equilibrium.pptx
Introduction to Supply and Demand and Market Equilibrium.pptx
 
Copy of Module3_Demand Analysis.ppt
Copy of Module3_Demand Analysis.pptCopy of Module3_Demand Analysis.ppt
Copy of Module3_Demand Analysis.ppt
 
demand.pptx
demand.pptxdemand.pptx
demand.pptx
 
demand& the elasticity and degrees of .PPT
demand& the elasticity  and degrees of .PPTdemand& the elasticity  and degrees of .PPT
demand& the elasticity and degrees of .PPT
 
Lect 9.pptx
Lect 9.pptxLect 9.pptx
Lect 9.pptx
 
Elasticity of Demand, Price and Income- Micro and Macro Economics
 Elasticity of Demand, Price and Income- Micro and Macro Economics Elasticity of Demand, Price and Income- Micro and Macro Economics
Elasticity of Demand, Price and Income- Micro and Macro Economics
 
Plus 2 Chapter 2 Economics Jessy Joseph .pptx
Plus 2 Chapter 2 Economics  Jessy Joseph .pptxPlus 2 Chapter 2 Economics  Jessy Joseph .pptx
Plus 2 Chapter 2 Economics Jessy Joseph .pptx
 
demand curve
demand curvedemand curve
demand curve
 
Chapter Two ppt.pdf managerial economics
Chapter Two ppt.pdf managerial economicsChapter Two ppt.pdf managerial economics
Chapter Two ppt.pdf managerial economics
 
Demand analysis ppts
Demand  analysis pptsDemand  analysis ppts
Demand analysis ppts
 

Recently uploaded

Introduction to Value Added Tax System.ppt
Introduction to Value Added Tax System.pptIntroduction to Value Added Tax System.ppt
Introduction to Value Added Tax System.ppt
VishnuVenugopal84
 
Empowering the Unbanked: The Vital Role of NBFCs in Promoting Financial Inclu...
Empowering the Unbanked: The Vital Role of NBFCs in Promoting Financial Inclu...Empowering the Unbanked: The Vital Role of NBFCs in Promoting Financial Inclu...
Empowering the Unbanked: The Vital Role of NBFCs in Promoting Financial Inclu...
Vighnesh Shashtri
 
Introduction to Indian Financial System ()
Introduction to Indian Financial System ()Introduction to Indian Financial System ()
Introduction to Indian Financial System ()
Avanish Goel
 
Poonawalla Fincorp and IndusInd Bank Introduce New Co-Branded Credit Card
Poonawalla Fincorp and IndusInd Bank Introduce New Co-Branded Credit CardPoonawalla Fincorp and IndusInd Bank Introduce New Co-Branded Credit Card
Poonawalla Fincorp and IndusInd Bank Introduce New Co-Branded Credit Card
nickysharmasucks
 
what is a pi whale and how to access one.
what is a pi whale and how to access one.what is a pi whale and how to access one.
what is a pi whale and how to access one.
DOT TECH
 
How to get verified on Coinbase Account?_.docx
How to get verified on Coinbase Account?_.docxHow to get verified on Coinbase Account?_.docx
How to get verified on Coinbase Account?_.docx
Buy bitget
 
Webinar Exploring DORA for Fintechs - Simont Braun
Webinar Exploring DORA for Fintechs - Simont BraunWebinar Exploring DORA for Fintechs - Simont Braun
Webinar Exploring DORA for Fintechs - Simont Braun
FinTech Belgium
 
how to sell pi coins in all Africa Countries.
how to sell pi coins in all Africa Countries.how to sell pi coins in all Africa Countries.
how to sell pi coins in all Africa Countries.
DOT TECH
 
how to sell pi coins at high rate quickly.
how to sell pi coins at high rate quickly.how to sell pi coins at high rate quickly.
how to sell pi coins at high rate quickly.
DOT TECH
 
The new type of smart, sustainable entrepreneurship and the next day | Europe...
The new type of smart, sustainable entrepreneurship and the next day | Europe...The new type of smart, sustainable entrepreneurship and the next day | Europe...
The new type of smart, sustainable entrepreneurship and the next day | Europe...
Antonis Zairis
 
一比一原版BCU毕业证伯明翰城市大学毕业证成绩单如何办理
一比一原版BCU毕业证伯明翰城市大学毕业证成绩单如何办理一比一原版BCU毕业证伯明翰城市大学毕业证成绩单如何办理
一比一原版BCU毕业证伯明翰城市大学毕业证成绩单如何办理
ydubwyt
 
Commercial Bank Economic Capsule - May 2024
Commercial Bank Economic Capsule - May 2024Commercial Bank Economic Capsule - May 2024
Commercial Bank Economic Capsule - May 2024
Commercial Bank of Ceylon PLC
 
Isios-2024-Professional-Independent-Trustee-Survey.pdf
Isios-2024-Professional-Independent-Trustee-Survey.pdfIsios-2024-Professional-Independent-Trustee-Survey.pdf
Isios-2024-Professional-Independent-Trustee-Survey.pdf
Henry Tapper
 
Intro_Economics_ GPresentation Week 4.pptx
Intro_Economics_ GPresentation Week 4.pptxIntro_Economics_ GPresentation Week 4.pptx
Intro_Economics_ GPresentation Week 4.pptx
shetivia
 
managementaccountingunitiv-230422140105-dd17d80b.ppt
managementaccountingunitiv-230422140105-dd17d80b.pptmanagementaccountingunitiv-230422140105-dd17d80b.ppt
managementaccountingunitiv-230422140105-dd17d80b.ppt
SuseelaPalanimuthu
 
how to sell pi coins in South Korea profitably.
how to sell pi coins in South Korea profitably.how to sell pi coins in South Korea profitably.
how to sell pi coins in South Korea profitably.
DOT TECH
 
Scope Of Macroeconomics introduction and basic theories
Scope Of Macroeconomics introduction and basic theoriesScope Of Macroeconomics introduction and basic theories
Scope Of Macroeconomics introduction and basic theories
nomankalyar153
 
innovative-invoice-discounting-platforms-in-india-empowering-retail-investors...
innovative-invoice-discounting-platforms-in-india-empowering-retail-investors...innovative-invoice-discounting-platforms-in-india-empowering-retail-investors...
innovative-invoice-discounting-platforms-in-india-empowering-retail-investors...
Falcon Invoice Discounting
 
how to sell pi coins on Bitmart crypto exchange
how to sell pi coins on Bitmart crypto exchangehow to sell pi coins on Bitmart crypto exchange
how to sell pi coins on Bitmart crypto exchange
DOT TECH
 
APP I Lecture Notes to students 0f 4the year
APP I  Lecture Notes  to students 0f 4the yearAPP I  Lecture Notes  to students 0f 4the year
APP I Lecture Notes to students 0f 4the year
telilaalilemlem
 

Recently uploaded (20)

Introduction to Value Added Tax System.ppt
Introduction to Value Added Tax System.pptIntroduction to Value Added Tax System.ppt
Introduction to Value Added Tax System.ppt
 
Empowering the Unbanked: The Vital Role of NBFCs in Promoting Financial Inclu...
Empowering the Unbanked: The Vital Role of NBFCs in Promoting Financial Inclu...Empowering the Unbanked: The Vital Role of NBFCs in Promoting Financial Inclu...
Empowering the Unbanked: The Vital Role of NBFCs in Promoting Financial Inclu...
 
Introduction to Indian Financial System ()
Introduction to Indian Financial System ()Introduction to Indian Financial System ()
Introduction to Indian Financial System ()
 
Poonawalla Fincorp and IndusInd Bank Introduce New Co-Branded Credit Card
Poonawalla Fincorp and IndusInd Bank Introduce New Co-Branded Credit CardPoonawalla Fincorp and IndusInd Bank Introduce New Co-Branded Credit Card
Poonawalla Fincorp and IndusInd Bank Introduce New Co-Branded Credit Card
 
what is a pi whale and how to access one.
what is a pi whale and how to access one.what is a pi whale and how to access one.
what is a pi whale and how to access one.
 
How to get verified on Coinbase Account?_.docx
How to get verified on Coinbase Account?_.docxHow to get verified on Coinbase Account?_.docx
How to get verified on Coinbase Account?_.docx
 
Webinar Exploring DORA for Fintechs - Simont Braun
Webinar Exploring DORA for Fintechs - Simont BraunWebinar Exploring DORA for Fintechs - Simont Braun
Webinar Exploring DORA for Fintechs - Simont Braun
 
how to sell pi coins in all Africa Countries.
how to sell pi coins in all Africa Countries.how to sell pi coins in all Africa Countries.
how to sell pi coins in all Africa Countries.
 
how to sell pi coins at high rate quickly.
how to sell pi coins at high rate quickly.how to sell pi coins at high rate quickly.
how to sell pi coins at high rate quickly.
 
The new type of smart, sustainable entrepreneurship and the next day | Europe...
The new type of smart, sustainable entrepreneurship and the next day | Europe...The new type of smart, sustainable entrepreneurship and the next day | Europe...
The new type of smart, sustainable entrepreneurship and the next day | Europe...
 
一比一原版BCU毕业证伯明翰城市大学毕业证成绩单如何办理
一比一原版BCU毕业证伯明翰城市大学毕业证成绩单如何办理一比一原版BCU毕业证伯明翰城市大学毕业证成绩单如何办理
一比一原版BCU毕业证伯明翰城市大学毕业证成绩单如何办理
 
Commercial Bank Economic Capsule - May 2024
Commercial Bank Economic Capsule - May 2024Commercial Bank Economic Capsule - May 2024
Commercial Bank Economic Capsule - May 2024
 
Isios-2024-Professional-Independent-Trustee-Survey.pdf
Isios-2024-Professional-Independent-Trustee-Survey.pdfIsios-2024-Professional-Independent-Trustee-Survey.pdf
Isios-2024-Professional-Independent-Trustee-Survey.pdf
 
Intro_Economics_ GPresentation Week 4.pptx
Intro_Economics_ GPresentation Week 4.pptxIntro_Economics_ GPresentation Week 4.pptx
Intro_Economics_ GPresentation Week 4.pptx
 
managementaccountingunitiv-230422140105-dd17d80b.ppt
managementaccountingunitiv-230422140105-dd17d80b.pptmanagementaccountingunitiv-230422140105-dd17d80b.ppt
managementaccountingunitiv-230422140105-dd17d80b.ppt
 
how to sell pi coins in South Korea profitably.
how to sell pi coins in South Korea profitably.how to sell pi coins in South Korea profitably.
how to sell pi coins in South Korea profitably.
 
Scope Of Macroeconomics introduction and basic theories
Scope Of Macroeconomics introduction and basic theoriesScope Of Macroeconomics introduction and basic theories
Scope Of Macroeconomics introduction and basic theories
 
innovative-invoice-discounting-platforms-in-india-empowering-retail-investors...
innovative-invoice-discounting-platforms-in-india-empowering-retail-investors...innovative-invoice-discounting-platforms-in-india-empowering-retail-investors...
innovative-invoice-discounting-platforms-in-india-empowering-retail-investors...
 
how to sell pi coins on Bitmart crypto exchange
how to sell pi coins on Bitmart crypto exchangehow to sell pi coins on Bitmart crypto exchange
how to sell pi coins on Bitmart crypto exchange
 
APP I Lecture Notes to students 0f 4the year
APP I  Lecture Notes  to students 0f 4the yearAPP I  Lecture Notes  to students 0f 4the year
APP I Lecture Notes to students 0f 4the year
 

Economics 2.pdf

  • 1. MAIN TITLE • YOUR BUSINESS PURPOSE YOUR BUSINESS NAME Theory of Demand and Supply CHAPTER Two
  • 2. 2.1 Theory of demand 1. Are demand and want similar? Why? 2. Why can’t we purchase all that we need or we desire to have? 3. Can we say that, with a decrease in the price of a commodity, a consumer normally buys more of it? Why? 4. Explain why demand curves always slope downwards from left to right. Are there any exceptions to this?
  • 3. • Demand is one of the forces determining prices. • The theory of demand is related to the economic activities of consumers-consumption. • The purpose of the theory of demand is to determine the various factors that affect demand. • Demand implies more than a mere desire to purchase a commodity. • Demand states that the consumer must be willing and able to purchase the commodity, which he/she desires. • These two essential factors are.  If a consumer is willing to buy but is not able to pay, his/her desire will not become demand.  Similarly, if the consumer has the ability to pay but is not willing to pay, his/her desire will not be called demand.
  • 4. • Demand refers to various quantities of a commodity or service that a consumer would purchase at a given time in a market at various prices, given other things unchanged (ceteris paribus). • The quantity demanded of a particular commodity depends on the price of that commodity. • Law of demand: This is the principle of demand, which states that , price of a commodity and its quantity demanded are inversely related i.e., as price of a commodity increases (decreases) quantity demanded for that commodity decreases (increases), ceteris paribus.
  • 5. 2.1.1 Demand Schedule (table), Demand curve and Demand Function • The relationship that exists between price and the quantity demand can be represented by a table (schedule) or a curve or an equation. • Demand schedule: A demand schedule states the relationship between price and quantity demanded in a table form. Table 2.1 Individual household demand for orange per week Combinations A B C D E Price per kg 5 4 3 2 1 Quantity demand/week 5 7 9 11 13
  • 6. • Demand curve is a graphical representation of the relationship between different quantities of demanded by an individual at different prices per time period.
  • 7. • Demand function is a mathematical relationship between price and quantity demanded, all other things remaining the same. A typical demand function is given by: Qd=f(P) • where Qd is quantity demanded and P is price of the commodity, in our case price of orange. • Example: Let the demand function be Q = a+ Bp
  • 8. Market Demand • Market Demand: The market demand schedule, curve or function is derived by horizontally adding the quantity demanded for the product by all buyers at each price.
  • 9. • The following graph depicts market demand curve at price equal to 3
  • 10. • Numerical Example: Suppose the individual demand function of a product is given by: P=10 - Q /2 and there are about 100 identical buyers in the market. Then the market demand function is given by: • P= 10 - Q /2 • Q /2 =10-P • Q= 20 - 2P • Qm = (20 – 2P) 100 • = 2000-200P
  • 11. 2.1.2 Determinants of Demand • The demand for a product is influenced by many factors. I. Price of the product II. Taste or preference of consumers III.Income of the consumers IV. Price of related goods V. Consumers expectation of income and price VI. Number of buyers in the market • Note. When we state the law of demand, we kept all the factors to remain constant except the price of the good. • Those factors listed above except price are called demand shifters. A change in own price is only a movement along the same demand curve
  • 12. Changes in demand • Changes in demand: a change in any determinant of demand—except price causes the demand curve to shift. • If buyers choose to purchase more at any price, the demand curve shifts rightward—an increase in demand. • If buyers choose to purchase less at any price, the demand curve shifts leftward—a decrease in demand.
  • 13.
  • 14. I. Taste or preference • When the taste of a consumer changes in favor of a good, her/his demand will increase and the opposite is true. II. Income of the consumer • Goods are classified into two categories depending on how a change in income affects their demand. • These are normal goods and inferior goods. • Normal Goods are goods whose demand increases as income increase, while inferior goods are those whose demand is inversely related with income. • In general, inferior goods are poor quality goods with relatively lower price and buyers of such goods are expected to shift to better quality goods as their income increases.
  • 15. III. Price of related goods  Two goods are said to be related if a change in the price of one good affects the demand for another good.  There are two types of related goods. These are substitute and complimentary goods.  Substitute goods are goods which satisfy the same desire of the consumer. For example, tea and coffee or Pepsi and Coca-Cola are substitute goods.  If two goods are substitutes, then price of one and the demand for the other are directly related.  Complimentary goods, on the other hand, are those goods which are jointly consumed. For example, car and fuel or tea and sugar are considered as compliments.  If two goods are complements, then price of one and the demand for the other are inversely related.
  • 16. IV. Consumer expectation of income and price  Higher price expectation will increase demand while a lower future price expectation will decrease the demand for the good. V. Number of buyer in the market  An increase in the number of buyers will increase demand while a decrease in the number of buyers will decrease demand.
  • 17. 2.1.3 Elasticity of Demand • Elasticity is a measure of responsiveness of a dependent variable to changes in an independent variable. • Accordingly, we have the concepts of elasticity of demand and elasticity of supply.  Elasticity of demand refers to the degree of responsiveness of quantity demanded of a good to a change in its price, or change in income, or change in prices of related goods.  Commonly, there are three kinds of demand elasticity:  Price elasticity  Income elasticity  Cross elasticity
  • 18. I. Price Elasticity of Demand • Price elasticity of demand means degree of responsiveness of demand to change in price. • It indicates how consumers react to changes in price. • The greater the reaction the greater will be the elasticity, and the lesser the reaction, the smaller will be the elasticity. • Computed as the percentage change in quantity demanded divided by the percentage change in price. • Demand for commodities like clothes, fruit etc. changes when there is even a small change in their price. • Demand for commodities which are basic necessities of life, like salt, food grains etc., may not change even if price changes
  • 19. • Price elasticity demand can be measured in two ways. These are point and arc elasticity. A. Point Price Elasticity of Demand • This is calculated to find elasticity at a given point. The price elasticity of demand can be determined by the following formula.
  • 20.
  • 21. B. Arc price elasticity of demand  In arc price elasticity of demand, the midpoints of the old and the new values of both price and quantity demanded are used.  It measures a portion or a segment of the demand curve between the two points.  An arc is a portion of a curve line, hence, a portion or segment of a demand curve.
  • 22. • A numerical example to illustrate arc elasticity. Suppose that the price of a commodity is Br. 5 and the quantity demanded at that price is 100 units of a commodity. Now assume that the price of the commodity falls to Br. 4 and the quantity demanded rises to 110 units. In terms of the above formula, the value of the arc elasticity will be
  • 23. • Elasticity of demand is unit free because it is a ratio of percentage change. • Elasticity of demand is usually a negative number because of the law of demand.
  • 24. Determinants of price Elasticity of Demand I. The availability of substitutes: the more substitutes available for a product, the more elastic will be the price elasticity of demand. II. Time: In the long- run, price elasticity of demand tends to be elastic. Because:  More substitute goods could be produced.  People tend to adjust their consumption pattern. III. The proportion of income consumers spend for a product:-the smaller the proportion of income spent for a good, the less price elastic will be. IV. The importance of the commodity in the consumers’ budget :  Luxury goods tend to be more elastic, example: gold.  Necessity goods tend to be less elastic example: Salt.
  • 25. ii. Income Elasticity of Demand • It is a measure of responsiveness of demand to change in income
  • 26. iii. Cross price Elasticity of Demand • Measures how much the demand for a product is affected by a change in price of another good.
  • 27. • Example: Consider the following data which shows the changes in quantity demanded of good X in response to changes in the price of good Y. • Calculate the cross –price elasticity of demand between the two goods. What can you say about the two goods?
  • 28. 2.2 Theory of Supply • Supply indicates various quantities of a product that sellers (producers) are willing and able to provide at different prices in a given period of time, other things remaining unchanged. • The law of supply: states that, as price of a product increase, quantity supplied of the product increases, and as price decreases, quantity supplied decreases, ceteris paribus. • It tells us there is a positive relationship between price and quantity supplied.
  • 29. 2.2.1 Supply schedule, supply curve and supply function • A supply schedule is a tabular statement that states the different quantities of a commodity offered for sale at different prices.
  • 30. • A supply curve conveys the same information as a supply schedule. But it shows the information graphically rather than in a tabular form. • Supply function is mathematical representation • S = f(P), where S is quantity supplied and P is price of the commodity
  • 31. • Market supply: It is derived by horizontally adding the quantity supplied of the product by all sellers at each price.
  • 32. 2.2.2 Determinants of Supply • the supply of a particular product is determined by: I ) price of inputs ( cost of inputs) II) technology III) prices of related goods IV) sellers‘ expectation of price of the product V) taxes & subsidies VI) number of sellers in the market VII) weather, etc.
  • 33. I ) Effect of change in input price on supply of a product • An increase in the price of inputs such as labour, raw materials, capital, etc causes a decrease in the supply of the product which is represented by a leftward shift of the supply curve. II ) Effect of change in Technology • Technological advancement enables a firm to produce and supply more in the market. This shifts the supply curve outward. III) Effect of change in weather condition • A change in weather condition will have an impact on the supply of a number of products, especially agricultural products
  • 34. 2.2.3 Elasticity of supply • It is the degree of responsiveness of the supply to change in price. • It is the percentage change in quantity supplied divided by the percentage change in price. • The point price elasticity of supply can be calculated as the ratio of proportionate change in quantity supplied of a commodity to a given proportionate change in its price.
  • 35. • Like elasticity of demand, price elasticity of supply can be elastic, inelastic, unitary elastic, perfectly elastic or perfectly inelastic.  The supply is elastic when a small change on price leads to great change in supply.  It is inelastic or less elastic when a great change in price induces only a slight change in supply.  If the supply is perfectly inelastic, it will be represented by a vertical line shown as below.  If supply is perfectly elastic it will be represented by a horizontal straight line as in second diagram.
  • 36.
  • 37. 2.3 Market Equilibrium • Market equilibrium occurs when market demand equals market supply.
  • 38. Numerical example: • Given market demand: Qd= 100-2P, and market supply: P =( Qs /2) + 10 • a) Calculate the market equilibrium price and quantity • b) Determine, whether there is surplus or shortage at P= 25 and P= 35.
  • 39.
  • 40. Effects of shift in demand and supply on equilibrium • Given demand and supply the equilibrium price and quantity are stable. • Changes in demand and supply bring about changes in the equilibrium price level and the equilibrium quantity.
  • 41. I ) when demand changes and supply remains constant • Factors such as changes in income, tastes, and prices of related goods will lead to a change in demand. The figure below shows the effects of a change in demand and the resultant equilibrium price and quantity.
  • 42. ii. When supply changes and demand remains constant • Changes in supply are brought by changes in technical knowledge and factor prices. The following graph explains the effects of changes in supply.
  • 43. III) Effects of combined changes in demand and supply  When both demand and supply increase, the quantity of the product will increase definitely. But it is not certain whether the price will rise or fall. I. If an increase in demand is more than an increase in supply, then the price goes up. II. If an increase in supply is more than an increase in demand, the price falls. III.If the increase in demand and supply is same, then the price remains the same.
  • 44.  When demand and supply decline, the quantity decreases. But the change in price will depend upon the relative fall in demand and supply. I. When the fall in demand is more than the fall in supply, the price will decrease. II. when the fall in supply is more than the fall in demand, the price will rise. III. If both demand and supply decline in the same ratio, there is no change in the equilibrium price, but the quantity decreases.