This document discusses different types of demand, including:
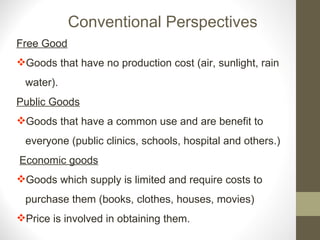
1. Conventional perspectives on free goods, public goods, and economic goods. Islamic perspectives on al-tayyibat and al-rizq.
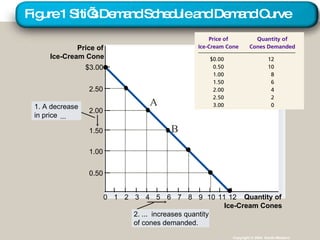
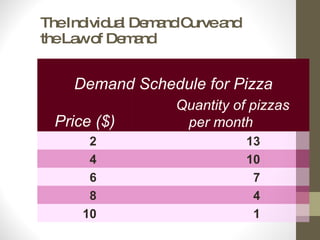
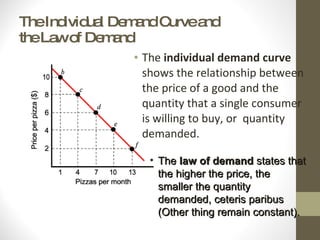
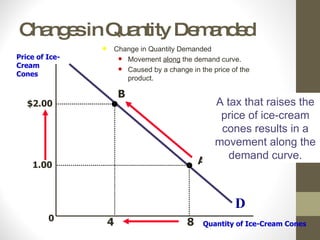
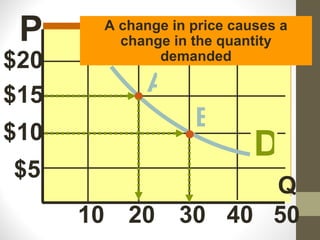
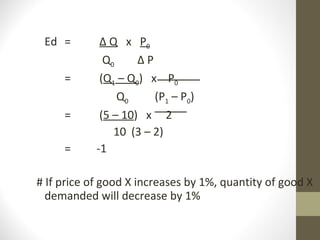
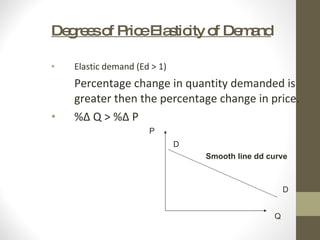
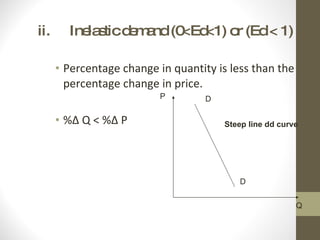
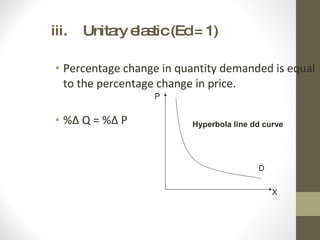
2. The relationship between price and quantity demanded as shown through demand schedules and curves. Individual demand curves summing to market demand.
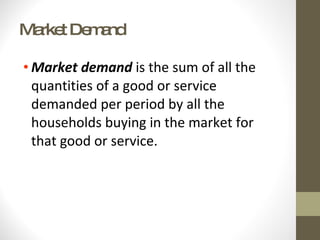
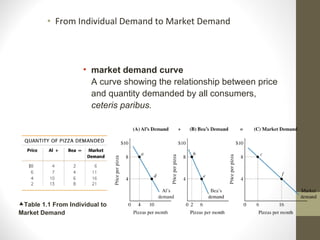
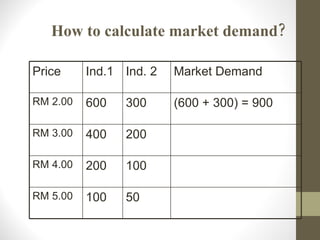
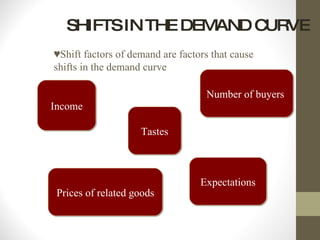
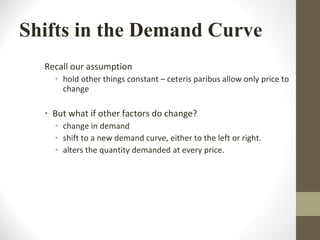
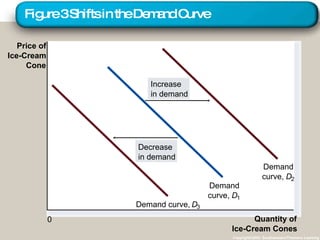
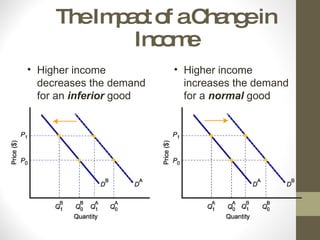
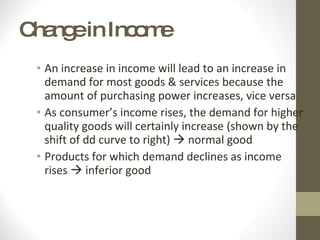
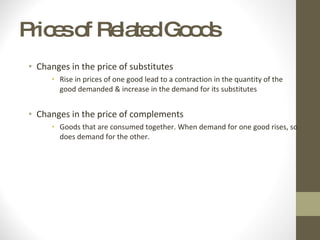
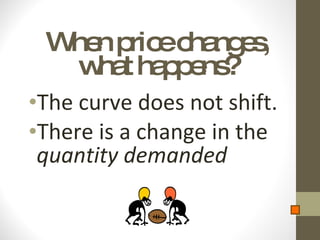
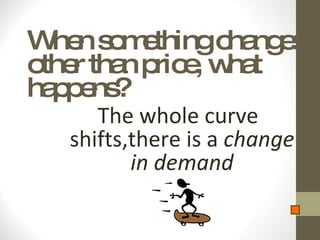
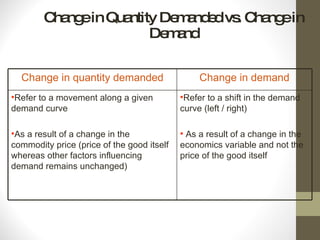
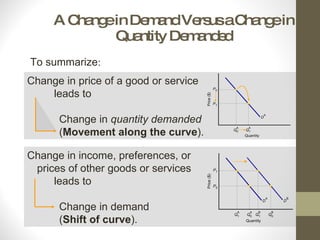
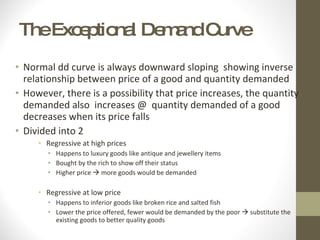
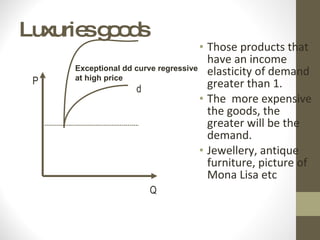
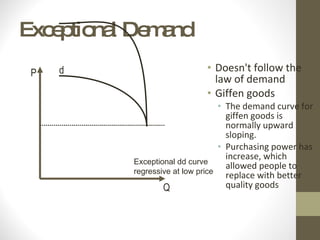
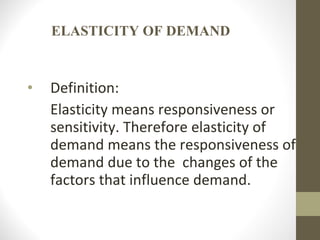
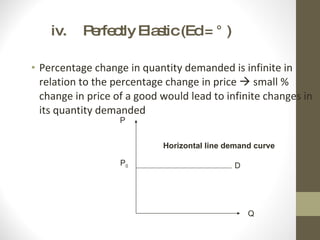
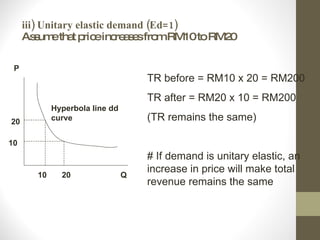
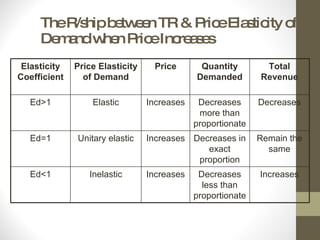
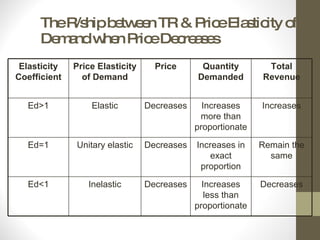
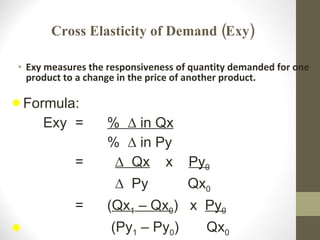
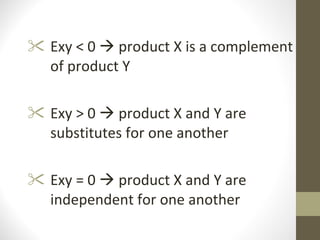
3. Factors that can cause shifts in the demand curve, such as changes in income, tastes, prices of related goods, expectations, and market size. The differences between changes in quantity demanded versus changes in demand.


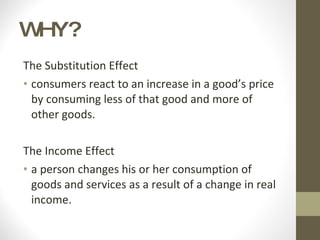

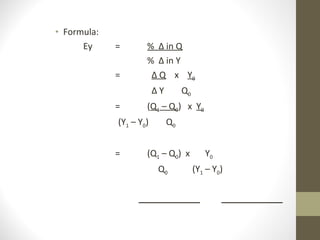
![D 1 D 2 P QD 1 QD 2 Change in Income [Normal-Direct; Inferior-Inverse] More income results in more demand for new cars; less demand for used cars. New Cars Used Cars Less income results in more demand for used cars; less demand for new cars.](https://image.slidesharecdn.com/chapter-2-demand-1286249445-phpapp01/85/Chapter-2-Demand-21-320.jpg)
![Complement [ Inverse ] Substitute [ Direct ] Milk Cereal Pop Tarts D 1 D 2 P P 1 QD 1 P 2 D 1 D 2 D P Prices of Related Goods [Substitutes-Direct; Complements-Inverse] QD 2](https://image.slidesharecdn.com/chapter-2-demand-1286249445-phpapp01/85/Chapter-2-Demand-24-320.jpg)
![D 1 D 2 P QD 1 QD 2 "Change in Taste" [Direct] An increase in taste for DVDs results in an increase in demand . A decrease in taste for videos results in a decrease in demand . D 3 QD 3](https://image.slidesharecdn.com/chapter-2-demand-1286249445-phpapp01/85/Chapter-2-Demand-26-320.jpg)
![D 1 D 2 P QD 1 QD 2 Expectations [of consumers] [about future price, availibility, & income] iPhone $399 Buy it now to save money.](https://image.slidesharecdn.com/chapter-2-demand-1286249445-phpapp01/85/Chapter-2-Demand-27-320.jpg)
![D 1 D 2 P QD 1 QD 2 Expectations [of consumers] [about future availibility of toilet tissue] If there is expected to be a major shortage of toilet tissue , then consumers will stock up now or risk not getting any.](https://image.slidesharecdn.com/chapter-2-demand-1286249445-phpapp01/85/Chapter-2-Demand-28-320.jpg)
![D 1 D 2 P QD 1 QD 2 Expectations [of consumers] [about future income] Let’s say that we are coming out of recession & consumers feel secure about their jobs. [ Positive future income ]](https://image.slidesharecdn.com/chapter-2-demand-1286249445-phpapp01/85/Chapter-2-Demand-29-320.jpg)
![D 1 D 2 P QD 1 QD 2 Expectations [of consumers] [about future income] Let’s say that we are going into a recession and consumers don’t feel secure about their jobs. [ Negative future income ]](https://image.slidesharecdn.com/chapter-2-demand-1286249445-phpapp01/85/Chapter-2-Demand-30-320.jpg)
![D 1 D 2 P QD 1 QD 2 Change in Market Size [Direct] [Number of Consumers] More demand for both normal & inferior goods New Cars Used Cars](https://image.slidesharecdn.com/chapter-2-demand-1286249445-phpapp01/85/Chapter-2-Demand-31-320.jpg)


![Lesson 6--demand[1]](https://cdn.slidesharecdn.com/ss_thumbnails/lesson-6-demand1-130409195933-phpapp01-thumbnail.jpg?width=640&height=640&fit=bounds)