Found this paper really interesting. It delves into the learning behaviors of Deep Learning Ensembles and compares them Bayesian Neural Networks, which theoretically does the same thing. This answers why Deep Ensembles Outperform
Soft Computing Techniques Based Image Classification using Support Vector Mac...ijtsrd
n this paper we compare different kernel had been developed for support vector machine based time series classification. Despite the better presentation of Support Vector Machine SVM on many concrete classification problems, the algorithm is not directly applicable to multi dimensional routes having different measurements. Training support vector machines SVM with indefinite kernels has just fascinated consideration in the machine learning public. This is moderately due to the fact that many similarity functions that arise in practice are not symmetric positive semidefinite. In this paper, by spreading the Gaussian RBF kernel by Gaussian elastic metric kernel. Gaussian elastic metric kernel is extended version of Gaussian RBF. The extended version divided in two ways time wrap distance and its real penalty. Experimental results on 17 datasets, time series data sets show that, in terms of classification accuracy, SVM with Gaussian elastic metric kernel is much superior to other kernels, and the ultramodern similarity measure methods. In this paper we used the indefinite resemblance function or distance directly without any conversion, and, hence, it always treats both training and test examples consistently. Finally, it achieves the highest accuracy of Gaussian elastic metric kernel among all methods that train SVM with kernels i.e. positive semi definite PSD and Non PSD, with a statistically significant evidence while also retaining sparsity of the support vector set. Tarun Jaiswal | Dr. S. Jaiswal | Dr. Ragini Shukla ""Soft Computing Techniques Based Image Classification using Support Vector Machine Performance"" Published in International Journal of Trend in Scientific Research and Development (ijtsrd), ISSN: 2456-6470, Volume-3 | Issue-3 , April 2019, URL: https://www.ijtsrd.com/papers/ijtsrd23437.pdf
Paper URL: https://www.ijtsrd.com/computer-science/artificial-intelligence/23437/soft-computing-techniques-based-image-classification-using-support-vector-machine-performance/tarun-jaiswal
A PSO-Based Subtractive Data Clustering AlgorithmIJORCS
There is a tremendous proliferation in the amount of information available on the largest shared information source, the World Wide Web. Fast and high-quality clustering algorithms play an important role in helping users to effectively navigate, summarize, and organize the information. Recent studies have shown that partitional clustering algorithms such as the k-means algorithm are the most popular algorithms for clustering large datasets. The major problem with partitional clustering algorithms is that they are sensitive to the selection of the initial partitions and are prone to premature converge to local optima. Subtractive clustering is a fast, one-pass algorithm for estimating the number of clusters and cluster centers for any given set of data. The cluster estimates can be used to initialize iterative optimization-based clustering methods and model identification methods. In this paper, we present a hybrid Particle Swarm Optimization, Subtractive + (PSO) clustering algorithm that performs fast clustering. For comparison purpose, we applied the Subtractive + (PSO) clustering algorithm, PSO, and the Subtractive clustering algorithms on three different datasets. The results illustrate that the Subtractive + (PSO) clustering algorithm can generate the most compact clustering results as compared to other algorithms.
Instance-based learning algorithms like k-nearest neighbors (KNN) and locally weighted regression are conceptually straightforward approaches to function approximation problems. These algorithms store all training data and classify new query instances based on similarity to near neighbors in the training set. There are three main approaches: lazy learning with KNN, radial basis functions using weighted methods, and case-based reasoning. Locally weighted regression generalizes KNN by constructing an explicit local approximation to the target function for each query. Radial basis functions are another related approach using Gaussian kernel functions centered on training points.
Cluster analysis is an unsupervised machine learning technique that groups similar data objects into clusters. It finds internal structures within unlabeled data by partitioning it into groups based on similarity. Some key applications of cluster analysis include market segmentation, document classification, and identifying subtypes of diseases. The quality of clusters depends on both the similarity measure used and how well objects are grouped within each cluster versus across clusters.
A COMPARATIVE STUDY ON DISTANCE MEASURING APPROACHES FOR CLUSTERINGIJORCS
Clustering plays a vital role in the various areas of research like Data Mining, Image Retrieval, Bio-computing and many a lot. Distance measure plays an important role in clustering data points. Choosing the right distance measure for a given dataset is a biggest challenge. In this paper, we study various distance measures and their effect on different clustering. This paper surveys existing distance measures for clustering and present a comparison between them based on application domain, efficiency, benefits and drawbacks. This comparison helps the researchers to take quick decision about which distance measure to use for clustering. We conclude this work by identifying trends and challenges of research and development towards clustering.
FUZZY ROUGH INFORMATION MEASURES AND THEIR APPLICATIONSijcsity
The degree of roughness characterizes the uncertainty contained in a rough set. The rough entropy was
defined to measure the roughness of a rough set. Though, it was effective and useful, but not accurate
enough. Some authors use information measure in place of entropy for better understanding which
measures the amount of uncertainty contained in fuzzy rough set .In this paper three new fuzzy rough
information measures are proposed and their validity is verified. The application of these proposed
information measures in decision making problems is studied and also compared with other existing
information measures.
Critical Paths Identification on Fuzzy Network Projectiosrjce
In this paper, a new approach for identifying fuzzy critical path is presented, based on converting the
fuzzy network project into deterministic network project, by transforming the parameters set of the fuzzy
activities into the time probability density function PDF of each fuzzy time activity. A case study is considered as
a numerical tested problem to demonstrate our approach.
Convolutional networks and graph networks through kernelstuxette
This presentation discusses how convolutional kernel networks (CKNs) can be used to model sequential and graph-structured data through kernels defined over sequences and graphs. CKNs define feature maps from substructures like n-mers in sequences and paths in graphs into high-dimensional spaces, which are then approximated to obtain low-dimensional representations that can be used for prediction tasks like classification. This approach is analogous to convolutional neural networks and can be extended to multiple layers. The presentation provides examples showing CKNs achieve good performance on problems involving protein sequences and social networks.
Sequential Reptile_Inter-Task Gradient Alignment for Multilingual LearningMLAI2
Multilingual models jointly pretrained on multiple languages have achieved remarkable performance on various multilingual downstream tasks. Moreover, models finetuned on a single monolingual downstream task have shown to generalize to unseen languages. In this paper, we first show that it is crucial for those tasks to align gradients between them in order to maximize knowledge transfer while minimizing negative transfer. Despite its importance, the existing methods for gradient alignment either have a completely different purpose, ignore inter-task alignment, or aim to solve continual learning problems in rather inefficient ways. As a result of the misaligned gradients between tasks, the model suffers from severe negative transfer in the form of catastrophic forgetting of the knowledge acquired from the pretraining. To overcome the limitations, we propose a simple yet effective method that can efficiently align gradients between tasks. Specifically, we perform each inner-optimization by sequentially sampling batches from all the tasks, followed by a Reptile outer update. Thanks to the gradients aligned between tasks by our method, the model becomes less vulnerable to negative transfer and catastrophic forgetting. We extensively validate our method on various multi-task learning and zero-shot cross-lingual transfer tasks, where our method largely outperforms all the relevant baselines we consider.
Dear Students
Ingenious techno Solution offers an expertise guidance on you Final Year IEEE & Non- IEEE Projects on the following domain
JAVA
.NET
EMBEDDED SYSTEMS
ROBOTICS
MECHANICAL
MATLAB etc
For further details contact us:
enquiry@ingenioustech.in
044-42046028 or 8428302179.
Ingenious Techno Solution
#241/85, 4th floor
Rangarajapuram main road,
Kodambakkam (Power House)
http://www.ingenioustech.in/
This document provides an overview of machine learning and various machine learning techniques. It discusses what machine learning is, different types of learning tasks like classification and regression, how performance is measured, and different types of training experiences like direct supervision and reinforcement learning. It then covers specific machine learning algorithms like classification using Rocchio's algorithm, nearest neighbor learning, Bayesian learning approaches, and text categorization using naive Bayes.
Co-clustering of multi-view datasets: a parallelizable approachAllen Wu
This document summarizes a research paper on co-clustering multi-view datasets using a parallelizable approach called MVSIM. MVSIM computes co-similarity matrices for related objects across multiple views or relation matrices. It creates a learning network matching the relational structure and aggregates the similarity matrices using a damping factor. Experiments show MVSIM outperforms single-view and other multi-view clustering methods on document and newsgroup datasets, and its performance decreases slightly but computation time reduces significantly when the data is split across more views.
K-MEDOIDS CLUSTERING USING PARTITIONING AROUND MEDOIDS FOR PERFORMING FACE R...ijscmc
Face recognition is one of the most unobtrusive biometric techniques that can be used for access control as well as surveillance purposes. Various methods for implementing face recognition have been proposed with varying degrees of performance in different scenarios. The most common issue with effective facial biometric systems is high susceptibility of variations in the face owing to different factors like changes in pose, varying illumination, different expression, presence of outliers, noise etc. This paper explores a novel technique for face recognition by performing classification of the face images using unsupervised learning approach through K-Medoids clustering. Partitioning Around Medoids algorithm (PAM) has been used for performing K-Medoids clustering of the data. The results are suggestive of increased robustness to noise and outliers in comparison to other clustering methods. Therefore the technique can also be used to increase the overall robustness of a face recognition system and thereby increase its invariance and make it a reliably usable biometric modality
Image Super-Resolution Reconstruction Based On Multi-Dictionary LearningIJRESJOURNAL
ABSTRACT: In order to overcome the problems that the single dictionary cannot be adapted to variety types of images and the reconstruction quality couldn’t meet the application, we propose a novel Multi-Dictionary Learning algorithm for feature classification. The algorithm uses the orientation information of the low resolution image to guide the image patches in the database to classify, and designs the classification dictionary which can effectively express the reconstructed image patches. Considering the nonlocal similarity of the image, we construct the combined nonlocal mean value(C-NLM) regularizer, and take the steering kernel regression(SKR) to formulate a local regularization ,and establish a unified reconstruction framework. Extensive experiments on single image validate that the proposed method, compared with several other state-of-the-art learning based algorithms, achieves improvement in image quality and provides more details.
This document discusses using convolutional neural networks and self-organized maps to visualize knowledge graphs. It presents a compositional model for embedding nodes and relationships in a knowledge graph into a vector space. A self-organized map is used to cluster the embeddings and extract semantic fingerprints. The fingerprints are useful for knowledge discovery and classification tasks. The technique is applied to a subset of the CTD knowledge graph containing compound-gene/protein interactions, and the results are comparable to structural models.
K-Means clustering uses an iterative procedure which is very much sensitive and dependent upon the initial centroids. The initial centroids in the k-means clustering are chosen randomly, and hence the clustering also changes with respect to the initial centroids. This paper tries to overcome this problem of random selection of centroids and hence change of clusters with a premeditated selection of initial centroids. We have used the iris, abalone and wine data sets to demonstrate that the proposed method of finding the initial centroids and using the centroids in k-means algorithm improves the clustering performance. The clustering also remains the same in every run as the initial centroids are not randomly selected but through premeditated method.
This document summarizes an academic paper that proposes an innovative modified K-Mode clustering algorithm for categorical data. The paper begins by introducing clustering algorithms and discusses existing algorithms like K-Means, K-Medoids, and K-Mode that are used for numerical and categorical data. It then describes the limitations of traditional K-Mode clustering and proposes a modified K-Mode algorithm that aims to provide better initial cluster means/modes to result in clusters with better accuracy. The paper experimentally evaluates the traditional and modified K-Mode algorithms on large datasets to compare their performance for varying data values.
Hybridization of Bat and Genetic Algorithm to Solve N-Queens ProblemjournalBEEI
In this paper, a hybrid of Bat-Inspired Algorithm (BA) and Genetic Algorithm (GA) is proposed to solve N-queens problem. The proposed algorithm executes the behavior of microbats with changing pulse rates of emissions and loudness to final all the possible solutions in the initialization and moving phases. This dataset applied two metaheuristic algorithms (BA and GA) and the hybrid to solve N-queens problem by finding all the possible solutions in the instance with the input sizes of area 8*8, 20*20, 50*50, 100*100 and 500*500 on a chessboard. To find the optimal solution, consistently, ten run have been set with 100 iterations for all the input sizes. The hybrid algorithm obtained substantially better results than BA and GA because both algorithms were inferior in discovering the optimal solutions than the proposed randomization method. It also has been discovered that BA outperformed GA because it requires a reduced amount of steps in determining the solutions.
Classification of Iris Data using Kernel Radial Basis Probabilistic Neural Ne...Scientific Review
Radial Basis Probabilistic Neural Network (RBPNN) has a broader generalized capability that been successfully applied to multiple fields. In this paper, the Euclidean distance of each data point in RBPNN is extended by calculating its kernel-induced distance instead of the conventional sum-of squares distance. The kernel function is a generalization of the distance metric that measures the distance between two data points as the data points are mapped into a high dimensional space. During the comparing of the four constructed classification models with Kernel RBPNN, Radial Basis Function networks, RBPNN and Back-Propagation networks as proposed, results showed that, model classification on Iris Data with Kernel RBPNN display an outstanding performance in this regard.
A survey on Efficient Enhanced K-Means Clustering Algorithmijsrd.com
Data mining is the process of using technology to identify patterns and prospects from large amount of information. In Data Mining, Clustering is an important research topic and wide range of unverified classification application. Clustering is technique which divides a data into meaningful groups. K-means clustering is a method of cluster analysis which aims to partition n observations into k clusters in which each observation belongs to the cluster with the nearest mean. In this paper, we present the comparison of different K-means clustering algorithms.
The document presents a method for solving fuzzy assignment problems using triangular and trapezoidal fuzzy numbers. It formulates the fuzzy assignment problem into a crisp linear programming problem that can be solved using the Hungarian method. The paper also uses Robust's ranking method to transform fuzzy costs into crisp values, allowing conventional solution methods to be applied. It aims to provide a more realistic approach to assignment problems by considering costs as fuzzy numbers rather than deterministic values.
[NeurIPS2020 (spotlight)] Generalization bound of globally optimal non convex...Taiji Suzuki
Presentation slide of our NeurIPS2020 paper "Generalization bound of globally optimal non convex neural network training: Transportation map estimation by infinite dimensional Langevin dynamics"
Abstract:
We introduce a new theoretical framework to analyze deep learning optimization with connection to its generalization error. Existing frameworks such as mean field theory and neural tangent kernel theory for neural network optimization analysis typically require taking limit of infinite width of the network to show its global convergence. This potentially makes it difficult to directly deal with finite width network; especially in the neural tangent kernel regime, we cannot reveal favorable properties of neural networks {\it beyond kernel methods}. To realize more natural analysis, we consider a completely different approach in which we formulate the parameter training as a transportation map estimation and show its global convergence via the theory of the {\it infinite dimensional Langevin dynamics}. This enables us to analyze narrow and wide networks in a unifying manner. Moreover, we give generalization gap and excess risk bounds for the solution obtained by the dynamics. The excess risk bound achieves the so-called fast learning rate. In particular, we show an exponential convergence for a classification problem and a minimax optimal rate for a regression problem.
Chapter 11 cluster advanced : web and text miningHouw Liong The
This document provides an overview of advanced clustering analysis techniques discussed in Chapter 11 of the textbook "Data Mining: Concepts and Techniques". It begins with an introduction to probability model-based clustering and fuzzy clustering. It then discusses using the EM algorithm for fuzzy clustering and fitting univariate Gaussian mixture models. Next, it covers challenges with clustering high-dimensional data and methods for subspace clustering. It also briefly introduces clustering graphs and network data as well as clustering with constraints. The document concludes with an outline of the chapter.
This document introduces an R package called PSF that implements a Pattern Sequence based Forecasting (PSF) algorithm for univariate time series forecasting. The PSF algorithm clusters time series data and then predicts future values based on identifying repeating patterns of clusters. The PSF package contains functions that perform the main steps of the PSF algorithm, including selecting the optimal number of clusters, selecting the optimal window size, and making predictions for a given window size and number of clusters. The package aims to promote and simplify the use of the PSF algorithm for time series forecasting.
論文紹介:Learning With Neighbor Consistency for Noisy LabelsToru Tamaki
Ahmet Iscen, Jack Valmadre, Anurag Arnab, Cordelia Schmid, "Learning With Neighbor Consistency for Noisy Labels" CVPR2022
https://openaccess.thecvf.com/content/CVPR2022/html/Iscen_Learning_With_Neighbor_Consistency_for_Noisy_Labels_CVPR_2022_paper.html
An Ensemble Approach To Improve Homomorphic Encrypted Data Classification Per...IJCI JOURNAL
Homomorphic encryption (HE) permits users to perform computations on encrypted data
without first decrypting it. HE can be used for privacy-preserving outsourced computation and analysis,
allowing data to be encrypted and outsourced to commercial cloud environments for processing while
encrypted or sensitive data. HE enables new services by removing privacy barriers inhibiting data sharing
or increasing the security of existing services. A convolution neural network (CNN) can be homomorphically
evaluated using addition and multiplication by replacing the activation function, such as Rectified Linear
Units (ReLU), with a low polynomial degree. To achieve the same performance as the ReLU activation
function, we study the impact of applying the ensemble techniques to solve the accuracy problem. Our
experimental results empirically show that the ensemble approach can reduce bias, and variance, increasing
accuracy to achieve the same ReLU performance with parallel and sequential techniques. We demonstrate
the effectiveness and robustness of our method using three datasets: MNIST, FMNIST, and CIFAR-10.
This document presents a method for applying random matrix theory to analyze deep neural networks using nonlinear activations. The key results are:
1) The moments method is used to derive a quartic equation that the Stieltjes transform of the Gram matrix YTY satisfies, where Y=f(WX) and W,X are random matrices and f is a nonlinear activation.
2) This allows computing properties of the Gram matrix like its limiting spectral distribution and the training loss of a random feature network.
3) Certain activations preserve the eigenvalue distribution of the data covariance matrix XTX, analogous to batch normalization. These activations may improve training and are a new class worthy of further study.
This document proposes a novel framework called smooth sparse coding for learning sparse representations of data. It incorporates feature similarity or temporal information present in data sets via non-parametric kernel smoothing. The approach constructs codes that represent neighborhoods of samples rather than individual samples, leading to lower reconstruction error. It also proposes using marginal regression rather than lasso for obtaining sparse codes, providing a dramatic speedup of up to two orders of magnitude without sacrificing accuracy. The document contributes a framework for incorporating domain information into sparse coding, sample complexity results for dictionary learning using smooth sparse coding, an efficient marginal regression training procedure, and successful application to classification tasks with improved accuracy and speed.
This document discusses using unsupervised support vector analysis to increase the efficiency of simulation-based functional verification. It describes applying an unsupervised machine learning technique called support vector analysis to filter redundant tests from a set of verification tests. By clustering similar tests into regions of a similarity metric space, it aims to select the most important tests to verify a design while removing redundant tests, improving verification efficiency. The approach trains an unsupervised support vector model on an initial set of simulated tests and uses it to filter future tests by comparing them to support vectors that define regions in the similarity space.
Learning On The Border:Active Learning in Imbalanced classification Data萍華 楊
This paper proposes using active learning to address the problem of class imbalance in machine learning classification tasks. The key ideas are:
1) Active learning selects the most informative examples to label, which tend to be instances closest to the decision boundary. This helps provide a more balanced sample to the learner.
2) An online support vector machine (SVM) algorithm is used to allow efficient integration of newly labeled examples without retraining on the entire dataset.
3) Early stopping criteria based on support vectors are introduced to determine when enough examples have been labeled.
Empirical results on imbalanced datasets demonstrate that the active learning approach leads to improved classification performance compared to traditional supervised learning methods.
This document proposes using the whale optimization algorithm (WOA) to optimize the connection weights in neural networks. WOA is a novel meta-heuristic algorithm inspired by humpback whales' bubble-net feeding behavior. It is tested on 20 datasets to train the weights in multilayer perceptron neural networks. The results show that WOA achieves better performance than backpropagation and 6 other evolutionary algorithms in terms of avoiding local optima and convergence speed on most datasets.
An Uncertainty-Aware Approach to Optimal Configuration of Stream Processing S...Pooyan Jamshidi
https://arxiv.org/abs/1606.06543
Finding optimal configurations for Stream Processing Systems (SPS) is a challenging problem due to the large number of parameters that can influence their performance and the lack of analytical models to anticipate the effect of a change. To tackle this issue, we consider tuning methods where an experimenter is given a limited budget of experiments and needs to carefully allocate this budget to find optimal configurations. We propose in this setting Bayesian Optimization for Configuration Optimization (BO4CO), an auto-tuning algorithm that leverages Gaussian Processes (GPs) to iteratively capture posterior distributions of the configuration spaces and sequentially drive the experimentation. Validation based on Apache Storm demonstrates that our approach locates optimal configurations within a limited experimental budget, with an improvement of SPS performance typically of at least an order of magnitude compared to existing configuration algorithms.
(DL hacks輪読) How to Train Deep Variational Autoencoders and Probabilistic Lad...Masahiro Suzuki
This document discusses techniques for training deep variational autoencoders and probabilistic ladder networks. It proposes three advances: 1) Using an inference model similar to ladder networks with multiple stochastic layers, 2) Adding a warm-up period to keep units active early in training, and 3) Using batch normalization. These advances allow training models with up to five stochastic layers and achieve state-of-the-art log-likelihood results on benchmark datasets. The document explains variational autoencoders, probabilistic ladder networks, and how the proposed techniques parameterize the generative and inference models.
Gradient-Based Meta-Learning with Learned Layerwise Metric and SubspaceYoonho Lee
This document presents a new method for gradient-based meta-learning called MT-nets. MT-nets introduce a learned task-specific linear transformation and subspace that allows more efficient learning and adaptation to new tasks. Experiments show MT-nets outperform previous methods on few-shot classification and can adapt the level of parameter updates based on task complexity. The authors propose MT-nets provide a more structured approach to gradient-based meta-learning.
Gradient-based Meta-learning with learned layerwise subspace and metricNAVER Engineering
발표자: 이윤호(포스텍 석사과정)
발표일: 2018.2.
일반적인 딥러닝 모델은 데이터가 많아야 학습이 가능합니다.
적은 데이터로도 학습을 하기 위해서는 학습과정에 대한 학습인 메타러닝(meta-learning)이 필요합니다.
저희가 제안하는 MT-net은 gradient descent를 할 subspace와 그 subspace 안에서의 거리함수를 학습함으로써 적은 데이터로도 효율적으로 학습할 수 있는 모델입니다.
This document discusses various clustering techniques used in data mining. It begins by defining clustering as an unsupervised learning technique that groups similar objects together. It then discusses advantages of clustering such as quality improvement and reuse opportunities. Several clustering methods are described such as K-means clustering, which aims to partition observations into k clusters where each observation belongs to the cluster with the nearest mean. The document concludes by discussing advantages of K-means clustering such as its linear time complexity and its use for spherical cluster shapes.
Understanding Protein Function on a Genome-scale through the Analysis of Molecular Networks
Cornell Medical School, Physiology, Biophysics and Systems Biology (PBSB) graduate program, 2009.01.26, 16:00-17:00; [I:CORNELL-PBSB] (Long networks talk, incl. the following topics: why networks w. amsci*, funnygene*, net. prediction intro, memint*, tse*, essen*, sandy*, metagenomics*, netpossel*, tyna*+ topnet*, & pubnet* . Fits easily into 60’ w. 10’ questions. PPT works on mac & PC and has many photos w. EXIF tag kwcornellpbsb .)
Date Given: 01/26/2009
So sánh cấu trúc protein_Protein structure comparisonbomxuan868
This document discusses various computational methods for comparing protein structures, including:
1. Structure alignment methods like DALI that align protein backbones to maximize similarity based on intramolecular distances between alpha carbons.
2. Methods like VAST that represent protein secondary structure as vectors and compare their spatial arrangements using graph theory.
3. Hashing methods like geometric hashing that assign protein structures invariant "keys" based on properties like angles between secondary structure vectors, in order to rapidly search databases for similar structures.
This document discusses the skew normal distribution and its properties. It begins by motivating the need for distributions that allow for skewness rather than assuming symmetry. It then presents the functional form of the univariate skew normal distribution, which is constructed from a normal distribution and skewing function. Several key properties are discussed, including how the skew normal distribution includes the normal and half-normal distributions as special cases and retains some convenient properties of the normal. The document aims to demonstrate the flexibility and usefulness of the skew normal distribution for modeling real data compared to only using the normal distribution.
This document describes an expandable Bayesian network (EBN) approach for 3D object description from multiple images and sensor data. The key points are:
- EBNs can dynamically instantiate network structures at runtime based on the number of input images, allowing the use of a varying number of evidence features.
- EBNs introduce the use of hidden variables to handle correlation of evidence features across images, whereas previous approaches did not properly model this.
- The document presents an application of an EBN for building detection and description from aerial images using multiple views and sensor data. Experimental results showed the EBN approach provided significant performance improvements over other methods.
The document discusses clustering documents using a multi-viewpoint similarity measure. It begins with an introduction to document clustering and common similarity measures like cosine similarity. It then proposes a new multi-viewpoint similarity measure that calculates similarity between documents based on multiple reference points, rather than just the origin. This allows a more accurate assessment of similarity. The document outlines an optimization algorithm used to cluster documents by maximizing the new similarity measure. It compares the new approach to existing document clustering methods and similarity measures.
This document proposes a new similarity measure for comparing spatial MDX queries in a spatial data warehouse to support spatial personalization approaches. The proposed similarity measure takes into account the topology, direction, and distance between the spatial objects referenced in the MDX queries. It defines the topological distance between spatial scenes referenced in queries based on a conceptual neighborhood graph. It also defines the directional distance between queries based on a graph of spatial directions and transformation costs. The similarity measure will be included in a recommendation approach the authors are developing to recommend relevant anticipated queries to users based on their previous queries.
Similar to Deep learning ensembles loss landscape (20)
Spine net learning scale permuted backbone for recognition and localizationDevansh16
Convolutional neural networks typically encode an input image into a series of intermediate features with decreasing resolutions. While this structure is suited to classification tasks, it does not perform well for tasks requiring simultaneous recognition and localization (e.g., object detection). The encoder-decoder architectures are proposed to resolve this by applying a decoder network onto a backbone model designed for classification tasks. In this paper, we argue encoder-decoder architecture is ineffective in generating strong multi-scale features because of the scale-decreased backbone. We propose SpineNet, a backbone with scale-permuted intermediate features and cross-scale connections that is learned on an object detection task by Neural Architecture Search. Using similar building blocks, SpineNet models outperform ResNet-FPN models by ~3% AP at various scales while using 10-20% fewer FLOPs. In particular, SpineNet-190 achieves 52.5% AP with a MaskR-CNN detector and achieves 52.1% AP with a RetinaNet detector on COCO for a single model without test-time augmentation, significantly outperforms prior art of detectors. SpineNet can transfer to classification tasks, achieving 5% top-1 accuracy improvement on a challenging iNaturalist fine-grained dataset. Code is at: this https URL.
Sigmoid function machine learning made simpleDevansh16
Another great part of the Machine Learning Made Simple Series.
Actually a family of functions. All functions have a characteristic "S"-shaped curve or sigmoid curve.
The most famous example is the logistic function. Other big ones are tanh and arc tan.
By their nature, they can be used to “squish” input, making them useful in Machine Learning
Accounting for variance in machine learning benchmarksDevansh16
Accounting for Variance in Machine Learning Benchmarks
Xavier Bouthillier, Pierre Delaunay, Mirko Bronzi, Assya Trofimov, Brennan Nichyporuk, Justin Szeto, Naz Sepah, Edward Raff, Kanika Madan, Vikram Voleti, Samira Ebrahimi Kahou, Vincent Michalski, Dmitriy Serdyuk, Tal Arbel, Chris Pal, Gaël Varoquaux, Pascal Vincent
Strong empirical evidence that one machine-learning algorithm A outperforms another one B ideally calls for multiple trials optimizing the learning pipeline over sources of variation such as data sampling, data augmentation, parameter initialization, and hyperparameters choices. This is prohibitively expensive, and corners are cut to reach conclusions. We model the whole benchmarking process, revealing that variance due to data sampling, parameter initialization and hyperparameter choice impact markedly the results. We analyze the predominant comparison methods used today in the light of this variance. We show a counter-intuitive result that adding more sources of variation to an imperfect estimator approaches better the ideal estimator at a 51 times reduction in compute cost. Building on these results, we study the error rate of detecting improvements, on five different deep-learning tasks/architectures. This study leads us to propose recommendations for performance comparisons.
When deep learners change their mind learning dynamics for active learningDevansh16
Abstract:
Active learning aims to select samples to be annotated that yield the largest performance improvement for the learning algorithm. Many methods approach this problem by measuring the informativeness of samples and do this based on the certainty of the network predictions for samples. However, it is well-known that neural networks are overly confident about their prediction and are therefore an untrustworthy source to assess sample informativeness. In this paper, we propose a new informativeness-based active learning method. Our measure is derived from the learning dynamics of a neural network. More precisely we track the label assignment of the unlabeled data pool during the training of the algorithm. We capture the learning dynamics with a metric called label-dispersion, which is low when the network consistently assigns the same label to the sample during the training of the network and high when the assigned label changes frequently. We show that label-dispersion is a promising predictor of the uncertainty of the network, and show on two benchmark datasets that an active learning algorithm based on label-dispersion obtains excellent results.
Semi supervised learning machine learning made simpleDevansh16
Video: https://youtu.be/65RV3O4UR3w
Semi-Supervised Learning is a technique that combines the benefits of supervised learning (performance, intuitiveness) with the ability to use cheap unlabeled data (unsupervised learning). With all the cheap data available, Semi Supervised Learning will get bigger in the coming months. This episode of Machine Learning Made Simple will go into SSL, how it works, transduction vs induction, the assumptions SSL algorithms make, and how SSL compares to human learning.
About Machine Learning Made Simple:
Machine Learning Made Simple is a playlist that aims to break down complex Machine Learning and AI topics into digestible videos. With this playlist, you can dive head first into the world of ML implementation and/or research. Feel free to drop any feedback you might have down below.
Paper Annotated: SinGAN-Seg: Synthetic Training Data Generation for Medical I...Devansh16
YouTube video: https://www.youtube.com/watch?v=Ao-19L0sLOI
SinGAN-Seg: Synthetic Training Data Generation for Medical Image Segmentation
Vajira Thambawita, Pegah Salehi, Sajad Amouei Sheshkal, Steven A. Hicks, Hugo L.Hammer, Sravanthi Parasa, Thomas de Lange, Pål Halvorsen, Michael A. Riegler
Processing medical data to find abnormalities is a time-consuming and costly task, requiring tremendous efforts from medical experts. Therefore, Ai has become a popular tool for the automatic processing of medical data, acting as a supportive tool for doctors. AI tools highly depend on data for training the models. However, there are several constraints to access to large amounts of medical data to train machine learning algorithms in the medical domain, e.g., due to privacy concerns and the costly, time-consuming medical data annotation process. To address this, in this paper we present a novel synthetic data generation pipeline called SinGAN-Seg to produce synthetic medical data with the corresponding annotated ground truth masks. We show that these synthetic data generation pipelines can be used as an alternative to bypass privacy concerns and as an alternative way to produce artificial segmentation datasets with corresponding ground truth masks to avoid the tedious medical data annotation process. As a proof of concept, we used an open polyp segmentation dataset. By training UNet++ using both the real polyp segmentation dataset and the corresponding synthetic dataset generated from the SinGAN-Seg pipeline, we show that the synthetic data can achieve a very close performance to the real data when the real segmentation datasets are large enough. In addition, we show that synthetic data generated from the SinGAN-Seg pipeline improving the performance of segmentation algorithms when the training dataset is very small. Since our SinGAN-Seg pipeline is applicable for any medical dataset, this pipeline can be used with any other segmentation datasets.
Subjects: Image and Video Processing (eess.IV); Computer Vision and Pattern Recognition (cs.CV); Machine Learning (cs.LG)
Cite as: arXiv:2107.00471 [eess.IV]
(or arXiv:2107.00471v1 [eess.IV] for this version)
Reach out to me:
Check out my other articles on Medium. : https://machine-learning-made-simple....
My YouTube: https://rb.gy/88iwdd
Reach out to me on LinkedIn: https://www.linkedin.com/in/devansh-d...
My Instagram: https://rb.gy/gmvuy9
My Twitter: https://twitter.com/Machine01776819
My Substack: https://devanshacc.substack.com/
Live conversations at twitch here: https://rb.gy/zlhk9y
Get a free stock on Robinhood: https://join.robinhood.com/fnud75
A simple framework for contrastive learning of visual representationsDevansh16
Link: https://machine-learning-made-simple.medium.com/learnings-from-simclr-a-framework-contrastive-learning-for-visual-representations-6c145a5d8e99
If you'd like to discuss something, text me on LinkedIn, IG, or Twitter. To support me, please use my referral link to Robinhood. It's completely free, and we both get a free stock. Not using it is literally losing out on free money.
Check out my other articles on Medium. : https://rb.gy/zn1aiu
My YouTube: https://rb.gy/88iwdd
Reach out to me on LinkedIn. Let's connect: https://rb.gy/m5ok2y
My Instagram: https://rb.gy/gmvuy9
My Twitter: https://twitter.com/Machine01776819
My Substack: https://devanshacc.substack.com/
Live conversations at twitch here: https://rb.gy/zlhk9y
Get a free stock on Robinhood: https://join.robinhood.com/fnud75
This paper presents SimCLR: a simple framework for contrastive learning of visual representations. We simplify recently proposed contrastive self-supervised learning algorithms without requiring specialized architectures or a memory bank. In order to understand what enables the contrastive prediction tasks to learn useful representations, we systematically study the major components of our framework. We show that (1) composition of data augmentations plays a critical role in defining effective predictive tasks, (2) introducing a learnable nonlinear transformation between the representation and the contrastive loss substantially improves the quality of the learned representations, and (3) contrastive learning benefits from larger batch sizes and more training steps compared to supervised learning. By combining these findings, we are able to considerably outperform previous methods for self-supervised and semi-supervised learning on ImageNet. A linear classifier trained on self-supervised representations learned by SimCLR achieves 76.5% top-1 accuracy, which is a 7% relative improvement over previous state-of-the-art, matching the performance of a supervised ResNet-50. When fine-tuned on only 1% of the labels, we achieve 85.8% top-5 accuracy, outperforming AlexNet with 100X fewer labels.
Comments: ICML'2020. Code and pretrained models at this https URL
Subjects: Machine Learning (cs.LG); Computer Vision and Pattern Recognition (cs.CV); Machine Learning (stat.ML)
Cite as: arXiv:2002.05709 [cs.LG]
(or arXiv:2002.05709v3 [cs.LG] for this version)
Submission history
From: Ting Chen [view email]
[v1] Thu, 13 Feb 2020 18:50:45 UTC (5,093 KB)
[v2] Mon, 30 Mar 2020 15:32:51 UTC (5,047 KB)
[v3] Wed, 1 Jul 2020 00:09:08 UTC (5,829 KB)
This slide deck goes over the concept of recurrence relations and uses that to build-up to the concept of the Big O notation in computer science, math, and asymptotic analysis of algorithms.
Paper Explained: Deep learning framework for measuring the digital strategy o...Devansh16
Companies today are racing to leverage the latest digital technologies, such as artificial intelligence, blockchain, and cloud computing. However, many companies report that their strategies did not achieve the anticipated business results. This study is the first to apply state of the art NLP models on unstructured data to understand the different clusters of digital strategy patterns that companies are Adopting. We achieve this by analyzing earnings calls from Fortune Global 500 companies between 2015 and 2019. We use Transformer based architecture for text classification which show a better understanding of the conversation context. We then investigate digital strategy patterns by applying clustering analysis. Our findings suggest that Fortune 500 companies use four distinct strategies which are product led, customer experience led, service led, and efficiency led. This work provides an empirical baseline for companies and researchers to enhance our understanding of the field.
Check out my other articles on Medium. : https://rb.gy/zn1aiu
My YouTube. It's a work in progress haha: https://rb.gy/88iwdd
Reach out to me on LinkedIn. Let's connect: https://rb.gy/m5ok2y
My Twitter: https://twitter.com/Machine01776819
My Substack: https://devanshacc.substack.com/
If you would like to work with me email me: devanshverma425@gmail.com
Live conversations at twitch here: https://rb.gy/zlhk9y
To get updates on my content- Instagram: https://rb.gy/gmvuy9
Get a free stock on Robinhood: https://join.robinhood.com/fnud75
Paper Explained: One Pixel Attack for Fooling Deep Neural NetworksDevansh16
Read more: https://devanshverma425.medium.com/what-should-we-learn-from-the-one-pixel-attack-a67c9a33e2a4
Abstract—Recent research has revealed that the output of Deep
Neural Networks (DNN) can be easily altered by adding relatively small perturbations to the input vector. In this paper, we analyze an attack in an extremely limited scenario where only one pixel can be modified. For that we propose a novel method for generating one-pixel adversarial perturbations based on differential evolution (DE). It requires less adversarial information (a blackbox attack) and can fool more types of networks due to the inherent features of DE. The results show that 67.97% of the natural images in Kaggle CIFAR-10 test dataset and 16.04% of the ImageNet (ILSVRC 2012) test images can be perturbed to at least one target class by modifying just one pixel with 74.03% and 22.91% confidence on average. We also show the same vulnerability on the original CIFAR-10 dataset. Thus, the proposed attack explores a different take on adversarial machine learning in an extreme limited scenario, showing that current DNNs are also vulnerable to such low dimension attacks. Besides, we also illustrate an important application of DE (or broadly speaking, evolutionary computation) in the domain of adversarial machine learning: creating tools that can effectively generate lowcost adversarial attacks against neural networks for evaluating robustness.
Check out my other articles on Medium. : https://rb.gy/zn1aiu
My YouTube. It’s a work in progress haha: https://rb.gy/88iwdd
Reach out to me on LinkedIn. Let’s connect: https://rb.gy/m5ok2y
My Twitter: https://twitter.com/Machine01776819
My Substack: https://devanshacc.substack.com/
If you would like to work with me email me: devanshverma425@gmail.com
Live conversations at twitch here: https://rb.gy/zlhk9y
To get updates on my content- Instagram: https://rb.gy/gmvuy9
Get a free stock on Robinhood: https://join.robinhood.com/fnud75
Paper Explained: Understanding the wiring evolution in differentiable neural ...Devansh16
Read my Explanation of the Paper here: https://medium.com/@devanshverma425/why-and-how-is-neural-architecture-search-is-biased-778763d03f38?sk=e16a3e54d6c26090a6b28f7420d3f6f7
Abstract: Controversy exists on whether differentiable neural architecture search methods discover wiring topology effectively. To understand how wiring topology evolves, we study the underlying mechanism of several existing differentiable NAS frameworks. Our investigation is motivated by three observed searching patterns of differentiable NAS: 1) they search by growing instead of pruning; 2) wider networks are more preferred than deeper ones; 3) no edges are selected in bi-level optimization. To anatomize these phenomena, we propose a unified view on searching algorithms of existing frameworks, transferring the global optimization to local cost minimization. Based on this reformulation, we conduct empirical and theoretical analyses, revealing implicit inductive biases in the cost's assignment mechanism and evolution dynamics that cause the observed phenomena. These biases indicate strong discrimination towards certain topologies. To this end, we pose questions that future differentiable methods for neural wiring discovery need to confront, hoping to evoke a discussion and rethinking on how much bias has been enforced implicitly in existing NAS methods.
Paper Explained: RandAugment: Practical automated data augmentation with a re...Devansh16
RandAugment: Practical automated data augmentation with a reduced search space is a paper that proposes a new Data Augmentation technique that outperforms all current techniques while being cheaper.
Learning with noisy labels is a common challenge in supervised learning. Existing approaches often require practitioners to specify noise rates, i.e., a set of parameters controlling the severity of label noises in the problem, and the specifications are either assumed to be given or estimated using additional steps. In this work, we introduce a new family of loss functions that we name as peer loss functions, which enables learning from noisy labels and does not require a priori specification of the noise rates. Peer loss functions work within the standard empirical risk minimization (ERM) framework. We show that, under mild conditions, performing ERM with peer loss functions on the noisy dataset leads to the optimal or a near-optimal classifier as if performing ERM over the clean training data, which we do not have access to. We pair our results with an extensive set of experiments. Peer loss provides a way to simplify model development when facing potentially noisy training labels, and can be promoted as a robust candidate loss function in such situations.
ViewShift: Hassle-free Dynamic Policy Enforcement for Every Data LakeWalaa Eldin Moustafa
Dynamic policy enforcement is becoming an increasingly important topic in today’s world where data privacy and compliance is a top priority for companies, individuals, and regulators alike. In these slides, we discuss how LinkedIn implements a powerful dynamic policy enforcement engine, called ViewShift, and integrates it within its data lake. We show the query engine architecture and how catalog implementations can automatically route table resolutions to compliance-enforcing SQL views. Such views have a set of very interesting properties: (1) They are auto-generated from declarative data annotations. (2) They respect user-level consent and preferences (3) They are context-aware, encoding a different set of transformations for different use cases (4) They are portable; while the SQL logic is only implemented in one SQL dialect, it is accessible in all engines.
#SQL #Views #Privacy #Compliance #DataLake
Analysis insight about a Flyball dog competition team's performanceroli9797
Insight of my analysis about a Flyball dog competition team's last year performance. Find more: https://github.com/rolandnagy-ds/flyball_race_analysis/tree/main
State of Artificial intelligence Report 2023kuntobimo2016
Artificial intelligence (AI) is a multidisciplinary field of science and engineering whose goal is to create intelligent machines.
We believe that AI will be a force multiplier on technological progress in our increasingly digital, data-driven world. This is because everything around us today, ranging from culture to consumer products, is a product of intelligence.
The State of AI Report is now in its sixth year. Consider this report as a compilation of the most interesting things we’ve seen with a goal of triggering an informed conversation about the state of AI and its implication for the future.
We consider the following key dimensions in our report:
Research: Technology breakthroughs and their capabilities.
Industry: Areas of commercial application for AI and its business impact.
Politics: Regulation of AI, its economic implications and the evolving geopolitics of AI.
Safety: Identifying and mitigating catastrophic risks that highly-capable future AI systems could pose to us.
Predictions: What we believe will happen in the next 12 months and a 2022 performance review to keep us honest.
06-04-2024 - NYC Tech Week - Discussion on Vector Databases, Unstructured Data and AI
Discussion on Vector Databases, Unstructured Data and AI
https://www.meetup.com/unstructured-data-meetup-new-york/
This meetup is for people working in unstructured data. Speakers will come present about related topics such as vector databases, LLMs, and managing data at scale. The intended audience of this group includes roles like machine learning engineers, data scientists, data engineers, software engineers, and PMs.This meetup was formerly Milvus Meetup, and is sponsored by Zilliz maintainers of Milvus.
Enhanced Enterprise Intelligence with your personal AI Data Copilot.pdfGetInData
Recently we have observed the rise of open-source Large Language Models (LLMs) that are community-driven or developed by the AI market leaders, such as Meta (Llama3), Databricks (DBRX) and Snowflake (Arctic). On the other hand, there is a growth in interest in specialized, carefully fine-tuned yet relatively small models that can efficiently assist programmers in day-to-day tasks. Finally, Retrieval-Augmented Generation (RAG) architectures have gained a lot of traction as the preferred approach for LLMs context and prompt augmentation for building conversational SQL data copilots, code copilots and chatbots.
In this presentation, we will show how we built upon these three concepts a robust Data Copilot that can help to democratize access to company data assets and boost performance of everyone working with data platforms.
Why do we need yet another (open-source ) Copilot?
How can we build one?
Architecture and evaluation
1. Deep Ensembles: A Loss Landscape Perspective
Stanislav Fort∗
Google Research
sfort1@stanford.edu
Huiyi Hu∗
DeepMind
clarahu@google.com
Balaji Lakshminarayanan†
DeepMind
balajiln@google.com
Abstract
Deep ensembles have been empirically shown to be a promising approach for
improving accuracy, uncertainty and out-of-distribution robustness of deep learning
models. While deep ensembles were theoretically motivated by the bootstrap,
non-bootstrap ensembles trained with just random initialization also perform well
in practice, which suggests that there could be other explanations for why deep
ensembles work well. Bayesian neural networks, which learn distributions over the
parameters of the network, are theoretically well-motivated by Bayesian principles,
but do not perform as well as deep ensembles in practice, particularly under
dataset shift. One possible explanation for this gap between theory and practice
is that popular scalable variational Bayesian methods tend to focus on a single
mode, whereas deep ensembles tend to explore diverse modes in function space.
We investigate this hypothesis by building on recent work on understanding the
loss landscape of neural networks and adding our own exploration to measure
the similarity of functions in the space of predictions. Our results show that
random initializations explore entirely different modes, while functions along an
optimization trajectory or sampled from the subspace thereof cluster within a
single mode predictions-wise, while often deviating significantly in the weight
space. Developing the concept of the diversity–accuracy plane, we show that the
decorrelation power of random initializations is unmatched by popular subspace
sampling methods. Finally, we evaluate the relative effects of ensembling, subspace
based methods and ensembles of subspace based methods, and the experimental
results validate our hypothesis.
1 Introduction
Consider a typical classification problem, where xn ∈ RD
denotes the D-dimensional features
and yn ∈ [1, . . . , K] denotes the class label. Assume we have a parametric model p(y|x, θ)
for the conditional distribution where θ denotes weights and biases of a neural network, and
p(θ) is a prior distribution over parameters. The Bayesian posterior over parameters is given
by p(θ|{xn, yn}N
n=1) ∝ p(θ)
N
n=1 p(yn|xn, θ).
Computing the exact posterior distribution over θ is computationally expensive (if not impossible)
when p(yn|xn, θ) is a deep neural network (NN). A variety of approximations have been developed
for Bayesian neural networks, including Laplace approximation [MacKay, 1992], Markov chain
Monte Carlo methods [Neal, 1996, Welling and Teh, 2011, Springenberg et al., 2016], variational
Bayesian methods [Graves, 2011, Blundell et al., 2015, Louizos and Welling, 2017, Wen et al., 2018]
and Monte-Carlo dropout [Gal and Ghahramani, 2016, Srivastava et al., 2014]. While computing
the posterior is challenging, it is usually easy to perform maximum-a-posteriori (MAP) estimation,
which corresponds to a mode of the posterior. The MAP solution can be written as the minimizer of
the following loss:
ˆθMAP = arg min
θ
L(θ, {xn, yn}N
n=1) = arg min
θ
− log p(θ) −
N
n=1
log p(yn|xn, θ). (1)
∗
Equal contribution.
†
Corresponding author.
arXiv:1912.02757v2[stat.ML]25Jun2020
2. The MAP solution is computationally efficient, but only gives a point estimate and not a distribution
over parameters. Deep ensembles, proposed by Lakshminarayanan et al. [2017], train an ensemble
of neural networks by initializing at M different values and repeating the minimization multiple
times which could lead to M different solutions, if the loss is non-convex. Lakshminarayanan et al.
[2017] found adversarial training provides additional benefits in some of their experiments, but we
will ignore adversarial training and focus only on ensembles with random initialization.
Given finite training data, many parameter values could equally well explain the observations, and
capturing these diverse solutions is crucial for quantifying epistemic uncertainty [Kendall and Gal,
2017]. Bayesian neural networks learn a distribution over weights, and a good posterior approximation
should be able to learn multi-modal posterior distributions in theory. Deep ensembles were inspired
by the bootstrap [Breiman, 1996], which has useful theoretical properties. However, it has been
empirically observed by Lakshminarayanan et al. [2017], Lee et al. [2015] that training individual
networks with just random initialization is sufficient in practice and using the bootstrap can even hurt
performance (e.g. for small ensemble sizes). Furthermore, Ovadia et al. [2019] and Gustafsson et al.
[2019] independently benchmarked existing methods for uncertainty quantification on a variety of
datasets and architectures, and observed that ensembles tend to outperform approximate Bayesian
neural networks in terms of both accuracy and uncertainty, particularly under dataset shift.
Figure 1: Cartoon illustration of the hypothesis.
x-axis indicates parameter values and y-axis plots
the negative loss −L(θ, {xn, yn}N
n=1) on train and
validation data.
These empirical observations raise an impor-
tant question: Why do deep ensembles trained
with just random initialization work so well
in practice? One possible hypothesis is
that ensembles tend to sample from differ-
ent modes3
in function space, whereas vari-
ational Bayesian methods (which minimize
DKL(q(θ)|p(θ|{xn, yn}N
n=1)) might fail to ex-
plore multiple modes even though they are ef-
fective at capturing uncertainty within a single
mode. See Figure 1 for a cartoon illustration.
Note that while the MAP solution is a local opti-
mum for the training loss,it may not necessarily
be a local optimum for the validation loss.
Recent work on understanding loss landscapes [Garipov et al., 2018, Draxler et al., 2018, Fort and
Jastrzebski, 2019] allows us to investigate this hypothesis. Note that prior work on loss landscapes
has focused on mode-connectivity and low-loss tunnels, but has not explicitly focused on how diverse
the functions from different modes are. The experiments in these papers (as well as other papers on
deep ensembles) provide indirect evidence for this hypothesis, either through downstream metrics
(e.g. accuracy and calibration) or by visualizing the performance along the low-loss tunnel. We
complement these works by explicitly measuring function space diversity within training trajectories
and subspaces thereof (dropout, diagonal Gaussian, low-rank Gaussian and random subspaces) and
across different randomly initialized trajectories across multiple datasets, architectures, and dataset
shift. Our findings show that the functions sampled along a single training trajectory or subspace
thereof tend to be very similar in predictions (while potential far away in the weight space), whereas
functions sampled from different randomly initialized trajectories tend to be very diverse.
2 Background
The loss landscape of neural networks (also called the objective landscape) – the space of weights
and biases that the network navigates during training – is a high dimensional function and therefore
could potentially be very complicated. However, many empirical results show surprisingly simple
properties of the loss surface. Goodfellow and Vinyals [2014] observed that the loss along a linear
path from an initialization to the corresponding optimum is monotonically decreasing, encountering
no significant obstacles along the way. Li et al. [2018] demonstrated that constraining optimization to
a random, low-dimensional hyperplane in the weight space leads to results comparable to full-space
optimization, provided that the dimension exceeds a modest threshold. This was geometrically
understood and extended by Fort and Scherlis [2019].
3
We use the term ‘mode’ to refer to unique functions fθ(x). Due to weight space symmetries, different
parameters can correspond to the same function, i.e. fθ1 (x) = fθ2 (x) even though θ1 = θ2.
2
3. Garipov et al. [2018], Draxler et al. [2018] demonstrate that while a linear path between two
independent optima hits a high loss area in the middle, there in fact exist continuous, low-loss paths
connecting any pair of optima (or at least any pair empirically studied so far). These observations are
unified into a single phenomenological model in [Fort and Jastrzebski, 2019]. While low-loss tunnels
create functions with near-identical low values of loss along the path, the experiments of Fort and
Jastrzebski [2019], Garipov et al. [2018] provide preliminary evidence that these functions tend to be
very different in function space, changing significantly in the middle of the tunnel, see Appendix A
for a review and additional empirical evidence that complements their results.
3 Experimental setup
We explored the CIFAR-10 [Krizhevsky, 2009], CIFAR-100 [Krizhevsky, 2009], and ImageNet
[Deng et al., 2009] datasets. We train convolutional neural networks on the CIFAR-10 dataset,
which contains 50K training examples from 10 classes. To verify that our findings translate across
architectures, we use the following 3 architectures on CIFAR-10:
• SmallCNN: channels [16,32,32] for 10 epochs which achieves 64% test accuracy.
• MediumCNN: channels [64,128,256,256] for 40 epochs which achieves 71% test accuracy.
• ResNet20v1 [He et al., 2016a]: for 200 epochs which achieves 90% test accuracy.
We use the Adam optimizer [Kingma and Ba, 2015] for training and to make sure the effects we
observe are general, we validate that our results hold for vanilla stochastic gradient descent (SGD)
as well (not shown due to space limitations). We use batch size 128 and dropout 0.1 for training
SmallCNN and MediumCNN. We used 40 epochs of training for each. To generate weight space
and prediction space similarity results, we use a constant learning rate of 1.6 × 10⁻³
and halfing
it every 10 epochs, unless specified otherwise. We do not use any data augmentation with those
two architectures. For ResNet20v1, we use the data augmentation and learning rate schedule used
in Keras examples.4
The overall trends are consistent across all architectures, datasets, and other
hyperparameter and non-linearity choices we explored.
To test if our observations generalize to other datasets, we also ran certain experiments on more
complex datasets such as CIFAR-100 [Krizhevsky, 2009] which contains 50K examples belonging
to 100 classes and ImageNet [Deng et al., 2009], which contains roughly 1M examples belonging
to 1000 classes. CIFAR-100 is trained using the same ResNet20v1 as above with Adam optimizer,
batch size 128 and total epochs of 200. The learning rate starts from 10−3
and decays to (10−4
, 5 ×
10−5
, 10−5
, 5 × 10⁻⁷
) at epochs (100, 130, 160, 190). ImageNet is trained with ResNet50v2 [He
et al., 2016b] and momentum optimizer (0.9 momentum), with batch size 256 and 160 epochs. The
learning rate starts from 0.15 and decays to (0.015, 0.0015) at epochs (80, 120).
In addition to evaluating on regular test data, we also evaluate the performance of the methods on
corrupted versions of the dataset using the CIFAR-10-C and ImageNet-C benchmarks [Hendrycks
and Dietterich, 2019] which contain corrupted versions of original images with 19 corruption types
(15 for ImageNet-C) and varying intensity values (1-5), and was used by Ovadia et al. [2019] to
measure calibration of the uncertainty estimates under dataset shift. Following Ovadia et al. [2019],
we measure accuracy as well as Brier score [Brier, 1950] (lower values indicate better uncertainty
estimates). We use the SVHN dataset [Netzer et al., 2011] to evaluate how different methods trained
on CIFAR-10 dataset react to out-of-distribution (OOD) inputs.
4 Visualizing Function Space Similarity
4.1 Similarity of Functions Within and Across Randomly Initialized Trajectories
First, we compute the similarity between different checkpoints along a single trajectory. In Figure 2(a),
we plot the cosine similarity in weight space, defined as cos(θ1, θ2) =
θ1 θ2
||θ1||||θ2|| . In Figure 2(b), we
plot the disagreement in function space, defined as the fraction of points the checkpoints disagree
on, that is, 1
N
N
n=1[f(xn; θ1) = f(xn; θ2)], where f(x; θ) denotes the class label predicted by the
network for input x. We observe that the checkpoints along a trajectory are largely similar both in the
weight space and the function space. Next, we evaluate how diverse the final solutions from different
random initializations are. The functions from different initialization are different, as demonstrated
4
https://keras.io/examples/cifar10_resnet/
3
4. (a) Cosine similarity of weights (b) Disagreement of predictions (c) t-SNE of predictions
Figure 2: Results using SmallCNN on CIFAR-10. Left plot: Cosine similarity between checkpoints
to measure weight space alignment along optimization trajectory. Middle plot: The fraction of labels
on which the predictions from different checkpoints disagree. Right plot: t-SNE plot of predictions
from checkpoints corresponding to 3 different randomly initialized trajectories (in different colors).
by the similarity plots in Figure 3. Comparing this with Figures 2(a) and 2(b), we see that functions
within a single trajectory exhibit higher similarity and functions across different trajectories exhibit
much lower similarity.
Next, we take the predictions from different checkpoints along the individual training trajectories
from multiple initializations and compute a t-SNE plot [Maaten and Hinton, 2008] to visualize their
similarity in function space. More precisely, for each checkpoint we take the softmax output for a set
of examples, flatten the vector and use it to represent the model’s predictions. The t-SNE algorithm is
then used to reduce it to a 2D point in the t-SNE plot. Figure 2(c) shows that the functions explored by
different trajectories (denoted by circles with different colors) are far away, while functions explored
within a single trajectory (circles with the same color) tend to be much more similar.
(a) Results using SmallCNN (b) Results using ResNet20v1
Figure 3: Results on CIFAR-10 using two different architectures. For each of these architectures, the
left subplot shows the cosine similarity between different solutions in weight space, and the right
subplot shows the fraction of labels on which the predictions from different solutions disagree. In
general, the weight vectors from two different initializations are essentially orthogonal, while their
predictions are approximately as dissimilar as any other pair.
4.2 Similarity of Functions Within Subspace from Each Trajectory and Across Trajectories
In addition to the checkpoints along a trajectory, we also construct subspaces based on each individual
trajectory. Scalable variational Bayesian methods typically approximate the distribution of weights
along the training trajectory, hence visualizing the diversity of functions between the subspaces helps
understand the difference between Bayesian neural networks and ensembles. We use a representative
set of four subspace sampling methods: Monte Carlo dropout, a diagonal Gaussian approximation, a
low-rank covariance matrix Gaussian approximation and a random subspace approximation. Unlike
dropout and Gaussian approximations which assume a parametric form for the variational posterior,
the random subspace method explores all high-quality solutions within the subspace and hence could
be thought of as a non-parametric variational approximation to the posterior. Due to space constraints,
we do not consider Markov Chain Monte Carlo (MCMC) methods in this work; Zhang et al. [2020]
show that popular stochastic gradient MCMC (SGMCMC) methods may not explore multiple modes
and propose cyclic SGMCMC. We compare diversity of random initialization and cyclic SGMCMC
in Appendix C. In the descriptions of the methods, let θ0 be the optimized weight-space solution (the
weights and biases of our trained neural net) around which we will construct the subspace.
4
5. • Random subspace sampling: We start at an optimized solution θ0 and choose a random direction
v in the weight space. We step in that direction by choosing different values of t and looking at
predictions at configurations θ0 + tv. We repeat this for many random directions v.
• Dropout subspace: We start at an optimized solution θ0 apply dropout with a randomly chosen
pkeep, evaluate predictions at dropoutpkeep
(θ0) and repeat this many times with different pkeep .
• Diagonal Gaussian subspace: We start at an optimized solution θ0 and look at the most recent
iterations of training proceeding it. For each trainable parameter θi, we calculate the mean µi and
standard deviation σi independently for each parameter, which corresponds to a diagonal covariance
matrix. This is similar to SWAG-diagonal [Maddox et al., 2019]. To sample solutions from the
subspace, we repeatedly draw samples where each parameter independently as θi ∼ N(µi, σi).
• Low-rank Gaussian subspace: We follow the same procedure as the diagonal Gaussian subspace
above to compute the mean µi for each trainable parameter. For the covariance, we use a rank-
k approximation, by calculating the top k principal components of the recent weight vectors
{vi ∈ Rparams
}k. We sample from a k-dimensional normal distribution and obtain the weight
configurations as θ ∼ µ + i N(0k
, 1k
)vi. Throughout the text, we use the terms low-rank and
PCA Gaussian interchangeably.
Figure 4: Results using SmallCNN on CIFAR-10: t-SNE plots of validation set predictions for each
trajectory along with four different subspace generation methods (showed by squares), in addition to
3 independently initialized and trained runs (different colors). As visible in the plot, the subspace-
sampled functions stay in the prediction-space neighborhood of the run around which they were
constructed, demonstrating that truly different functions are not sampled.
Figure 4 shows that functions sampled from a subspace (denoted by colored squares) corresponding
to a particular initialization, are much more similar to each other. While some subspaces are more
diverse, they still do not overlap with functions from another randomly initialized trajectory.
0.5 0.0 0.5 1.0 1.5
Weight space direction 1
0.5
0.0
0.5
1.0
1.5
Weightspacedirection2
Accuracy
Init 1
Path 1
Opt 1
Init 2
Path 2
Opt 2
Origin
Gauss x100.0
0.0
0.1
0.2
0.3
0.4
0.5
0.6
0.7
0.8
0.5 0.0 0.5 1.0 1.5
Weight space direction 1
Function similarity to optimum 1
Init 1
Path 1
Opt 1
Init 2
Path 2
Opt 2
Origin
Gauss x100.0
0.00
0.15
0.30
0.45
0.60
0.75
0.90
0.5 0.0 0.5 1.0 1.5
Weight space direction 1
Function similarity to optimum 2
Init 1
Path 1
Opt 1
Init 2
Path 2
Opt 2
Origin
Gauss x100.0
0.00
0.15
0.30
0.45
0.60
0.75
0.90
Figure 5: Results using MediumCNN on CIFAR-10: Radial loss landscape cut between the origin and
two independent optima. Left plot shows accuracy of models along the paths of the two independent
trajectories, and the middle and right plots show function space similarity to the two optima.
As additional evidence, Figure 5 provides a two-dimensional visualization of the radial landscape
along the directions of two different optima. The 2D sections of the weight space visualized are
defined by the origin (all weights are 0) and two independently initialized and trained optima. The
weights of the two trajectories (shown in red and blue) are initialized using standard techniques and
they increase radially with training due to their softmax cross-entropy loss. The left subplot shows
that different randomly initialized trajectories eventually achieve similar accuracy. We also sample
from a Gaussian subspace along trajectory 1 (shown in pink). The middle and the right subplots
5
6. show function space similarity (defined as the fraction of points on which they agree on the class
prediction) of the parameters along the path to optima 1 and 2. Solutions along each trajectory (and
Gaussian subspace) are much more similar to their respective optima, which is consistent with the
cosine similarity and t-SNE plots.
4.3 Diversity versus Accuracy plots
To illustrate the difference in another fashion, we sample functions from a single subspace and
plot accuracy versus diversity, as measured by disagreement between predictions from the baseline
solution. From a bias-variance trade-off perspective, we require a procedure to produce functions that
are accurate (which leads to low bias by aggregation) as well as de-correlated (which leads to lower
variance by aggregation). Hence, the diversity vs accuracy plot allows us to visualize the trade-off
that can be achieved by subspace sampling methods versus deep ensembles.
The diversity score quantifies the difference of two functions (a base solution and a sampled one), by
measuring fraction of datapoints on which their predictions differ. We chose this approach due to its
simplicity; we also computed the KL-divergence and other distances between the output probability
distributions, leading to equivalent conclusions. Let ddiff denote the fraction of predictions on which
the two functions differ. It is 0 when the two functions make identical class predictions, and 1
when they differ on every single example. To account for the fact that the lower the accuracy of a
function, the higher its potential ddiff due to the possibility of the wrong answers being random and
uncorrelated between the two functions, we normalize this by (1 − a), where a is the accuracy of
the sampled solution. We also derive idealized lower and upper limits of these curves (showed in
dashed lines) by perturbing the reference solution’s predictions (lower limit) and completely random
predictions at a given accuracy (upper limit), see Appendix D for a discussion.
Figure 6: Diversity versus accuracy plots for 3 models trained on CIFAR-10: SmallCNN, Medium-
CNN and a ResNet20v1. Independently initialized and optimized solutions (red stars) achieve better
diversity vs accuracy trade-off than the four different subspace sampling methods.
Figure 6 shows the results on CIFAR-10. Comparing these subspace points (colored dots) to the
baseline optima (green star) and the optima from different random initializations (denoted by red
stars), we observe that random initializations are much more effective at sampling diverse and
accurate solutions, than subspace based methods constructed out of a single trajectory. The results
are consistent across different architectures and datasets. Figure 7 shows results on CIFAR-100 and
ImageNet. We observe that solutions obtained by subspace sampling methods have a worse trade off
between accuracy and prediction diversity, compared to independently initialized and trained optima.
Interestingly, the separation between the subspace sampling methods and independent optima in the
diversity–accuracy plane gets more pronounced the more difficult the problem and the more powerful
the network.
(a) ResNet20v1 trained on CIFAR-100. (b) ResNet50v2 trained on ImageNet.
Figure 7: Diversity vs. accuracy plots for ResNet20v1 on CIFAR-100, and ResNet50v2 on ImageNet.
6
7. 5 Evaluating the Relative Effects of Ensembling versus Subspace Methods
Our hypothesis in Figure 1 and the empirical observations in the previous section suggest that
subspace-based methods and ensembling should provide complementary benefits in terms of un-
certainty and accuracy. Since our goal is not to propose a new method, but to carefully test this
hypothesis, we evaluate the performance of the following four variants for controlled comparison:
• Baseline: optimum at the end of a single trajectory.
• Subspace sampling: average predictions over the solutions sampled from a subspace.
• Ensemble: train baseline multiple times with random initialization and average the predictions.
• Ensemble + Subspace sampling: train multiple times with random initialization, and use subspace
sampling within each trajectory.
To maintain the accuracy of random samples at a reasonable level for fair comparison, we reject
the sample if validation accuracy is below 0.65. For the CIFAR-10 experiment, we use a rank-4
approximation of the random samples using PCA. Note that diagonal Gaussian, low-rank Gaussian
and random subspace sampling methods to approximate each mode of the posterior leads to an
increase in the number of parameters required for each mode. However, using just the mean weights
for each mode would not cause such an increase. Izmailov et al. [2018] proposed stochastic weight
averaging (SWA) for better generalization. One could also compute an (exponential moving) average
of the weights along the trajectory, inspired by Polyak-Ruppert averaging in convex optimization,
(see also [Mandt et al., 2017] for a Bayesian view on iterate averaging). As weight averaging (WA)
has been already studied by Izmailov et al. [2018], we do not discuss it in detail. Our goal is to test if
WA finds a better point estimate within each mode (see cartoon illustration in Figure 1) and provides
complementary benefits to ensembling over random initialization. In our experiments, we use WA on
the last few epochs which corresponds to using just the mean of the parameters within each mode.
Figure 8 shows the results on CIFAR-10. The results validate our hypothesis that (i) subspace
sampling and ensembling provide complementary benefits, and (ii) the relative benefits of ensembling
are higher as it averages predictions over more diverse solutions.
Figure 8: Results using MediumCNN on CIFAR-10 showing the complementary benefits of ensemble
and subspace methods as a function of ensemble size. We used 10 samples for each subspace method.
Effect of function space diversity on dataset shift We test the same hypothesis under dataset shift
[Ovadia et al., 2019, Hendrycks and Dietterich, 2019]. Left and middle subplots of Figure 9 show
accuracy and Brier score on the CIFAR-10-C benchmark. We observe again that ensembles and
subspace sampling methods provide complementary benefits.
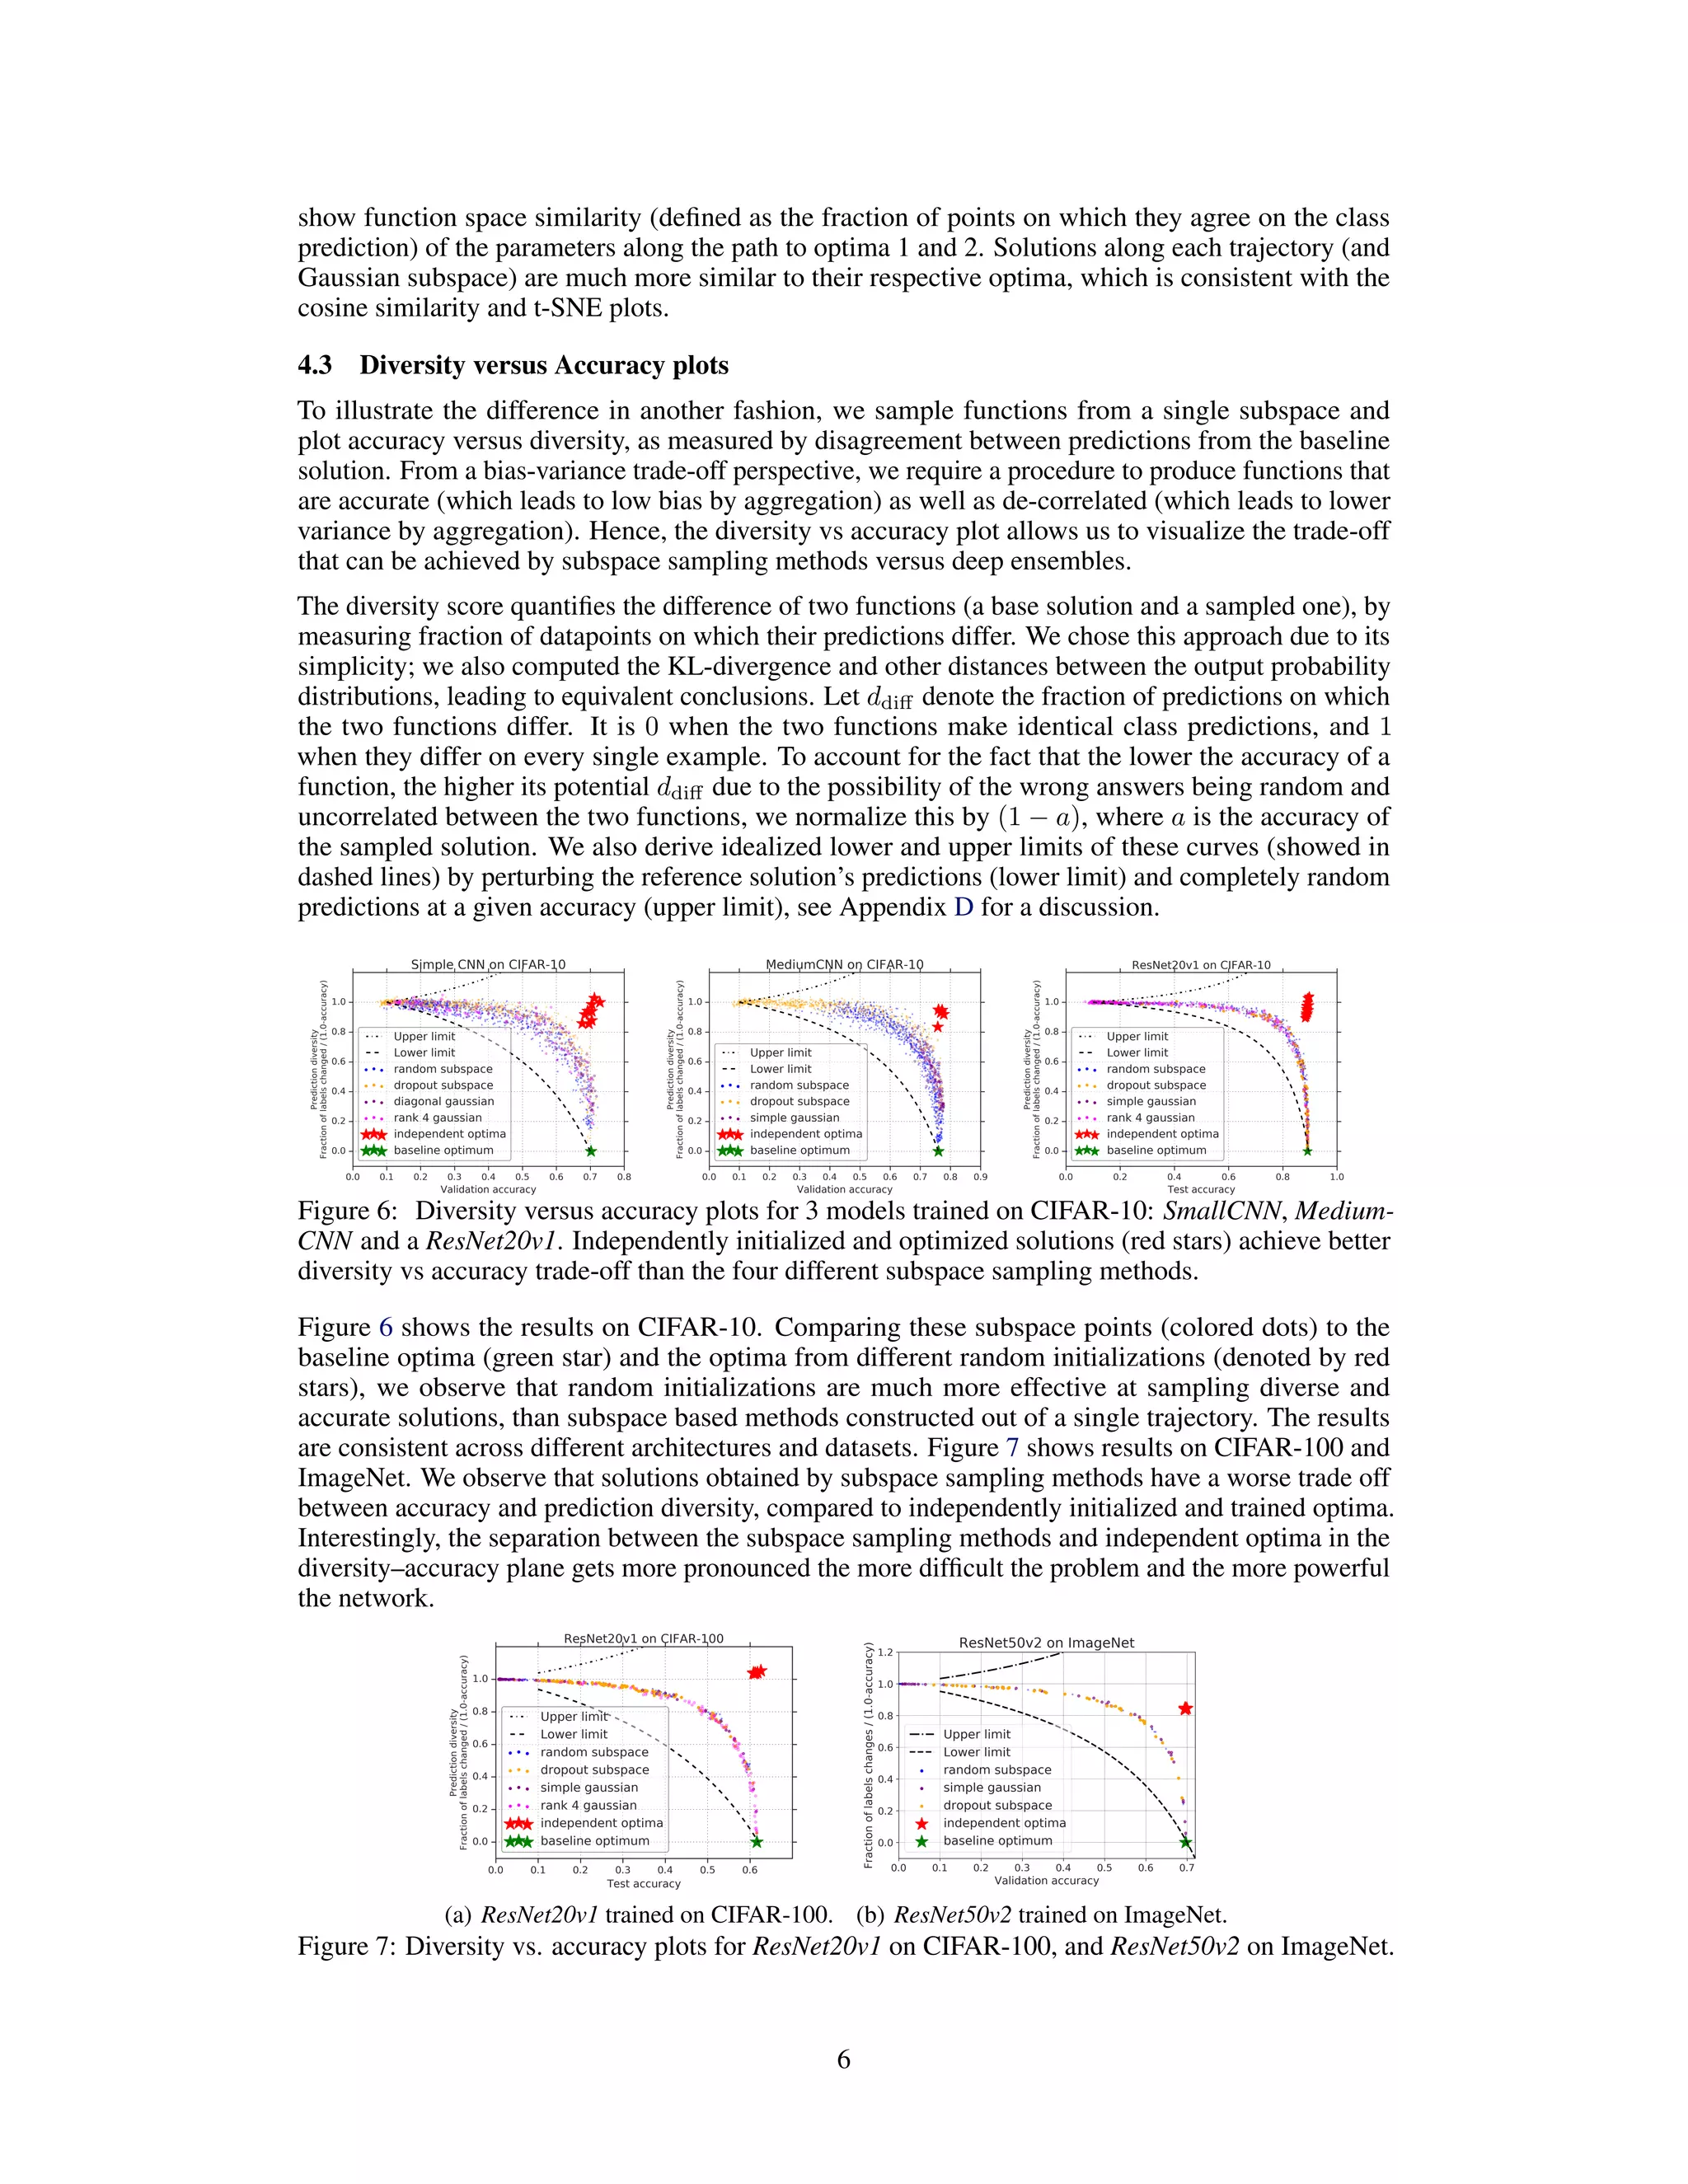
The diversity versus accuracy plot compares diversity to a reference solution, but it is also important
to also look at the diversity between multiple samples of the same method, as this will effectively
determine the efficiency of the method in terms of the bias-variance trade-off. Function space
diversity is particularly important to avoid overconfident predictions under dataset shift, as averaging
over similar functions would not reduce overconfidence. To visualize this, we draw 5 samples
of each method and compute the average Jensen-Shannon divergence between their predictions,
defined as
M
m=1 KL(pθm (y|x)||¯p(y|x)) where KL denotes the Kullback-Leibler divergence and
¯p(y|x) = (1/M) m pθm
(y|x). Right subplot of Figure 9 shows the results on CIFAR-10-C for
increasing corruption intensity. We observe that Jensen-Shannon divergence is the highest between
independent random initializations, and lower for subspace sampling methods; the difference is
7
8. Figure 9: Results using MediumCNN on CIFAR-10-C for varying levels of corruption intensity. Left
plot shows accuracy, medium plot shows Brier score and right plot shows Jensen-Shannon divergence.
higher under dataset shift, which explains the findings of Ovadia et al. [2019] that deep ensembles
outperform other methods under dataset shift. We also observe similar trends when testing on an
OOD dataset such as SVHN: JS divergence is 0.384 for independent runs, 0.153 for within-trajectory,
0.155 for random sampling, 0.087 for rank-5 PCA Gaussian and 0.034 for diagonal Gaussian.
Results on ImageNet To illustrate the effect on another challenging dataset, we repeat these ex-
periments on ImageNet [Deng et al., 2009] using ResNet50v2 architecture. Due to computational
constraints, we do not evaluate PCA subspace on ImageNet. Figure 10 shows results on ImageNet
test set (zero corruption intensity) and ImageNet-C for increasing corruption intensities. Similar
to CIFAR-10, random subspace performs best within subspace sampling methods, and provides
complementary benefits to random initialization. We empirically observed that the relative gains
of WA (or subspace sampling) are smaller when the individual models converge to a better optima
within each mode. Carefully choosing which points to average, e.g. using cyclic learning rate as done
in fast geometric ensembling [Garipov et al., 2018] can yield further benefits.
Figure 10: Results using ResNet50v2 on ImageNet test and ImageNet-C for varying corruptions.
6 Discussion
Through extensive experiments, we show that trajectories of randomly initialized neural networks
explore different modes in function space, which explains why deep ensembles trained with just
random initializations work well in practice. Subspace sampling methods such as weight averaging,
Monte Carlo dropout, and various versions of local Gaussian approximations, sample functions
that might lie relatively far from the starting point in the weight space, however, they remain
similar in function space, giving rise to an insufficiently diverse set of predictions. Using the
concept of the diversity–accuracy plane, we demonstrate empirically that current variational Bayesian
methods do not reach the trade-off between diversity and accuracy achieved by independently trained
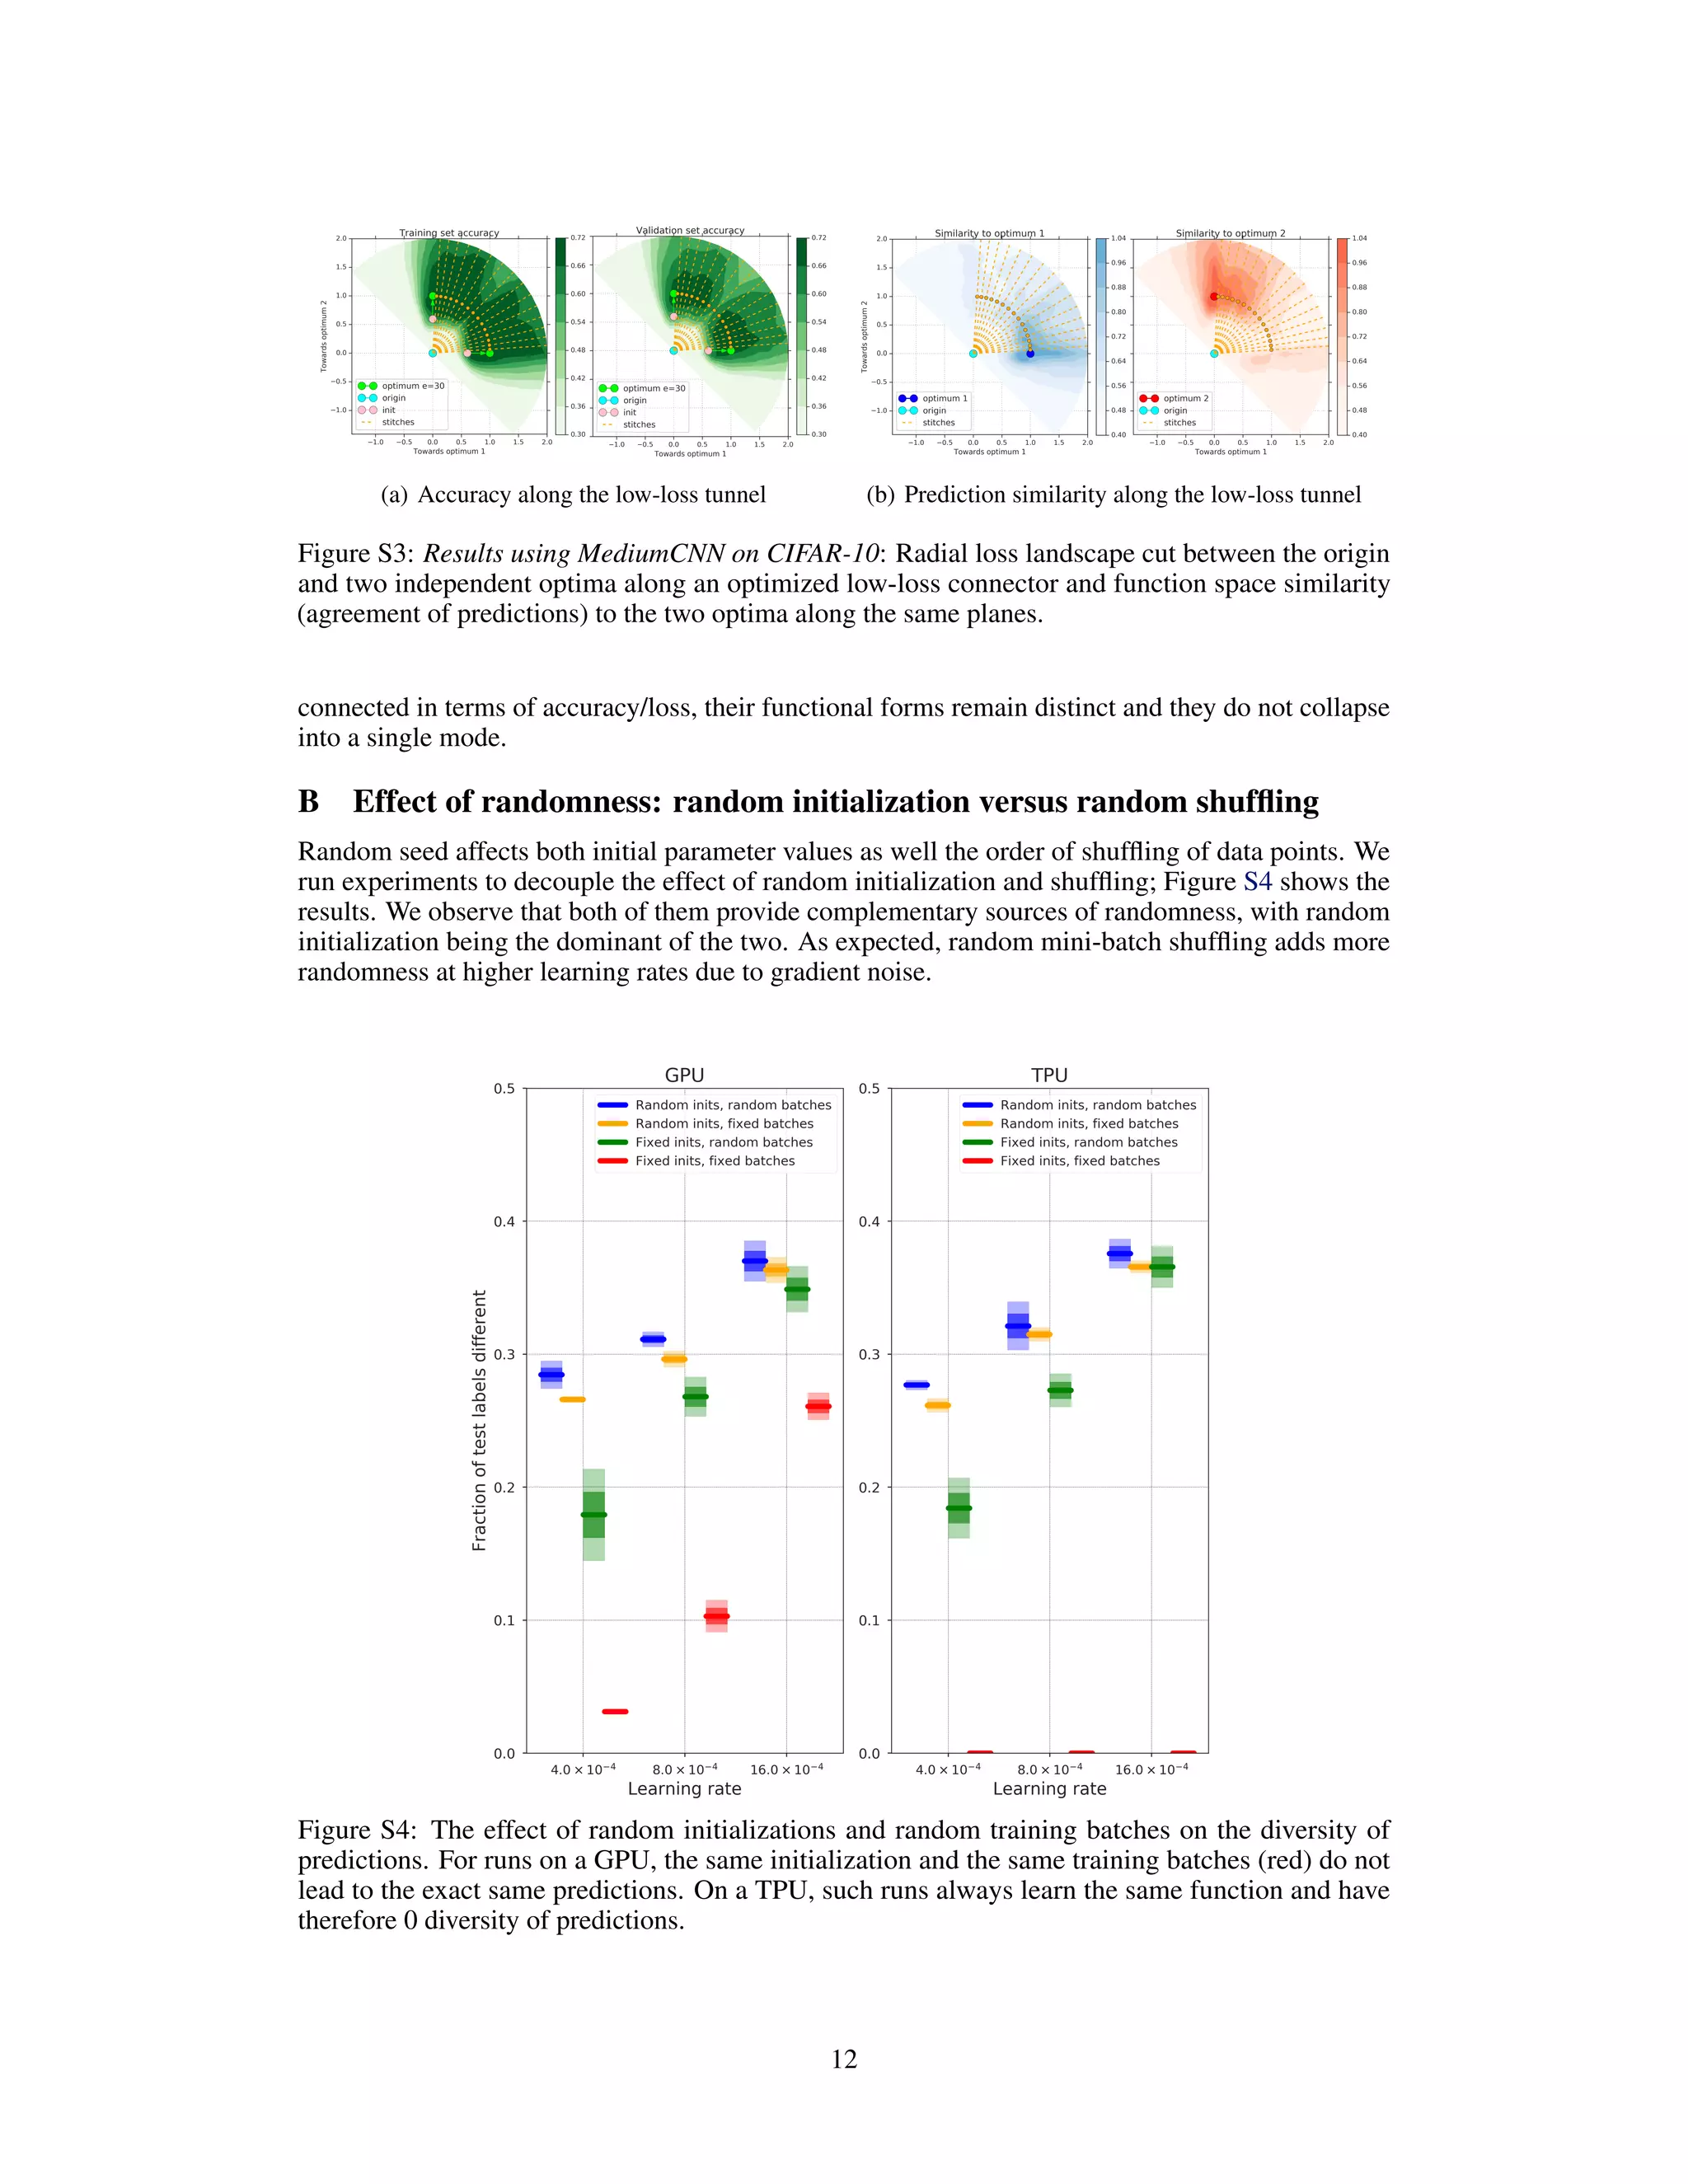
models. There are several interesting directions for future research: understanding the role of random
initialization on training dynamics (see Appendix B for a preliminary investigation), exploring
methods which achieve higher diversity than deep ensembles (e.g. through explicit decorrelation),
and developing parameter-efficient methods (e.g. implicit ensembles or Bayesian deep learning
algorithms) that achieve better diversity–accuracy trade-off than deep ensembles.
8
9. References
David JC MacKay. Bayesian methods for adaptive models. PhD thesis, California Institute of
Technology, 1992.
Radford M. Neal. Bayesian Learning for Neural Networks. Springer-Verlag New York, Inc., 1996.
Max Welling and Yee Whye Teh. Bayesian Learning via Stochastic Gradient Langevin Dynamics. In
ICML, 2011.
Jost Tobias Springenberg, Aaron Klein, Stefan Falkner, and Frank Hutter. Bayesian optimization
with robust Bayesian neural networks. In NeurIPS, 2016.
Alex Graves. Practical variational inference for neural networks. In NeurIPS, 2011.
Charles Blundell, Julien Cornebise, Koray Kavukcuoglu, and Daan Wierstra. Weight uncertainty in
neural networks. In ICML, 2015.
Christos Louizos and Max Welling. Multiplicative Normalizing Flows for Variational Bayesian
Neural Networks. In ICML, 2017.
Yeming Wen, Paul Vicol, Jimmy Ba, Dustin Tran, and Roger Grosse. Flipout: Efficient pseudo-
independent weight perturbations on mini-batches. In ICLR, 2018.
Yarin Gal and Zoubin Ghahramani. Dropout as a Bayesian approximation: Representing model
uncertainty in deep learning. In ICML, 2016.
Nitish Srivastava, Geoffrey Hinton, Alex Krizhevsky, Ilya Sutskever, and Ruslan Salakhutdinov.
Dropout: A simple way to prevent neural networks from overfitting. JMLR, 2014.
Balaji Lakshminarayanan, Alexander Pritzel, and Charles Blundell. Simple and scalable predictive
uncertainty estimation using deep ensembles. In NeurIPS, 2017.
Alex Kendall and Yarin Gal. What uncertainties do we need in Bayesian deep learning for computer
vision? In NeurIPS, 2017.
Leo Breiman. Bagging predictors. Machine learning, 1996.
Stefan Lee, Senthil Purushwalkam, Michael Cogswell, David Crandall, and Dhruv Batra. Why
M heads are better than one: Training a diverse ensemble of deep networks. arXiv preprint
arXiv:1511.06314, 2015.
Yaniv Ovadia, Emily Fertig, Jie Ren, Zachary Nado, D Sculley, Sebastian Nowozin, Joshua V Dillon,
Balaji Lakshminarayanan, and Jasper Snoek. Can you trust your model’s uncertainty? Evaluating
predictive uncertainty under dataset shift. In NeurIPS, 2019.
Fredrik K Gustafsson, Martin Danelljan, and Thomas B Schön. Evaluating scalable Bayesian deep
learning methods for robust computer vision. arXiv preprint arXiv:1906.01620, 2019.
Timur Garipov, Pavel Izmailov, Dmitrii Podoprikhin, Dmitry P Vetrov, and Andrew G Wilson. Loss
surfaces, mode connectivity, and fast ensembling of DNNs. In NeurIPS, 2018.
Felix Draxler, Kambis Veschgini, Manfred Salmhofer, and Fred A Hamprecht. Essentially no barriers
in neural network energy landscape. arXiv preprint arXiv:1803.00885, 2018.
Stanislav Fort and Stanislaw Jastrzebski. Large scale structure of neural network loss landscapes. In
NeurIPS, 2019.
Ian J. Goodfellow and Oriol Vinyals. Qualitatively characterizing neural network optimization
problems. CoRR, abs/1412.6544, 2014.
Chunyuan Li, Heerad Farkhoor, Rosanne Liu, and Jason Yosinski. Measuring the intrinsic dimension
of objective landscapes. In ICLR, 2018.
Stanislav Fort and Adam Scherlis. The Goldilocks zone: Towards better understanding of neural
network loss landscapes. In AAAI, 2019.
9
10. Alex Krizhevsky. Learning multiple layers of features from tiny images. 2009.
J. Deng, W. Dong, R. Socher, L.-J. Li, K. Li, and L. Fei-Fei. ImageNet: A Large-Scale Hierarchical
Image Database. In CVPR, 2009.
Kaiming He, Xiangyu Zhang, Shaoqing Ren, and Jian Sun. Deep residual learning for image
recognition. In CVPR, 2016a.
Diederik P Kingma and Jimmy Ba. Adam: A method for stochastic optimization. In ICLR, 2015.
Kaiming He, Xiangyu Zhang, Shaoqing Ren, and Jian Sun. Identity mappings in deep residual
networks. In European conference on computer vision, 2016b.
Dan Hendrycks and Thomas Dietterich. Benchmarking neural network robustness to common
corruptions and perturbations. In ICLR, 2019.
Glenn W Brier. Verification of forecasts expressed in terms of probability. Monthly weather review,
1950.
Yuval Netzer, Tao Wang, Adam Coates, Alessandro Bissacco, Bo Wu, and Andrew Y Ng. Reading
Digits in Natural Images with Unsupervised Feature Learning. In NeurIPS Workshop on Deep
Learning and Unsupervised Feature Learning, 2011.
Laurens van der Maaten and Geoffrey Hinton. Visualizing data using t-SNE. JMLR, 2008.
Ruqi Zhang, Chunyuan Li, Jianyi Zhang, Changyou Chen, and Andrew Gordon Wilson. Cyclical
stochastic gradient mcmc for bayesian deep learning. In International Conference on Learning
Representations, 2020. URL https://openreview.net/forum?id=rkeS1RVtPS.
Wesley J Maddox, Pavel Izmailov, Timur Garipov, Dmitry P Vetrov, and Andrew Gordon Wilson.
A simple baseline for bayesian uncertainty in deep learning. In Advances in Neural Information
Processing Systems, pages 13132–13143, 2019.
Pavel Izmailov, Dmitrii Podoprikhin, Timur Garipov, Dmitry Vetrov, and Andrew Gordon Wilson.
Averaging weights leads to wider optima and better generalization. In UAI, 2018.
Stephan Mandt, Matthew D Hoffman, and David M Blei. Stochastic gradient descent as approximate
Bayesian inference. JMLR, 2017.
10
11. Supplementary Material
A Identical loss does not imply identical functions in prediction space
To make our paper self-contained, we review the literature on loss surfaces and mode connectivity
[Garipov et al., 2018, Draxler et al., 2018, Fort and Jastrzebski, 2019]. We provide visualizations of
the loss surface which confirm the findings of prior work as well as complement them. Figure S1
shows the radial loss landscape (train as well as the validation set) along the directions of two different
optima. The left subplot shows that different trajectories achieve similar values of the loss, and
the right subplot shows the similarity of these functions to their respective optima (in particular
the fraction of labels predicted on which they differ divided by their error rate). While the loss
values from different optima are similar, the functions are different, which confirms that random
initialization leads to different modes in function space.
(a) Accuracy along the radial loss-landscape cut (b) Function-space similarity
Figure S1: Results using MediumCNN on CIFAR-10: Radial loss landscape cut between the origin
and two independent optima and the predictions of models on the same plane.
Next, we construct a low-loss tunnel between different optima using the procedure proposed by Fort
and Jastrzebski [2019], which is a simplification of the procedures proposed in Garipov et al. [2018]
and Draxler et al. [2018]. As shown in Figure S2(a), we start at the linear interpolation point (denoted
by the black line) and reach the closest point on the manifold by minimizing the training loss. The
minima of the training loss are denoted by the yellow line in the manifolds. Figure S2(b) confirms
that the tunnel is indeed low-loss. This also confirms the findings of [Garipov et al., 2018, Fort
and Jastrzebski, 2019] that while solutions along the tunnel have similar loss, they are dissimilar in
function space.
(a) Cartoon illustration (b) Low-loss tunnel
Figure S2: Left: Cartoon illustration showing linear connector (black) along with the optimized
connector which lies on the manifold of low loss solutions. Right: The loss and accuracy in between
two independent optima on a linear path and an optimized path in the weight space.
In order to visualize the 2-dimensional cut through the loss landscape and the associated predictions
along a curved low-loss path, we divide the path into linear segments, and compute the loss and
prediction similarities on a triangle given by this segment on one side and the origin of the weight
space on the other. We perform this operation on each of the linear segments from which the low-loss
path is constructed, and place them next to each other for visualization. Figure S3 visualizes the
loss along the manifold, as well as the similarity to the original optima. Note that the regions
between radial yellow lines consist of segments, and we stitch these segments together in Figure S3.
The accuracy plots show that as we traverse along the low-loss tunnel, the accuracy remains fairly
constant as expected. However, the prediction similarity plot shows that the low-loss tunnel does
not correspond to similar solutions in function space. What it shows is that while the modes are
11
12. (a) Accuracy along the low-loss tunnel (b) Prediction similarity along the low-loss tunnel
Figure S3: Results using MediumCNN on CIFAR-10: Radial loss landscape cut between the origin
and two independent optima along an optimized low-loss connector and function space similarity
(agreement of predictions) to the two optima along the same planes.
connected in terms of accuracy/loss, their functional forms remain distinct and they do not collapse
into a single mode.
B Effect of randomness: random initialization versus random shuffling
Random seed affects both initial parameter values as well the order of shuffling of data points. We
run experiments to decouple the effect of random initialization and shuffling; Figure S4 shows the
results. We observe that both of them provide complementary sources of randomness, with random
initialization being the dominant of the two. As expected, random mini-batch shuffling adds more
randomness at higher learning rates due to gradient noise.
Figure S4: The effect of random initializations and random training batches on the diversity of
predictions. For runs on a GPU, the same initialization and the same training batches (red) do not
lead to the exact same predictions. On a TPU, such runs always learn the same function and have
therefore 0 diversity of predictions.
12
13. C Comparison to cSG-MCMC
Zhang et al. [2020] show that vanilla stochastic gradient Markov Chain Monte Carlo (SGMCMC)
methods do not explore multiple modes in the posterior and instead propose cyclic stochastic gradient
MCMC (cSG-MCMC) to achieve that. We ran a suite of verification experiments to determine
whether the diversity of functions found using the proposed cSG-MCMC algorithm matches that of
independently randomly initialized and trained models.
We used the code published by the authors Zhang et al. [2020] 5
to match exactly the setup of their
paper. We ran cSG-MCMC from 3 random initializations, each for a total of 150 epochs amounting
to 3 cycles of the 50 epoch period learning rate schedule. We used a ResNet-18 and ran experiments
on both CIFAR-10 and CIFAR-100. We measured the function diversity between a) independently
initialized and trained runs, and b) between different cyclic learning rate periods within the same run
of the cSG-MCMC. The latter (b) should be comparable to the former (a) if cSG-MCMC was as
successful as vanilla deep ensembles at producing diverse functions. We show that both for CIFAR-10
and CIFAR-100, vanilla ensembles generate statistically significantly more diverse sets of functions
than cSG-MCMC, as shown in Figure C. While cSG-MCMC is doing well in absolute terms, the
shared initialization for cSG-MCMC training seems to lead to lower diversity than deep ensembles
with multiple random initializations. Another difference between the methods is that individual
members of deep ensemble can be trained in parallel unlike cSG-MCMC.
cSG-MCMC Ensemble
0.850
0.875
0.900
0.925
Normalizeddiversity
ResNet18 on CIFAR-10
cSG-MCMC Ensemble
0.775
0.800
0.825
0.850
Normalizeddiversity
ResNet18 on CIFAR-100
Figure S5: Comparison of function space diversities between the cSG-MCMC (blue) and deep
ensembles (red). The left panel shows the experiments with ResNet-18 on CIFAR-10 and the right
panel shows the experiments on CIFAR-100. In both cases, deep ensembles produced a statistically
significantly more diverse set of functions than cSG-MCMC as measured by our function diversity
metric. The plots show the mean and 1σ confidence intervals based on 4 experiments each.
D Modeling the accuracy – diversity trade off
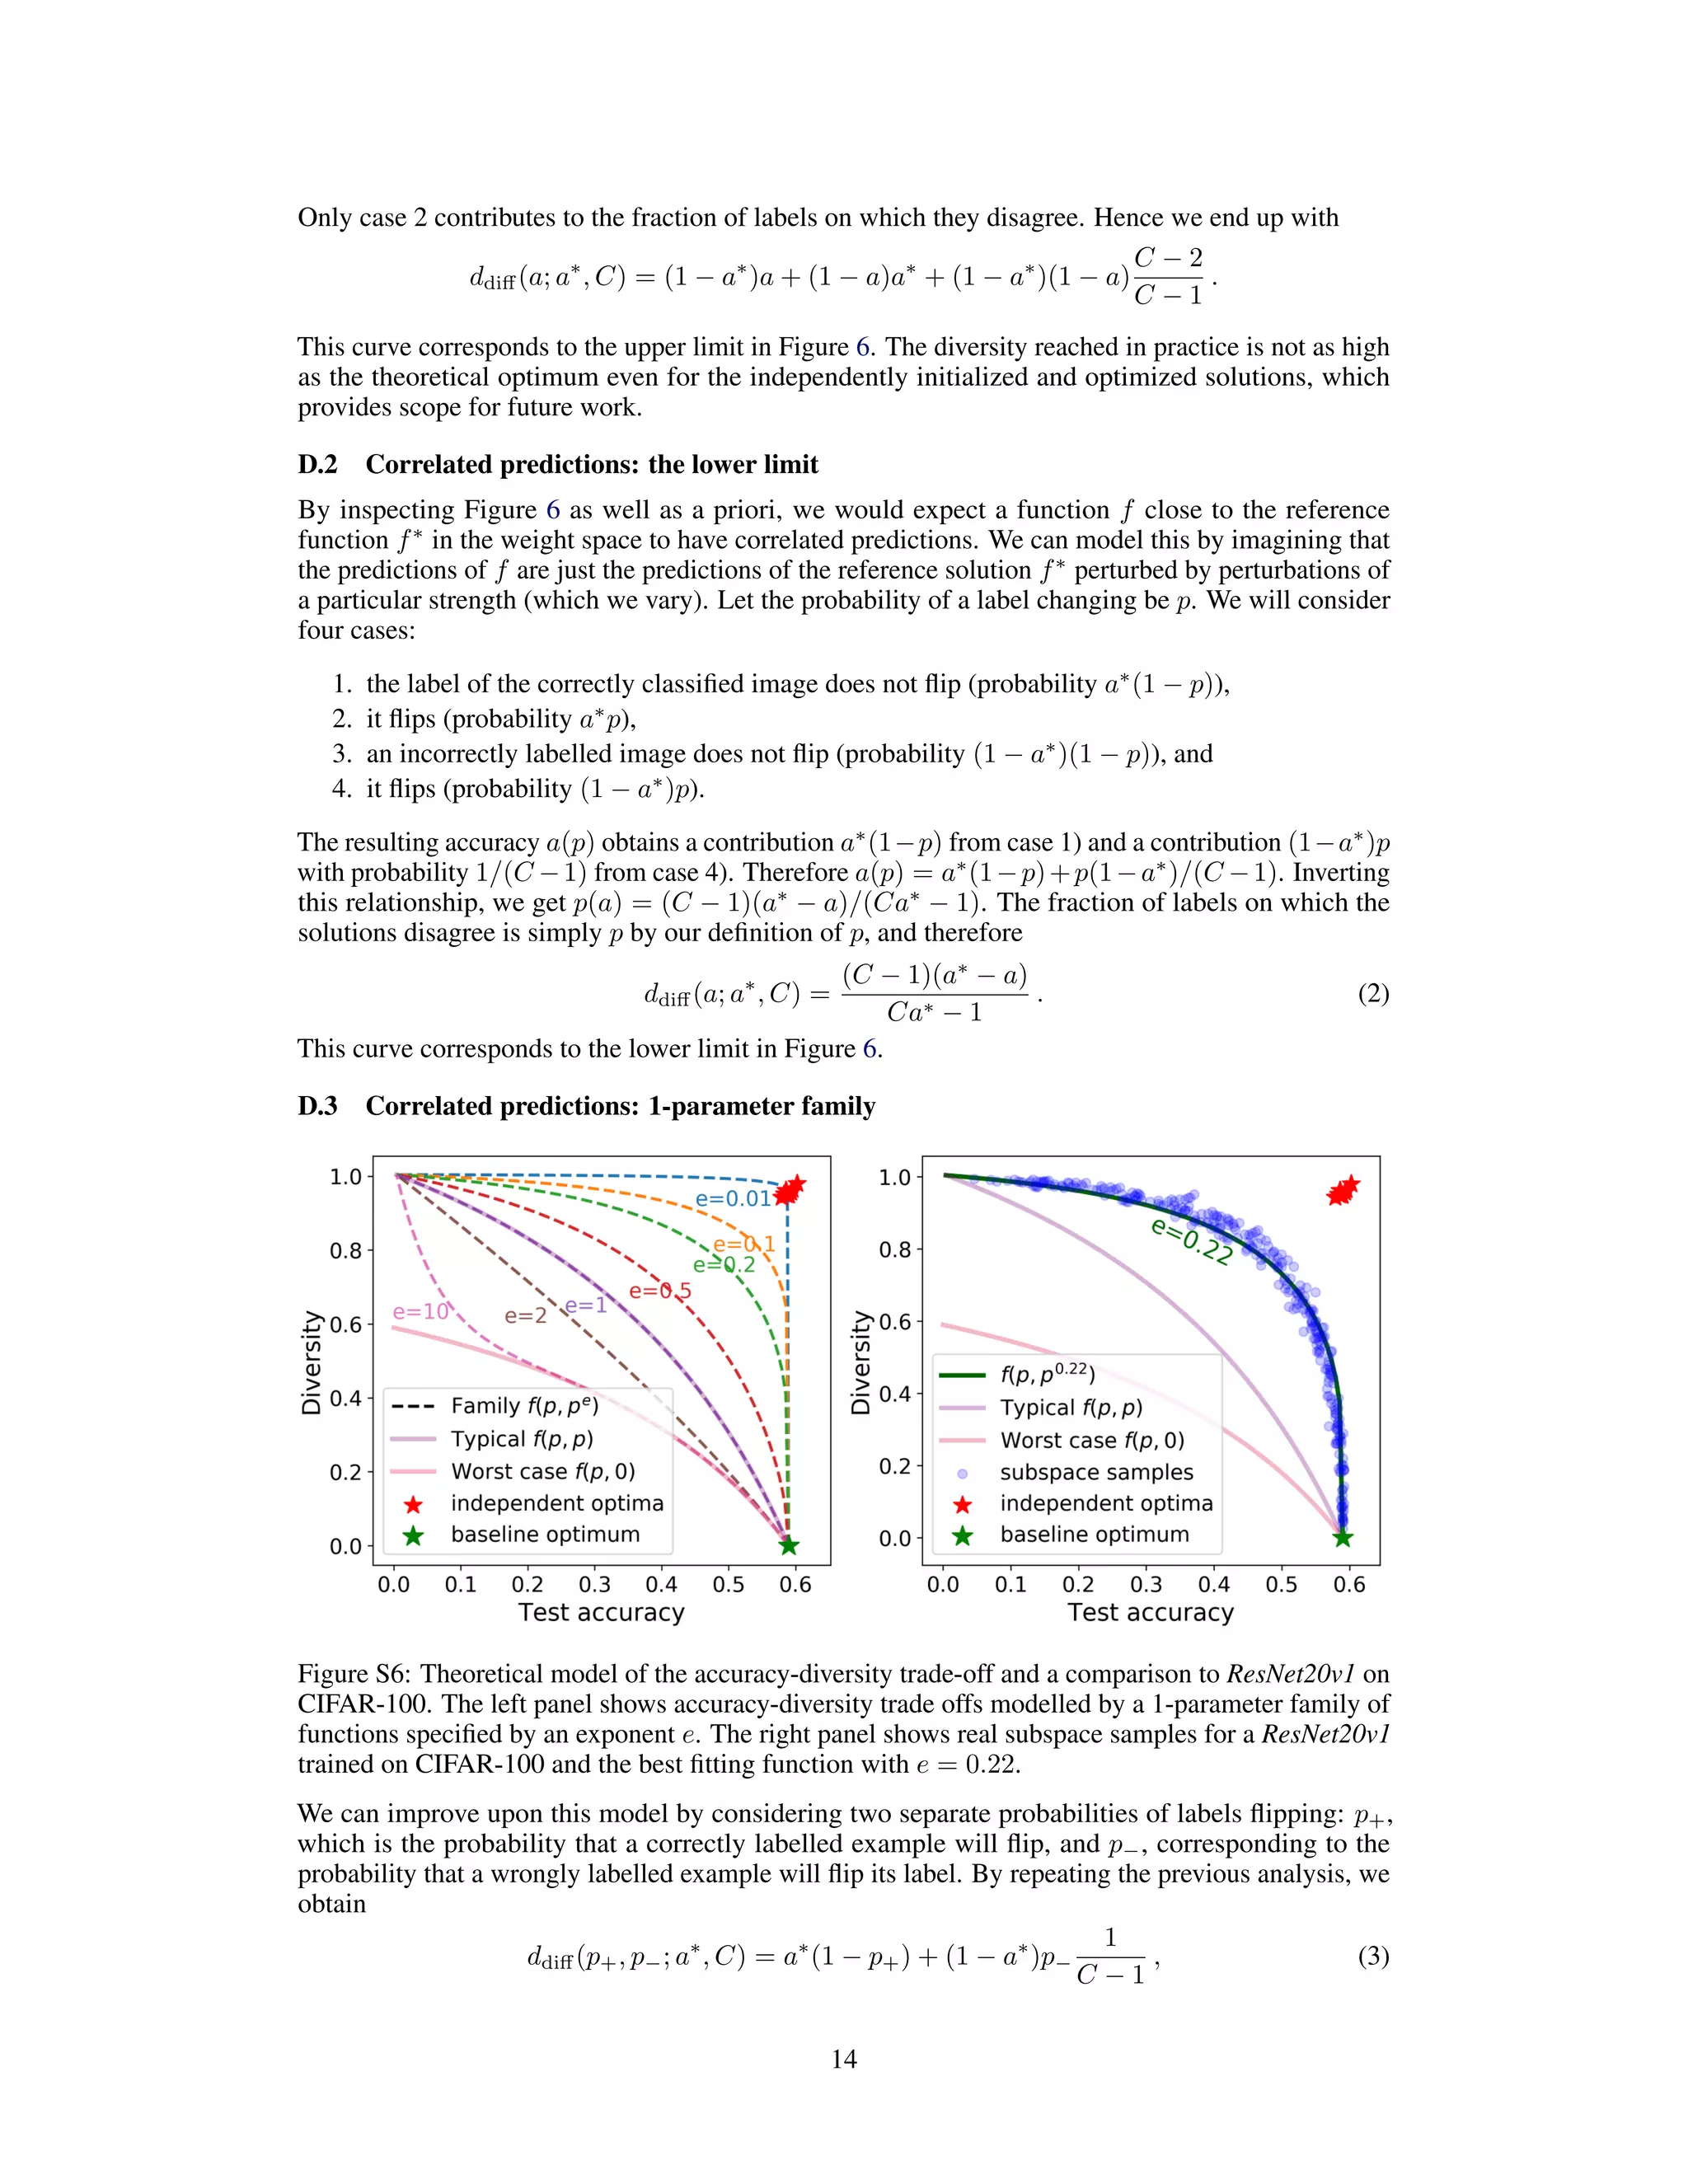
In our diversity–accuracy plots (e.g. Figure 6), subspace samples trade off their accuracy for diversity
in a characteristic way. To better understand where this relationship comes from, we derive several
limiting curves based on an idealized model. We also propose a 1-parameter family of functions that
provide a surprisingly good fit (given the simplicity of the model) to our observation, as shown in
Figure S6.
We will be studying a pair of functions in a C-class problem: the reference solution f∗
of accuracy
a∗
, and another function f of accuracy a.
D.1 Uncorrelated predictions: the best case
The best case scenario is when the predicted labels are uncorrelated with the reference solution’s
labels. On a particular example, the probability that the reference solution got it correctly is a∗
, and
the probability that the new solution got it correctly is a. On those examples, the predictions do not
differ since they both have to be equal to the ground truth label. The probability that the reference
solution is correct on an example while the new solution is wrong is a∗
(1 − a). The probability that
the reference solution is wrong on an example while the new solution is correct is (1 − a∗
)a. On the
examples where both solutions are wrong (probability (1 − a∗
)(1 − a)), there are two cases:
1. the solutions agree (an additional factor of 1/(C − 1)), or
2. the two solutions disagree (an additional factor of (C − 2)/(C − 1)).
5
https://github.com/ruqizhang/csgmcmc
13
14. Only case 2 contributes to the fraction of labels on which they disagree. Hence we end up with
ddiff (a; a∗
, C) = (1 − a∗
)a + (1 − a)a∗
+ (1 − a∗
)(1 − a)
C − 2
C − 1
.
This curve corresponds to the upper limit in Figure 6. The diversity reached in practice is not as high
as the theoretical optimum even for the independently initialized and optimized solutions, which
provides scope for future work.
D.2 Correlated predictions: the lower limit
By inspecting Figure 6 as well as a priori, we would expect a function f close to the reference
function f∗
in the weight space to have correlated predictions. We can model this by imagining that
the predictions of f are just the predictions of the reference solution f∗
perturbed by perturbations of
a particular strength (which we vary). Let the probability of a label changing be p. We will consider
four cases:
1. the label of the correctly classified image does not flip (probability a∗
(1 − p)),
2. it flips (probability a∗
p),
3. an incorrectly labelled image does not flip (probability (1 − a∗
)(1 − p)), and
4. it flips (probability (1 − a∗
)p).
The resulting accuracy a(p) obtains a contribution a∗
(1−p) from case 1) and a contribution (1−a∗
)p
with probability 1/(C −1) from case 4). Therefore a(p) = a∗
(1−p)+p(1−a∗
)/(C −1). Inverting
this relationship, we get p(a) = (C − 1)(a∗
− a)/(Ca∗
− 1). The fraction of labels on which the
solutions disagree is simply p by our definition of p, and therefore
ddiff (a; a∗
, C) =
(C − 1)(a∗
− a)
Ca∗ − 1
. (2)
This curve corresponds to the lower limit in Figure 6.
D.3 Correlated predictions: 1-parameter family
Figure S6: Theoretical model of the accuracy-diversity trade-off and a comparison to ResNet20v1 on
CIFAR-100. The left panel shows accuracy-diversity trade offs modelled by a 1-parameter family of
functions specified by an exponent e. The right panel shows real subspace samples for a ResNet20v1
trained on CIFAR-100 and the best fitting function with e = 0.22.
We can improve upon this model by considering two separate probabilities of labels flipping: p+,
which is the probability that a correctly labelled example will flip, and p−, corresponding to the
probability that a wrongly labelled example will flip its label. By repeating the previous analysis, we
obtain
ddiff (p+, p−; a∗
, C) = a∗
(1 − p+) + (1 − a∗
)p−
1
C − 1
, (3)
14
15. and
a(p+, p−; a∗
, C) = a∗
p+ + (1 − a∗
)p− . (4)
The previously derived lower limit corresponds to the case p+ = p− = p ∈ [0, 1], where the
probability of flipping the correct labels is the same as the probability of flipping the incorrect labels.
The absolute worst case scenario would correspond to the situation where p+ = p, while p− = 0, i.e.
only the correctly labelled examples flip.
We found that tying the two probabilities together via an exponent e as p+ = p and p− = pe
= pe
+
generates a realistic looking trade off between accuracy and diversity. We show the resulting functions
for several values of e in Figure S6. For e < 1, the chance of flipping the wrong label is larger than
that of the correct label, simulating a robustness of the learned solution to perturbations. We found
the closest match to our data provided by e = 0.22.
15