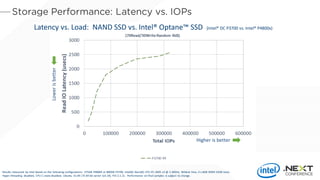
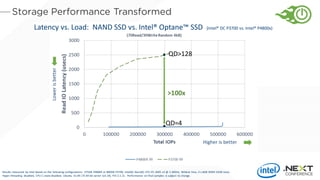
1.5 GB
per day1
3,000 GB
per day2
4,000 GB
per day3
40,000 GB
per day2
1,000,000 GB
per day2
1) http://www.cisco.com/c/en/us/solutions/service-provider/vni-network-traffic-forecast/infographic.html
2) http://www.cisco.com/c/en/us/solutions/collateral/service-provider/global-cloud-index-gci/Cloud_Index_White_Paper.html
3) https://datafloq.com/read/self-driving-cars-create-2-petabytes-data-annually/172
Public cloud annual growth rate through 2019119
%
1. Source: http://www.forbes.com/sites/louiscolumbus/2016/03/13/roundup-of-cloud-computing-forecasts-and-market-estimates-2016/#6c4d3d5c74b0
2. Source: Athena 451 Research, Voice of the Enterprise Q1 2016Queue to core ratio.
45
%
Enterprise IT spending on private cloud in 20182
converged infrastructure adoption in enterprise in 20182
62
%
Ease customer qualifications with a validated solution. Intel SSD + Intel platform is
better together
BringingIntel SSDs to the Intel platformto provideoptimisedand complete solutionsfor
compute,networking and storage.
Compute NetworkStorage
Platform
Performance
Server
Agility
Efficiency
at Scale
Intel® Xeon®
Processor
Intel® Xeon®
Processor
UPI
DDR4 DDR4
PCIe
VMD VMD
ISA-L
SPDK
VROC
Memory Drive
Integrated
Networking
• Faster, and more, cores and inter-processor busses
• Faster memory and faster PCI-e connectivity
• Accelerators, faster media, and storage SW
• Integrated, efficient networking
• Scale with faster storage & memory
• Broad and configurable storage essential portfolio
• Minimise disruptions w/ hardened platform reliability
• Remotely manage secure platforms in more states
• Performant, trusted, highly available storage
Platform
Performance
Server
Agility
Efficiency
at Scale
Higher is better
Lowerisbetter
Results measured by Intel based on the following configurations. 375GB P4800X or 800GB P3700, Intel(R) Xeon(R) CPU E5-2695 v3 @ 2.30GHz, Wildcat Pass, 4 x 8GB DDR4 32GB total,
Hyper-threading disabled, CPU C-state disabled, Ubuntu 15.04 LTS 64 bit server (v3.19), FIO 2.1.11. Performance on final samples is subject to change.
Latency vs. Load: NAND SSD vs. Intel® Optane™ SSD (Intel® DC P3700 vs. Intel® P4800x)
>100x
QD>128
QD=4
Higher is better
Lowerisbetter
Latency vs. Load: NAND SSD vs. Intel® Optane™ SSD (Intel® DC P3700 vs. Intel® P4800x)
Results measured by Intel based on the following configurations. 375GB P4800X or 800GB P3700, Intel(R) Xeon(R) CPU E5-2695 v3 @ 2.30GHz, Wildcat Pass, 4 x 8GB DDR4 32GB total,
Hyper-threading disabled, CPU C-state disabled, Ubuntu 15.04 LTS 64 bit server (v3.19), FIO 2.1.11. Performance on final samples is subject to change.
Higher is better
Lowerisbetter
Applications need IOPs & Latency
Intel® Optane SSDs Provide:
10x latency reduction
< 10usec latency†
100x QoS improvement
< 200usec 99.999th r/w†
Latency vs. Load: NAND SSD vs. Intel® Optane™ SSD (Intel® DC P3700 vs. Intel® P4800x)
† vs. NANDbased SSD
Results measured by Intel based on the following configurations. 375GB P4800X or 800GB P3700, Intel(R) Xeon(R) CPU E5-2695 v3 @ 2.30GHz, Wildcat Pass, 4 x 8GB DDR4 32GB total,
Hyper-threading disabled, CPU C-state disabled, Ubuntu 15.04 LTS 64 bit server (v3.19), FIO 2.1.11. Performance on final samples is subject to change.
Up to 60x better at 99% QoS1
Ideal for critical applications with aggressive latency
requirements
Up to 40x faster response time under workload2
Consistently amazing response time under load
1. Common Configuration - Intel 2U PCSD Server (“Wildcat Pass”), OS CentOS 7.2, kernel 3.10.0-327.el7.x86_64, CPU 2 x Intel® Xeon® E5-2699 v4 @ 2.20GHz (22 cores), RAM 396GB DDR @ 2133MHz. Configuration – Intel® Optane™ SSD DC
P4800X 375GB and Intel® SSD DC P3700 1600GB. QoS – measures 99% QoS under 4K 70-30 workload at QD1 using fio-2.15.
2. Responsiveness defined as averageread latency measured at queue depth 1 during 4k random write workload. Measured using FIO 2.15. Common Configuration - Intel 2U PCSD Server (“Wildcat Pass”), OS CentOS 7.2, kernel 3.10.0-
327.el7.x86_64, CPU 2 x Intel® Xeon® E5-2699 v4 @ 2.20GHz (22 cores), RAM396GB DDR @ 2133MHz. Configuration – Intel® Optane™ SSD DC P4800X 375GB and Intel® SSD DC P3700 1600GB. Latency – Average read latency measured at
QD1 during 4K Random Write operations using fio-2.15. Tests document performance of components on a particular test, in specific systems. Differences in hardware, software, or configuration will affect actual performance.
DRAM
PCIe*
PCIe
Intel® 3D NAND SSDs
Intel®
Optane™ SSD
Fast Storage and Cache
Intel®
Xeon®
‘memory
pool’DRAM
PCIe
Intel® 3D NAND SSDs
Intel® Optane™
SSD
DDR
DDR
PCIe
Extend Memory
Intel®
Xeon®
*Other names and brands may be claimed as the property of others.
Caching and
Fast Storage
Memory
Mainstream
storage
Bigger memory for new insights
from larger working sets
New caching or fast storage for the
most latency sensitive applications
High-performance and massively scalable
storage
Accelerate cache tier and mixed
workloads like database for faster
results and more capacity
DRAM + Intel® Optane™ SSD
with Intel® Memory Drive Technology
+
Intel® Optane™
SSD DC P4800X
Intel® SSD DC
P4600 Series
Intel® SSD DC P4500 Series
Intel® SSD DC P4501 Series
*Other names and brands names may be claimed as the property of others
U.2 7mm
M.2 110mm
U.2 15mm
2TB U.2 15mm Intel® SSD DC P3520
x 24 = 48TB per RU
Available Today
Intel® Xeon® Processors
PCIe* switch
Possible Tomorrow
4TB U.2 7mm Intel® SSD DC P4501
x 48 = 192TB per RU
Intel® Xeon® Processors
PCIe switches
7mm form factor + 4TB capacity
enables up to 4x more capacity
per Rack Unit
Robust PLI with self-test
Select competitor drives conduct self-test under limited
conditions3
Reliability beyond industry norms
High volume manufacturing AFR1 ≤0.3%
Better than JEDEC
data retention and UBER requirements2
1. Annual Failure Rate: Source - Intel. Intel SSD Annualised Fail Rate Report for all of 2015. Intel® SSD DC S3500, S3700, P3700.
2. UBER. Source – JEDEC UBER specifies 10-16. https://www.jedec.org/standards-documents/focus/flash/solid-state-drives. Intel data center SSDs deliver 10-17 UBER.
3. PLI: Source – Intel. Intel® Datacenter Drives provide robust Power Loss Imminent (PLI) circuitry that helps to protect inflight data in the event of power loss. Intel drives monitor the health of the PLI circuitry via a Self Cap
Test using SMART attributes. Samsung PM853T and SM843T drives were checked for capabilities and flags. No PLI monitoring capabilities (e.g. SMART Attributes) were listed in the Samsung drive specification sheet.
Additionally, the drives were tested by powering off a drive and removing one electrolytic (or any other type) capacitor. The drives were then powered up to recollect SMART attribute data to determine is the cap test
detected the removal of the capacitor. The Samsung drives did not detect capacitor removal.
Industry leading end-to-end data protection4
>68xOn average more reliable than others preventing silent data errors4
Massively validated
1000s of drives
1000s of configurations
>5000 workloads
>1M power cycles
Tested 10,000x beyond RDT at Los
Alamos National Lab5
Pervasive validation Beyond industry requirements up to 6 months additional
platform-level validation
9 months
Validation
3-6 months
Pre-validation
1
2 Multi-group
Broad OEM feedback drives improvements
3
4. Silent Data Corruption. Source - Intel. Test performed on Intel® SSD S3x00 drives, Samsung PM853T and SM843T, Micron P400e, Seagate 600 Pro and SanDisk Lightening drives. Drives were exposed to increasing amounts
of radiation. After a drive “hang”, a power cycle was performed to determine whether the drive would re-boot. If a drive re-booted it was read, and data was compared to the tester’s master copy of the up-to-date data that
the drive was expected to contain based on writes the drive had acknowledged as completed prior to the “hang” event. If the drive returned data that differed from the expected data, it was recorded as failing for silent
errors. The annual rate of silent errors was projected from the rate during accelerated testing divided by the acceleration of the beam (see JEDEC standard JESD89A).
18
HCI Solution with
Cache SSDs from Intel® SSD DC P3700
to Intel® SSD DC P4600 and
Capacity SSDs from Intel® SSD DC P3500
to Intel® SSD DC P4500
2x
up to
63%
up to
Increase Storage
Efficiency
Lower Cost/GB
See “Test Configuration and Disclaimers on Slide 22 for moredetailed performancetesting configurations information
Tests documentperformanceofcomponents on a particulartest, in specific systems. Differences in hardware,software, or configuration will affect actual performance.
Moving from 2D NAND to
Intel® 3D NAND SSDs
Using Intel® Integrated
Ethernet X722
w/ iWARP RDMA
Moving from NAND SSD to
Intel® Optane SSD
45%
up to
50%
up to
Lower Latency
Fewer
CPU cycles per IO
HCI Solution w/ iWARP RDMA
vs without RDMA
Bare metal Database Solution
With Intel® Optane SSD DC P4800X
vs Intel® SSD DC P3700
10x
up to
91%
up to
More transactions
per second
at same service level
Lower cost per
transaction
Future Xeon®
Processor
Intel® DIMM
(based on Intel® 3D XPoint™
memory media)
DIMM
(acts in conjunction
with Intel DIMM)
Platform
Performance
Server
Agility
Efficiency
at Scale
HYBRID
ON PREMISE
&
PRIVATE
CLOUD
PUBLIC
CLOUD
• 10 – 30 % - physical
• 70 – 90 % - virtual • ~ 10% servers
Number of users running their container on AWS in 2016160
%
1. Source: https://clusterhq.com/assets/pdfs/state-of-container-usage-june-2016.pdf
2. Multiple choices were allowed
40
%
Number of users running their containers on Internal
infrastructure in 20161
Converged infrastructure seems to be answer to those needs
Platform
Utilization
Workload
Agility
Efficiency
at Scale
VMs vs Containers
Pros:
• Many VMs per server resource
• Easy to provision
• Self-service
• Easy migration, DR, upgrade
Cons:
• Too „fat” in application deployment
• Take some time to be „ready”
Pros:
• Portability of the apps
• Deployment in seconds
• Simplicity
• Easy at scale
Cons:
• Adoption level
• Fragmentation
Persistent
Storage
Persistent
Storage
AHV
Intel®
Xeon®
Network
API
Nutanix
cluster
VM VM VM VM VM VM
Dep.
VM
IaaS
…K8S
wor.
K8S
wor.
K8S
Mas.
K8S
Mas.
K8S
Mas.
PaaS / CaaS
Nutanix
Volume
Plugin 01
1010101101010
1010101010110101010
10101010101101010101010
10101010101101010101010101010
With the Cloud for All initiative, Intel is helping answer this call by
making cloud technology easier to deploy.
An easy path to K8S on NX.
Time to use it !!!
Github offices (photo by) Ariel Zambelich/Wired
Out NOW, get it on:
https://github.com/nutanix/k8s
28
Test Configuration and Disclaimers
Performance tests, such as SYSmark
and MobileMark, are measured using
specific computer systems,
components, software, operations
and functions. Any change to any of
those factors may cause the results
to vary. You should consult other
information and performance tests to
assist you in fully evaluating your
contemplated purchases, including
the performance of that product
when combined with other
products. For more complete
information
visit www.intel.com/benchmarks.
Configuration detail forslide 17
2D NAND to Intel 3D NAND:
System Configuration:4 Node vSAN* Cluster. Per Node configuration:Supermicro* SuperServer 2028U-TN24R4T+ DualIntel® Xeon®
E5-2687Wv4 (12 Core @ 3.0 Ghz), Supermicro* Server Board, 256 GB DDR4 RAM, Boot Drive, 1x Intel® SSD DC S3710 Series (200 GB,
2.5”), vSAN Intel 3D NAND Cluster: VirtualSAN SSDs - 2 Disk Groups comprised of 2x Intel® SSD DC P4600 Series (1.6TB, 2.5” SFF), 8x
Intel® SSD DC P4500 Series (4 TB, 2.5” SFF), vSAN Intel 2D NAND Cluster: Virtual SAN SSDs - 2 Disk Groups comprised of 2x Intel® SSD
DC P3700 Series (800GB, 2.5” SFF), 8x Intel® SSD DC P3500 Series (2 TB, 2.5” SFF), Intel® Ethernet Server Adapter X540-DA2
iWARP RDMa vs no RDMA:
System Configuration: Windows* Server 2016 Datacenter Edition14393.693, 4 server nodes, each using Intel® Server System
S2600WFD, IntegratedIntel® Ethernet x722 Dual port 10Gbps Ethernet*, 2x Intel® Xeon® E5 6148v5 @2.4GHz, 20 cores, 384 GB DDR4-
2133 DRAM, caching drives- 2x Intel® SSD DC P3700 Series (1.6 TB), datadrives- 6x Intel® SSD DC P3500 Series (2 TB) Each node
configured with 3.5TB data store, 20x A3 like VMs each containing60GB OS virtual store and 60GB data virtualstore, running, 4x
Diskspd 2.0.17 in each VM using 1 thread and 32 queues Testing configurationsinclude4kB Random Reads, and 8kB Random 70/30
Read/Write workloads, each with RDMA enabledand RDMA disabled,each at Max Performance, and IOPs fixed per VM This is a
snapshot of network performance with current driver, firmware and silicon stepping. Intel continuesto work on tuning the
performance of integratedIntel Ethernet X722.
Optane vs P3700 for database:
System configuration:Server Intel® Server System R2208WT2YS, 2x Intel® Xeon® E5 2699v4, 384 GB DDR4 DRAM, boot drive- 1x Intel®
SSD S3710 Series (400 GB), databasedrives- 1x Intel® SSD P3700 Series (400 GB) and 1x Intel® Optane™SSD P4800X Series (140 GB
prototype), CentOS 7.2, MySQL Server 5.7.14, Sysbench 0.5 configured for 70/30 Read/Write OLTP transaction split using a 100GB
database. Cost per transactiondetermined by total MSRP for each configuration dividedby the transactionsper second.
29
Legal Notices and Disclaimers
Intel technologies’ features and benefits depend on system configuration and mayrequire enabled hardware, software or service activation. Learn more at
intel.com, or from the OEM or retailer.
No computer system can be absolutely secure.
Tests document performance of components on a particular test, in specific systems. Differences in hardware, software, or configuration will affect actual
performance. Consult other sources of information to evaluate performance as you consider your purchase. For more complete information about performance
and benchmark results, visit http://www.intel.com/performance.
Cost reduction scenarios described are intended as examples of how a given Intel-based product, in the specified circumstances and configurations, mayaffect
future costs and provide cost savings. Circumstances will vary. Intel does not guarantee any costs or cost reduction.
This document contains information on products, services and/or processes in development. All information provided here is subject to change without notice.
Contact your Intel representative to obtain the latest forecast, schedule, specifications and roadmaps.
No license (express or implied, by estoppel or otherwise) to any intellectual property rights is granted by this document.
Intel does not control or audit third-party benchmark data or the web sites referenced in this document. You should visit the referenced web site and confirm
whether referenced data are accurate.
Intel, the Intel logo, Intel Optane and 3D XPoint are trademarks of Intel Corporation in the U.S. and/or other countries. *Other names and brands maybe
claimed as the property of others.
© 2017 Intel Corporation.

Deep Dive On Intel Optane SSDs And New Server Platforms

  • 2.
    1.5 GB per day1 3,000GB per day2 4,000 GB per day3 40,000 GB per day2 1,000,000 GB per day2 1) http://www.cisco.com/c/en/us/solutions/service-provider/vni-network-traffic-forecast/infographic.html 2) http://www.cisco.com/c/en/us/solutions/collateral/service-provider/global-cloud-index-gci/Cloud_Index_White_Paper.html 3) https://datafloq.com/read/self-driving-cars-create-2-petabytes-data-annually/172
  • 3.
    Public cloud annualgrowth rate through 2019119 % 1. Source: http://www.forbes.com/sites/louiscolumbus/2016/03/13/roundup-of-cloud-computing-forecasts-and-market-estimates-2016/#6c4d3d5c74b0 2. Source: Athena 451 Research, Voice of the Enterprise Q1 2016Queue to core ratio. 45 % Enterprise IT spending on private cloud in 20182 converged infrastructure adoption in enterprise in 20182 62 %
  • 4.
    Ease customer qualificationswith a validated solution. Intel SSD + Intel platform is better together BringingIntel SSDs to the Intel platformto provideoptimisedand complete solutionsfor compute,networking and storage. Compute NetworkStorage
  • 5.
    Platform Performance Server Agility Efficiency at Scale Intel® Xeon® Processor Intel®Xeon® Processor UPI DDR4 DDR4 PCIe VMD VMD ISA-L SPDK VROC Memory Drive Integrated Networking
  • 6.
    • Faster, andmore, cores and inter-processor busses • Faster memory and faster PCI-e connectivity • Accelerators, faster media, and storage SW • Integrated, efficient networking • Scale with faster storage & memory • Broad and configurable storage essential portfolio • Minimise disruptions w/ hardened platform reliability • Remotely manage secure platforms in more states • Performant, trusted, highly available storage Platform Performance Server Agility Efficiency at Scale
  • 7.
    Higher is better Lowerisbetter Resultsmeasured by Intel based on the following configurations. 375GB P4800X or 800GB P3700, Intel(R) Xeon(R) CPU E5-2695 v3 @ 2.30GHz, Wildcat Pass, 4 x 8GB DDR4 32GB total, Hyper-threading disabled, CPU C-state disabled, Ubuntu 15.04 LTS 64 bit server (v3.19), FIO 2.1.11. Performance on final samples is subject to change. Latency vs. Load: NAND SSD vs. Intel® Optane™ SSD (Intel® DC P3700 vs. Intel® P4800x)
  • 8.
    >100x QD>128 QD=4 Higher is better Lowerisbetter Latencyvs. Load: NAND SSD vs. Intel® Optane™ SSD (Intel® DC P3700 vs. Intel® P4800x) Results measured by Intel based on the following configurations. 375GB P4800X or 800GB P3700, Intel(R) Xeon(R) CPU E5-2695 v3 @ 2.30GHz, Wildcat Pass, 4 x 8GB DDR4 32GB total, Hyper-threading disabled, CPU C-state disabled, Ubuntu 15.04 LTS 64 bit server (v3.19), FIO 2.1.11. Performance on final samples is subject to change.
  • 9.
    Higher is better Lowerisbetter Applicationsneed IOPs & Latency Intel® Optane SSDs Provide: 10x latency reduction < 10usec latency† 100x QoS improvement < 200usec 99.999th r/w† Latency vs. Load: NAND SSD vs. Intel® Optane™ SSD (Intel® DC P3700 vs. Intel® P4800x) † vs. NANDbased SSD Results measured by Intel based on the following configurations. 375GB P4800X or 800GB P3700, Intel(R) Xeon(R) CPU E5-2695 v3 @ 2.30GHz, Wildcat Pass, 4 x 8GB DDR4 32GB total, Hyper-threading disabled, CPU C-state disabled, Ubuntu 15.04 LTS 64 bit server (v3.19), FIO 2.1.11. Performance on final samples is subject to change.
  • 10.
    Up to 60xbetter at 99% QoS1 Ideal for critical applications with aggressive latency requirements Up to 40x faster response time under workload2 Consistently amazing response time under load 1. Common Configuration - Intel 2U PCSD Server (“Wildcat Pass”), OS CentOS 7.2, kernel 3.10.0-327.el7.x86_64, CPU 2 x Intel® Xeon® E5-2699 v4 @ 2.20GHz (22 cores), RAM 396GB DDR @ 2133MHz. Configuration – Intel® Optane™ SSD DC P4800X 375GB and Intel® SSD DC P3700 1600GB. QoS – measures 99% QoS under 4K 70-30 workload at QD1 using fio-2.15. 2. Responsiveness defined as averageread latency measured at queue depth 1 during 4k random write workload. Measured using FIO 2.15. Common Configuration - Intel 2U PCSD Server (“Wildcat Pass”), OS CentOS 7.2, kernel 3.10.0- 327.el7.x86_64, CPU 2 x Intel® Xeon® E5-2699 v4 @ 2.20GHz (22 cores), RAM396GB DDR @ 2133MHz. Configuration – Intel® Optane™ SSD DC P4800X 375GB and Intel® SSD DC P3700 1600GB. Latency – Average read latency measured at QD1 during 4K Random Write operations using fio-2.15. Tests document performance of components on a particular test, in specific systems. Differences in hardware, software, or configuration will affect actual performance.
  • 11.
    DRAM PCIe* PCIe Intel® 3D NANDSSDs Intel® Optane™ SSD Fast Storage and Cache Intel® Xeon® ‘memory pool’DRAM PCIe Intel® 3D NAND SSDs Intel® Optane™ SSD DDR DDR PCIe Extend Memory Intel® Xeon® *Other names and brands may be claimed as the property of others.
  • 12.
    Caching and Fast Storage Memory Mainstream storage Biggermemory for new insights from larger working sets New caching or fast storage for the most latency sensitive applications High-performance and massively scalable storage Accelerate cache tier and mixed workloads like database for faster results and more capacity DRAM + Intel® Optane™ SSD with Intel® Memory Drive Technology + Intel® Optane™ SSD DC P4800X Intel® SSD DC P4600 Series Intel® SSD DC P4500 Series Intel® SSD DC P4501 Series *Other names and brands names may be claimed as the property of others U.2 7mm M.2 110mm U.2 15mm
  • 13.
    2TB U.2 15mmIntel® SSD DC P3520 x 24 = 48TB per RU Available Today Intel® Xeon® Processors PCIe* switch Possible Tomorrow 4TB U.2 7mm Intel® SSD DC P4501 x 48 = 192TB per RU Intel® Xeon® Processors PCIe switches 7mm form factor + 4TB capacity enables up to 4x more capacity per Rack Unit
  • 14.
    Robust PLI withself-test Select competitor drives conduct self-test under limited conditions3 Reliability beyond industry norms High volume manufacturing AFR1 ≤0.3% Better than JEDEC data retention and UBER requirements2 1. Annual Failure Rate: Source - Intel. Intel SSD Annualised Fail Rate Report for all of 2015. Intel® SSD DC S3500, S3700, P3700. 2. UBER. Source – JEDEC UBER specifies 10-16. https://www.jedec.org/standards-documents/focus/flash/solid-state-drives. Intel data center SSDs deliver 10-17 UBER. 3. PLI: Source – Intel. Intel® Datacenter Drives provide robust Power Loss Imminent (PLI) circuitry that helps to protect inflight data in the event of power loss. Intel drives monitor the health of the PLI circuitry via a Self Cap Test using SMART attributes. Samsung PM853T and SM843T drives were checked for capabilities and flags. No PLI monitoring capabilities (e.g. SMART Attributes) were listed in the Samsung drive specification sheet. Additionally, the drives were tested by powering off a drive and removing one electrolytic (or any other type) capacitor. The drives were then powered up to recollect SMART attribute data to determine is the cap test detected the removal of the capacitor. The Samsung drives did not detect capacitor removal.
  • 15.
    Industry leading end-to-enddata protection4 >68xOn average more reliable than others preventing silent data errors4 Massively validated 1000s of drives 1000s of configurations >5000 workloads >1M power cycles Tested 10,000x beyond RDT at Los Alamos National Lab5 Pervasive validation Beyond industry requirements up to 6 months additional platform-level validation 9 months Validation 3-6 months Pre-validation 1 2 Multi-group Broad OEM feedback drives improvements 3 4. Silent Data Corruption. Source - Intel. Test performed on Intel® SSD S3x00 drives, Samsung PM853T and SM843T, Micron P400e, Seagate 600 Pro and SanDisk Lightening drives. Drives were exposed to increasing amounts of radiation. After a drive “hang”, a power cycle was performed to determine whether the drive would re-boot. If a drive re-booted it was read, and data was compared to the tester’s master copy of the up-to-date data that the drive was expected to contain based on writes the drive had acknowledged as completed prior to the “hang” event. If the drive returned data that differed from the expected data, it was recorded as failing for silent errors. The annual rate of silent errors was projected from the rate during accelerated testing divided by the acceleration of the beam (see JEDEC standard JESD89A).
  • 16.
    18 HCI Solution with CacheSSDs from Intel® SSD DC P3700 to Intel® SSD DC P4600 and Capacity SSDs from Intel® SSD DC P3500 to Intel® SSD DC P4500 2x up to 63% up to Increase Storage Efficiency Lower Cost/GB See “Test Configuration and Disclaimers on Slide 22 for moredetailed performancetesting configurations information Tests documentperformanceofcomponents on a particulartest, in specific systems. Differences in hardware,software, or configuration will affect actual performance. Moving from 2D NAND to Intel® 3D NAND SSDs Using Intel® Integrated Ethernet X722 w/ iWARP RDMA Moving from NAND SSD to Intel® Optane SSD 45% up to 50% up to Lower Latency Fewer CPU cycles per IO HCI Solution w/ iWARP RDMA vs without RDMA Bare metal Database Solution With Intel® Optane SSD DC P4800X vs Intel® SSD DC P3700 10x up to 91% up to More transactions per second at same service level Lower cost per transaction
  • 17.
    Future Xeon® Processor Intel® DIMM (basedon Intel® 3D XPoint™ memory media) DIMM (acts in conjunction with Intel DIMM)
  • 18.
  • 20.
    HYBRID ON PREMISE & PRIVATE CLOUD PUBLIC CLOUD • 10– 30 % - physical • 70 – 90 % - virtual • ~ 10% servers
  • 21.
    Number of usersrunning their container on AWS in 2016160 % 1. Source: https://clusterhq.com/assets/pdfs/state-of-container-usage-june-2016.pdf 2. Multiple choices were allowed 40 % Number of users running their containers on Internal infrastructure in 20161 Converged infrastructure seems to be answer to those needs
  • 22.
    Platform Utilization Workload Agility Efficiency at Scale VMs vsContainers Pros: • Many VMs per server resource • Easy to provision • Self-service • Easy migration, DR, upgrade Cons: • Too „fat” in application deployment • Take some time to be „ready” Pros: • Portability of the apps • Deployment in seconds • Simplicity • Easy at scale Cons: • Adoption level • Fragmentation
  • 23.
    Persistent Storage Persistent Storage AHV Intel® Xeon® Network API Nutanix cluster VM VM VMVM VM VM Dep. VM IaaS …K8S wor. K8S wor. K8S Mas. K8S Mas. K8S Mas. PaaS / CaaS Nutanix Volume Plugin 01 1010101101010 1010101010110101010 10101010101101010101010 10101010101101010101010101010 With the Cloud for All initiative, Intel is helping answer this call by making cloud technology easier to deploy.
  • 24.
    An easy pathto K8S on NX. Time to use it !!! Github offices (photo by) Ariel Zambelich/Wired Out NOW, get it on: https://github.com/nutanix/k8s
  • 26.
    28 Test Configuration andDisclaimers Performance tests, such as SYSmark and MobileMark, are measured using specific computer systems, components, software, operations and functions. Any change to any of those factors may cause the results to vary. You should consult other information and performance tests to assist you in fully evaluating your contemplated purchases, including the performance of that product when combined with other products. For more complete information visit www.intel.com/benchmarks. Configuration detail forslide 17 2D NAND to Intel 3D NAND: System Configuration:4 Node vSAN* Cluster. Per Node configuration:Supermicro* SuperServer 2028U-TN24R4T+ DualIntel® Xeon® E5-2687Wv4 (12 Core @ 3.0 Ghz), Supermicro* Server Board, 256 GB DDR4 RAM, Boot Drive, 1x Intel® SSD DC S3710 Series (200 GB, 2.5”), vSAN Intel 3D NAND Cluster: VirtualSAN SSDs - 2 Disk Groups comprised of 2x Intel® SSD DC P4600 Series (1.6TB, 2.5” SFF), 8x Intel® SSD DC P4500 Series (4 TB, 2.5” SFF), vSAN Intel 2D NAND Cluster: Virtual SAN SSDs - 2 Disk Groups comprised of 2x Intel® SSD DC P3700 Series (800GB, 2.5” SFF), 8x Intel® SSD DC P3500 Series (2 TB, 2.5” SFF), Intel® Ethernet Server Adapter X540-DA2 iWARP RDMa vs no RDMA: System Configuration: Windows* Server 2016 Datacenter Edition14393.693, 4 server nodes, each using Intel® Server System S2600WFD, IntegratedIntel® Ethernet x722 Dual port 10Gbps Ethernet*, 2x Intel® Xeon® E5 6148v5 @2.4GHz, 20 cores, 384 GB DDR4- 2133 DRAM, caching drives- 2x Intel® SSD DC P3700 Series (1.6 TB), datadrives- 6x Intel® SSD DC P3500 Series (2 TB) Each node configured with 3.5TB data store, 20x A3 like VMs each containing60GB OS virtual store and 60GB data virtualstore, running, 4x Diskspd 2.0.17 in each VM using 1 thread and 32 queues Testing configurationsinclude4kB Random Reads, and 8kB Random 70/30 Read/Write workloads, each with RDMA enabledand RDMA disabled,each at Max Performance, and IOPs fixed per VM This is a snapshot of network performance with current driver, firmware and silicon stepping. Intel continuesto work on tuning the performance of integratedIntel Ethernet X722. Optane vs P3700 for database: System configuration:Server Intel® Server System R2208WT2YS, 2x Intel® Xeon® E5 2699v4, 384 GB DDR4 DRAM, boot drive- 1x Intel® SSD S3710 Series (400 GB), databasedrives- 1x Intel® SSD P3700 Series (400 GB) and 1x Intel® Optane™SSD P4800X Series (140 GB prototype), CentOS 7.2, MySQL Server 5.7.14, Sysbench 0.5 configured for 70/30 Read/Write OLTP transaction split using a 100GB database. Cost per transactiondetermined by total MSRP for each configuration dividedby the transactionsper second.
  • 27.
    29 Legal Notices andDisclaimers Intel technologies’ features and benefits depend on system configuration and mayrequire enabled hardware, software or service activation. Learn more at intel.com, or from the OEM or retailer. No computer system can be absolutely secure. Tests document performance of components on a particular test, in specific systems. Differences in hardware, software, or configuration will affect actual performance. Consult other sources of information to evaluate performance as you consider your purchase. For more complete information about performance and benchmark results, visit http://www.intel.com/performance. Cost reduction scenarios described are intended as examples of how a given Intel-based product, in the specified circumstances and configurations, mayaffect future costs and provide cost savings. Circumstances will vary. Intel does not guarantee any costs or cost reduction. This document contains information on products, services and/or processes in development. All information provided here is subject to change without notice. Contact your Intel representative to obtain the latest forecast, schedule, specifications and roadmaps. No license (express or implied, by estoppel or otherwise) to any intellectual property rights is granted by this document. Intel does not control or audit third-party benchmark data or the web sites referenced in this document. You should visit the referenced web site and confirm whether referenced data are accurate. Intel, the Intel logo, Intel Optane and 3D XPoint are trademarks of Intel Corporation in the U.S. and/or other countries. *Other names and brands maybe claimed as the property of others. © 2017 Intel Corporation.