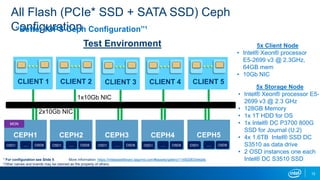
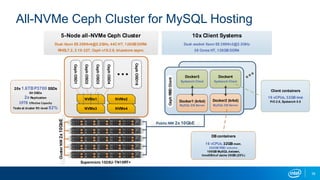
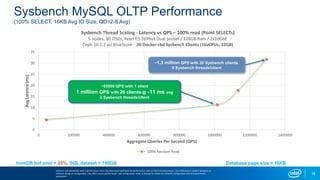
3. Agenda
• Introduction, Ceph at Intel
• All-flash Ceph configurations and benchmark data
• OEMs/ISVs/Intel Ceph Reference Architects/Recipes
• Future Ceph* with Intel NVM Technologies
3D XpointTM and 3D NAND SSD
• Summary
3*Other names and brands may be claimed as the property of others.
4. 4
Acknowledgements
This is team work.
Thanks for the contributions of Intel Team:
PRC team: Jian Zhang, Yuan Zhou, Haodong Tang, Jianpeng Ma, Ning Li
US team: Daniel Ferber, Tushar Gohad, Orlando Moreno, Anjaneya Chagam
6. 6
Ceph at Intel – A brief introduction
Optimize for Intel® platforms, flash and networking
• Compression, Encryption hardware offloads (QAT & SOCs)
• PMStore (for 3D XPoint DIMMs)
• RBD caching and Cache tiering with NVM
• IA optimized storage libraries to reduce latency (ISA-L, SPDK)
Performance profiling, analysis and community contributions
• All flash workload profiling and latency analysis, performance portal http://01.org/cephperf
• Streaming, Database and Analytics workload driven optimizations
Ceph enterprise usages and hardening
• Manageability (Virtual Storage Manager)
• Multi Data Center clustering (e.g., async mirroring)
End Customer POCs with focus on broad industry influence
• CDN, Cloud DVR, Video Surveillance, Ceph Cloud Services, Analytics
• Working with 50+ customers to help them enabling Ceph based storage solutions
POCs
Ready to use IA, Intel NVM optimized systems & solutions from OEMs & ISVs
• Ready to use IA, Intel NVM optimized systems & solutions from OEMs & ISVs
• Intel system configurations, white papers, case studies
• Industry events coverage
Go to
market
Intel® Storage
Acceleration Library
(Intel® ISA-L)
Intel® Storage Performance
Development Kit (Intel® SPDK)
Intel® Cache Acceleration
Software (Intel® CAS)
Virtual Storage Manager Ce-Tune Ceph Profiler
7. 7
Intel Ceph Contribution Timeline
2014 2015 2016
* Right Edge of box indicates approximate release date
New Key/Value Store
Backend (rocksdb)
Giant* Hammer Infernalis Jewel
CRUSH Placement
Algorithm improvements
(straw2 bucket type)
Bluestore Backend
Optimizations for NVM
Bluestore SPDK
Optimizations
RADOS I/O Hinting
(35% better EC Write erformance)
Cache-tiering with SSDs
(Write support)
PMStore
(NVM-optimized backend
based on libpmem)
RGW, Bluestore
Compression, Encryption
(w/ ISA-L, QAT backend)
Virtual Storage Manager
(VSM) Open Sourced
CeTune
Open Sourced
Erasure Coding
support with ISA-L
Cache-tiering with SSDs
(Read support)
Client-side Block Cache
(librbd)
11. Suggested Configurations for Ceph* Storage Node
Standard/good (baseline):
Use cases/Applications: that need high capacity storage with high
throughput performance
NVMe*/PCIe* SSD for Journal + Caching, HDDs as OSD data drive
Example: 1x 1.6TB Intel® SSD DC P3700 as Journal + Intel® Cache
Acceleration Software (Intel® CAS) + 12 HDDs
Better IOPS
Use cases/Applications: that need higher performance especially for
throughput, IOPS and SLAs with medium storage capacity requirements
NVMe/PCIe SSD as Journal, no caching, High capacity SATA SSD for
data drive
Example: 1x 800GB Intel® SSD DC P3700 + 4 to 6x 1.6TB DC S3510
Best Performance
Use cases/Applications: that need highest performance (throughput
and IOPS) and low latency.
All NVMe/PCIe SSDs
Example: 4 to 6 x 2TB Intel SSD DC P3700 Series
More Information: https://intelassetlibrary.tagcmd.com/#assets/gallery/11492083/details
*Other names and brands may be claimed as the property of others.
11
Ceph* storage node --Good
CPU Intel(R) Xeon(R) CPU E5-2650v3
Memory 64 GB
NIC 10GbE
Disks 1x 1.6TB P3700 + 12 x 4TB HDDs (1:12 ratio)
P3700 as Journal and caching
Caching software Intel(R) CAS 3.0, option: Intel(R) RSTe/MD4.3
Ceph* Storage node --Better
CPU Intel(R) Xeon(R) CPU E5-2690
Memory 128 GB
NIC Duel 10GbE
Disks 1x Intel(R) DC P3700(800G) + 4x Intel(R) DC S3510 1.6TB
Ceph* Storage node --Best
CPU Intel(R) Xeon(R) CPU E5-2699v3
Memory >= 128 GB
NIC 2x 40GbE, 4x dual 10GbE
Disks 4 to 6 x Intel® DC P3700 2TB
12. 12
All Flash (PCIe* SSD + SATA SSD) Ceph
Configuration
2x10Gb NIC
Test Environment
CEPH1
MON
OSD1 OSD8…
FIO FIO
CLIENT 1
1x10Gb NIC
.
FIO FIO
CLIENT 2
FIO FIO
CLIENT 3
FIO FIO
CLIENT 4
FIO FIO
CLIENT 5
CEPH2
OSD1 OSD8…
CEPH3
OSD1 OSD8…
CEPH4
OSD1 OSD8…
CEPH5
OSD1 OSD8…
“Better IOPS Ceph Configuration”¹
More Information: https://intelassetlibrary.tagcmd.com/#assets/gallery/11492083/details
*Other names and brands may be claimed as the property of others.
¹ For configuration see Slide 5
5x Client Node
• Intel® Xeon® processor
E5-2699 v3 @ 2.3GHz,
64GB mem
• 10Gb NIC
5x Storage Node
• Intel® Xeon® processor E5-
2699 v3 @ 2.3 GHz
• 128GB Memory
• 1x 1T HDD for OS
• 1x Intel® DC P3700 800G
SSD for Journal (U.2)
• 4x 1.6TB Intel® SSD DC
S3510 as data drive
• 2 OSD instances one each
Intel® DC S3510 SSD
13. 13
Ceph* on All Flash Array
--Tuning and optimization efforts
• Up to 16x performance improvement for 4K random read, peak throughput
1.08M IOPS
• Up to 7.6x performance improvement for 4K random write, 140K IOPS
4K Random Read
Tunings
4K Random Write
Tunings
Default Single OSD Single OSD
Tuning-1 2 OSD instances per SSD 2 OSD instances per SSD
Tuning-2 Tuning1 + debug=0 Tuning2+Debug 0
Tuning-3 Tuning2 + jemalloc
tuning3+ op_tracker off, tuning fd
cache
Tuning-4 Tuning3 + read_ahead_size=16 Tuning4+jemalloc
Tuning-5 Tuning4 + osd_op_thread=32 Tuning4 + Rocksdb to store omap
Tuning-6 Tuning5 + rbd_op_thread=4 N/A
-
2.00
4.00
6.00
8.00
10.00
12.00
14.00
16.00
18.00
Default Tuning-1 Tuning-2 Tuning-3 Tuning-4 Tuning-5 Tuning-6
Normalized
4K random Read/Write Tunings
4K Random Read 4K random write
Performance numbers are Intel Internal estimates
For more complete information about performance and benchmark results, visit www.intel.com/benchmarks
Intel and Intel logos are trademarks of Intel Corporation or its subsidiaries in the U.S. and/or other countries
14. 14
Ceph* on All Flash Array
--Tuning and optimization efforts
1.08M IOPS for 4K random read, 144K IOPS for 4K random write with tunings
and optimizations
1
2
4
8
16
32
64
128
0 200000 400000 600000 800000 1000000 1200000 1400000
LATENCY(MS)
IOPS
RANDOM READ PERFORMANCE
RBD # SCALE TEST
4K Rand.R 8K Rand.R 16K Rand.R 64K Rand.R
63K 64k Random Read
IOPS @ 40ms
300K 16k Random
Read IOPS @ 10 ms
1.08M 4k Random
Read IOPS @ 3.4ms500K 8k Random
Read IOPS @ 8.8ms
0
2
4
6
8
10
0 20000 40000 60000 80000 100000 120000 140000 160000
LATENCY(MS)
IOPS
RANDOM WRITE PERFORMANCE
RBD # SCALE TEST
4K Rand.W 8K Rand.w 16K Rand.W 64K Rand.W
23K 64k Random Write
IOPS @ 2.6ms
88K 16kRandom Write
IOPS @ 2.7ms
132K 8k Random Write
IOPS @ 4.1ms
144K 4kRandom Write
IOPS @ 4.3ms
Excellent random read performance and Acceptable random write performance
Performance numbers are Intel Internal estimates
For more complete information about performance and benchmark results, visit www.intel.com/benchmarks
Intel and Intel logos are trademarks of Intel Corporation or its subsidiaries in the U.S. and/or other countries
15. Ceph* on All Flash Array
--Ceph*: SSD Cluster vs. HDD Cluster
• Both journal on PCI Express*/NVM Express* SSD
• 4K random write, need ~ 58x HDD Cluster (~ 2320 HDDs) to
get same performance
• 4K random read, need ~ 175x HDD Cluster (~ 7024 HDDs)
to get the same performance
ALL SSD Ceph* helps provide excellent TCO (both Capx and Opex), not only performance but
also space, Power, Fail rate, etc.
Client Node
• 5 nodes with Intel® Xeon® processor E5-2699 v3 @ 2.30GHz,
64GB memory
• OS : Ubuntu* Trusty
Storage Node
• 5 nodes with Intel® Xeon® processor E5-2699 v3 @ 2.30GHz,
128GB memory
• Ceph* Version : 9.2.0, OS : Ubuntu* Trusty
• 1 x Intel(R) DC P3700 SSDs for Journal per node
Cluster difference:
SSD cluster : 4 x Intel(R) DC S3510 1.6TB for OSD per node
HDD cluster : 10 x SATA 7200RPM HDDs as OSD per node
15
0
50
100
150
200
4K Rand.W 4K Rand.R
Normalized
Performance Comparison
HDD SSD
~ 58.2
~175.6
Performance numbers are Intel Internal estimates
For more complete information about performance and benchmark results, visit www.intel.com/benchmarks
Intel and Intel logos are trademarks of Intel Corporation or its subsidiaries in the U.S. and/or other countries
16. 16
All-NVMe Ceph Cluster for MySQL Hosting
Supermicro 1028U-TN10RT+
NVMe2
NVMe3 NVMe4
CephOSD1
CephOSD2
CephOSD3
CephOSD4
CephOSD16
5-Node all-NVMe Ceph Cluster
Dual-Xeon E5 2699v4@2.2GHz, 44C HT, 128GBDDR4
RHEL7.2, 3.10-327, Ceph v10.2.0, bluestore async
ClusterNW2x10GbE
10x Client Systems
Dual-socket Xeon E5 2699v3@2.3GHz
36 Cores HT, 128GB DDR4
Public NW 2x 10GbE
Docker3
Sysbench Client
Docker4
Sysbench Client
DBcontainers
16 vCPUs, 32GB mem,
200GB RBD volume,
100GB MySQL dataset,
InnoDBbuf cache 25GB (25%)
CephRBDClient
Docker1 (krbd)
MySQL DB Server
NVMe1
Client containers
16 vCPUs, 32GB RAM
FIO 2.8, Sysbench 0.5Docker2 (krbd)
MySQL DB Server
20x 1.6TBP3700 SSDs
80 OSDs
2x Replication
19TB Effective Capacity
Tests at cluster fill-level 82%
17. FIO 4K Random Read/Write Performance and Latency
Software and workloads used in performance tests may have been optimized for performance only on Intel microprocessors. Any difference in system hardware or
software design or configuration may affect actual performance. See configuration slides in backup for details on software configuration and test benchmark
parameters.
0
1
2
3
4
5
6
7
8
9
10
11
12
0 200000 400000 600000 800000 1000000 1200000 1400000 1600000 1800000
AverageLatency(ms)
IOPS
IODepth Scaling - Latency vs IOPS - Read, Write, and 70/30 4K Random Mix
5 nodes, 80 OSDs, Xeon E5 2699v4 Dual Socket / 128GB Ram / 2x10GbE
Ceph 10.2.1 w/ BlueStore. 6x RBD FIO Clients
100% Rand Read 100% Rand Write 70% Rand Read
~1.4M 4k Random Read IOPS
@~1 ms avg
~220k 4k Random Write IOPS
@~5 ms avg
~560k 70/30% (OLTP)
Random IOPS @~3 ms avg ~1.6M 4k Random Read IOPS
@~2.2 ms avg
First Ceph cluster to break ~1.4 Million 4K random IOPS, ~1ms response time in 5U
17
18. Sysbench MySQL OLTP Performance
(100% SELECT, 16KB Avg IO Size, QD=2-8 Avg)
InnoDB buf pool = 25%, SQL dataset = 100GB
0
5
10
15
20
25
30
35
0 200000 400000 600000 800000 1000000 1200000 1400000
AvgLatency(ms)
Aggregate Queries Per Second (QPS)
Sysbench Thread Scaling - Latency vs QPS – 100% read (Point SELECTs)
5 nodes, 80 OSDs, Xeon E5 2699v4 Dual Socket / 128GB Ram / 2x10GbE
Ceph 10.1.2 w/ BlueStore. 20 Docker-rbd Sysbench Clients (16vCPUs, 32GB)
100% Random Read
~55000 QPS with 1 client
1 million QPS with 20 clients @ ~11 ms avg
2 Sysbench threads/client
~1.3 million QPS with 20 Sysbench clients,
8 Sysbench threads/client
Software and workloads used in performance tests may have been optimized for performance only on Intel microprocessors. Any difference in system hardware or
software design or configuration may affect actual performance. See configuration slides in backup for details on software configuration and test benchmark
parameters.
18
Database page size = 16KB
19. Sysbench MySQL OLTP Performance
(100% UPDATE, 70/30% SELECT/UPDATE)
0
50
100
150
200
250
300
350
400
450
500
0 100000 200000 300000 400000 500000 600000
AvgLatency(ms)
Aggregate Queries Per Second (QPS)
Sysbench Thread Scaling - Latency vs QPS – 100% Write (Index UPDATEs), 70/30% OLTP
5 nodes, 80 OSDs, Xeon E5 2699v4 Dual Socket / 128GB Ram / 2x10GbE
Ceph 10.2.1 w/ BlueStore. 20 Docker-rbd Sysbench Clients (16vCPU, 32GB)
100% Random Write 70/30% Read/Write
~400k 70/30% OLTP QPS@~50 ms avg
~25000 QPS w/ 1 Sysbench client (4-8 threads)
~100k Write QPS@~200 ms avg (Aggregate, 20 clients)
~5500 QPS w/ 1 Sysbench client (2-4 threads)
InnoDB buf pool = 25%, SQL dataset = 100GB
Software and workloads used in performance tests may have been optimized for performance only on Intel microprocessors. Any difference in system hardware or
software design or configuration may affect actual performance. See configuration slides in backup for details on software configuration and test benchmark
parameters.
19
Database page size = 16KB
24. 3D MLC and TLC NAND
Building block enabling expansion of
SSD into HDD segments
3D Xpoint™
Building blocks for ultra high
performance storage &
memory
Technology Driven: NVM
Leadership
25. Moore’s Law Continues to Disrupt the Computing Industry
U.2 SSD
First Intel® SSD for
Commercial Usage
2017 >10TB
1,000,000x
the capacity while
shrinking the
form factor
1992 12MB
Source: Intel projections on SSD capacity
2019201820172014
>6TB >30TB 1xxTB>10TB
25
26. 3D XPoint™
Latency: ~100X
Size of Data: ~1,000X
NAND
Latency: ~100,000X
Size of Data: ~1,000X
Latency: 1X
Size of Data: 1X
SRAM
Latency: ~10 MillionX
Size of Data: ~10,000 X
HDD
Latency: ~10X
Size of Data: ~100X
DRAM
3D Xpoint™ TECHNOLOGY
STORAGE
Technology claims are based on comparisons of latency, density and write cycling metrics amongst memory technologies recorded on published specifications of
in-market memory products against internal Intel specifications.
Performance numbers are Intel Internal estimates
For more complete information about performance and benchmark results, visit www.intel.com/benchmarks
Intel and Intel logos are trademarks of Intel Corporation or its subsidiaries in the U.S. and/or other countries
27. 27
Tests document performance of components on a particular test, in specific systems. Differences in hardware, software, or configuration will affect actual performance.
Consult other sources of information to evaluate performance as you consider your purchase. For more complete information about performance and benchmark results,
visit http://www.intel.com/performance. Server Configuration: 2x Intel® Xeon® E5 2690 v3 NVM Express* (NVMe) NAND based SSD: Intel P3700 800 GB, 3D Xpoint
based SSD: Optane NVMe OS: Red Hat* 7.1
Intel® Optane™ storage (prototype) vs Intel® SSD
DC P3700 Series at QD=1
28. Storage Hierarchy Tomorrow
Hot
3D XPoint™ DIMMs
NVM Express* (NVMe)
3D XPoint™ SSDs
Warm
NVMe 3D NAND SSDs
Cold
NVMe 3D NAND SSDs
SATA or SAS HDDs
~6GB/s per channel
~250 nanosecond latency
PCI Express* (PCIe*) 3.0 x4 link, ~3.2 GB/s
<10 microsecond latency
SATA* 6Gbps
Minutes offline
DRAM: 10GB/s per channel, ~100 nanosecond latency
PCIe 3.0 x4, x2 link
<100 microsecond latency
Comparisons between memory technologies based on in-market product specifications and internal Intel specifications.
Server side and/or AFA
Business Processing
High Performance/In-Memory Analytics
Scientific
Cloud Web/Search/Graph
Big Data Analytics (Hadoop*)
Object Store / Active-Archive
Swift, lambert, HDFS, Ceph*
Low cost archive
28
29. 29
3D XPoint™ & 3D NAND Enable
High performance & cost effective solutions
Enterprise class, highly reliable, feature rich, and
cost effective AFA solution:
‒ NVMe as Journal, 3D NAND TLC SSD as data store
Enhance value through special software
optimization on filestore and bluestore backend
Ceph Node
S3510
1.6TB
S3510
1.6TB
S3510
1.6TB
S3510
1.6TB
P3700
U.2 800GB
Ceph Node
P4500
4TB
P4500
4TB
P4500
4TB
P4500
4TB
P3700 & 3D Xpoint™ SSDs
3D NAND
P4500
4TB
3D XPoint™
(performance) (capacity)
30. 30
3D Xpoint™ opportunities: Bluestore backend
• Three usages for PMEM device
• Backend of bluestore: raw PMEM block device or
file of dax-enabled FS
• Backend of rocksdb: raw PMEM block device or file
of dax-enabled FS
• Backend of rocksdb’s WAL: raw PMEM block
device or file of DAX-enabled FS
• Two methods for accessing PMEM devices
• libpmemblk
• mmap + libpmemlib
• https://github.com/Ceph*/Ceph*/pull/8761
BlueStore
Rocksdb
BlueFS
PMEMDevice PMEMDevice PMEMDevice
Metadata
Libpmemlib
Libpmemblk
DAX Enabled File System
mmap
Load/store
mmap
Load/store
File
File
File
API
API
Data
31. Summary
• Strong demands and trends to all-flash array Ceph* solutions
• IOPS/SLA based applications such as SQL Database can be backend
with all flash Ceph
• NVM technologies such as 3D Xpoint and 3D NANDs enable new
performance capabilities and expedite all flash adoptions
• Bluestore shows significant performance increase compared with
filestore, but still needs to be improved
• Let’s work together to make Ceph* more efficient with all-flash array!
31
Here is a very high level and brief look at just some of the contributions Intel has up-streamed to Ceph in the past several years – or is working on now and plans to upstream.
The common theme for our work is performance, plus tools that make Ceph easier to work with.
Solution Owner: Yuan (Jack) Zhang <yuan.zhang@intel.com>
Note: Refer to P20, P21 for detailed Ceph configurations.
NVMe + SATA SSD configuration
1.08 million IOPS for 4K random
~ 144K IOPS for 4K random read
HDD setup 6150 IOPS for 4k random read, 2474 IOPS for 4k random write
~1927 MB/s for 128K sequential write performance
Seq Read is throttled at 10GbE NICs
Message: Moore’s law continues to disrupt in the memory industry.
Key Points:
From 1992 to 2017, you see 100,000x the capacity while shrinking the form factor to the size of a gum wrapper
Demo product M.2 SSD (hold in air)
Message: 3D Xpoint technology breaks the memory/storage barrier
Key Points:
Show how it fits in the hierarchy
Describe how 3DXPoint reaches the optimal edge of storage performance (given the current hardware +software limitations)