This document discusses database design using the REA data model. It covers the following key points:
1. The steps for designing and implementing a database system using the REA data model include identifying business events, the resources affected by those events, and participating agents.
2. An REA diagram models a business domain by depicting the relationships between resources, events, and agents based on rules like ensuring each event affects a resource and is linked to other events.
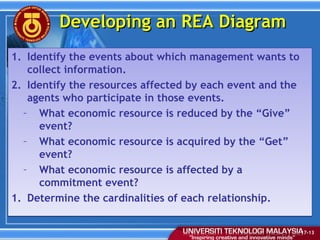
3. Developing an REA diagram involves identifying relevant entities from the business, determining the cardinalities of their relationships, and describing how instances of entities relate to each other.