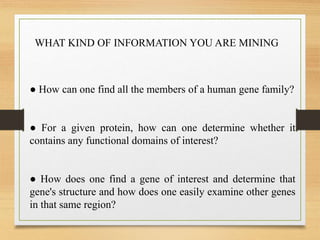
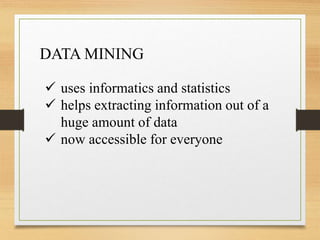
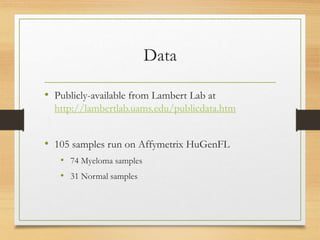
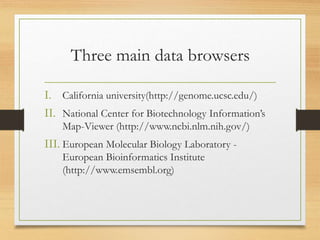
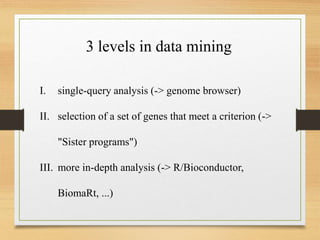
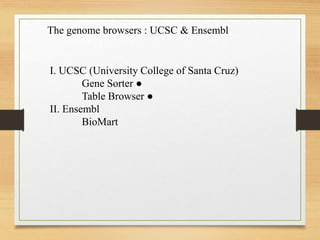
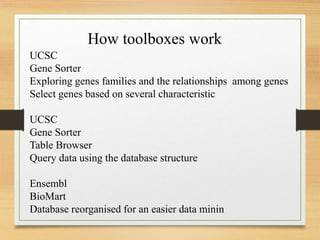
Data Mining
Data Data Data Data Data Data Data
● How can one find all the members of a human gene family?
● For a given protein, how can one determine whether it
contains any functional domains of interest?
● How does one find a gene of interest and determine that
gene's structure and how does one easily examine other genes
in that same region?
WHAT KIND OF INFORMATION YOU ARE MINING
 uses informatics and statistics
 helps extracting information out of a
huge amount of data
 now accessible for everyone
DATA MINING
Data
• Publicly-available from Lambert Lab at
http://lambertlab.uams.edu/publicdata.htm
• 105 samples run on Affymetrix HuGenFL
• 74 Myeloma samples
• 31 Normal samples
Three main data browsers
I. California university(http://genome.ucsc.edu/)
II. National Center for Biotechnology Information’s
Map-Viewer (http://www.ncbi.nlm.nih.gov/)
III. European Molecular Biology Laboratory -
European Bioinformatics Institute
(http://www.emsembl.org)
I. single-query analysis (-> genome browser)
II. selection of a set of genes that meet a criterion (->
"Sister programs")
III. more in-depth analysis (-> R/Bioconductor,
BiomaRt, ...)
3 levels in data mining
The genome browsers : UCSC & Ensembl
I. UCSC (University College of Santa Cruz)
Gene Sorter ●
Table Browser ●
II. Ensembl
BioMart
UCSC
Gene Sorter
Exploring genes families and the relationships among genes
Select genes based on several characteristic
UCSC
Gene Sorter
Table Browser
Query data using the database structure
Ensembl
BioMart
Database reorganised for an easier data minin
How toolboxes work
Common Approaches
• Comparing two measurements at a time
• Person 1, gene G: 1000
• Person 2, gene G: 3200
• Greater than 3-fold change: flag this gene
• Comparing one measurement with a population of
measurements… is it unlikely that the new
measurement was drawn from same distribution?
Approaches (Continued)
• Clustering or Unsupervised Data Mining
• Hierarchical Clustering, Self-Organizing (Kohonen) Maps
(SOMs), K-Means Clustering
• Cluster patients with similar expression patterns
• Cluster genes with similar patterns across patients or
samples (genes that go up or down together)
Approaches (Continued)
• Classification or Supervised Data Mining.
• Use our knowledge of class values… myeloma vs. normal,
positive response vs. no response to treatment, etc., to gain
added insight.
• Find genes that are best predictors of class.
• Can provide useful tests, e.g. for choosing treatment.
• If predictor is comprehensible, may provide novel insight,
e.g., point to a new therapeutic target.
Approaches (Continued)
• Classification or Supervised Learning.
• UC Santa Cruz: Furey et al. 2001 (support vector
machines).
• MIT Whitehead: Golub et al. 1999, Slonim et al. 2000
(voting).
• SNPs and Proteomics are coming.
Outline
• Data and Task
• Supervised Learning Approaches and Results
• Tree Models and Boosting
• Support Vector Machines
• Voting
• Bayesian Networks
• Conclusions

data_mining- principle and application in biology

  • 1.
    Data Mining Data DataData Data Data Data Data Data Data Data Data Data Data Data Data Data Data Data Data Data Data
  • 2.
    ● How canone find all the members of a human gene family? ● For a given protein, how can one determine whether it contains any functional domains of interest? ● How does one find a gene of interest and determine that gene's structure and how does one easily examine other genes in that same region? WHAT KIND OF INFORMATION YOU ARE MINING
  • 3.
     uses informaticsand statistics  helps extracting information out of a huge amount of data  now accessible for everyone DATA MINING
  • 4.
    Data • Publicly-available fromLambert Lab at http://lambertlab.uams.edu/publicdata.htm • 105 samples run on Affymetrix HuGenFL • 74 Myeloma samples • 31 Normal samples
  • 5.
    Three main databrowsers I. California university(http://genome.ucsc.edu/) II. National Center for Biotechnology Information’s Map-Viewer (http://www.ncbi.nlm.nih.gov/) III. European Molecular Biology Laboratory - European Bioinformatics Institute (http://www.emsembl.org)
  • 6.
    I. single-query analysis(-> genome browser) II. selection of a set of genes that meet a criterion (-> "Sister programs") III. more in-depth analysis (-> R/Bioconductor, BiomaRt, ...) 3 levels in data mining
  • 7.
    The genome browsers: UCSC & Ensembl I. UCSC (University College of Santa Cruz) Gene Sorter ● Table Browser ● II. Ensembl BioMart
  • 8.
    UCSC Gene Sorter Exploring genesfamilies and the relationships among genes Select genes based on several characteristic UCSC Gene Sorter Table Browser Query data using the database structure Ensembl BioMart Database reorganised for an easier data minin How toolboxes work
  • 9.
    Common Approaches • Comparingtwo measurements at a time • Person 1, gene G: 1000 • Person 2, gene G: 3200 • Greater than 3-fold change: flag this gene • Comparing one measurement with a population of measurements… is it unlikely that the new measurement was drawn from same distribution?
  • 10.
    Approaches (Continued) • Clusteringor Unsupervised Data Mining • Hierarchical Clustering, Self-Organizing (Kohonen) Maps (SOMs), K-Means Clustering • Cluster patients with similar expression patterns • Cluster genes with similar patterns across patients or samples (genes that go up or down together)
  • 11.
    Approaches (Continued) • Classificationor Supervised Data Mining. • Use our knowledge of class values… myeloma vs. normal, positive response vs. no response to treatment, etc., to gain added insight. • Find genes that are best predictors of class. • Can provide useful tests, e.g. for choosing treatment. • If predictor is comprehensible, may provide novel insight, e.g., point to a new therapeutic target.
  • 12.
    Approaches (Continued) • Classificationor Supervised Learning. • UC Santa Cruz: Furey et al. 2001 (support vector machines). • MIT Whitehead: Golub et al. 1999, Slonim et al. 2000 (voting). • SNPs and Proteomics are coming.
  • 13.
    Outline • Data andTask • Supervised Learning Approaches and Results • Tree Models and Boosting • Support Vector Machines • Voting • Bayesian Networks • Conclusions