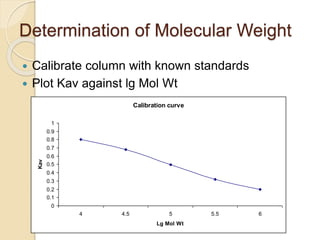
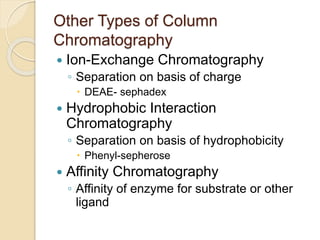
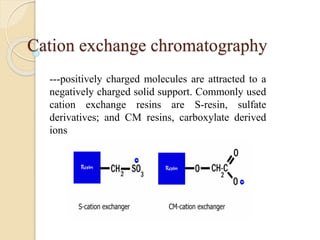
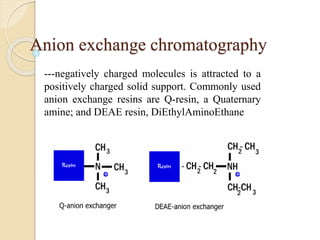
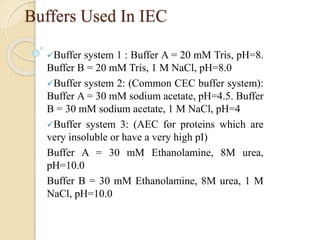
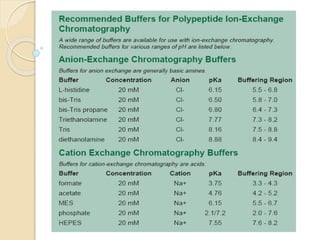
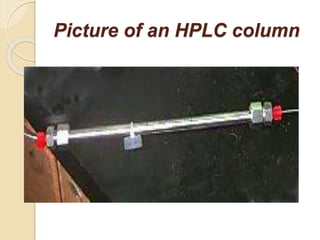
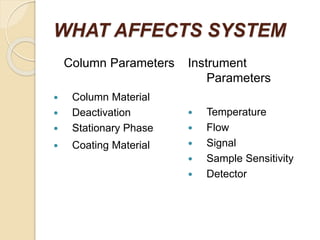
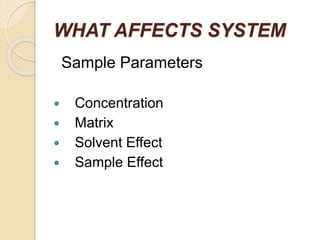
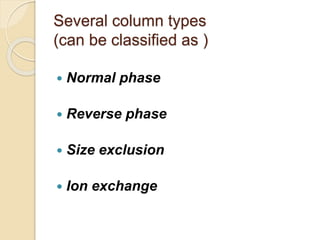
6/5/2024 sumit prajapati 1
Research Methodology:
Separation Techniques
CONTENTS
 Introduction to chromatography
 History
 Principles
 Importance
 Chromatographic terms
 Classification of chromatography
 Adsorption chromatography
 Partition chromatography
 Gas-liquid phase chromatrography
 Solid-liquid phase chromatrography
 Liquid-gas phase chromatrography
 Liquid-liquid phase chromatrography
 Important properties of liquid phase
 Conclusion
2
Chromatography
 Chromatography (from Greek chroma "color
and graphein "to write") is the collective term for
a set of laboratory techniques for the separation
of mixtures.
 The mixture is dissolved in a fluid called the
mobile phase, which carries it through a
structure holding another material called the
stationary phase.
 The various constituents of the mixture travel at
different speeds, causing them to separate. The
separation is based on differential partitioning
between the mobile and stationary phases.
3
History
 Chromatography, literally "color writing",
was first employed by Russian scientist
Mikhail Tsvet in 1900.
 He continued to work with chromatography
in the first decade of the 20th century,
primarily for the separation of plant
pigments such as chlorophyll, carotenes,
and xanthophylls.
 Since these components have different
colors (green, orange, and yellow,
respectively) they gave the technique its
name.
4
Principles
 Chromatography usually consists of
mobile phase and stationary phase. The
mobile phase refers to the mixture of
substances to be separated dissolved in
a liquid or a gas.
 The stationary phase is a porous solid
matrix through which the sample
contained in the mobile phase
percolates.
 The interaction between the mobile
phase and the stationary phase results in
the separation of the compound from the
5
Applications of
chromatography
 The chromatographic technique is used
for the separation of amino acids,
proteins & carbohydrates.
 It is also used for the analysis of drugs,
hormones,vitamins.
 Helpful for the qualitative & quantitative
analysis of complex mixtures.
 The technique is also useful for the
determination of molecular weight of
proteins.
6
The chromatographic method of separation,
in general, involves following steps
 Adsorption or retention of substances on
the stationary phase
 Separation of the adsorption of
substances by the mobile phase
 Recovery of the separated substances by
a continuous flow of the mobile phase; the
method being called elution
 Qualitative and Quantitative analysis of
the eluted substances
7
Chromatographic terms
 The analyte is the substance to be separated during
chromatography.
 A chromatogram is the visual output of the
chromatograph.
 The eluate is the mobile phase leaving the column.
 The eluent is the solvent that carries the analyte
 The detector refers to the instrument used for
qualitative and quantitative detection of analytes after
separation.
8
Classification of chromatography
1. Based on mechanism of separation
I. adsorption chromatography
II. Partition chromatography
2. Based on phases
I. Solid phase chromatography
i. Solid-liquid chromatography
ii. Solid-gas chromatography
II. Liquid phase chromatography
i. Liquid-liquid chromatography
ii. Liquid –gas chromatography
3. Based on shape of chromatographic bed
I. Planner chromatography
i. Paper chromatography
ii. Thin layer chromatography
II. Column chromatography
i. Packed column chromatography
ii. Open tubular column chromatography
9
Flow chart diagram of chromatography
chromatography
adsorption
Competition between
Solid and
Gas
(G.S.C.)
Liquid
Column
chromatography
Thin layer
chromatography
partition
Competition between
Liquid and
Gas
G.L.C.
Liquid
H.P.L.C.
Column
chromatography
Paper
chromatography
TLC
10
Adsorption chromatograohy
 It utilizes a mobile liquid or
gaseous phase that is
adsorbed onto the surface of
a stationary solid phase
 The equilibriation between the mobile and stationary
phase accounts for the separation of different solutes.
 Adsorption chromatography is process of separation of
components in a mixture introduced into chromatography
system based on the relative difference in adsorption of
components to stationary phase present in chromatography
column
11
sumit prajapati
Partition chromatography
 This form of chromatography is based on a thin film formed
on the surface of a solid support by a liquid stationary phase
 Solute equilibrates
between the mobile phase
and the stationary liquid.
 Chromatography in which separation is based mainly on
differences between the solubility of the sample components
in the stationary phase or on differences between the
solubility of the components in the mobile and stationary
phases
12
sumit prajapati
Gas-Solid chromatography(G.S.C.)
Gas chromatography employs an inert gas as the mobile
phase
Separation depends on the relative partial pressures of
the sample components above the stationary phase.
Gas-solid chromatography is relatively rare, but it is used
to separate atmospheric gases
Common solids are charcoal, a synthetic zeolite called
"molecular sieve", or a combination of the two.
The mobile phase is a gas, often nitrogen, but
sometimes helium, hydrogen or occasionally another gas.
It is called the "carrier gas".
13
Solid-Liquid chromatography
Liquid chromatography (LC) is a separation technique
in which the mobile phase is a liquid.
Liquid chromatography can be carried out either in a
column or a plane
 In liquid-solid chromatography the porous adsorbent
is polar and separation is based on the properties of
classes of compounds—e.g., amines (alkaline) from
alcohols (neutral) and esters (neutral) from acids
The preferred mobile phase is a nonpolar or slightly
polar...
Popular adsorbents are Silica and Alumina.
14
Liquid-Gas Chromatography
 Dimethyl Polysiloxane (350oC)
Hydrocarbons, Polynuclear aromatics
Poly(phenyl methyl) siloxane (250oC)
Steroids, Pesticides, Glycols
Stationary phase used in (LGC)
The mobile phase is an unreactive gas, such as nitrogen
(the carrier gas)
The stationary phase comprises of a small amount of
liquid held on a finely-divided inert solid support.
Gas-liquid chromatography is very sensitive and can be
used to detect small quantities of substances
it is often used in forensic tests
15
Liquid-Liquid Chromatography
 Liquid-liquid chromatography is a chromatography
separation technique in which the mobile phase is a liquid
(usually a solvent or a simple binary solvent mixture) and
the stationary phase is also a liquid (which must be
immiscible and insoluble in the liquid mobile phase).
 The first liquid-liquid system was reported by A. J. P.
Martin who used water supported on silica gel as the
stationary phase and n-heptane as the mobile phase
 The system is inherently unstable, as the stationary
phase will always have some solubility in mobile phase
16
Planner chromatography
 Planar chromatography is a separation technique in
which the stationary phase is present on a plane.
 The plane can be a paper, serving as such or
impregnated by a substance as the stationary bed (paper
chromatography) or a layer of solid particles spread on a
support such as a glass plate (Thin layer
chromatography).
 Different compounds in the sample mixture travel
different distances according to how strongly they interact
with the stationary phase as compared to the mobile
phase.
 The specific Retention factor (Rf) of each chemical can
17
Column Chromatography
 Column chromatography is a separation technique in
which the stationary bed is within a tube.
 The particles of the solid stationary phase or the
support coated with a liquid stationary phase may fill the
whole inside volume of the tube (packed column) or be
concentrated on or along the inside tube wall leaving an
open, unrestricted path for the mobile phase in the middle
part of the tube (open tubular column).
 Differences in rates of movement through the medium
are calculated to different retention times of the sample
18
Important properties of liquid
stationary phase
 Liquid phase should have low volatility and high stability
at elevated temperatures
 Liquid phase should not permeate too deeply into the
fine pores of the support structure as slow diffusion in and
out of pores affects column efficiency
 Small particles of support give higher efficiency as
HETP is proportional to particle diameter but particle size
reduction increases back pressure
 Support should be deactivated before use as
undesirable surface impurities can cause decomposition of
the sample or stationary liquid
19
Conclusion
 In overall ranking Chromatography
techniques , it can be judge SFC falls
somewhere between HPLC or GC.
 In field of pharmaceutical chemistry and
bioanalytical application gained its
applications
20
Gel Filtration
Gel permeation chromatography
Size exclusion chromatography
Separation of molecules on the basis of size
(and shape)
Theory
Column matrix
Porous beads
Large molecules are “excluded” from the pores
and travel through the column fastest
Small molecules are “included” – can diffuse
into the pores and elute later
Theory
Elution Profile
Idealised Elution Profile
0
0.5
1
1.5
2
2.5
1
3
5
7
9
0
.
1
1
1
3
1
5
1
7
1
9
2
1
2
3
2
5
Fraction number
Amount
Ve Ve Ve
Ve = Elution volume (volume of solvent between
injection and elution). Dictated by proportion of porous
matrix available to molecules (Kd).
Column Parameters
Vs= volume of
solvent held in
the pores. This is
normally
approximated to
Vt-Vo = volume
of beads
Vo = void
volume
Vt = total
volume
Vo = Elution volume of a large “totally
excluded” molecule such as blue
dextran
Vt = Physical volume of column
Calculation of Ve
For a molecule that can partially enter
the pores:
Ve = Vo + Kd (Vs)
or Ve = Vo + Kav (Vt-Vo)
Kav = proportion of pores available to the
molecule.
Totally “exclude” Kav = 0 and Ve = Vo
Totally “included” Kav = 1 and Ve = Vt
Behaviour of Molecule on any
Column
Kav = Ve – Vo
Vt - Vo
Resolution
Resolution
0
0.5
1
1.5
2
2.5
1 2 3 4 5 6 7 8 9 10 11 12 13
Fraction number
Amount
Resolution proportional to square root of column
length. Also affected by rate at which column is
run
Design of Column
 Column size
◦ Analytical or preparative
 Solvent
◦ Inert matrix most solvents OK
 Matrix
◦ Most important consideration
◦ Many different types
 Material
 Pore size
Matrix Types
Material
 Sephacryl
◦ dextran
 Sephadex
◦ dextran
 Sepherose
◦ agarose
 Superdex
◦ mixture
Sephacryl Protein
(kD)
Dextrans
(kD)
S-100 1-100 NS
S-200 5-250 1-80
S-300 10-1500 2-400
S-400 20-8000 10-2000
S-500 NS 40-20,000
Running the column
 Sample size / Fraction size
◦ 0.5 – 5% of total bed volume (Vt).
◦ Concentration limited by viscosity
 Running time
◦ Determined by “trial and error”
◦ Slow rates allow efficient partitioning into pores
and thus increase resolution
◦ Slow rates increase diffusion of sample on
column thus increasing peak width and reducing
resolution.
◦ Protein about 5mL cm-2. h-1
Types of Column Systems
 Liquid Chromatography
 High Performance Liquid
Chromatography (HPLC)
Determination of Molecular Weight
 Calibrate column with known standards
 Plot Kav against lg Mol Wt
Calibration curve
0
0.1
0.2
0.3
0.4
0.5
0.6
0.7
0.8
0.9
1
4 4.5 5 5.5 6
Lg Mol Wt
Kav
Other Types of Column
Chromatography
 Ion-Exchange Chromatography
◦ Separation on basis of charge
 DEAE- sephadex
 Hydrophobic Interaction
Chromatography
◦ Separation on basis of hydrophobicity
 Phenyl-sepherose
 Affinity Chromatography
◦ Affinity of enzyme for substrate or other
ligand
ION EXCHANGE
CHROMATOGRAPHY
Principle……
Different affinity of the different components to
stationary phase causes the separation
Ion Exchange Chromatography
Ion exchange chromatography -- is a separation based on
charge
Used for almost any kind of charged molecules --- large
proteins, small nucleotides and amino acids
Ion-exchange chromatography preserves analyte
molecules on the column based on ionic interactions
Mobile phage – buffer, pH and salt concentration---
opposite charged solute ions attracted to the stationary
phage by electrostatic force
Stationary phage– resin is used to covalently attach anions
or cations onto it
Principle……….
Ion Exchange Chromatography relies on
charge-charge interactions between the
proteins
Types of IEC….
anion exchangers
cation exchangers
Cation exchange chromatography
---positively charged molecules are attracted to a
negatively charged solid support. Commonly used
cation exchange resins are S-resin, sulfate
derivatives; and CM resins, carboxylate derived
ions
Anion exchange chromatography
---negatively charged molecules is attracted to a
positively charged solid support. Commonly used
anion exchange resins are Q-resin, a Quaternary
amine; and DEAE resin, DiEthylAminoEthane
Buffers Used In IEC
Buffer system 1 : Buffer A = 20 mM Tris, pH=8.
Buffer B = 20 mM Tris, 1 M NaCl, pH=8.0
Buffer system 2: (Common CEC buffer system):
Buffer A = 30 mM sodium acetate, pH=4.5. Buffer
B = 30 mM sodium acetate, 1 M NaCl, pH=4
Buffer system 3: (AEC for proteins which are
very insoluble or have a very high pI)
Buffer A = 30 mM Ethanolamine, 8M urea,
pH=10.0
Buffer B = 30 mM Ethanolamine, 8M urea, 1 M
NaCl, pH=10.0
Chromatography Methods
Column washed with buffer A to equilibrate
Buffer B is used to equilibrate again
Equilibrate the column with buffer A
Sample loading
Flow through collection
Elute protein
Advantages
It is a non-denaturing technique. It can be
used at all stages and scales of purification
An IEX separation can be controlled by
changing pH, salt concentration and/or the ion
exchange media
It can serve as a concentrating step. A large
volume of dilute sample can be applied to a
media, and the adsorbed protein subsequently
eluted in a smaller volume
It offers high selectivity; it can resolve
molecules with small differences in charge.
Disadvantages
costly equipment and more expensive
chemicals
turbidity should be below 10ppm
Conclusion
Ion exchange chromatography is
more efficient than other
chromatography. It could be widely
used for commercial purposes.
High Performance Liquid
Chromatography
Introduction
 HPLC is a form of liquid chromatography used to
separate compounds that are dissolved in solution.
HPLC instruments consist of a reservoir of mobile
phase, a pump, an injector, a separation column,
and a detector.
 Compounds are separated by injecting a sample
mixture onto the column. The different component
in the mixture pass through the column at
differentiates due to differences in their partition
behavior between the mobile phase and the
stationary phase. The mobile phase must be
degassed to eliminate the formation of air bubbles.
HPLC system
FOUR TYPES OF LIQUID
CHROMATOGRAPHY
 Partition chromatography
 Adsorption, or liquid-solid
 Ion exchange chromatography
 Size exclusion, or gel, chromatography
COMPOSITION OF A LIQUID
CHROMATOGRAPH SYSTEM
 Solvent
 Solvent Delivery System (Pump)
 Injector
 Sample
 Column
 Detectors (Diode Array)
 Waste Collector
 Recorder (Data Collection)
Picture of HPLC instrument
Uses of HPLC
 This technique is used for chemistry and biochemistry
research analyzing complex mixtures, purifying chemical
compounds, developing processes for synthesizing
chemical compounds, isolating natural products, or
predicting physical properties. It is also used in quality
control to ensure the purity of raw materials, to control
and improve process yields, to quantify assays of final
products, or to evaluate product stability and monitor
degradation.
 In addition, it is used for analyzing air and water
pollutants, for monitoring materials that may jeopardize
occupational safety or health, and for monitoring
pesticide levels in the environment. Federal and state
regulatory agencies use HPLC to survey food and drug
products, for identifying confiscated narcotics or to
check for adherence to label claims.
HPLC Chromatograph
injectors
 The function of the injector is to place the sample
into the high-pressure flow in as narrow volume as
possible so that the sample enters the column as a
homogeneous, low-volume plug. To minimize
spreading of the injected volume during transport
to the column, the shortest possible length of
tubing should be used from the injector to the
column.
 When an injection is started, an air actuator rotates
the valve: solvent goes directly to the column; and
the injector needle is connected to the syringe. The
air pressure lifts the needle and the vial is moved
into position beneath the needle. Then, the needle
is lowered to the vial.
HPLC columns
 The column is one of the
most important
components of the
HPLC chromatograph
because the separation
of the sample
components is achieved
when those components
pass through the
column. The High
performance liquid
chromatography
apparatus is made out of
stainless steel tubes with
a diameter of 3 to 5mm
and a length ranging
from 10 to 30cm.
 Normally, columns are filled
with silica gel because its
particle shape, surface
properties, and pore
structure help to get a good
separation. Silica is wetted
by nearly every potential
mobile phase, is inert to
most compounds and has a
high surface activity which
can be modified easily with
water and other agents.
Silica can be used to
separate a wide variety of
chemical compounds, and
its chromatographic
behavior is generally
predictable and
reproducible.
Picture of an HPLC column
WHAT AFFECTS SYSTEM
Column Parameters
 Column Material
 Deactivation
 Stationary Phase
 Coating Material
Instrument
Parameters
 Temperature
 Flow
 Signal
 Sample Sensitivity
 Detector
WHAT AFFECTS SYSTEM
Sample Parameters
 Concentration
 Matrix
 Solvent Effect
 Sample Effect
Several column types
(can be classified as )
 Normal phase
 Reverse phase
 Size exclusion
 Ion exchange
Normal phase
 In this column type, the retention is
governed by the interaction of the
polar parts of the stationary phase and
solute. For retention to occur in normal
phase, the packing must be more
polar than the mobile phase with
respect to the sample
Reverse phase
 In this column the packing material is
relatively nonpolar and the solvent is polar
with respect to the sample. Retention is the
result of the interaction of the nonpolar
components of the solutes and the nonpolar
stationary phase. Typical stationary phases
are nonpolar hydrocarbons, waxy
liquids, or bonded hydrocarbons (such
as C18, C8, etc.) and the solvents are polar
aqueous-organic mixtures such as
methanol-water or acetonitrile-water.
Size exclusion
 In size exclusion the HPLC column is
consisted of substances which have
controlled pore sizes and is able to
be filtered in an ordinarily phase
according to its molecular size.
 Small molecules penetrate into the
pores within the packing while larger
molecules only partially penetrate the
pores. The large molecules elute
before the smaller molecules.
Ion exchange
 In this column type the sample
components are separated based
upon attractive ionic forces between
molecules carrying charged groups of
opposite charge to those charges on
the stationary phase.
 Separations are made between a
polar mobile liquid, usually water
containing salts or small amounts of
alcohols, and a stationary phase
containing either acidic or basic fixed
sites.
Selectivity Factor
 K’ values tell us where bands elute
relative to the void volume. These
values are unaffected by such
variables as flow rate and column
dimensions. The value tell us where
two peaks elute relative to each other.
This is referred to as the selectivity
factor or separation factor (now and
then as the chemistry factor).
Types of Liquid Column
Chromatography
(LCC)
 LLC (Liquid Liquid)
 LSC (Liquid Solid -
adsorption)
 SEC (Size Exclusion)
 GLC GSC
 SFC (Supercritical
Fluid)
Types of Detectors
 Absorbance (UV
with Filters, UV
with
Monochromators)
 IR Absorbance
 Fluorescence
 Refractive-Index
 Evaporative Light
Scattering
Detector (ELSD)
 Electrochemical
 Mass-
Spectrometric
 Photo-Diode Array
EVALUATION
PARAMETERS
 EFFICIENCY
 RESOLUTION
 INERTNESS
 RETENTION INDEX
 COLUMN BLEED
 CAPACITY FACTOR
Electrophoresis
• Electrophoresis is the migration of charged
molecules,particles or ion in a liquid medium under
the influence of an electric field
• Various types – defined by support used
1. Paper – amino acids, small peptides
2. Polyacrylamide – Proteins, small DNA/RNA (<500bp)
3. Agarose – DNA/RNA
• Good preparative and analytical method
From large to small and simple
Principle
Proteins move in the
electric field. Their relative
speed depends on the
charge, size, and shape of
the protein
instrumentation and reagents:
(1) Two buffer boxes contain the buffer used in the
process.
(2) Each buffer box contains an electrode made of
either platinum or carbon, the polarity of which is
determined by the mode of connection to the power
supply.
(3)The electrophoresis support on which separation
takes place may contact the buffer directly, or by
means of wicks
(4)The entire apparatus is covered to minimize
evaporation and protect the system
(5) The power supply to provide electrical power.
Technique of electrophoresis
General operations performed in conventional
electrophoresis include:
(1) separation
(2) staining
(3) detection
(4) Quantification
General Procedure
SAMPLE APPLICATION :
The sample may be applied as a spot (about 0.5 cm in diameter) or
as a uniform streak.
ELECTROPHORETIC RUN:
The current is switched on after the sample has been applied to the
paper and the paper has been equilibrated with the buffer. .The
types of buffer used depends upon the type of separation. Once
removed, the paper is dried in vacuum oven.
DETECTION AND QUANTITATIVE ASSAY:
To identify unknown components in the resolved mixture the
electrophoretogram may be compared with another
electrophoretogram on which standard components have been
electrophoresced under identical conditions. Physical properties
like fluorescence, ultraviolet absorption or radioactivity are
exploited for detection.
Factors
affecting
migration rate
Sample Electric field Buffer
Supporting
media
The sample
Charge
Size
Shape
The electric field
Current
Voltage
Resistance
Heat
The Buffer
Composition
Concentration
PH
The Supporting media
Adsorption
Electro-osmosis
Molecular sieving
Electro-osmosis:
Types of ELECTROPHORESIS
Zone electrophoresis
Slab Gel Electrophoresis
Disc electrophoresis
lsoelectric Focusing electrophoresis
Two-Dimensional (2D) Electrophoresis
Capillary electrophorsis
Microship electrophorsis
A simplified schematic drawing of a protein pattern
separated by cellulose acetate paper
electrophoresis
What is a gel?
Gel is a cross linked polymer whose composition and
porosity is chosen based on the specific weight and porosity
of the target molecules.
Types of Gel:
 Agarose gel.
 Polyacrylamide gel.
GEL ELECTROPHORESIS
Gel Electrophoresis
• Gel electrophoresis uses a cross-linked polymers
(agarose) that contain various pores.
• Pores allow molecular sieving, where molecules e.g.
DNA, can be separated based upon there mobility
through the gel.
 A highly purified uncharged polysaccharide derived
from agar.
 Used to separate macromolecules such as nucleic
acids, large proteins and protein complexes.
 It is prepared by dissolving 0.5% agarose in boiling
water and allowing it to cool to 40°C.
 It is fragile because of the formation of weak hydrogen
bonds and hydrophobic bonds.
AGAROSE GEL
 Used to separate most proteins and small oligonucleotides
because of the presence of small pores.
POLYACRYLAMIDE GEL
 Detection
1. Dye e.g. ethidium bromide
2. Audioradiography 32P,
3. Blotting (see later)
 Uses
1. Analytical- Can determine size of DNA fragment,
2. Preparative – Can identify a specific fragment
based on size
DNA Gel Electrophoresis
2D-gel (coomassie stained)
Example of silver stained gel
Silver staining is usually
10-100 times more
sensitive than Coomassie
Blue staining, but it is
more complicated.
Faint but still visible bands
on this gel contain less
than 0.5 ng of protein!
 Electrophoretic method that separates proteins
according to the iso-electric points
 Is ideal for seperation of amphoteric substances
 Seperation is achieved by applying a potential
difference across a gel that contain a pH
gradient
 Isoelectric focusing requires solid support such
as agarose gel and polyacrylamide gel
ISOELECTRIC FOCUSING
IEF
Separates proteins by their
isoelectric points (pI)
Each protein has own pI = pH
at which the protein has equal
amount of positive and
negative charges (the net
charge is zero)
IEF example
Zavialov A.
IEF 4-6.5 pH gradient
IEF
Mixtures of ampholytes, small
amphoteric molecules with high
buffering capacity near their pI, are
used to generate the pH gradient.
Positively and negatively charged
proteins move to – and +,
respectively, until they reach pI.
PI of proteins can be theoretically
predicted. Therefore, IEF can also
be used for protein identification.
A TYPICAL ISOELECTRIC FOCUSING GEL
 Using specific probes that are labelled specific sequences
of DNA can be identified.
 There are three main hybridization techniques which vary in
the sample blotted and the probes used;
1. Northern Blot-Transfer of an RNA sample separated and
identified using DNA or RNA probes.
2. Southern Blot-Transfer of an DNA sample separated and
identified using DNA or RNA probes.
3. Western Blot- Transfer of an Protein sample separated and
identified typically using an antibody.
Blotting Techniques
 Blotting – Transfer of DNA, RNA or Proteins,
typically from a electrophoresis gel to a membrane
e.g. nitrocellulose. This membrane can then be
subject to further techniques such as hybridization.
 Hybridization – Process where two complementary
single strands of nucleic acid (DNA or RNA) form a
double helix.
Blotting Techniques
Western Blotting (WB)
WB is a protein detection technique that combines
the separation power of SDS PAGE together with
high recognition specificity of antibodies
An antibody against the target protein could be
purified from serum of animals (mice, rabbits, goats)
immunized with this protein
Alternatively, if protein contains a commonly used
tag or epitope, an antibody against the tag/epitope
could be purchase from a commercial source (e.g.
anti-6 His antibody)
WB: 4 steps
1. Separation of proteins using SDS PAGE
2. Transfer of the proteins onto e.g. a
nitrocellulose membrane (blotting)
3. Immune reactions
4. Visualization
WB, Step 2: Blotting
WB, Steps 3-4: Detection
 This technique combines the technique IEF (first
dimension), which separates proteins in a
mixture according to charge (PI), with the size
separation technique of SDS-PAGE second
dimension).
 The combination of these two technique to give
two-dimension(2-D)PAGE provides a highly
sophisticated analytical method for analysing
protein mixtures.
TWO-DIMENSIONAL ELECTROPHORESIS
 Using this method one can routinely resolve
between 1000 and 3000 proteins from a cell or
tissue extract and in some cases workers
have reported the separation of between 5000
and 10000 proteins.
 The result of this is a gel with proteins spread
out on its surface. These proteins can then be
detected by a variety of means, but the most
commonly used stains are silver and coomasie
staining.
Capillary electrophoresis
 In CE, the classic techniques of electrophoresis are carried
out in a small-bore, fused silica capillary tube, the outer
diameter of such tubes typically varies from 180 to 375
micrometer, the inner diameter from 20 to 180 micrometer,
and the total length from 20 cm up to several meters. This
capillary tube serves as a capillary electrophoretic chamber
that is connected to a detector at its terminal end and, via
buffer reservoirs, to a high-voltage power supply
 The main advantage of CE comes from efficient heat
dissipation compared with traditional electrophoresis.
Improved heat dissipation permits the application of
voltages in the range of 20 to 30 kV, which enhances
separation efficiency and reduces separation time in some
cases to less than 1 minute
Capillary electrophoresis
Microchip electrophoresis
1. Discontinuities in sample application: may be due to
dirty applicators, which are best cleaned by agitating in
water followed by gently pressing the applicators against
absorbent paper. Caution must be used, and it is
inadvisable to clean wires or combs by manual wiping.
2. Unequal migration of samples across the width of the
gel may be due to dirty electrodes causing uneven
application of the electrical field or to uneven wetting of
the gel.
3. Distorted protein zones may be due to
A.bent applicators.
B.incorporation of an air bubble during sample
application.
C.over application of sample.
D.excessive drying of the electrophoretic support
before or during electrophoresis.
The following problems may be encountered
when peforming gel electrophoresis.
4. Irregularities (other than broken zones) in sample
application probably are due to excessively wet
agarose gels. Parts of the applied samples may
look washed out.
5. Unusual bands are usually artifacts that may be
easily recognized.
6. Atypical bands in an isoenzyme pattern may be
the result of binding by an immunoglobulin. An
irregular, but sharp protein zone at the starting
point that lacks the regular, somewhat diffuse
appearance of proteins may actually be
denatured protein resulting from a deteriorated
serum.
110
Isozymes (also known as isoenzymes) are
enzymes that differ in amino acid
sequence but catalyze the same
chemical reaction.
These enzymes usually display different
kinetic parameters (e.g. different Km
values), or different regulatory properties.
Catalyze the same reactions but are
formed from structurally different
polypeptides.
They perform the same catalytic function.
Various isoenzymes of an enzyme can
differ in three major ways:
1. Enzymatic properties
2. Physical properties (e.g. heat stability)
3. Biochemical properties such as amino
111
Lactate dehydrogenase (LDH)
Pyruvate → Lactate (anaerobic
glycolysis)
 LDH is elevated in myocardial
infarction, blood disorders
 It is a tetrameric protein and made
of two types of subunits namely H =
Heart, M = skeletal muscle
 It exists as 5 different isoenzymes
with various combinations of H and
M subunits
112
Isoenzyme
name
Composition Present in Elevated in
LDH1 ( H4)
HHHH
Myocardium, RBC myocardial
infarction
LDH2 (H3M1) HHHM Myocardium, RBC
LDH3 (H2M2) HHMM Kidney, Skeletal
muscle
LDH4 (H1M3) HMMM Kidney, Skeletal
muscle
LDH5 (M4) MMMM Skeletal muscle,
Liver
Skeletal muscle
and liver diseases
113
Creatine Kinase (CK)
Creatine + ATP → phosphocreatine +
ADP
 (Phosphocreatine – serves as energy
reserve during muscle contraction)
 Creatine kinase is a dimer made of
two monomers occurs in the tissues.
 Skeletal muscle contains M subunit,
Brain contains B subunits.
 Three different isoenzymes are
formed.
114
Isoenzyme name Composition Present in Elevated in
CK-1 BB Brain CNS diseases
CK-2 MB
Myocardium/
Heart
Acute myocardial
infarction
CK-3 MM
Skeletal muscle,
Myocardium
115
Allosteric modulation
 Allosteric sites are sites on the enzyme
that bind to molecules in the cellular
environment.
 The sites form weak, noncovalent bonds
with these molecules, causing a change
in the conformation of the enzyme.
 This change in conformation translates
to the active site, which then affects the
reaction rate of the enzyme.
 Allosteric interactions can both inhibit
and activate enzymes and are a
common way that enzymes are
controlled in the body. 116
117
118
Serum enzymes increases may be
due to:-
 Cell death - this results in a small short-lived
increase (e.g., following myocardial infarction).
 Increased cell membrane permeability in living
cells (due to hypoxia, inflammation,
drugs/poisons, cellular swelling) gives rise to a
large protracted increase in serum enzymes as
there is ongoing enzyme synthesis (e.g.,
Duchenne muscular dystrophy, acute viral
hepatitis).
 Increased synthesis in a specific cell type (e.g.,
gamma glutamyl transferase in liver cells is
induced by alcohol or anticonvulsant drugs,
alkaline phophatase in liver cells is induced by
obstruction, lactate dehydrogenase is induced in 119
CAUSES OF CELL DAMAGE OR
DEATH
120
CREATINE KINASE (CK)
121
Important in tissues where significant
metabolic energy is stored as creatine
phosphate.
Distribution : skeletal muscle, heart, brain.
Isoenzyme composition : CK is a dimer
consisting of sub-units M or B coded by
two distinct genes.
Thus 3 possible isoenzymes - M M ; M B ;
B B
Skeletal muscle - all MM; Heart - 80% MM,
20% MB; Brain - all BB.
Normal pattern in serum - predominantly
MM present, with MB < 6% of total CK. 122
 Myocardial infarction
Early increase of total CK, specifically the
MB isoenzyme.
Total CK levels start to rise at about 6 hours
, peak at 18 to 30 hours, and return to
normal by 3 days.
If total CK raised, measurement of CK-MB
is indicated.
CK-MB levels may be raised by 4 hours,
are almost certain to be raised by 12 hours,
and may return to normal by 24 hours after
MI.
Used as a diagnostic test before 24 hours,
and as a prognostic indicator (amount of
123
 Skeletal muscle damage
e.g., trauma, surgery (especially in cardiac
surgery), over-exercise, convulsions,
ischaemia, inflammation (myositis), malignant
hyperthermia, congenital muscular dystrophy.
increase of total CK, but MB isoenzyme not
increased. In neurogenic muscle disease, e.g.,
poliomyelitis and Parkinsonism, CK levels are
normal.
In Duchenne Muscular Dystrophy, CK elevation
precedes onset of symptoms by years, and
falls as disease progresses.
In chronic muscle disease there is reversion to
the foetal isoenzyme pattern (MB appears in
skeletal muscle and serum).
 Hypothyroidism is associated with high
total CK levels. 124
LACTATE DEHYDROGENASE
(LDH, LD)
125
Important in the disposal of glycolytically
generated NADH, particularly when
mitochondrial disposal is impaired by hypoxia.
Distribution: ubiquitous, including heart,
skeletal muscle, liver and RBCs - specificity is
improved by isoenzyme analysis.
LD is a tetramer consisting of sub-units H or M
coded by two different genes.
126
 Anoxic tissues (liver, muscle) express M
subunit, thus LD5 predominates.
 Erythrocyte precursors and heart
express the H subunit, hence LD1
predominates in these tissues.
 Normal pattern in serum -
predominantly LD2, with slightly less
LD1, and even less LD3, LD4 and LD5.
127
 Myocardial infarction - late and long-
lasting increase in total LD. Total LD
levels start to rise at about 8 to 12 hours,
peak at 24 to 48 hours and return to
normal by 10 days. The predominant
isoenzyme is LD1, which is present in
greater concentration than the normal
LD2 (flipped pattern).
 Liver damage, including viral or toxic
hepatitis (ethanol, paracetamol overdose,
carbon tetrachloride), cardiac failure (liver
congestion) - increase in total LD,
128
Hematological disorders - often isolated
elevation in total LD. Due to breakdown of
circulating red cells or red cell precursors in
bone marrow.
 Intra-vascular (or in vitro) haemolysis, e.g.,
due to an auto-immune disorder, prosthetic
heart valve, inherited enzyme deficiency
(G6PD, PK) - both LD1 and LD2 increased.
Associated features include elevated serum
unconjugated bilirubin, increased urine and
stool urobilinogen, and decreased
haptoglobin.
 Megaloblastic anaemia due to folate or
vitamin B12 deficiency : failure of cell
division leads to cell lysis and enzyme
release from the bone marrow -
predominant increase in LD1 (as in
myocardial infarction). Extremely high levels
129
Malignant tumours may manifest an
isolated increase in serum LD due to
enhanced synthesis of glycolytic enzymes
by a wide variety of neoplasms (even
measured in aqueous humour to diagnose
retinoblastoma).
Typically centripetal isoenzyme pattern
(LD2, LD3 and LD4) due to expression of
both subunits (H and M). An exception is
seen in germ cell tumours which show an
increase in LD1.
130
TRANSAMINASES
131
ASPARTATE TRANSAMINASE (AST)
(aspartate +α-ketoglutarate ----->
oxaloacetate + glutamate).
ALANINE TRANSAMINASE (ALT) (alanine
+ α-ketoglutarate -----> pyruvate +
glutamate).
Wide distribution in tissues, including liver,
skeletal muscle, heart, kidney and RBCs.
Cofactor vitamin B6 (pyridoxine) - carries
amino acid intermediates.
132
Acute hepatitis - high, sustained elevations of both ALT
and AST (up to 100 x normal).
ALT higher especially in mild injury; precedes onset of
jaundice (allows early diagnosis.
Disproportionate AST elevation indicates liver cell
necrosis (involving mitochondria) or ethanol induced
damage (acetaldehyde formed during ethanol metabolism
depletes cytosolic pyridoxine, hence ALT activity
selectively lost).
Myocardial infarction - AST elevation of 5 - 10 x normal.
AST levels start to rise at about 6 to 8 hours, peak at 18 to
24 hours and return to normal by 4 to 5 days. ALT hardly
increases at all.
AST always greater than ALT (de Ritis quotient AST/ALT >
5. In liver disease this ratio is usually < 1).
133
ALKALINE PHOSPHATASE
(ALP)
134
Located in membranes, specifically the
brush borders of the PCT of the kidney, the
small intestinal mucosa, both the sinusoidal
and canalicular surfaces of the hepatocyte,
in osteoblasts in bone and in the placenta.
Important in the formation of new bone by
osteoblasts.
Normal level in serum is determined by age
and sex, reflecting periods of active bone
growth, i.e., very high in young children.
Normal pattern in children is preponderance
of bone isoenzyme, while in adults liver
isoenzyme predominates. 135
Bone disease
Reflects increased osteoblastic activity i.e.,
bone synthesis.
High levels of total ALP, due to increased
bone isoenzyme, seen in:
• active bone growth (young children, at
puberty, healing fractures).
• Primary bone tumours (osteogenic sarcoma).
• secondary tumours evoking a sclerotic
response e.g., prostatic and breast
metastases.
• Rickets (children) and osteomalacia (adults).
• long-standing primary or secondary
hyperparathyroidism (e.g., chronic renal
disease where calcium is resorbed from 136
Liver disease
Classic marker of cholestasis due to extra-
hepatic (gallstones) or intra-hepatic (drugs,
inflammation) obstruction.
Synthesis of liver isoenzyme induced by
biliary obstruction - differentiates obstruction
from hepatocellular damage. Elevated liver
ALP without jaundice suggests :
 Intermittent or incomplete obstruction
(gallstone).
 Intra-hepatic space-occupying mass
(tumour).
137
 Placental isoenzyme
is found in the serum in late pregnancy
and remains elevated a week or two
after delivery.
138
GAMMA GLUTAMYL
TRANSFERASE (GGT)
139
γ-glutamyl-N-donor + acceptor --> γ-
glutamyl-N-acceptor + donor.
Distribution :
It present in all cells except muscle.
Located in cell membranes and
endoplasmic reticulum of hepatocytes.
Role:
Synthesis of reduced glutathione (GSH)
required for drug detoxification e.g.,
paracetamol.
Normal level in serum derived from liver.
140
Hepatic synthesis of GGT is induced by
biliary obstruction.
Serum levels correlate with liver ALP and 5’
nucleotidase.
Very sensitive and specific marker of liver
disease.
Hepatic synthesis of GGT is also induced
by drugs (especially barbiturates,
antidepressants and anticonvulsants) and
alcohol.
Serum GGT is increased not just in patients
with alcoholic liver disease, but also in
people who are heavy drinkers. 141
ACID PHOSPHATASE (ACP)
142
 Distribution
Prostate, lysosomes of all cells, red blood
cells (avoid hemolysis). Number and
genetics of isoenzymes not known, but at
least prostatic and red cell isoenzymes
exist.
Identify prostatic isoenzyme by L-tartrate
inhibitable activity.
ACP is temperature and pH labile. So,
specimens for enzyme assay should be
submitted on ice.
143
 Prostatic CA. High activity of ACP,
especially the prostatic isoenzyme,
indicates disseminated disease (usually
spreads to bone). CA-in-situ and benign
hypertrophy of the pr normal levels of
ACP. Recently, ACP assays have been
largely replaced by measurement of
prostate-specific antigen.
 2. Gaucher’s disease, bone destruction
by infection and neoplasia. Lysosomal
isoenzyme - tartrate insensitive, normal
RIA result. ostate usually have
144
AMYLASE
145
Distribution
 Amylase secreted by the pancreas and
salivary glands; also present in
Fallopian tubes and small intestine.
 Two common isoenzymes occur, a
pancreatic (P) and salivary (S) type,
which can be differentiated using a
wheat germ lectin which selectively
inhibits the S isoenzyme.
146
 Acute pancreatitis
an increase in total amylase, in the
appropriate clinical setting, is suggestive of
acute pancreatitis.
In cases of an acute abdomen,
determination of isoenzyme type is seldom
helpful - P isoenzyme is increased not only
in acute pancreatitis, but also in perforated
peptic ulcer and intestinal obstruction/
infarction
Amylase only remains elevated in the serum
for 3 to 4 days, but remains elevated in the
urine for longer (6 days). Levels of both 147
6/5/2024 148
sumit prajapati

Introduction to basic Chromatography.pptx

  • 1.
    6/5/2024 sumit prajapati1 Research Methodology: Separation Techniques
  • 2.
    CONTENTS  Introduction tochromatography  History  Principles  Importance  Chromatographic terms  Classification of chromatography  Adsorption chromatography  Partition chromatography  Gas-liquid phase chromatrography  Solid-liquid phase chromatrography  Liquid-gas phase chromatrography  Liquid-liquid phase chromatrography  Important properties of liquid phase  Conclusion 2
  • 3.
    Chromatography  Chromatography (fromGreek chroma "color and graphein "to write") is the collective term for a set of laboratory techniques for the separation of mixtures.  The mixture is dissolved in a fluid called the mobile phase, which carries it through a structure holding another material called the stationary phase.  The various constituents of the mixture travel at different speeds, causing them to separate. The separation is based on differential partitioning between the mobile and stationary phases. 3
  • 4.
    History  Chromatography, literally"color writing", was first employed by Russian scientist Mikhail Tsvet in 1900.  He continued to work with chromatography in the first decade of the 20th century, primarily for the separation of plant pigments such as chlorophyll, carotenes, and xanthophylls.  Since these components have different colors (green, orange, and yellow, respectively) they gave the technique its name. 4
  • 5.
    Principles  Chromatography usuallyconsists of mobile phase and stationary phase. The mobile phase refers to the mixture of substances to be separated dissolved in a liquid or a gas.  The stationary phase is a porous solid matrix through which the sample contained in the mobile phase percolates.  The interaction between the mobile phase and the stationary phase results in the separation of the compound from the 5
  • 6.
    Applications of chromatography  Thechromatographic technique is used for the separation of amino acids, proteins & carbohydrates.  It is also used for the analysis of drugs, hormones,vitamins.  Helpful for the qualitative & quantitative analysis of complex mixtures.  The technique is also useful for the determination of molecular weight of proteins. 6
  • 7.
    The chromatographic methodof separation, in general, involves following steps  Adsorption or retention of substances on the stationary phase  Separation of the adsorption of substances by the mobile phase  Recovery of the separated substances by a continuous flow of the mobile phase; the method being called elution  Qualitative and Quantitative analysis of the eluted substances 7
  • 8.
    Chromatographic terms  Theanalyte is the substance to be separated during chromatography.  A chromatogram is the visual output of the chromatograph.  The eluate is the mobile phase leaving the column.  The eluent is the solvent that carries the analyte  The detector refers to the instrument used for qualitative and quantitative detection of analytes after separation. 8
  • 9.
    Classification of chromatography 1.Based on mechanism of separation I. adsorption chromatography II. Partition chromatography 2. Based on phases I. Solid phase chromatography i. Solid-liquid chromatography ii. Solid-gas chromatography II. Liquid phase chromatography i. Liquid-liquid chromatography ii. Liquid –gas chromatography 3. Based on shape of chromatographic bed I. Planner chromatography i. Paper chromatography ii. Thin layer chromatography II. Column chromatography i. Packed column chromatography ii. Open tubular column chromatography 9
  • 10.
    Flow chart diagramof chromatography chromatography adsorption Competition between Solid and Gas (G.S.C.) Liquid Column chromatography Thin layer chromatography partition Competition between Liquid and Gas G.L.C. Liquid H.P.L.C. Column chromatography Paper chromatography TLC 10
  • 11.
    Adsorption chromatograohy  Itutilizes a mobile liquid or gaseous phase that is adsorbed onto the surface of a stationary solid phase  The equilibriation between the mobile and stationary phase accounts for the separation of different solutes.  Adsorption chromatography is process of separation of components in a mixture introduced into chromatography system based on the relative difference in adsorption of components to stationary phase present in chromatography column 11 sumit prajapati
  • 12.
    Partition chromatography  Thisform of chromatography is based on a thin film formed on the surface of a solid support by a liquid stationary phase  Solute equilibrates between the mobile phase and the stationary liquid.  Chromatography in which separation is based mainly on differences between the solubility of the sample components in the stationary phase or on differences between the solubility of the components in the mobile and stationary phases 12 sumit prajapati
  • 13.
    Gas-Solid chromatography(G.S.C.) Gas chromatographyemploys an inert gas as the mobile phase Separation depends on the relative partial pressures of the sample components above the stationary phase. Gas-solid chromatography is relatively rare, but it is used to separate atmospheric gases Common solids are charcoal, a synthetic zeolite called "molecular sieve", or a combination of the two. The mobile phase is a gas, often nitrogen, but sometimes helium, hydrogen or occasionally another gas. It is called the "carrier gas". 13
  • 14.
    Solid-Liquid chromatography Liquid chromatography(LC) is a separation technique in which the mobile phase is a liquid. Liquid chromatography can be carried out either in a column or a plane  In liquid-solid chromatography the porous adsorbent is polar and separation is based on the properties of classes of compounds—e.g., amines (alkaline) from alcohols (neutral) and esters (neutral) from acids The preferred mobile phase is a nonpolar or slightly polar... Popular adsorbents are Silica and Alumina. 14
  • 15.
    Liquid-Gas Chromatography  DimethylPolysiloxane (350oC) Hydrocarbons, Polynuclear aromatics Poly(phenyl methyl) siloxane (250oC) Steroids, Pesticides, Glycols Stationary phase used in (LGC) The mobile phase is an unreactive gas, such as nitrogen (the carrier gas) The stationary phase comprises of a small amount of liquid held on a finely-divided inert solid support. Gas-liquid chromatography is very sensitive and can be used to detect small quantities of substances it is often used in forensic tests 15
  • 16.
    Liquid-Liquid Chromatography  Liquid-liquidchromatography is a chromatography separation technique in which the mobile phase is a liquid (usually a solvent or a simple binary solvent mixture) and the stationary phase is also a liquid (which must be immiscible and insoluble in the liquid mobile phase).  The first liquid-liquid system was reported by A. J. P. Martin who used water supported on silica gel as the stationary phase and n-heptane as the mobile phase  The system is inherently unstable, as the stationary phase will always have some solubility in mobile phase 16
  • 17.
    Planner chromatography  Planarchromatography is a separation technique in which the stationary phase is present on a plane.  The plane can be a paper, serving as such or impregnated by a substance as the stationary bed (paper chromatography) or a layer of solid particles spread on a support such as a glass plate (Thin layer chromatography).  Different compounds in the sample mixture travel different distances according to how strongly they interact with the stationary phase as compared to the mobile phase.  The specific Retention factor (Rf) of each chemical can 17
  • 18.
    Column Chromatography  Columnchromatography is a separation technique in which the stationary bed is within a tube.  The particles of the solid stationary phase or the support coated with a liquid stationary phase may fill the whole inside volume of the tube (packed column) or be concentrated on or along the inside tube wall leaving an open, unrestricted path for the mobile phase in the middle part of the tube (open tubular column).  Differences in rates of movement through the medium are calculated to different retention times of the sample 18
  • 19.
    Important properties ofliquid stationary phase  Liquid phase should have low volatility and high stability at elevated temperatures  Liquid phase should not permeate too deeply into the fine pores of the support structure as slow diffusion in and out of pores affects column efficiency  Small particles of support give higher efficiency as HETP is proportional to particle diameter but particle size reduction increases back pressure  Support should be deactivated before use as undesirable surface impurities can cause decomposition of the sample or stationary liquid 19
  • 20.
    Conclusion  In overallranking Chromatography techniques , it can be judge SFC falls somewhere between HPLC or GC.  In field of pharmaceutical chemistry and bioanalytical application gained its applications 20
  • 21.
    Gel Filtration Gel permeationchromatography Size exclusion chromatography Separation of molecules on the basis of size (and shape)
  • 22.
    Theory Column matrix Porous beads Largemolecules are “excluded” from the pores and travel through the column fastest Small molecules are “included” – can diffuse into the pores and elute later
  • 23.
  • 24.
    Elution Profile Idealised ElutionProfile 0 0.5 1 1.5 2 2.5 1 3 5 7 9 0 . 1 1 1 3 1 5 1 7 1 9 2 1 2 3 2 5 Fraction number Amount Ve Ve Ve Ve = Elution volume (volume of solvent between injection and elution). Dictated by proportion of porous matrix available to molecules (Kd).
  • 25.
    Column Parameters Vs= volumeof solvent held in the pores. This is normally approximated to Vt-Vo = volume of beads Vo = void volume Vt = total volume Vo = Elution volume of a large “totally excluded” molecule such as blue dextran Vt = Physical volume of column
  • 26.
    Calculation of Ve Fora molecule that can partially enter the pores: Ve = Vo + Kd (Vs) or Ve = Vo + Kav (Vt-Vo) Kav = proportion of pores available to the molecule. Totally “exclude” Kav = 0 and Ve = Vo Totally “included” Kav = 1 and Ve = Vt
  • 27.
    Behaviour of Moleculeon any Column Kav = Ve – Vo Vt - Vo
  • 28.
    Resolution Resolution 0 0.5 1 1.5 2 2.5 1 2 34 5 6 7 8 9 10 11 12 13 Fraction number Amount Resolution proportional to square root of column length. Also affected by rate at which column is run
  • 29.
    Design of Column Column size ◦ Analytical or preparative  Solvent ◦ Inert matrix most solvents OK  Matrix ◦ Most important consideration ◦ Many different types  Material  Pore size
  • 30.
    Matrix Types Material  Sephacryl ◦dextran  Sephadex ◦ dextran  Sepherose ◦ agarose  Superdex ◦ mixture Sephacryl Protein (kD) Dextrans (kD) S-100 1-100 NS S-200 5-250 1-80 S-300 10-1500 2-400 S-400 20-8000 10-2000 S-500 NS 40-20,000
  • 31.
    Running the column Sample size / Fraction size ◦ 0.5 – 5% of total bed volume (Vt). ◦ Concentration limited by viscosity  Running time ◦ Determined by “trial and error” ◦ Slow rates allow efficient partitioning into pores and thus increase resolution ◦ Slow rates increase diffusion of sample on column thus increasing peak width and reducing resolution. ◦ Protein about 5mL cm-2. h-1
  • 32.
    Types of ColumnSystems  Liquid Chromatography  High Performance Liquid Chromatography (HPLC)
  • 33.
    Determination of MolecularWeight  Calibrate column with known standards  Plot Kav against lg Mol Wt Calibration curve 0 0.1 0.2 0.3 0.4 0.5 0.6 0.7 0.8 0.9 1 4 4.5 5 5.5 6 Lg Mol Wt Kav
  • 34.
    Other Types ofColumn Chromatography  Ion-Exchange Chromatography ◦ Separation on basis of charge  DEAE- sephadex  Hydrophobic Interaction Chromatography ◦ Separation on basis of hydrophobicity  Phenyl-sepherose  Affinity Chromatography ◦ Affinity of enzyme for substrate or other ligand
  • 35.
  • 36.
    Principle…… Different affinity ofthe different components to stationary phase causes the separation
  • 37.
    Ion Exchange Chromatography Ionexchange chromatography -- is a separation based on charge Used for almost any kind of charged molecules --- large proteins, small nucleotides and amino acids Ion-exchange chromatography preserves analyte molecules on the column based on ionic interactions Mobile phage – buffer, pH and salt concentration--- opposite charged solute ions attracted to the stationary phage by electrostatic force Stationary phage– resin is used to covalently attach anions or cations onto it
  • 39.
    Principle………. Ion Exchange Chromatographyrelies on charge-charge interactions between the proteins
  • 40.
    Types of IEC…. anionexchangers cation exchangers
  • 41.
    Cation exchange chromatography ---positivelycharged molecules are attracted to a negatively charged solid support. Commonly used cation exchange resins are S-resin, sulfate derivatives; and CM resins, carboxylate derived ions
  • 42.
    Anion exchange chromatography ---negativelycharged molecules is attracted to a positively charged solid support. Commonly used anion exchange resins are Q-resin, a Quaternary amine; and DEAE resin, DiEthylAminoEthane
  • 43.
    Buffers Used InIEC Buffer system 1 : Buffer A = 20 mM Tris, pH=8. Buffer B = 20 mM Tris, 1 M NaCl, pH=8.0 Buffer system 2: (Common CEC buffer system): Buffer A = 30 mM sodium acetate, pH=4.5. Buffer B = 30 mM sodium acetate, 1 M NaCl, pH=4 Buffer system 3: (AEC for proteins which are very insoluble or have a very high pI) Buffer A = 30 mM Ethanolamine, 8M urea, pH=10.0 Buffer B = 30 mM Ethanolamine, 8M urea, 1 M NaCl, pH=10.0
  • 45.
    Chromatography Methods Column washedwith buffer A to equilibrate Buffer B is used to equilibrate again Equilibrate the column with buffer A Sample loading Flow through collection Elute protein
  • 46.
    Advantages It is anon-denaturing technique. It can be used at all stages and scales of purification An IEX separation can be controlled by changing pH, salt concentration and/or the ion exchange media It can serve as a concentrating step. A large volume of dilute sample can be applied to a media, and the adsorbed protein subsequently eluted in a smaller volume It offers high selectivity; it can resolve molecules with small differences in charge.
  • 47.
    Disadvantages costly equipment andmore expensive chemicals turbidity should be below 10ppm Conclusion Ion exchange chromatography is more efficient than other chromatography. It could be widely used for commercial purposes.
  • 48.
  • 49.
    Introduction  HPLC isa form of liquid chromatography used to separate compounds that are dissolved in solution. HPLC instruments consist of a reservoir of mobile phase, a pump, an injector, a separation column, and a detector.  Compounds are separated by injecting a sample mixture onto the column. The different component in the mixture pass through the column at differentiates due to differences in their partition behavior between the mobile phase and the stationary phase. The mobile phase must be degassed to eliminate the formation of air bubbles.
  • 50.
  • 51.
    FOUR TYPES OFLIQUID CHROMATOGRAPHY  Partition chromatography  Adsorption, or liquid-solid  Ion exchange chromatography  Size exclusion, or gel, chromatography
  • 52.
    COMPOSITION OF ALIQUID CHROMATOGRAPH SYSTEM  Solvent  Solvent Delivery System (Pump)  Injector  Sample  Column  Detectors (Diode Array)  Waste Collector  Recorder (Data Collection)
  • 53.
    Picture of HPLCinstrument
  • 54.
    Uses of HPLC This technique is used for chemistry and biochemistry research analyzing complex mixtures, purifying chemical compounds, developing processes for synthesizing chemical compounds, isolating natural products, or predicting physical properties. It is also used in quality control to ensure the purity of raw materials, to control and improve process yields, to quantify assays of final products, or to evaluate product stability and monitor degradation.  In addition, it is used for analyzing air and water pollutants, for monitoring materials that may jeopardize occupational safety or health, and for monitoring pesticide levels in the environment. Federal and state regulatory agencies use HPLC to survey food and drug products, for identifying confiscated narcotics or to check for adherence to label claims.
  • 55.
    HPLC Chromatograph injectors  Thefunction of the injector is to place the sample into the high-pressure flow in as narrow volume as possible so that the sample enters the column as a homogeneous, low-volume plug. To minimize spreading of the injected volume during transport to the column, the shortest possible length of tubing should be used from the injector to the column.  When an injection is started, an air actuator rotates the valve: solvent goes directly to the column; and the injector needle is connected to the syringe. The air pressure lifts the needle and the vial is moved into position beneath the needle. Then, the needle is lowered to the vial.
  • 56.
    HPLC columns  Thecolumn is one of the most important components of the HPLC chromatograph because the separation of the sample components is achieved when those components pass through the column. The High performance liquid chromatography apparatus is made out of stainless steel tubes with a diameter of 3 to 5mm and a length ranging from 10 to 30cm.  Normally, columns are filled with silica gel because its particle shape, surface properties, and pore structure help to get a good separation. Silica is wetted by nearly every potential mobile phase, is inert to most compounds and has a high surface activity which can be modified easily with water and other agents. Silica can be used to separate a wide variety of chemical compounds, and its chromatographic behavior is generally predictable and reproducible.
  • 57.
    Picture of anHPLC column
  • 58.
    WHAT AFFECTS SYSTEM ColumnParameters  Column Material  Deactivation  Stationary Phase  Coating Material Instrument Parameters  Temperature  Flow  Signal  Sample Sensitivity  Detector
  • 59.
    WHAT AFFECTS SYSTEM SampleParameters  Concentration  Matrix  Solvent Effect  Sample Effect
  • 60.
    Several column types (canbe classified as )  Normal phase  Reverse phase  Size exclusion  Ion exchange
  • 61.
    Normal phase  Inthis column type, the retention is governed by the interaction of the polar parts of the stationary phase and solute. For retention to occur in normal phase, the packing must be more polar than the mobile phase with respect to the sample
  • 62.
    Reverse phase  Inthis column the packing material is relatively nonpolar and the solvent is polar with respect to the sample. Retention is the result of the interaction of the nonpolar components of the solutes and the nonpolar stationary phase. Typical stationary phases are nonpolar hydrocarbons, waxy liquids, or bonded hydrocarbons (such as C18, C8, etc.) and the solvents are polar aqueous-organic mixtures such as methanol-water or acetonitrile-water.
  • 63.
    Size exclusion  Insize exclusion the HPLC column is consisted of substances which have controlled pore sizes and is able to be filtered in an ordinarily phase according to its molecular size.  Small molecules penetrate into the pores within the packing while larger molecules only partially penetrate the pores. The large molecules elute before the smaller molecules.
  • 64.
    Ion exchange  Inthis column type the sample components are separated based upon attractive ionic forces between molecules carrying charged groups of opposite charge to those charges on the stationary phase.  Separations are made between a polar mobile liquid, usually water containing salts or small amounts of alcohols, and a stationary phase containing either acidic or basic fixed sites.
  • 65.
    Selectivity Factor  K’values tell us where bands elute relative to the void volume. These values are unaffected by such variables as flow rate and column dimensions. The value tell us where two peaks elute relative to each other. This is referred to as the selectivity factor or separation factor (now and then as the chemistry factor).
  • 66.
    Types of LiquidColumn Chromatography (LCC)  LLC (Liquid Liquid)  LSC (Liquid Solid - adsorption)  SEC (Size Exclusion)  GLC GSC  SFC (Supercritical Fluid)
  • 67.
    Types of Detectors Absorbance (UV with Filters, UV with Monochromators)  IR Absorbance  Fluorescence  Refractive-Index  Evaporative Light Scattering Detector (ELSD)  Electrochemical  Mass- Spectrometric  Photo-Diode Array
  • 68.
    EVALUATION PARAMETERS  EFFICIENCY  RESOLUTION INERTNESS  RETENTION INDEX  COLUMN BLEED  CAPACITY FACTOR
  • 69.
    Electrophoresis • Electrophoresis isthe migration of charged molecules,particles or ion in a liquid medium under the influence of an electric field • Various types – defined by support used 1. Paper – amino acids, small peptides 2. Polyacrylamide – Proteins, small DNA/RNA (<500bp) 3. Agarose – DNA/RNA • Good preparative and analytical method
  • 70.
    From large tosmall and simple
  • 71.
    Principle Proteins move inthe electric field. Their relative speed depends on the charge, size, and shape of the protein
  • 72.
    instrumentation and reagents: (1)Two buffer boxes contain the buffer used in the process. (2) Each buffer box contains an electrode made of either platinum or carbon, the polarity of which is determined by the mode of connection to the power supply. (3)The electrophoresis support on which separation takes place may contact the buffer directly, or by means of wicks (4)The entire apparatus is covered to minimize evaporation and protect the system (5) The power supply to provide electrical power. Technique of electrophoresis
  • 73.
    General operations performedin conventional electrophoresis include: (1) separation (2) staining (3) detection (4) Quantification General Procedure
  • 74.
    SAMPLE APPLICATION : Thesample may be applied as a spot (about 0.5 cm in diameter) or as a uniform streak. ELECTROPHORETIC RUN: The current is switched on after the sample has been applied to the paper and the paper has been equilibrated with the buffer. .The types of buffer used depends upon the type of separation. Once removed, the paper is dried in vacuum oven. DETECTION AND QUANTITATIVE ASSAY: To identify unknown components in the resolved mixture the electrophoretogram may be compared with another electrophoretogram on which standard components have been electrophoresced under identical conditions. Physical properties like fluorescence, ultraviolet absorption or radioactivity are exploited for detection.
  • 75.
  • 76.
  • 77.
  • 78.
  • 79.
  • 80.
  • 81.
    Types of ELECTROPHORESIS Zoneelectrophoresis Slab Gel Electrophoresis Disc electrophoresis lsoelectric Focusing electrophoresis Two-Dimensional (2D) Electrophoresis Capillary electrophorsis Microship electrophorsis
  • 82.
    A simplified schematicdrawing of a protein pattern separated by cellulose acetate paper electrophoresis
  • 83.
    What is agel? Gel is a cross linked polymer whose composition and porosity is chosen based on the specific weight and porosity of the target molecules. Types of Gel:  Agarose gel.  Polyacrylamide gel. GEL ELECTROPHORESIS
  • 84.
    Gel Electrophoresis • Gelelectrophoresis uses a cross-linked polymers (agarose) that contain various pores. • Pores allow molecular sieving, where molecules e.g. DNA, can be separated based upon there mobility through the gel.
  • 85.
     A highlypurified uncharged polysaccharide derived from agar.  Used to separate macromolecules such as nucleic acids, large proteins and protein complexes.  It is prepared by dissolving 0.5% agarose in boiling water and allowing it to cool to 40°C.  It is fragile because of the formation of weak hydrogen bonds and hydrophobic bonds. AGAROSE GEL
  • 86.
     Used toseparate most proteins and small oligonucleotides because of the presence of small pores. POLYACRYLAMIDE GEL
  • 87.
     Detection 1. Dyee.g. ethidium bromide 2. Audioradiography 32P, 3. Blotting (see later)  Uses 1. Analytical- Can determine size of DNA fragment, 2. Preparative – Can identify a specific fragment based on size DNA Gel Electrophoresis
  • 88.
  • 89.
    Example of silverstained gel Silver staining is usually 10-100 times more sensitive than Coomassie Blue staining, but it is more complicated. Faint but still visible bands on this gel contain less than 0.5 ng of protein!
  • 90.
     Electrophoretic methodthat separates proteins according to the iso-electric points  Is ideal for seperation of amphoteric substances  Seperation is achieved by applying a potential difference across a gel that contain a pH gradient  Isoelectric focusing requires solid support such as agarose gel and polyacrylamide gel ISOELECTRIC FOCUSING
  • 91.
    IEF Separates proteins bytheir isoelectric points (pI) Each protein has own pI = pH at which the protein has equal amount of positive and negative charges (the net charge is zero)
  • 92.
    IEF example Zavialov A. IEF4-6.5 pH gradient
  • 93.
    IEF Mixtures of ampholytes,small amphoteric molecules with high buffering capacity near their pI, are used to generate the pH gradient. Positively and negatively charged proteins move to – and +, respectively, until they reach pI. PI of proteins can be theoretically predicted. Therefore, IEF can also be used for protein identification.
  • 95.
  • 96.
     Using specificprobes that are labelled specific sequences of DNA can be identified.  There are three main hybridization techniques which vary in the sample blotted and the probes used; 1. Northern Blot-Transfer of an RNA sample separated and identified using DNA or RNA probes. 2. Southern Blot-Transfer of an DNA sample separated and identified using DNA or RNA probes. 3. Western Blot- Transfer of an Protein sample separated and identified typically using an antibody. Blotting Techniques
  • 97.
     Blotting –Transfer of DNA, RNA or Proteins, typically from a electrophoresis gel to a membrane e.g. nitrocellulose. This membrane can then be subject to further techniques such as hybridization.  Hybridization – Process where two complementary single strands of nucleic acid (DNA or RNA) form a double helix. Blotting Techniques
  • 98.
    Western Blotting (WB) WBis a protein detection technique that combines the separation power of SDS PAGE together with high recognition specificity of antibodies An antibody against the target protein could be purified from serum of animals (mice, rabbits, goats) immunized with this protein Alternatively, if protein contains a commonly used tag or epitope, an antibody against the tag/epitope could be purchase from a commercial source (e.g. anti-6 His antibody)
  • 99.
    WB: 4 steps 1.Separation of proteins using SDS PAGE 2. Transfer of the proteins onto e.g. a nitrocellulose membrane (blotting) 3. Immune reactions 4. Visualization
  • 100.
    WB, Step 2:Blotting
  • 101.
    WB, Steps 3-4:Detection
  • 102.
     This techniquecombines the technique IEF (first dimension), which separates proteins in a mixture according to charge (PI), with the size separation technique of SDS-PAGE second dimension).  The combination of these two technique to give two-dimension(2-D)PAGE provides a highly sophisticated analytical method for analysing protein mixtures. TWO-DIMENSIONAL ELECTROPHORESIS
  • 104.
     Using thismethod one can routinely resolve between 1000 and 3000 proteins from a cell or tissue extract and in some cases workers have reported the separation of between 5000 and 10000 proteins.  The result of this is a gel with proteins spread out on its surface. These proteins can then be detected by a variety of means, but the most commonly used stains are silver and coomasie staining.
  • 105.
  • 106.
     In CE,the classic techniques of electrophoresis are carried out in a small-bore, fused silica capillary tube, the outer diameter of such tubes typically varies from 180 to 375 micrometer, the inner diameter from 20 to 180 micrometer, and the total length from 20 cm up to several meters. This capillary tube serves as a capillary electrophoretic chamber that is connected to a detector at its terminal end and, via buffer reservoirs, to a high-voltage power supply  The main advantage of CE comes from efficient heat dissipation compared with traditional electrophoresis. Improved heat dissipation permits the application of voltages in the range of 20 to 30 kV, which enhances separation efficiency and reduces separation time in some cases to less than 1 minute Capillary electrophoresis
  • 107.
  • 108.
    1. Discontinuities insample application: may be due to dirty applicators, which are best cleaned by agitating in water followed by gently pressing the applicators against absorbent paper. Caution must be used, and it is inadvisable to clean wires or combs by manual wiping. 2. Unequal migration of samples across the width of the gel may be due to dirty electrodes causing uneven application of the electrical field or to uneven wetting of the gel. 3. Distorted protein zones may be due to A.bent applicators. B.incorporation of an air bubble during sample application. C.over application of sample. D.excessive drying of the electrophoretic support before or during electrophoresis. The following problems may be encountered when peforming gel electrophoresis.
  • 109.
    4. Irregularities (otherthan broken zones) in sample application probably are due to excessively wet agarose gels. Parts of the applied samples may look washed out. 5. Unusual bands are usually artifacts that may be easily recognized. 6. Atypical bands in an isoenzyme pattern may be the result of binding by an immunoglobulin. An irregular, but sharp protein zone at the starting point that lacks the regular, somewhat diffuse appearance of proteins may actually be denatured protein resulting from a deteriorated serum.
  • 110.
  • 111.
    Isozymes (also knownas isoenzymes) are enzymes that differ in amino acid sequence but catalyze the same chemical reaction. These enzymes usually display different kinetic parameters (e.g. different Km values), or different regulatory properties. Catalyze the same reactions but are formed from structurally different polypeptides. They perform the same catalytic function. Various isoenzymes of an enzyme can differ in three major ways: 1. Enzymatic properties 2. Physical properties (e.g. heat stability) 3. Biochemical properties such as amino 111
  • 112.
    Lactate dehydrogenase (LDH) Pyruvate→ Lactate (anaerobic glycolysis)  LDH is elevated in myocardial infarction, blood disorders  It is a tetrameric protein and made of two types of subunits namely H = Heart, M = skeletal muscle  It exists as 5 different isoenzymes with various combinations of H and M subunits 112
  • 113.
    Isoenzyme name Composition Present inElevated in LDH1 ( H4) HHHH Myocardium, RBC myocardial infarction LDH2 (H3M1) HHHM Myocardium, RBC LDH3 (H2M2) HHMM Kidney, Skeletal muscle LDH4 (H1M3) HMMM Kidney, Skeletal muscle LDH5 (M4) MMMM Skeletal muscle, Liver Skeletal muscle and liver diseases 113
  • 114.
    Creatine Kinase (CK) Creatine+ ATP → phosphocreatine + ADP  (Phosphocreatine – serves as energy reserve during muscle contraction)  Creatine kinase is a dimer made of two monomers occurs in the tissues.  Skeletal muscle contains M subunit, Brain contains B subunits.  Three different isoenzymes are formed. 114
  • 115.
    Isoenzyme name CompositionPresent in Elevated in CK-1 BB Brain CNS diseases CK-2 MB Myocardium/ Heart Acute myocardial infarction CK-3 MM Skeletal muscle, Myocardium 115
  • 116.
    Allosteric modulation  Allostericsites are sites on the enzyme that bind to molecules in the cellular environment.  The sites form weak, noncovalent bonds with these molecules, causing a change in the conformation of the enzyme.  This change in conformation translates to the active site, which then affects the reaction rate of the enzyme.  Allosteric interactions can both inhibit and activate enzymes and are a common way that enzymes are controlled in the body. 116
  • 117.
  • 118.
  • 119.
    Serum enzymes increasesmay be due to:-  Cell death - this results in a small short-lived increase (e.g., following myocardial infarction).  Increased cell membrane permeability in living cells (due to hypoxia, inflammation, drugs/poisons, cellular swelling) gives rise to a large protracted increase in serum enzymes as there is ongoing enzyme synthesis (e.g., Duchenne muscular dystrophy, acute viral hepatitis).  Increased synthesis in a specific cell type (e.g., gamma glutamyl transferase in liver cells is induced by alcohol or anticonvulsant drugs, alkaline phophatase in liver cells is induced by obstruction, lactate dehydrogenase is induced in 119
  • 120.
    CAUSES OF CELLDAMAGE OR DEATH 120
  • 121.
  • 122.
    Important in tissueswhere significant metabolic energy is stored as creatine phosphate. Distribution : skeletal muscle, heart, brain. Isoenzyme composition : CK is a dimer consisting of sub-units M or B coded by two distinct genes. Thus 3 possible isoenzymes - M M ; M B ; B B Skeletal muscle - all MM; Heart - 80% MM, 20% MB; Brain - all BB. Normal pattern in serum - predominantly MM present, with MB < 6% of total CK. 122
  • 123.
     Myocardial infarction Earlyincrease of total CK, specifically the MB isoenzyme. Total CK levels start to rise at about 6 hours , peak at 18 to 30 hours, and return to normal by 3 days. If total CK raised, measurement of CK-MB is indicated. CK-MB levels may be raised by 4 hours, are almost certain to be raised by 12 hours, and may return to normal by 24 hours after MI. Used as a diagnostic test before 24 hours, and as a prognostic indicator (amount of 123
  • 124.
     Skeletal muscledamage e.g., trauma, surgery (especially in cardiac surgery), over-exercise, convulsions, ischaemia, inflammation (myositis), malignant hyperthermia, congenital muscular dystrophy. increase of total CK, but MB isoenzyme not increased. In neurogenic muscle disease, e.g., poliomyelitis and Parkinsonism, CK levels are normal. In Duchenne Muscular Dystrophy, CK elevation precedes onset of symptoms by years, and falls as disease progresses. In chronic muscle disease there is reversion to the foetal isoenzyme pattern (MB appears in skeletal muscle and serum).  Hypothyroidism is associated with high total CK levels. 124
  • 125.
  • 126.
    Important in thedisposal of glycolytically generated NADH, particularly when mitochondrial disposal is impaired by hypoxia. Distribution: ubiquitous, including heart, skeletal muscle, liver and RBCs - specificity is improved by isoenzyme analysis. LD is a tetramer consisting of sub-units H or M coded by two different genes. 126
  • 127.
     Anoxic tissues(liver, muscle) express M subunit, thus LD5 predominates.  Erythrocyte precursors and heart express the H subunit, hence LD1 predominates in these tissues.  Normal pattern in serum - predominantly LD2, with slightly less LD1, and even less LD3, LD4 and LD5. 127
  • 128.
     Myocardial infarction- late and long- lasting increase in total LD. Total LD levels start to rise at about 8 to 12 hours, peak at 24 to 48 hours and return to normal by 10 days. The predominant isoenzyme is LD1, which is present in greater concentration than the normal LD2 (flipped pattern).  Liver damage, including viral or toxic hepatitis (ethanol, paracetamol overdose, carbon tetrachloride), cardiac failure (liver congestion) - increase in total LD, 128
  • 129.
    Hematological disorders -often isolated elevation in total LD. Due to breakdown of circulating red cells or red cell precursors in bone marrow.  Intra-vascular (or in vitro) haemolysis, e.g., due to an auto-immune disorder, prosthetic heart valve, inherited enzyme deficiency (G6PD, PK) - both LD1 and LD2 increased. Associated features include elevated serum unconjugated bilirubin, increased urine and stool urobilinogen, and decreased haptoglobin.  Megaloblastic anaemia due to folate or vitamin B12 deficiency : failure of cell division leads to cell lysis and enzyme release from the bone marrow - predominant increase in LD1 (as in myocardial infarction). Extremely high levels 129
  • 130.
    Malignant tumours maymanifest an isolated increase in serum LD due to enhanced synthesis of glycolytic enzymes by a wide variety of neoplasms (even measured in aqueous humour to diagnose retinoblastoma). Typically centripetal isoenzyme pattern (LD2, LD3 and LD4) due to expression of both subunits (H and M). An exception is seen in germ cell tumours which show an increase in LD1. 130
  • 131.
  • 132.
    ASPARTATE TRANSAMINASE (AST) (aspartate+α-ketoglutarate -----> oxaloacetate + glutamate). ALANINE TRANSAMINASE (ALT) (alanine + α-ketoglutarate -----> pyruvate + glutamate). Wide distribution in tissues, including liver, skeletal muscle, heart, kidney and RBCs. Cofactor vitamin B6 (pyridoxine) - carries amino acid intermediates. 132
  • 133.
    Acute hepatitis -high, sustained elevations of both ALT and AST (up to 100 x normal). ALT higher especially in mild injury; precedes onset of jaundice (allows early diagnosis. Disproportionate AST elevation indicates liver cell necrosis (involving mitochondria) or ethanol induced damage (acetaldehyde formed during ethanol metabolism depletes cytosolic pyridoxine, hence ALT activity selectively lost). Myocardial infarction - AST elevation of 5 - 10 x normal. AST levels start to rise at about 6 to 8 hours, peak at 18 to 24 hours and return to normal by 4 to 5 days. ALT hardly increases at all. AST always greater than ALT (de Ritis quotient AST/ALT > 5. In liver disease this ratio is usually < 1). 133
  • 134.
  • 135.
    Located in membranes,specifically the brush borders of the PCT of the kidney, the small intestinal mucosa, both the sinusoidal and canalicular surfaces of the hepatocyte, in osteoblasts in bone and in the placenta. Important in the formation of new bone by osteoblasts. Normal level in serum is determined by age and sex, reflecting periods of active bone growth, i.e., very high in young children. Normal pattern in children is preponderance of bone isoenzyme, while in adults liver isoenzyme predominates. 135
  • 136.
    Bone disease Reflects increasedosteoblastic activity i.e., bone synthesis. High levels of total ALP, due to increased bone isoenzyme, seen in: • active bone growth (young children, at puberty, healing fractures). • Primary bone tumours (osteogenic sarcoma). • secondary tumours evoking a sclerotic response e.g., prostatic and breast metastases. • Rickets (children) and osteomalacia (adults). • long-standing primary or secondary hyperparathyroidism (e.g., chronic renal disease where calcium is resorbed from 136
  • 137.
    Liver disease Classic markerof cholestasis due to extra- hepatic (gallstones) or intra-hepatic (drugs, inflammation) obstruction. Synthesis of liver isoenzyme induced by biliary obstruction - differentiates obstruction from hepatocellular damage. Elevated liver ALP without jaundice suggests :  Intermittent or incomplete obstruction (gallstone).  Intra-hepatic space-occupying mass (tumour). 137
  • 138.
     Placental isoenzyme isfound in the serum in late pregnancy and remains elevated a week or two after delivery. 138
  • 139.
  • 140.
    γ-glutamyl-N-donor + acceptor--> γ- glutamyl-N-acceptor + donor. Distribution : It present in all cells except muscle. Located in cell membranes and endoplasmic reticulum of hepatocytes. Role: Synthesis of reduced glutathione (GSH) required for drug detoxification e.g., paracetamol. Normal level in serum derived from liver. 140
  • 141.
    Hepatic synthesis ofGGT is induced by biliary obstruction. Serum levels correlate with liver ALP and 5’ nucleotidase. Very sensitive and specific marker of liver disease. Hepatic synthesis of GGT is also induced by drugs (especially barbiturates, antidepressants and anticonvulsants) and alcohol. Serum GGT is increased not just in patients with alcoholic liver disease, but also in people who are heavy drinkers. 141
  • 142.
  • 143.
     Distribution Prostate, lysosomesof all cells, red blood cells (avoid hemolysis). Number and genetics of isoenzymes not known, but at least prostatic and red cell isoenzymes exist. Identify prostatic isoenzyme by L-tartrate inhibitable activity. ACP is temperature and pH labile. So, specimens for enzyme assay should be submitted on ice. 143
  • 144.
     Prostatic CA.High activity of ACP, especially the prostatic isoenzyme, indicates disseminated disease (usually spreads to bone). CA-in-situ and benign hypertrophy of the pr normal levels of ACP. Recently, ACP assays have been largely replaced by measurement of prostate-specific antigen.  2. Gaucher’s disease, bone destruction by infection and neoplasia. Lysosomal isoenzyme - tartrate insensitive, normal RIA result. ostate usually have 144
  • 145.
  • 146.
    Distribution  Amylase secretedby the pancreas and salivary glands; also present in Fallopian tubes and small intestine.  Two common isoenzymes occur, a pancreatic (P) and salivary (S) type, which can be differentiated using a wheat germ lectin which selectively inhibits the S isoenzyme. 146
  • 147.
     Acute pancreatitis anincrease in total amylase, in the appropriate clinical setting, is suggestive of acute pancreatitis. In cases of an acute abdomen, determination of isoenzyme type is seldom helpful - P isoenzyme is increased not only in acute pancreatitis, but also in perforated peptic ulcer and intestinal obstruction/ infarction Amylase only remains elevated in the serum for 3 to 4 days, but remains elevated in the urine for longer (6 days). Levels of both 147
  • 148.