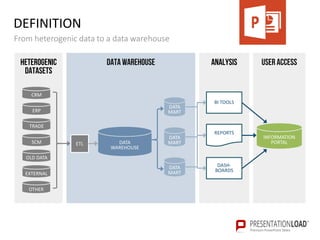
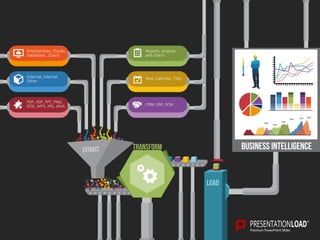
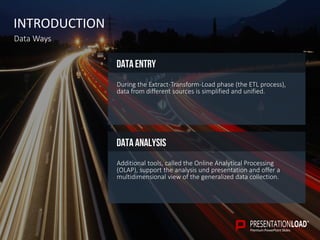
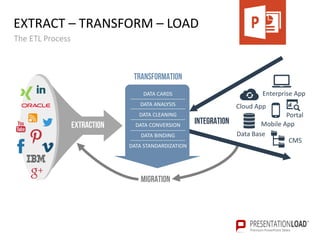
PREMIUM POWERPOINT SLIDES
Data warehouse
DATA WAREHOUSEPOWERPOINT TEMPLATE
In god we trust
– all others bring data.
Dr. Deodatta V. Shenai-Khatkhate
(Chemist)
DEFINITION
From heterogenic data to a data warehouse
Heterogenic
Datasets
Data Warehouse Analysis User access
CRM
ERP
TRADE
OLD DATA
SCM
EXTERNAL
OTHER
DATA
WAREHOUSE
DATA
MART
DATA
MART
DATA
MART
ETL
BI TOOLS
DASH-
BOARDS
REPORTS
INFORMATION
PORTAL
APPLICATION AREAS
Implementation Examples
correlations
Investigate invisible
correlations of diverse
data.
evaluation
Cross-format evaluation
of varying data sources.
Processes
Examine different reports
over predefined time
periods.
ANALYSIS
Quick delivery of analyses
to exemplify, for instance,
supply and demand key
data.
Publication
Prepare information and
provide to publish.
Data is the foundation of Digital
Business. Every touch point, every
click, every byte of digital exhaust.
R “Ray” Wang
(CEO Constellation Research Inc.)
transform
load
Smartphones, Clouds,
Databases, Charts
External, Internal
Other
PDF, ASP, PPT, PNG,
DOC, MP3, JPG, JAVA
Reports, analysis
and charts
Mail, Calendar, Files
CRM, ERP, SCM
1
2
3
4
5
6
BUSINESS INTELLIGENCE
DATA WAREHOUSE
EXAMPLES
INTRODUCTION
Data Ways
Data analysis
Additional tools, called the Online Analytical Processing
(OLAP), support the analysis und presentation and offer a
multidimensional view of the generalized data collection.
Data entry
During the Extract-Transform-Load phase (the ETL process),
data from different sources is simplified and unified.
EXTRACT – TRANSFORM – LOAD
The ETL Process
MIGRATION
INTEGRATION
Enterprise App
Data Base
Cloud App
Mobile App
Portal
CMS
Extraction
DATA CARDS
DATA ANALYSIS
DATA CLEANING
DATA CONVERSION
DATA BINDING
DATA STANDARDIZATION
tRANSFORMATION
A particular part of the heterogeneous data sources is extracted and stored. The sources
originate from different information structures and include diverse datatypes.
EXTRACTION
Reading Data
TRANSFORMATION
Syntactical
Data is customized in a particular
format (such as the date format).
Semantic
Content is examined and modified –
beginning with an adaptation of
data codes (such as tax control
characteristics: tax class 1, tax
allowance 2000 -> C1/ A2000) and
continuing with the accumulation of
additional information (such as an
internal identification number).
Types
MULTIDIMENSIONAL DATA SPACE
The Data Warehousing Concept
Sales
of locks in Cologne (April)
location Dimension
Time Dimension
Product Dimension
Classification level
Sales
of bells in Mainz (February)
ONLINE ANALYTICAL PROCESSING
The OLAP System
Interactive
The user has quick and
interactive access to
accumulated data and
will receive a decision-
supporting analysis result.
TOOLS
Based on this is a
comprehensive
toolset to analyze the
data room (also called
Business Intelligence
System). A CMS can be
also used.
MODEL
The Online Analytical
Processing is based on
the multidimensional
data room model.
ONLINE ANALYTICAL PROCESSING
Practical example
Then it can zoom in/ zoom out and examine the development within
one day or during the last five years.5
It can also combine different dimensions and analyze the sell-off within
a specific time frame in a specific shop.4
The company can observe the sales development of a particular product
during the last year.3
Products, the time dimension and the shops have to be linked to each
other. This means that the OLAP cube combines three dimensions/axes
(more than three axes are possible).
2
A company sells various products and has various shops in different cities.
The sales manager wants to know how many products per shop were sold
last year.
1
DATA MART
DATA MART
Advantages
Reduction of costs
In comparison to the
implementation of an entire data
warehouse, costs are reduced.
Access limitation
Access is limited to certain users.
Independencyof users
Separation of other areas,
independent mobility.
PERFORMANCEimprovement
Performance by a different
computer system, reduction of
data volume, lower number of
users.
Data protection
Solves data protection issues.
Data structure
The same database with different
data structures is used for
particular purposes.
Easy access
Better access
to required data.
DATA MINING
DATA MINING
World-Wide Data Streams
2018
World-wide data
doubles every two
years.
2008
World-wide data
doubles every other
year.
2014
Rising market
(India, China)
produce two thirds
of the world-wide
data.
2020
The data volume is
double as high as
2014.
40000
30000
20000
10000
2008 2010 2012 2014 2016 2018 2020
DATA MINING
Summary
The general process creates
a tighter, reduced and less
complex data room to
eliminate duplicates, outliers
and extracted models of the
database.
Reduction Data analysis Visual REPORTING
The end of data mining is
the reduction of data to a
well-structured data analysis
adjusted to user
requirements.
The database can be better
used for visual illustrations
and targeted reporting.
Click here to visit www.PresentationLoad.com
DOWNLOAD POWERPOINT SLIDES

Data Warehouse

  • 1.
  • 2.
  • 3.
    In god wetrust – all others bring data. Dr. Deodatta V. Shenai-Khatkhate (Chemist)
  • 4.
    DEFINITION From heterogenic datato a data warehouse Heterogenic Datasets Data Warehouse Analysis User access CRM ERP TRADE OLD DATA SCM EXTERNAL OTHER DATA WAREHOUSE DATA MART DATA MART DATA MART ETL BI TOOLS DASH- BOARDS REPORTS INFORMATION PORTAL
  • 5.
    APPLICATION AREAS Implementation Examples correlations Investigateinvisible correlations of diverse data. evaluation Cross-format evaluation of varying data sources. Processes Examine different reports over predefined time periods. ANALYSIS Quick delivery of analyses to exemplify, for instance, supply and demand key data. Publication Prepare information and provide to publish.
  • 6.
    Data is thefoundation of Digital Business. Every touch point, every click, every byte of digital exhaust. R “Ray” Wang (CEO Constellation Research Inc.)
  • 7.
    transform load Smartphones, Clouds, Databases, Charts External,Internal Other PDF, ASP, PPT, PNG, DOC, MP3, JPG, JAVA Reports, analysis and charts Mail, Calendar, Files CRM, ERP, SCM 1 2 3 4 5 6 BUSINESS INTELLIGENCE
  • 8.
  • 9.
    INTRODUCTION Data Ways Data analysis Additionaltools, called the Online Analytical Processing (OLAP), support the analysis und presentation and offer a multidimensional view of the generalized data collection. Data entry During the Extract-Transform-Load phase (the ETL process), data from different sources is simplified and unified.
  • 10.
    EXTRACT – TRANSFORM– LOAD The ETL Process MIGRATION INTEGRATION Enterprise App Data Base Cloud App Mobile App Portal CMS Extraction DATA CARDS DATA ANALYSIS DATA CLEANING DATA CONVERSION DATA BINDING DATA STANDARDIZATION tRANSFORMATION
  • 11.
    A particular partof the heterogeneous data sources is extracted and stored. The sources originate from different information structures and include diverse datatypes. EXTRACTION Reading Data
  • 12.
    TRANSFORMATION Syntactical Data is customizedin a particular format (such as the date format). Semantic Content is examined and modified – beginning with an adaptation of data codes (such as tax control characteristics: tax class 1, tax allowance 2000 -> C1/ A2000) and continuing with the accumulation of additional information (such as an internal identification number). Types
  • 13.
    MULTIDIMENSIONAL DATA SPACE TheData Warehousing Concept Sales of locks in Cologne (April) location Dimension Time Dimension Product Dimension Classification level Sales of bells in Mainz (February)
  • 14.
    ONLINE ANALYTICAL PROCESSING TheOLAP System Interactive The user has quick and interactive access to accumulated data and will receive a decision- supporting analysis result. TOOLS Based on this is a comprehensive toolset to analyze the data room (also called Business Intelligence System). A CMS can be also used. MODEL The Online Analytical Processing is based on the multidimensional data room model.
  • 15.
    ONLINE ANALYTICAL PROCESSING Practicalexample Then it can zoom in/ zoom out and examine the development within one day or during the last five years.5 It can also combine different dimensions and analyze the sell-off within a specific time frame in a specific shop.4 The company can observe the sales development of a particular product during the last year.3 Products, the time dimension and the shops have to be linked to each other. This means that the OLAP cube combines three dimensions/axes (more than three axes are possible). 2 A company sells various products and has various shops in different cities. The sales manager wants to know how many products per shop were sold last year. 1
  • 16.
  • 17.
    DATA MART Advantages Reduction ofcosts In comparison to the implementation of an entire data warehouse, costs are reduced. Access limitation Access is limited to certain users. Independencyof users Separation of other areas, independent mobility. PERFORMANCEimprovement Performance by a different computer system, reduction of data volume, lower number of users. Data protection Solves data protection issues. Data structure The same database with different data structures is used for particular purposes. Easy access Better access to required data.
  • 18.
  • 19.
    DATA MINING World-Wide DataStreams 2018 World-wide data doubles every two years. 2008 World-wide data doubles every other year. 2014 Rising market (India, China) produce two thirds of the world-wide data. 2020 The data volume is double as high as 2014. 40000 30000 20000 10000 2008 2010 2012 2014 2016 2018 2020
  • 20.
    DATA MINING Summary The generalprocess creates a tighter, reduced and less complex data room to eliminate duplicates, outliers and extracted models of the database. Reduction Data analysis Visual REPORTING The end of data mining is the reduction of data to a well-structured data analysis adjusted to user requirements. The database can be better used for visual illustrations and targeted reporting.
  • 21.
    Click here tovisit www.PresentationLoad.com DOWNLOAD POWERPOINT SLIDES