Download as PDF, PPTX
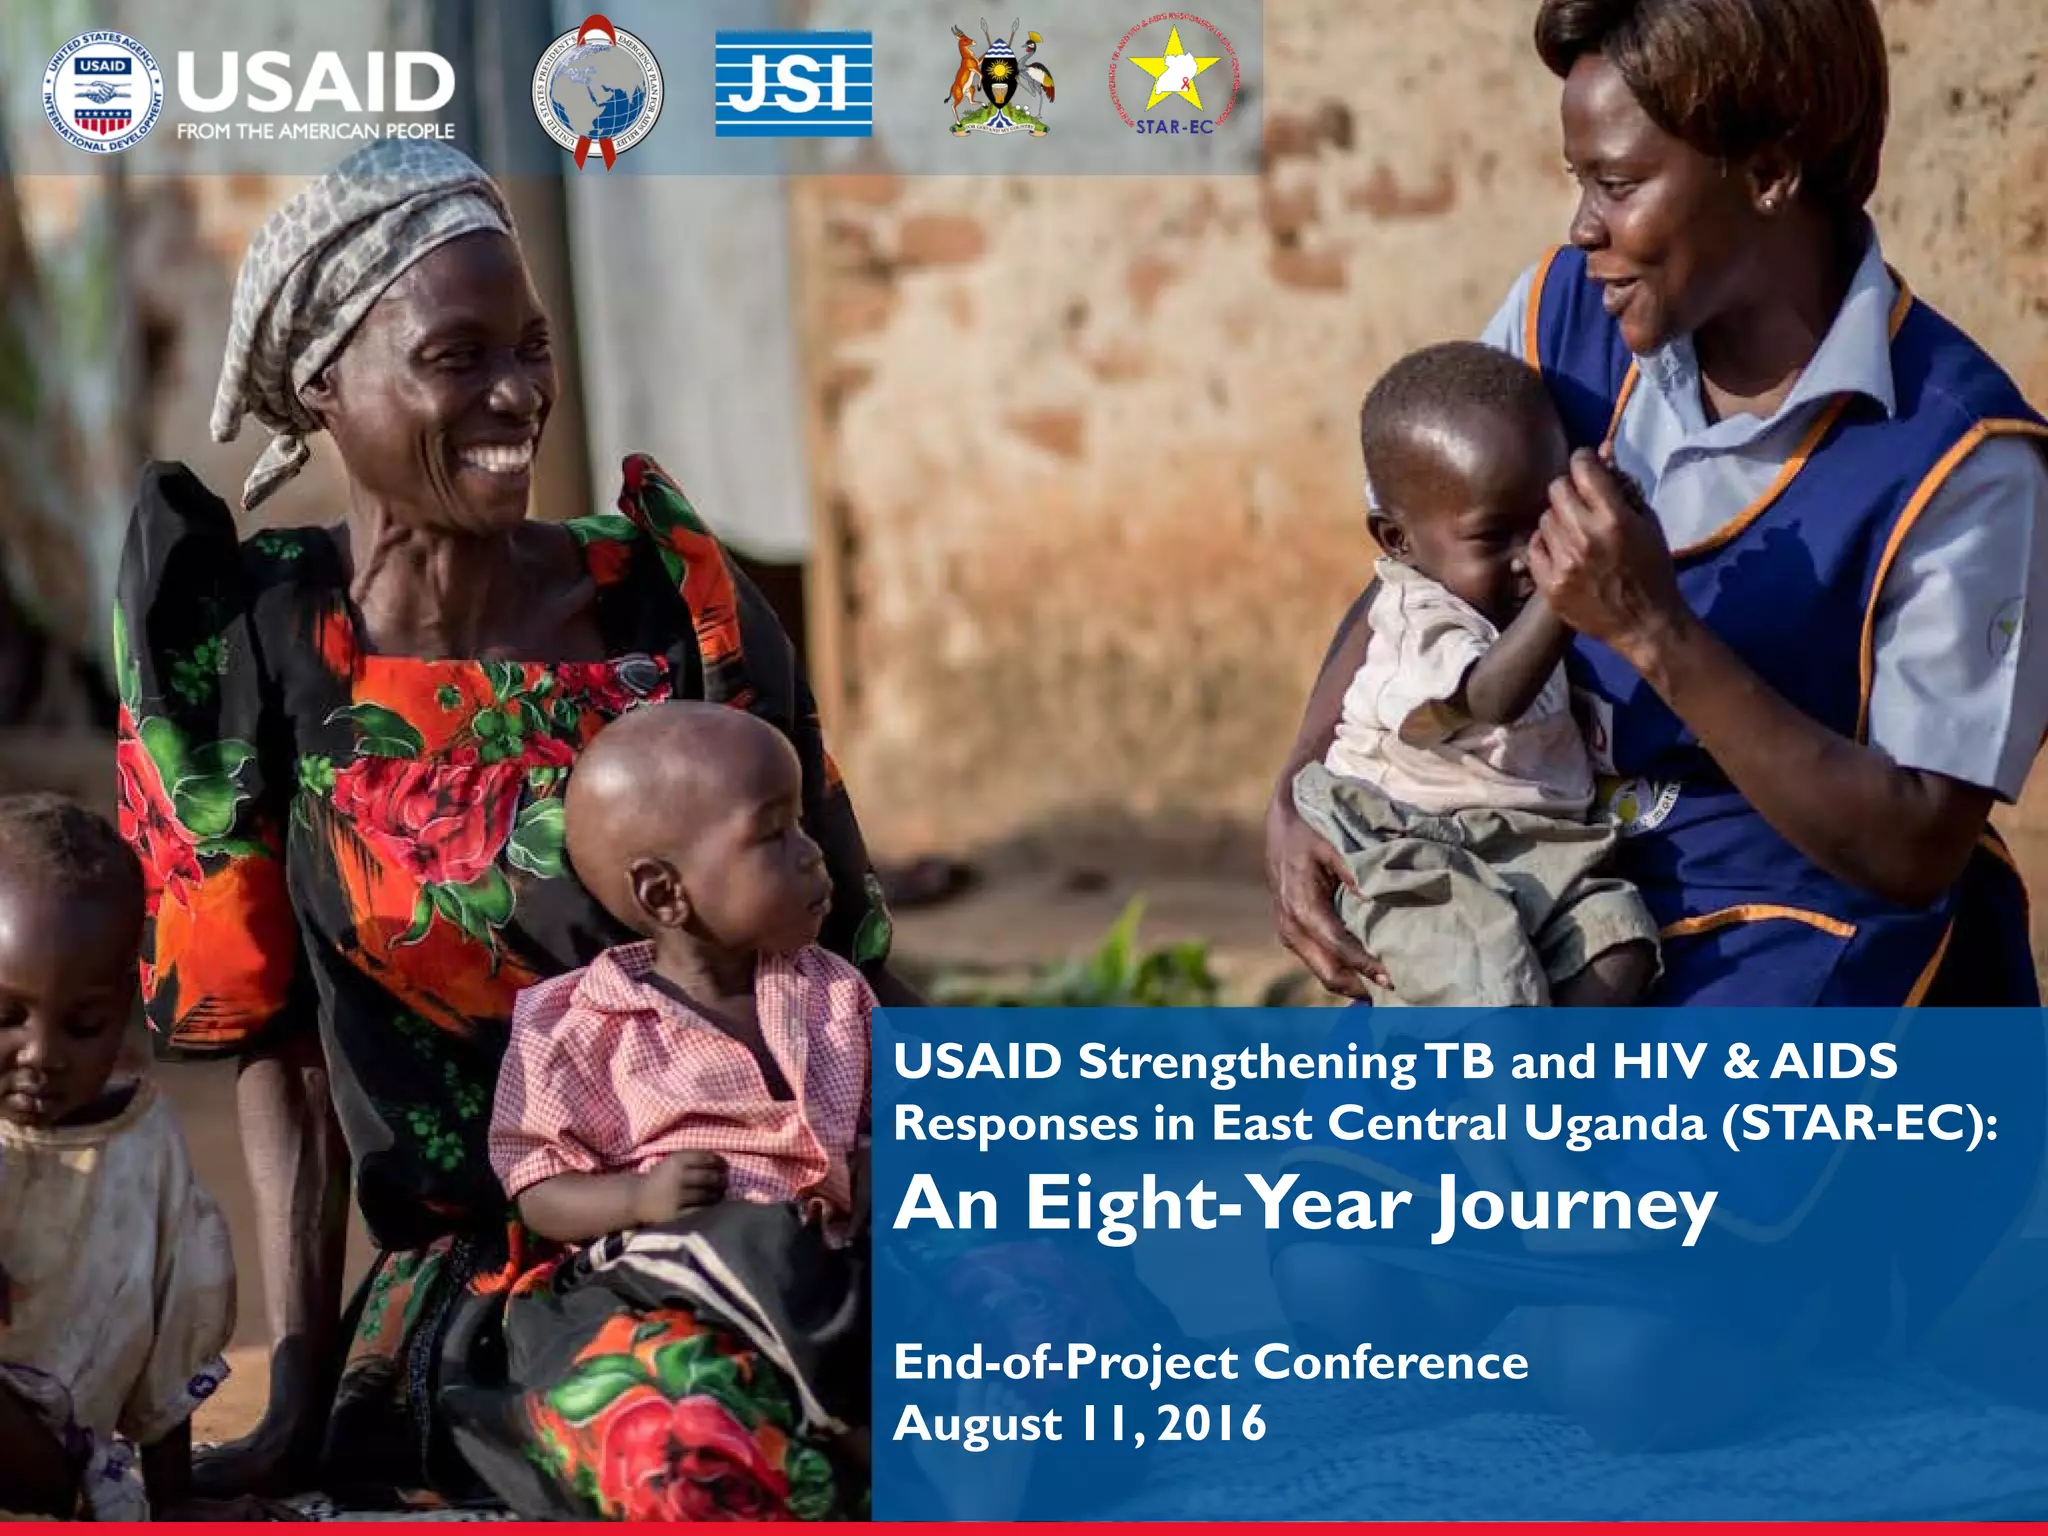
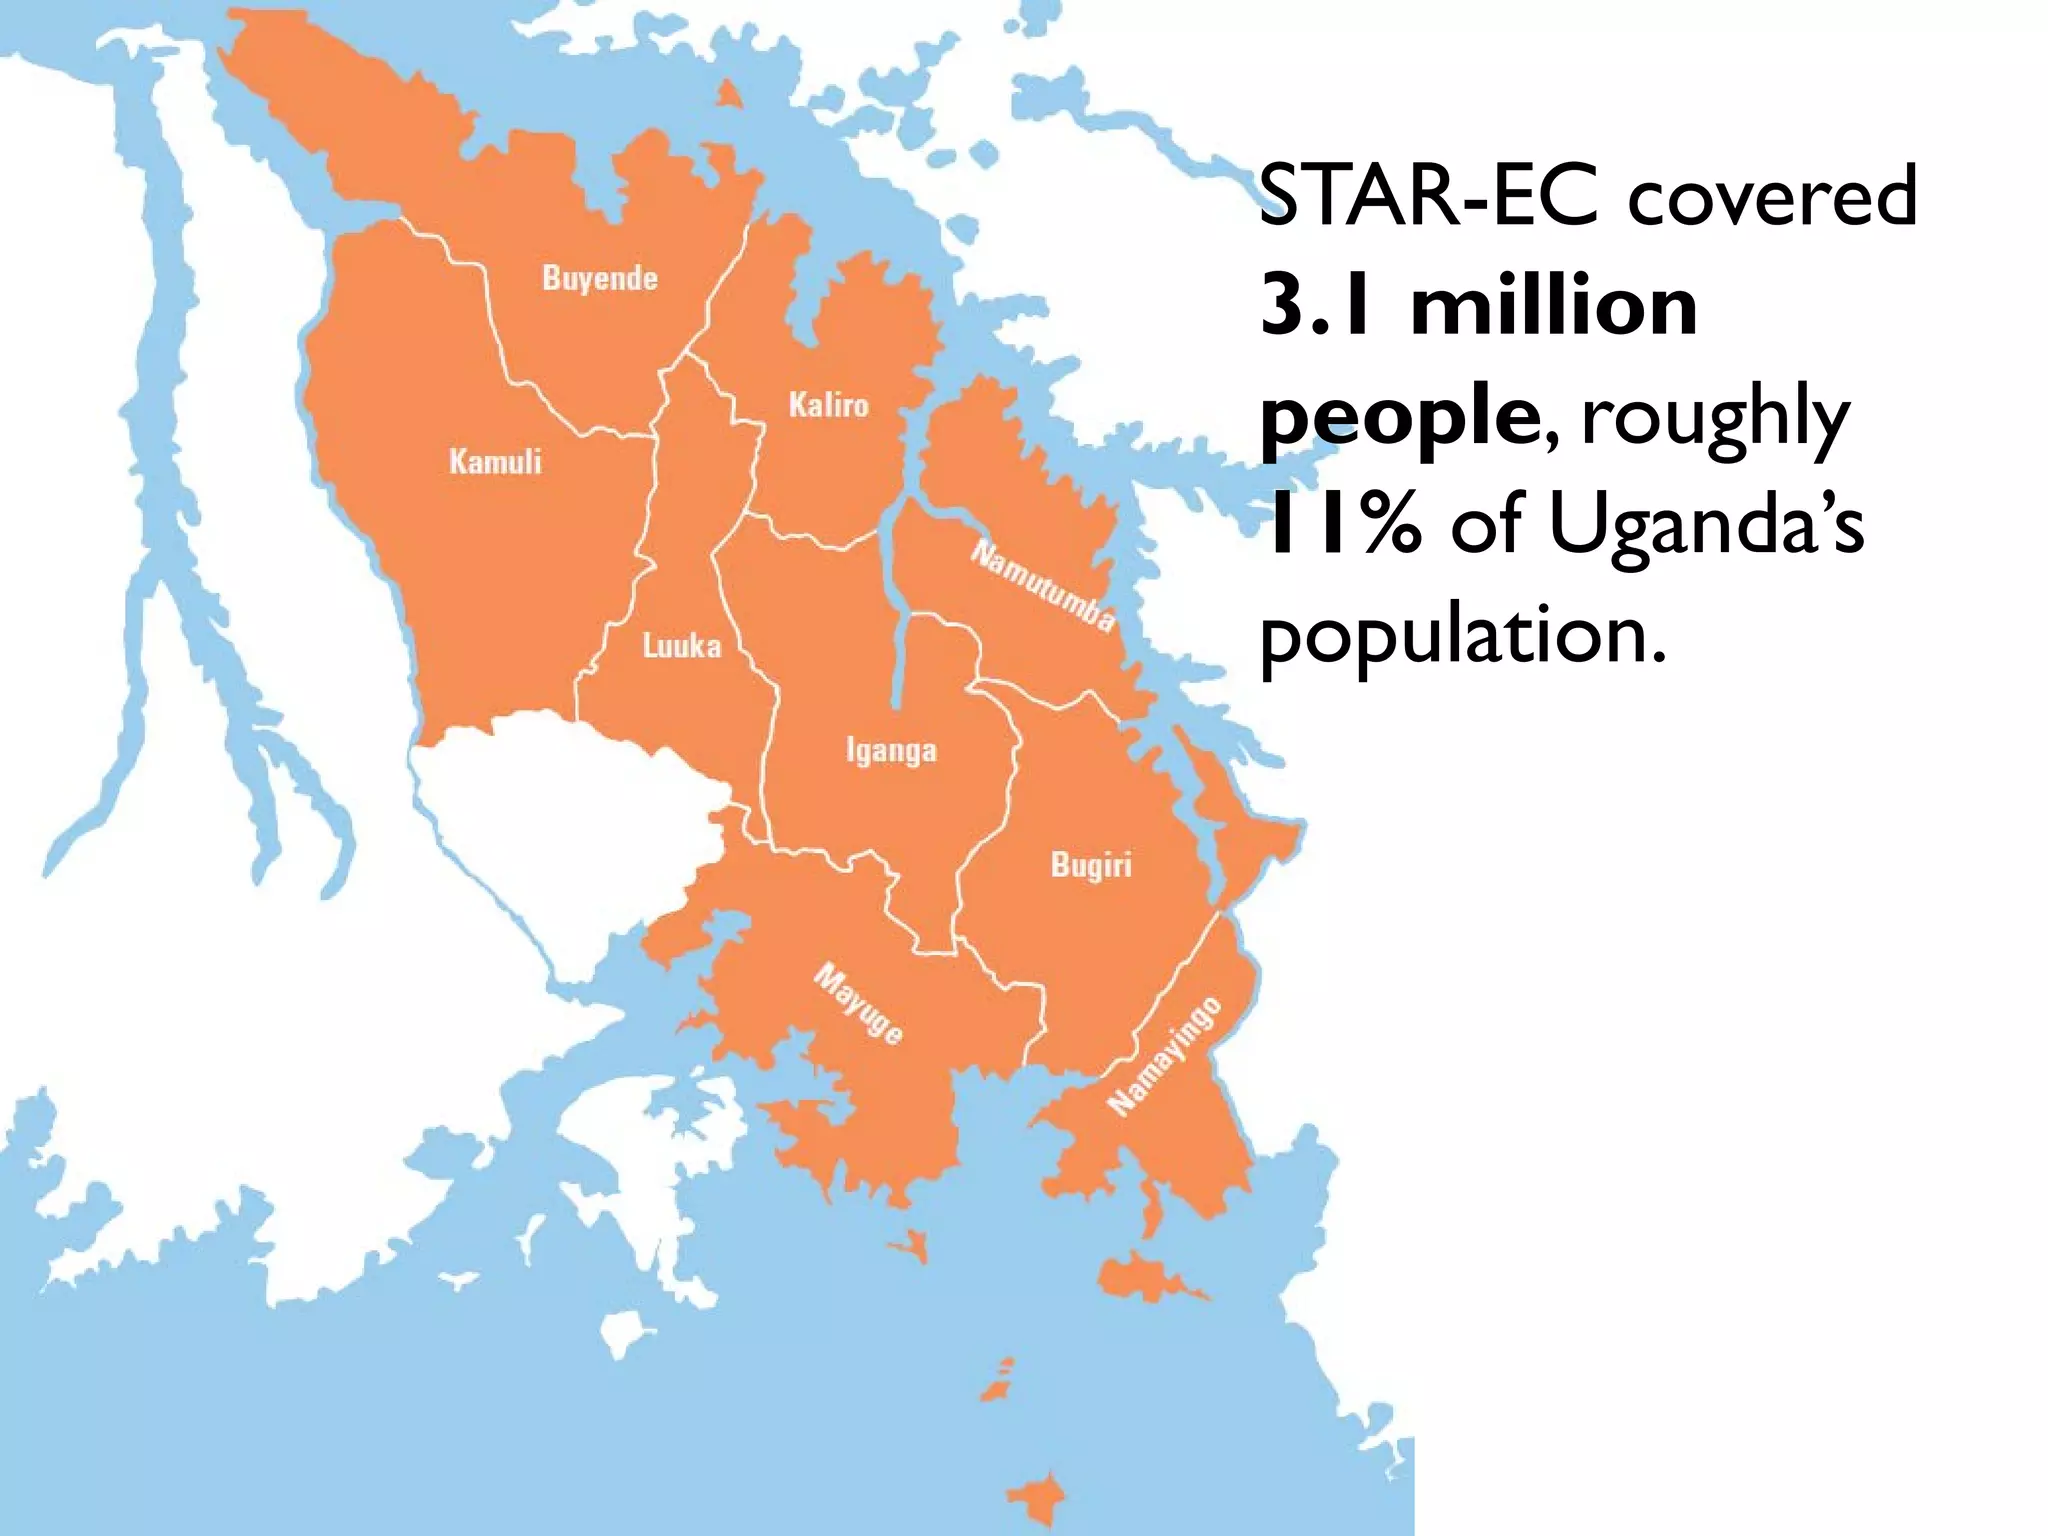
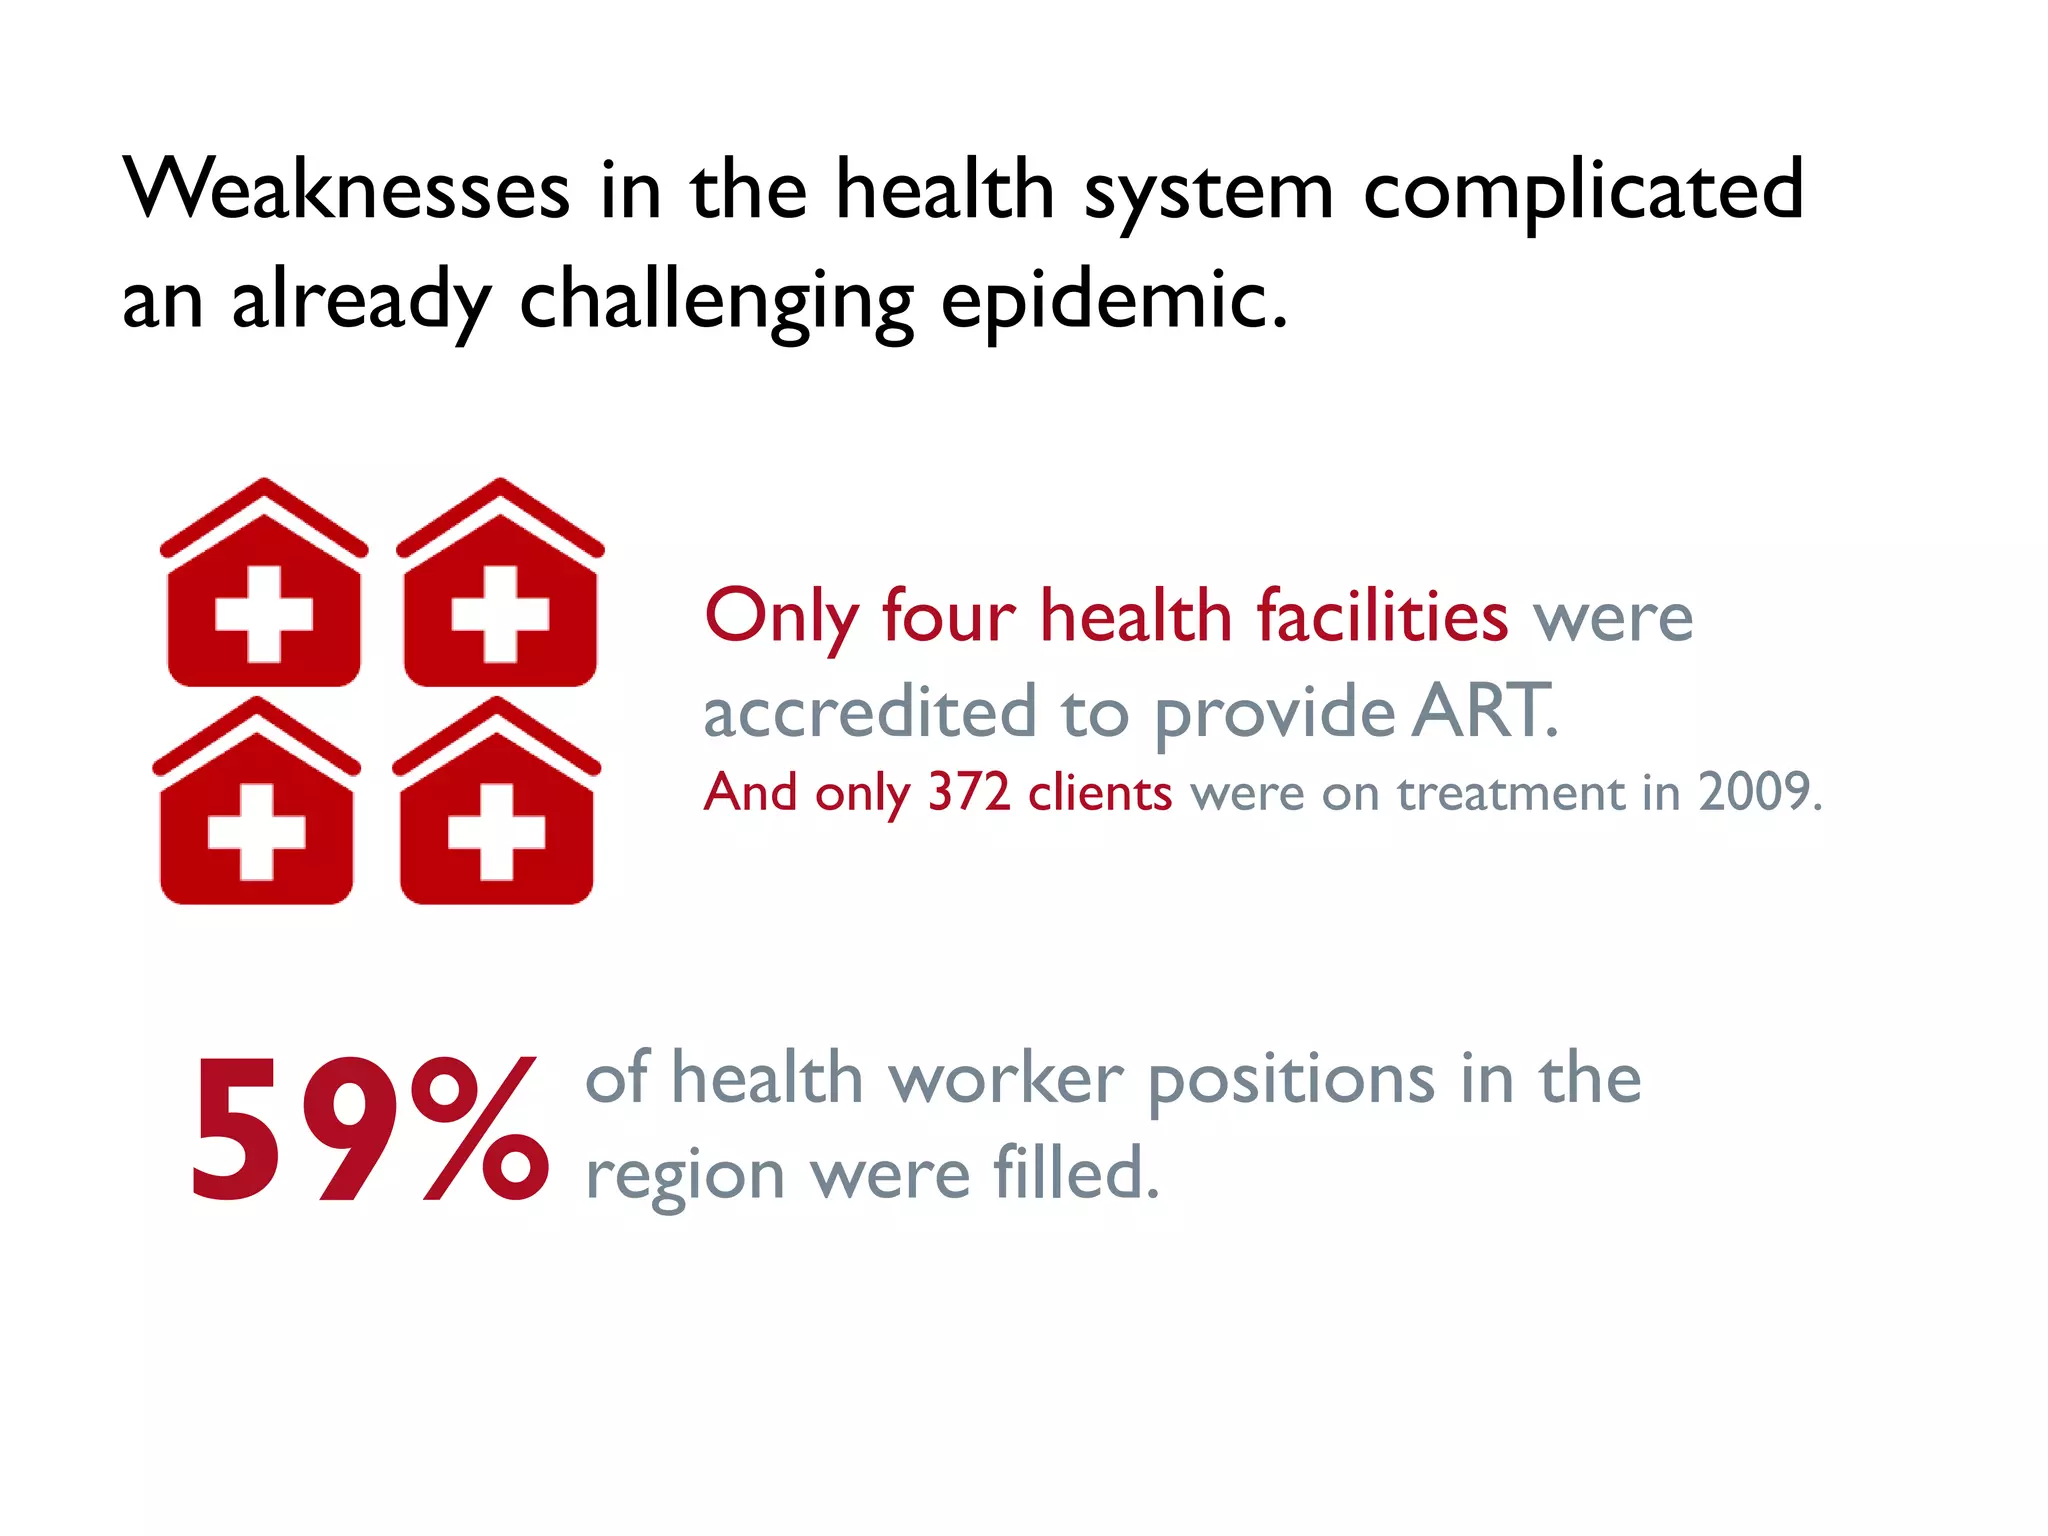
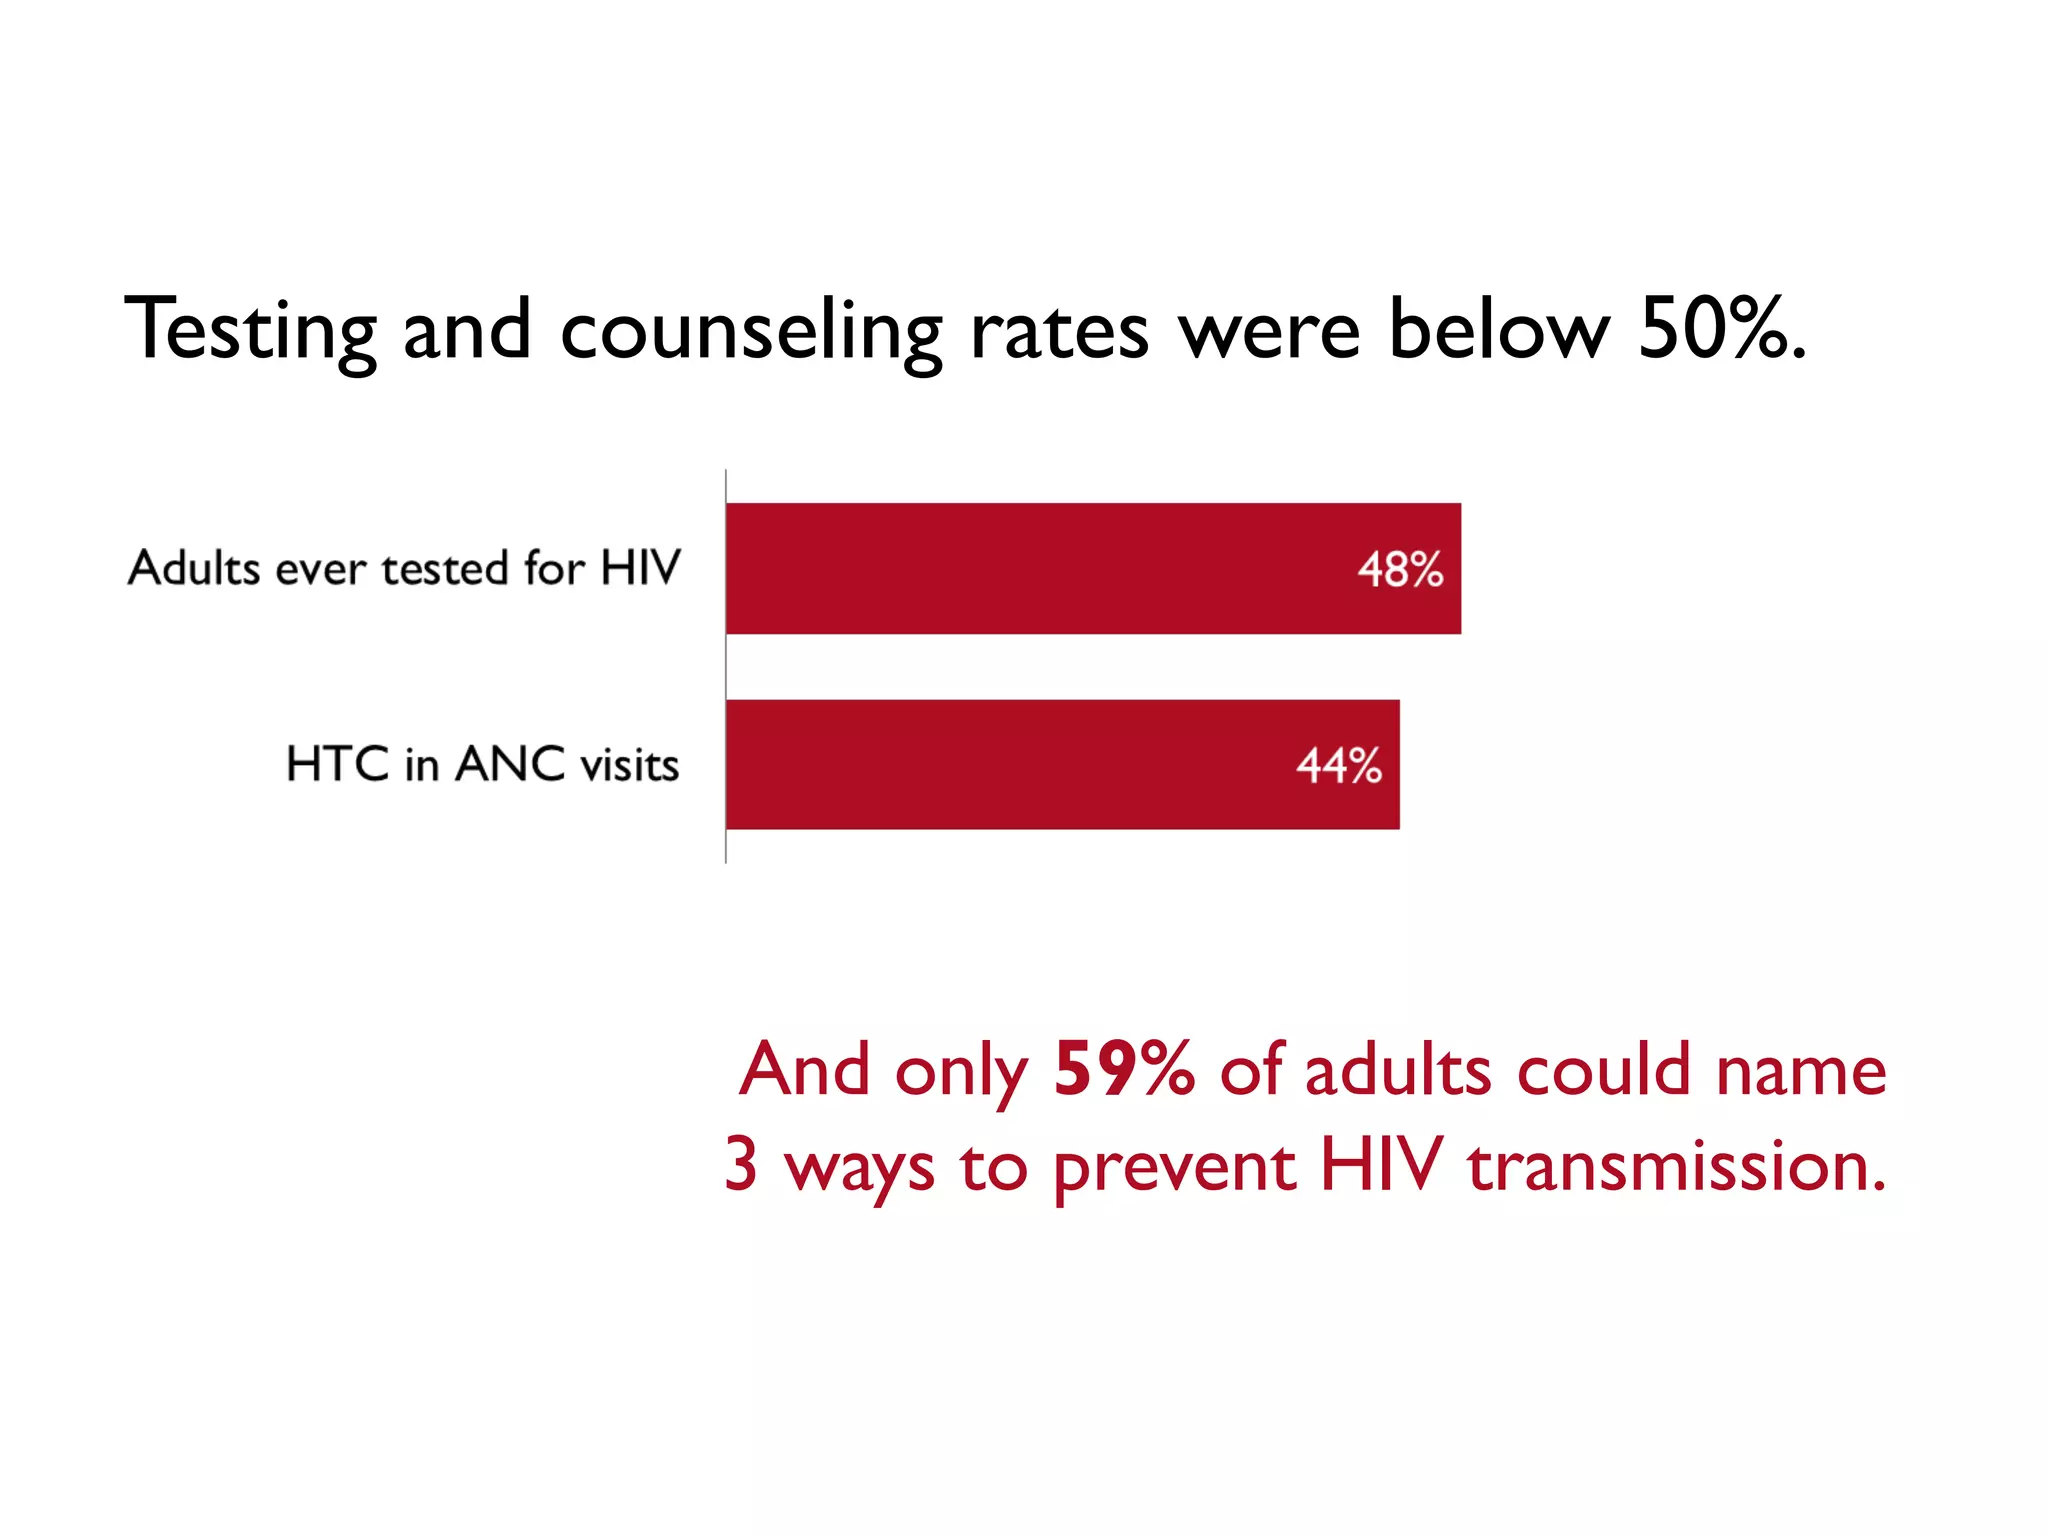
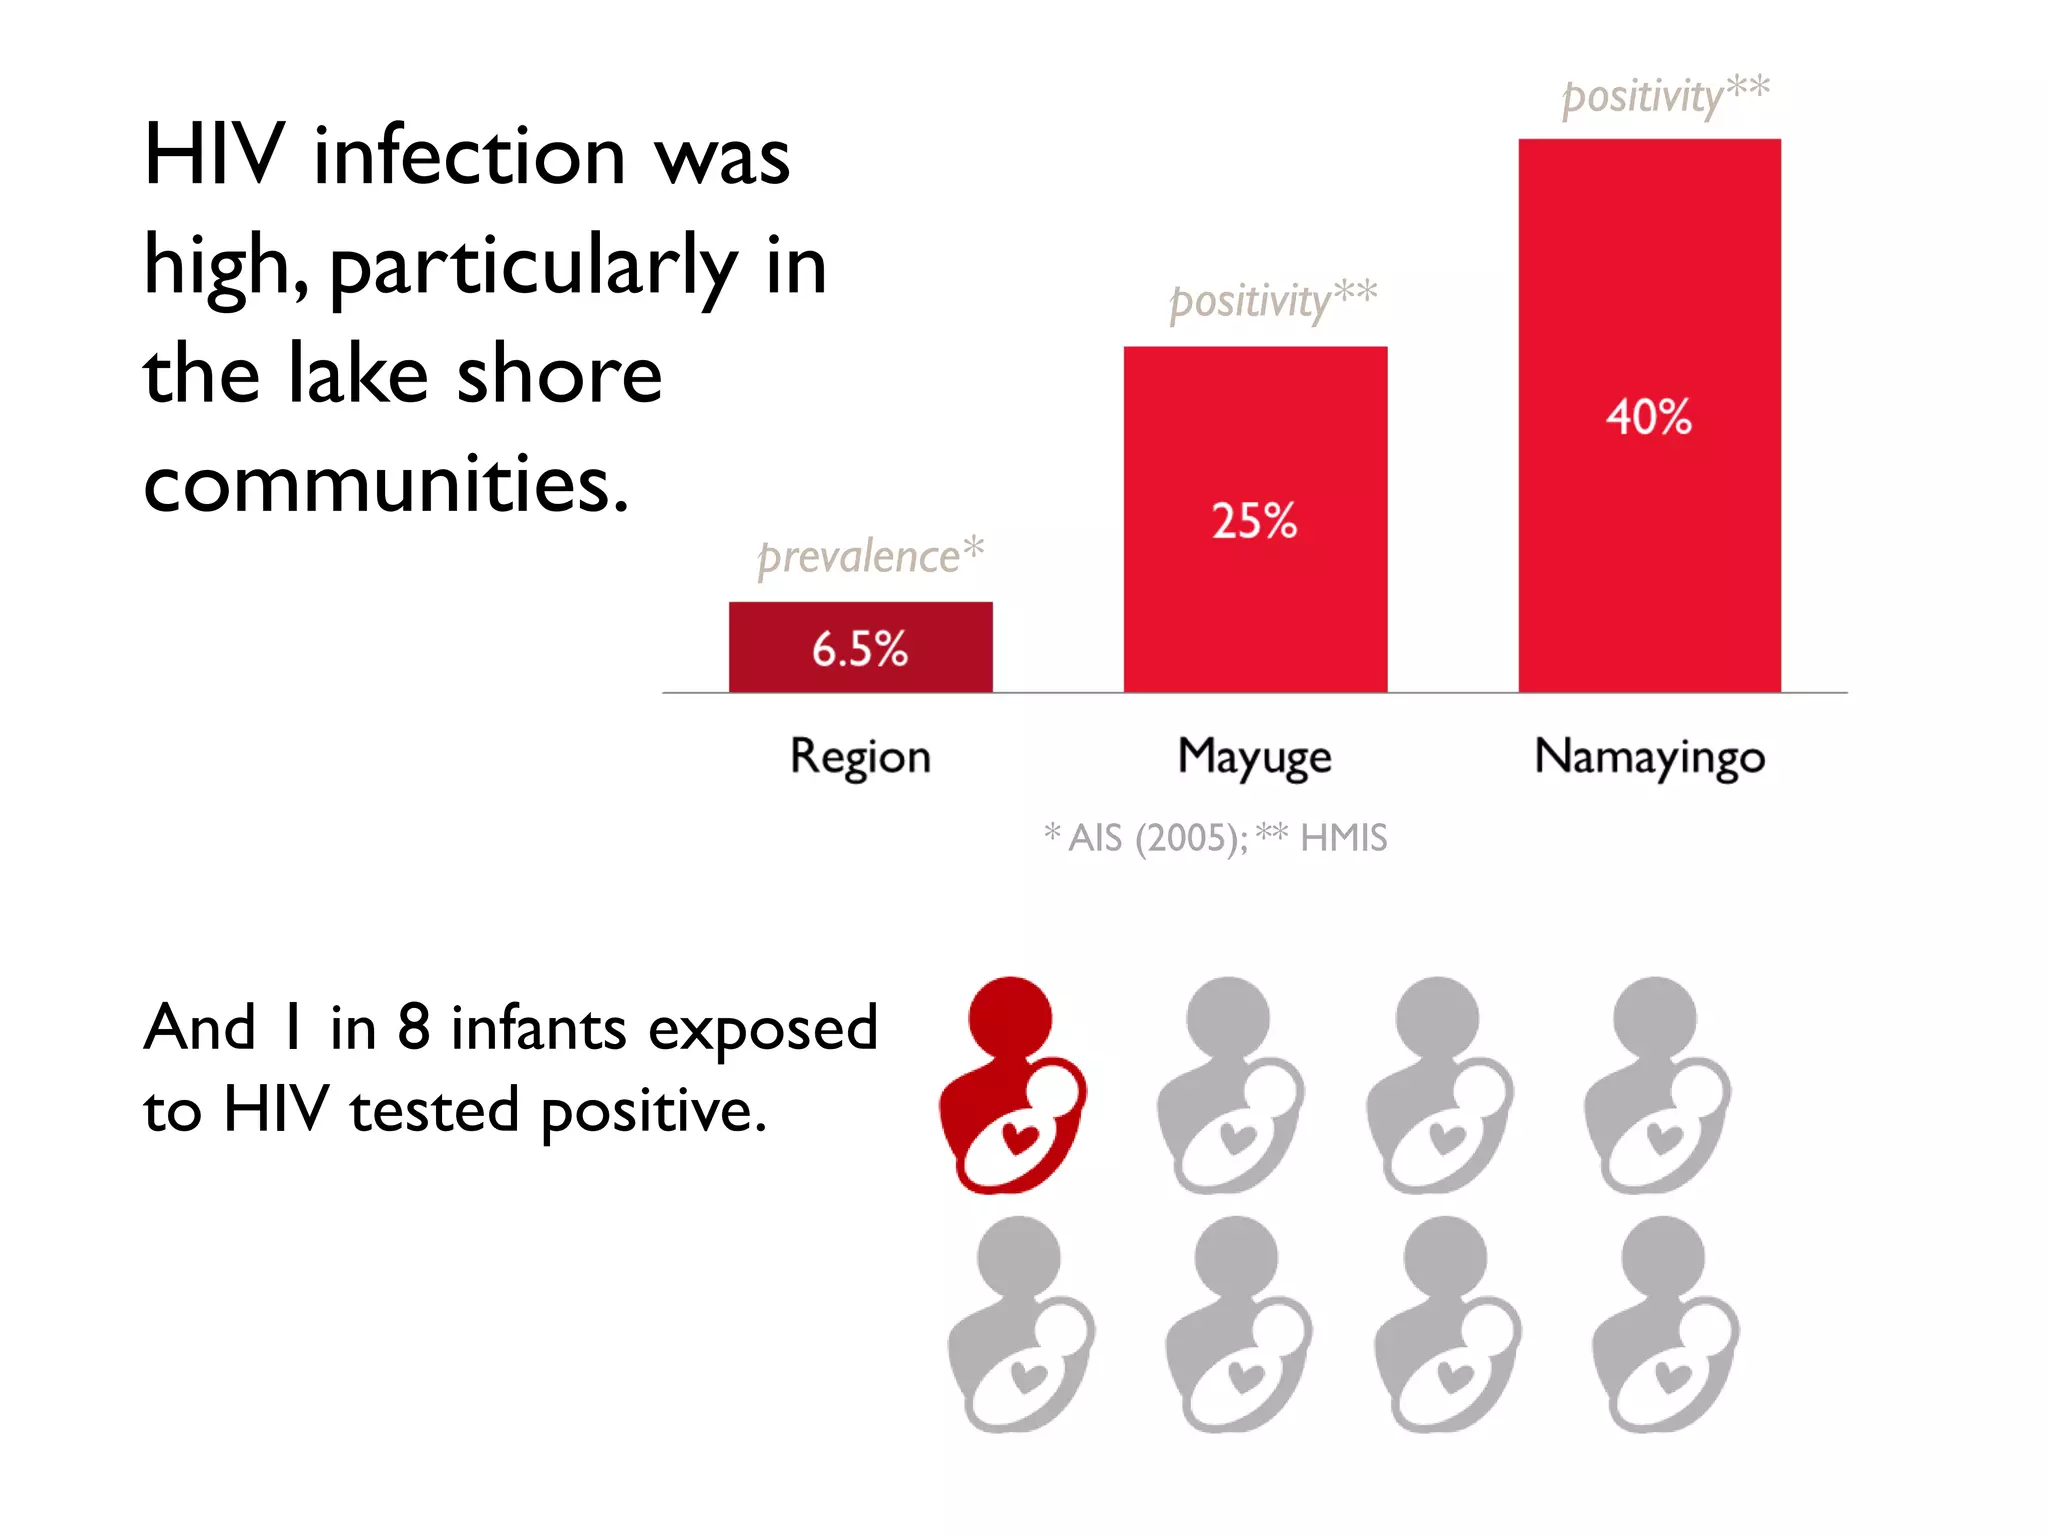
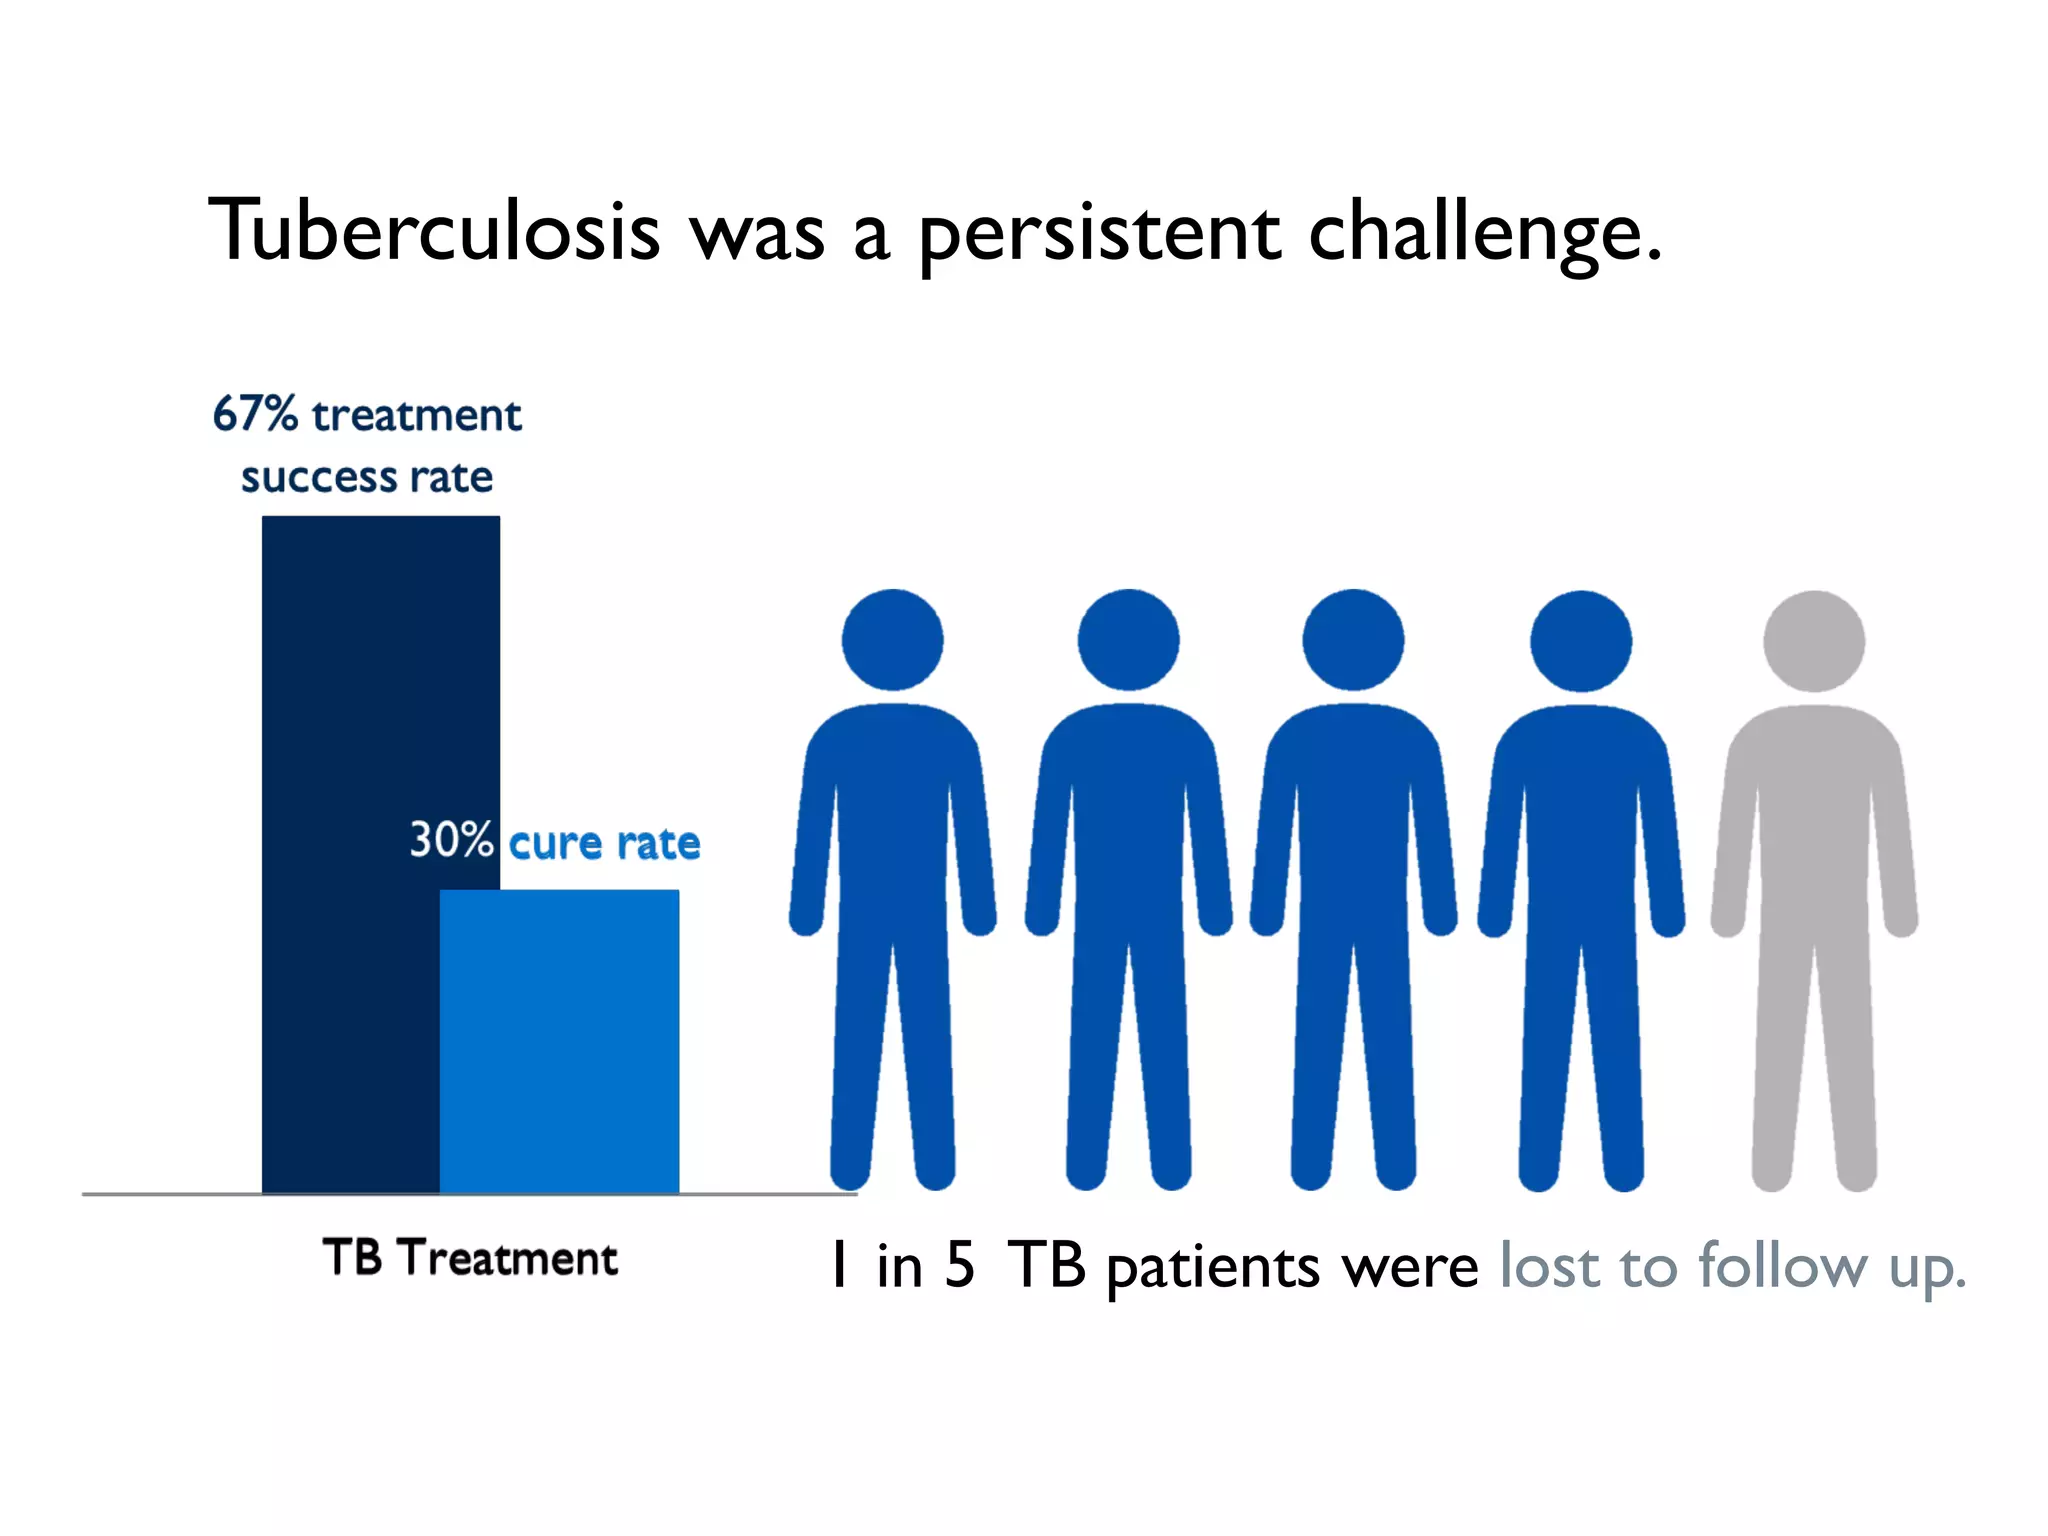
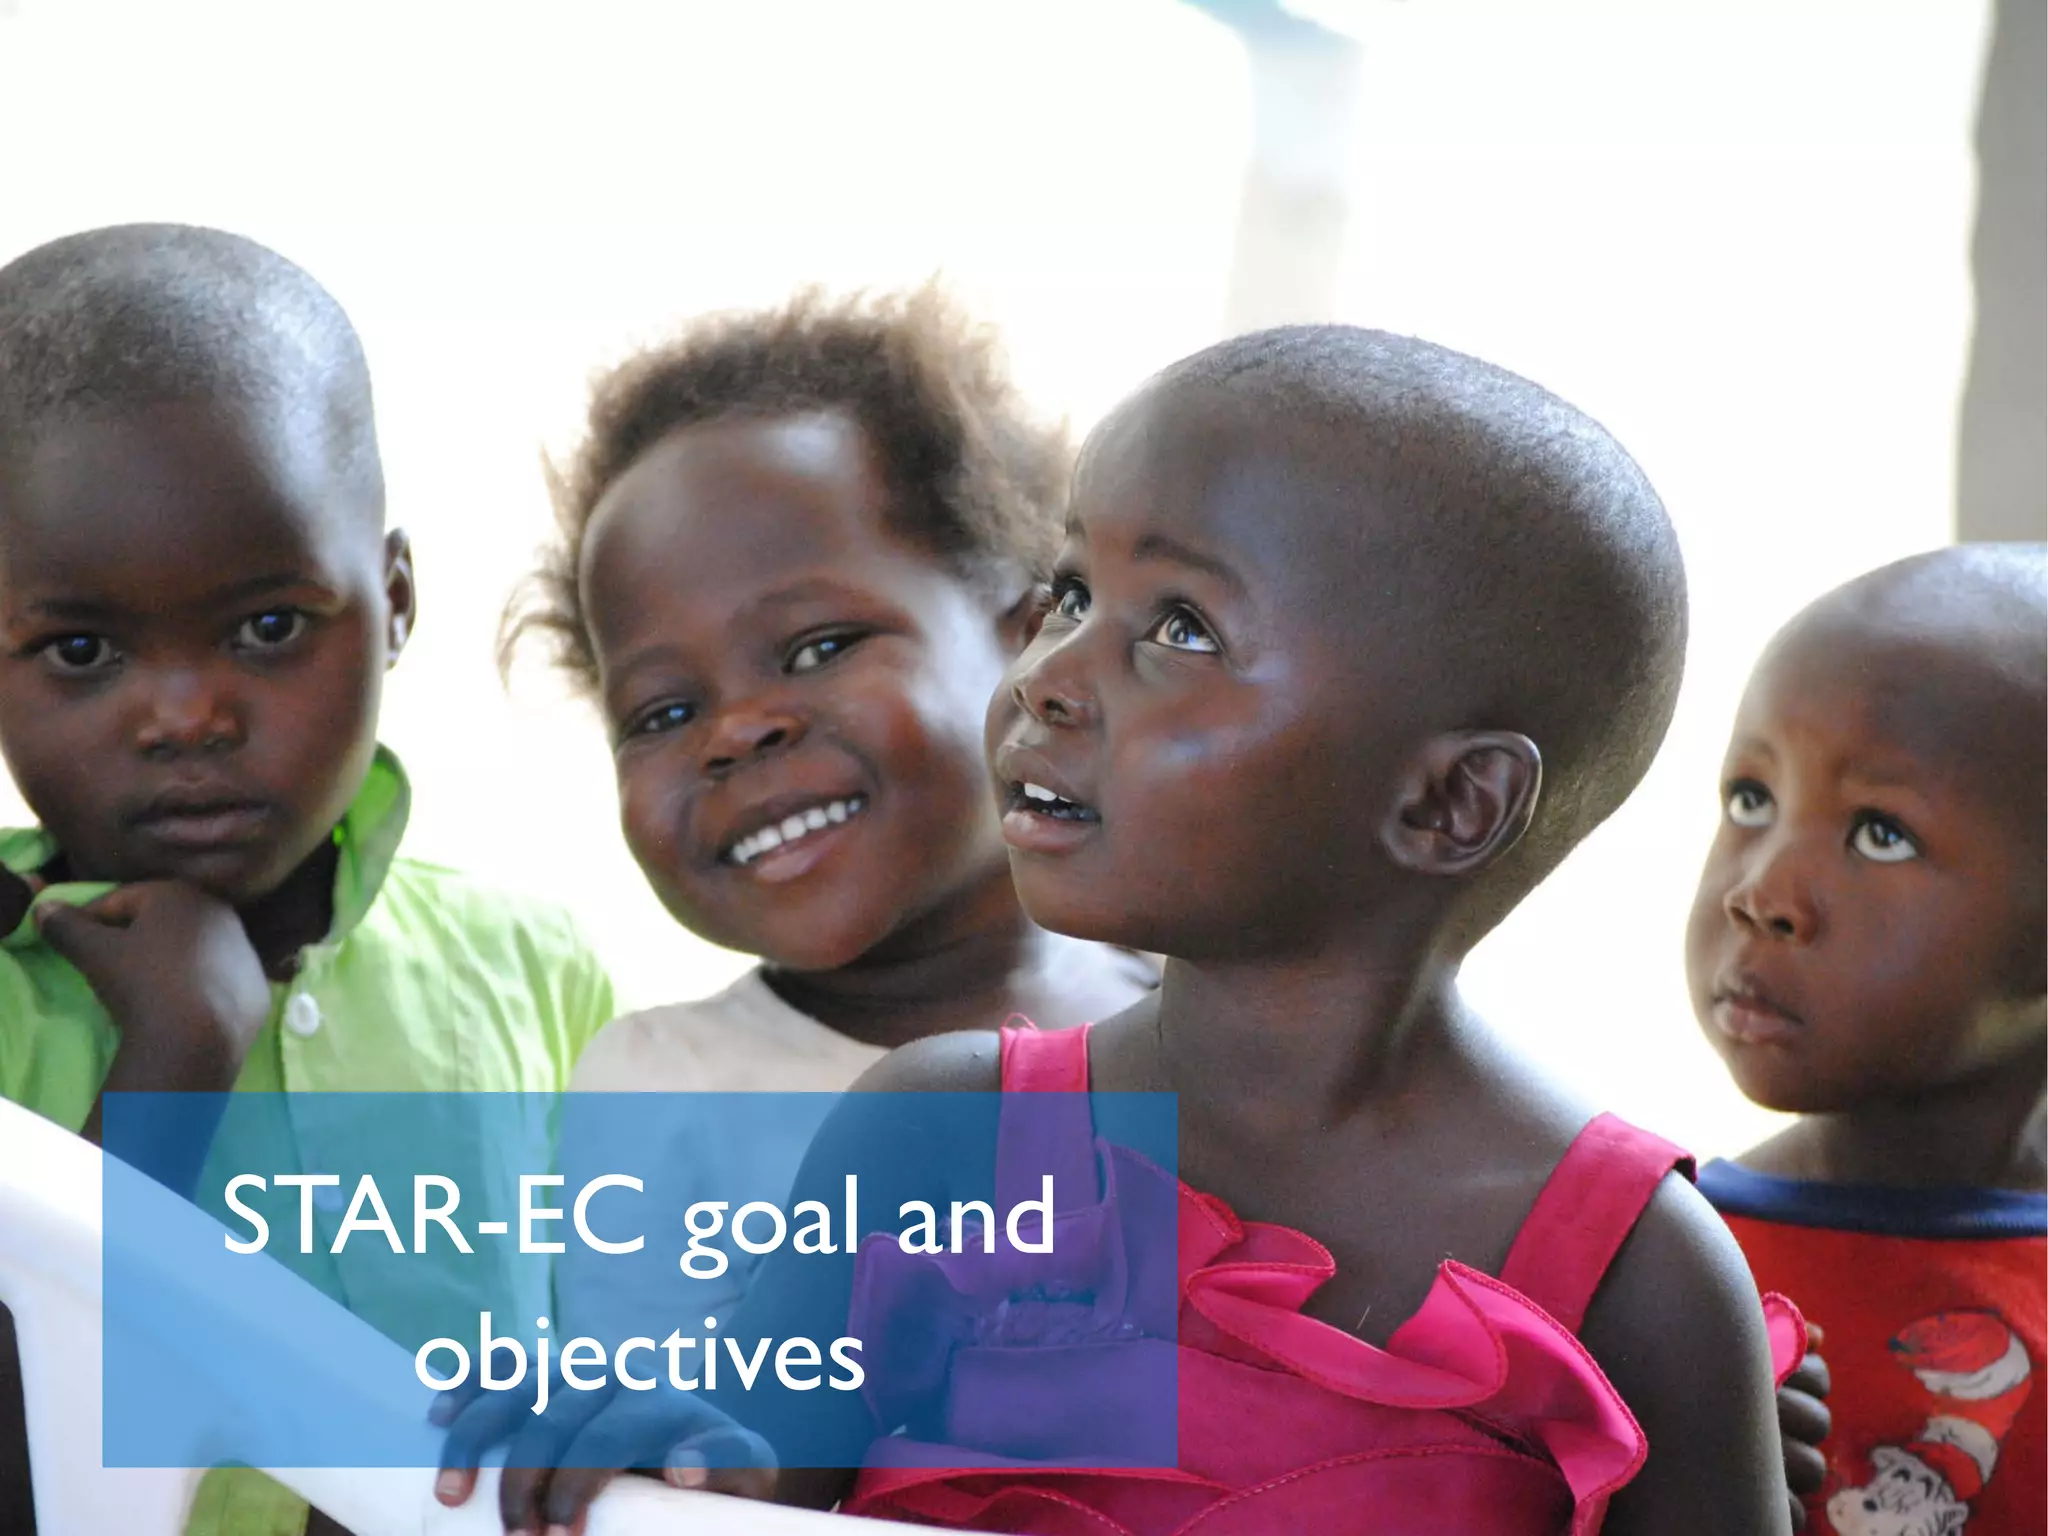
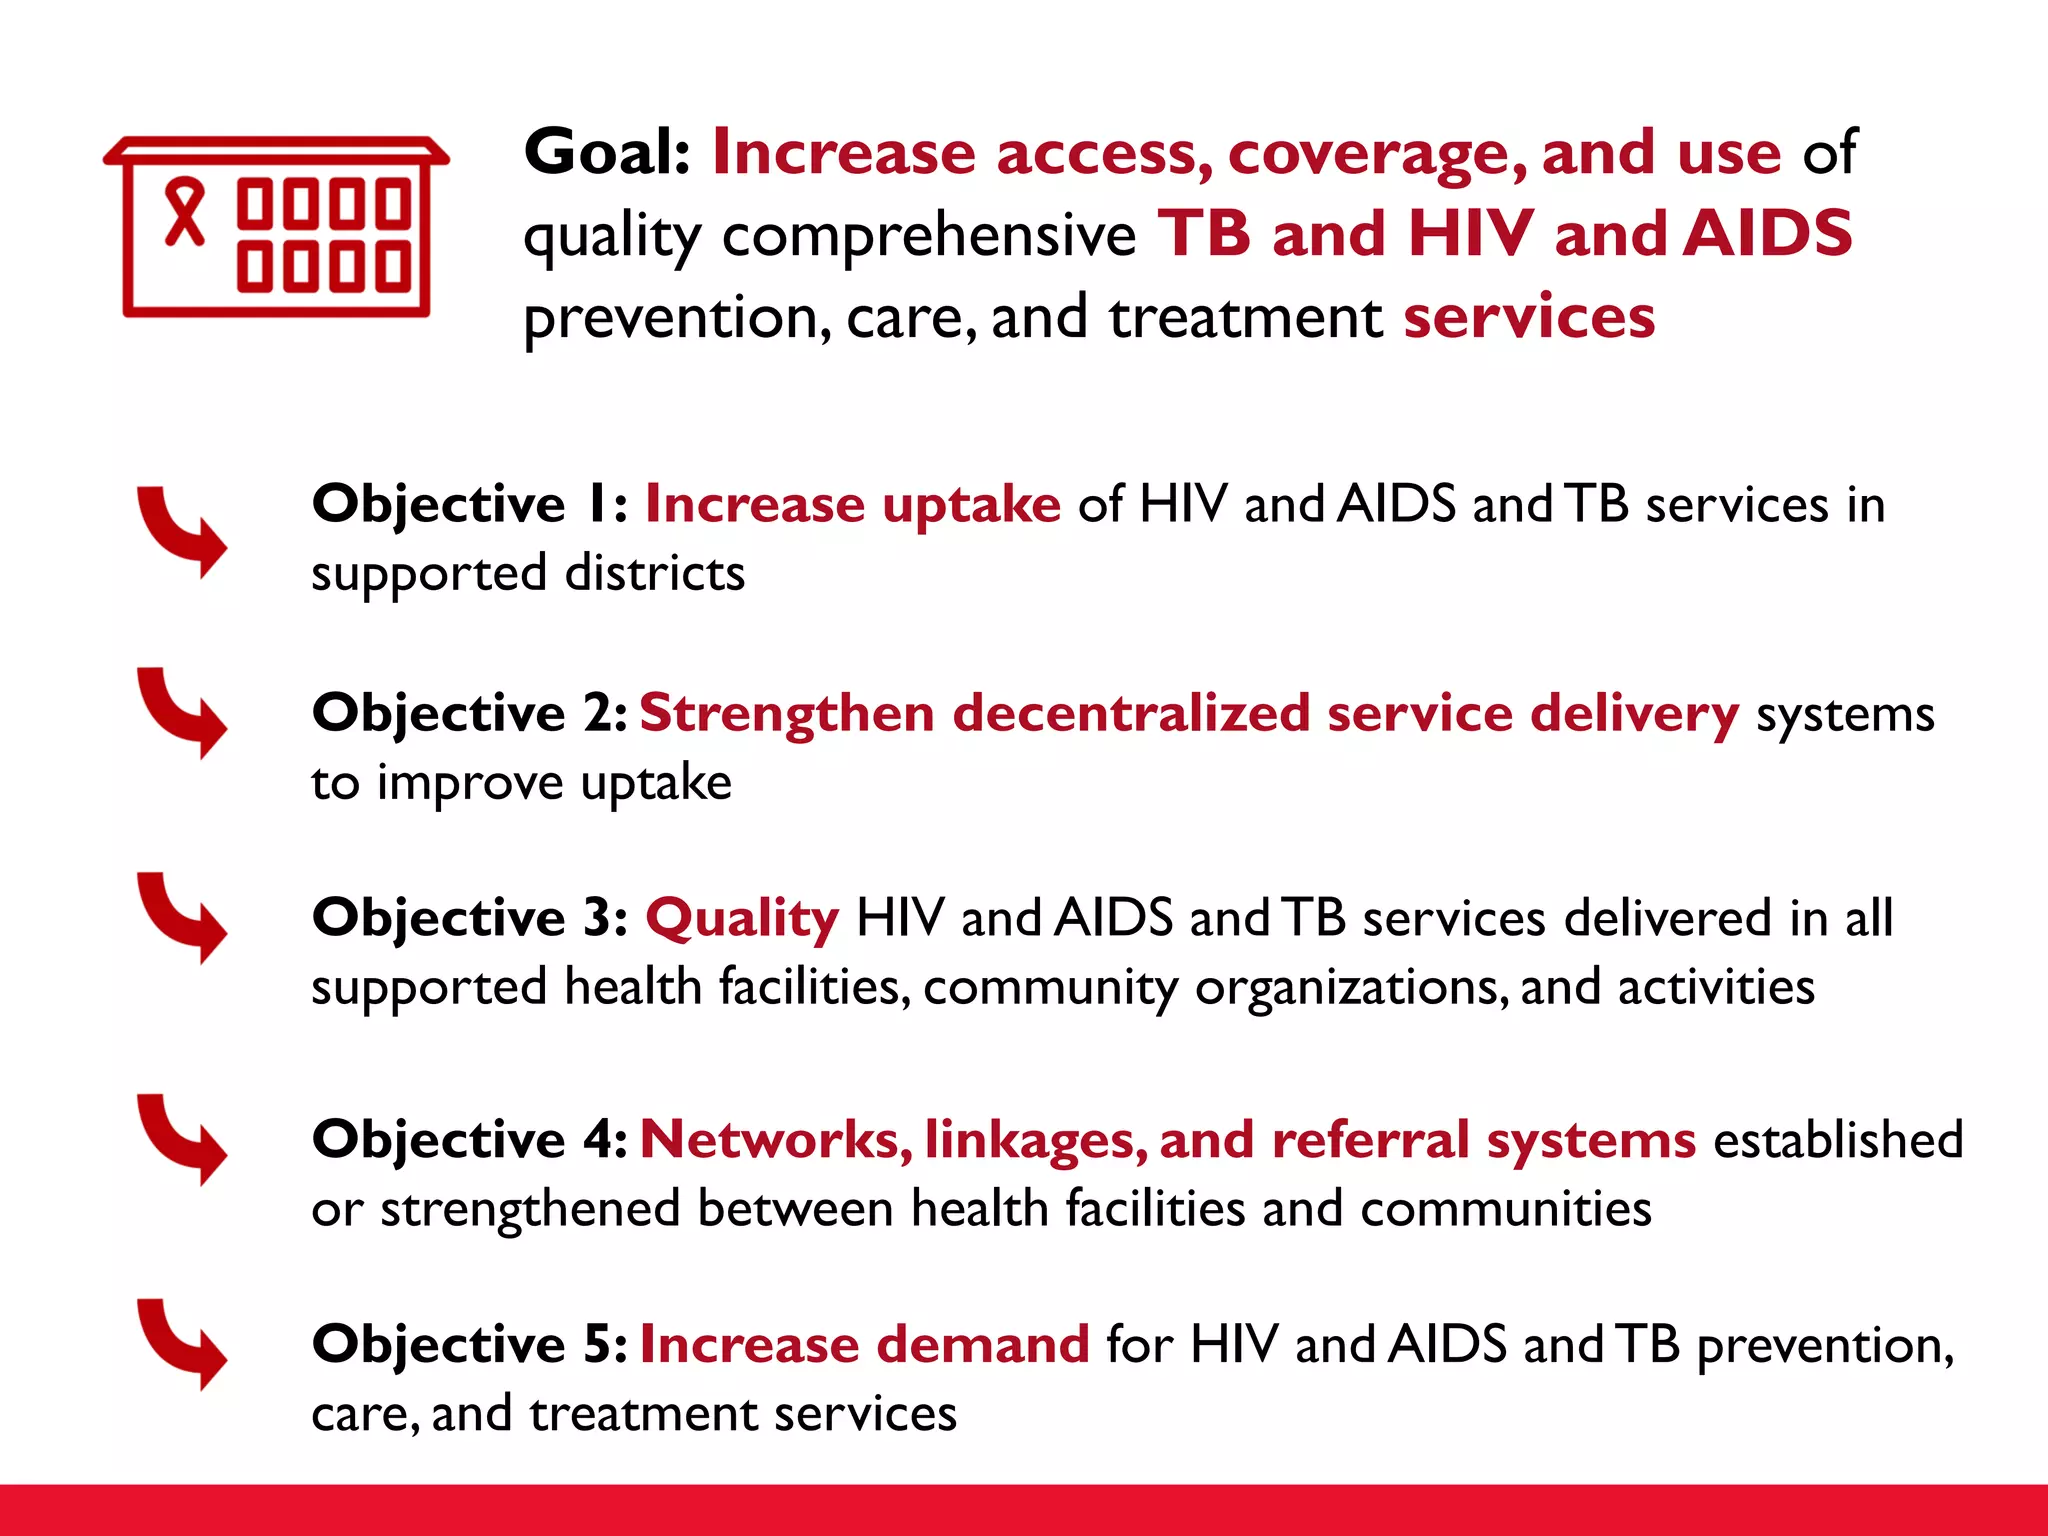
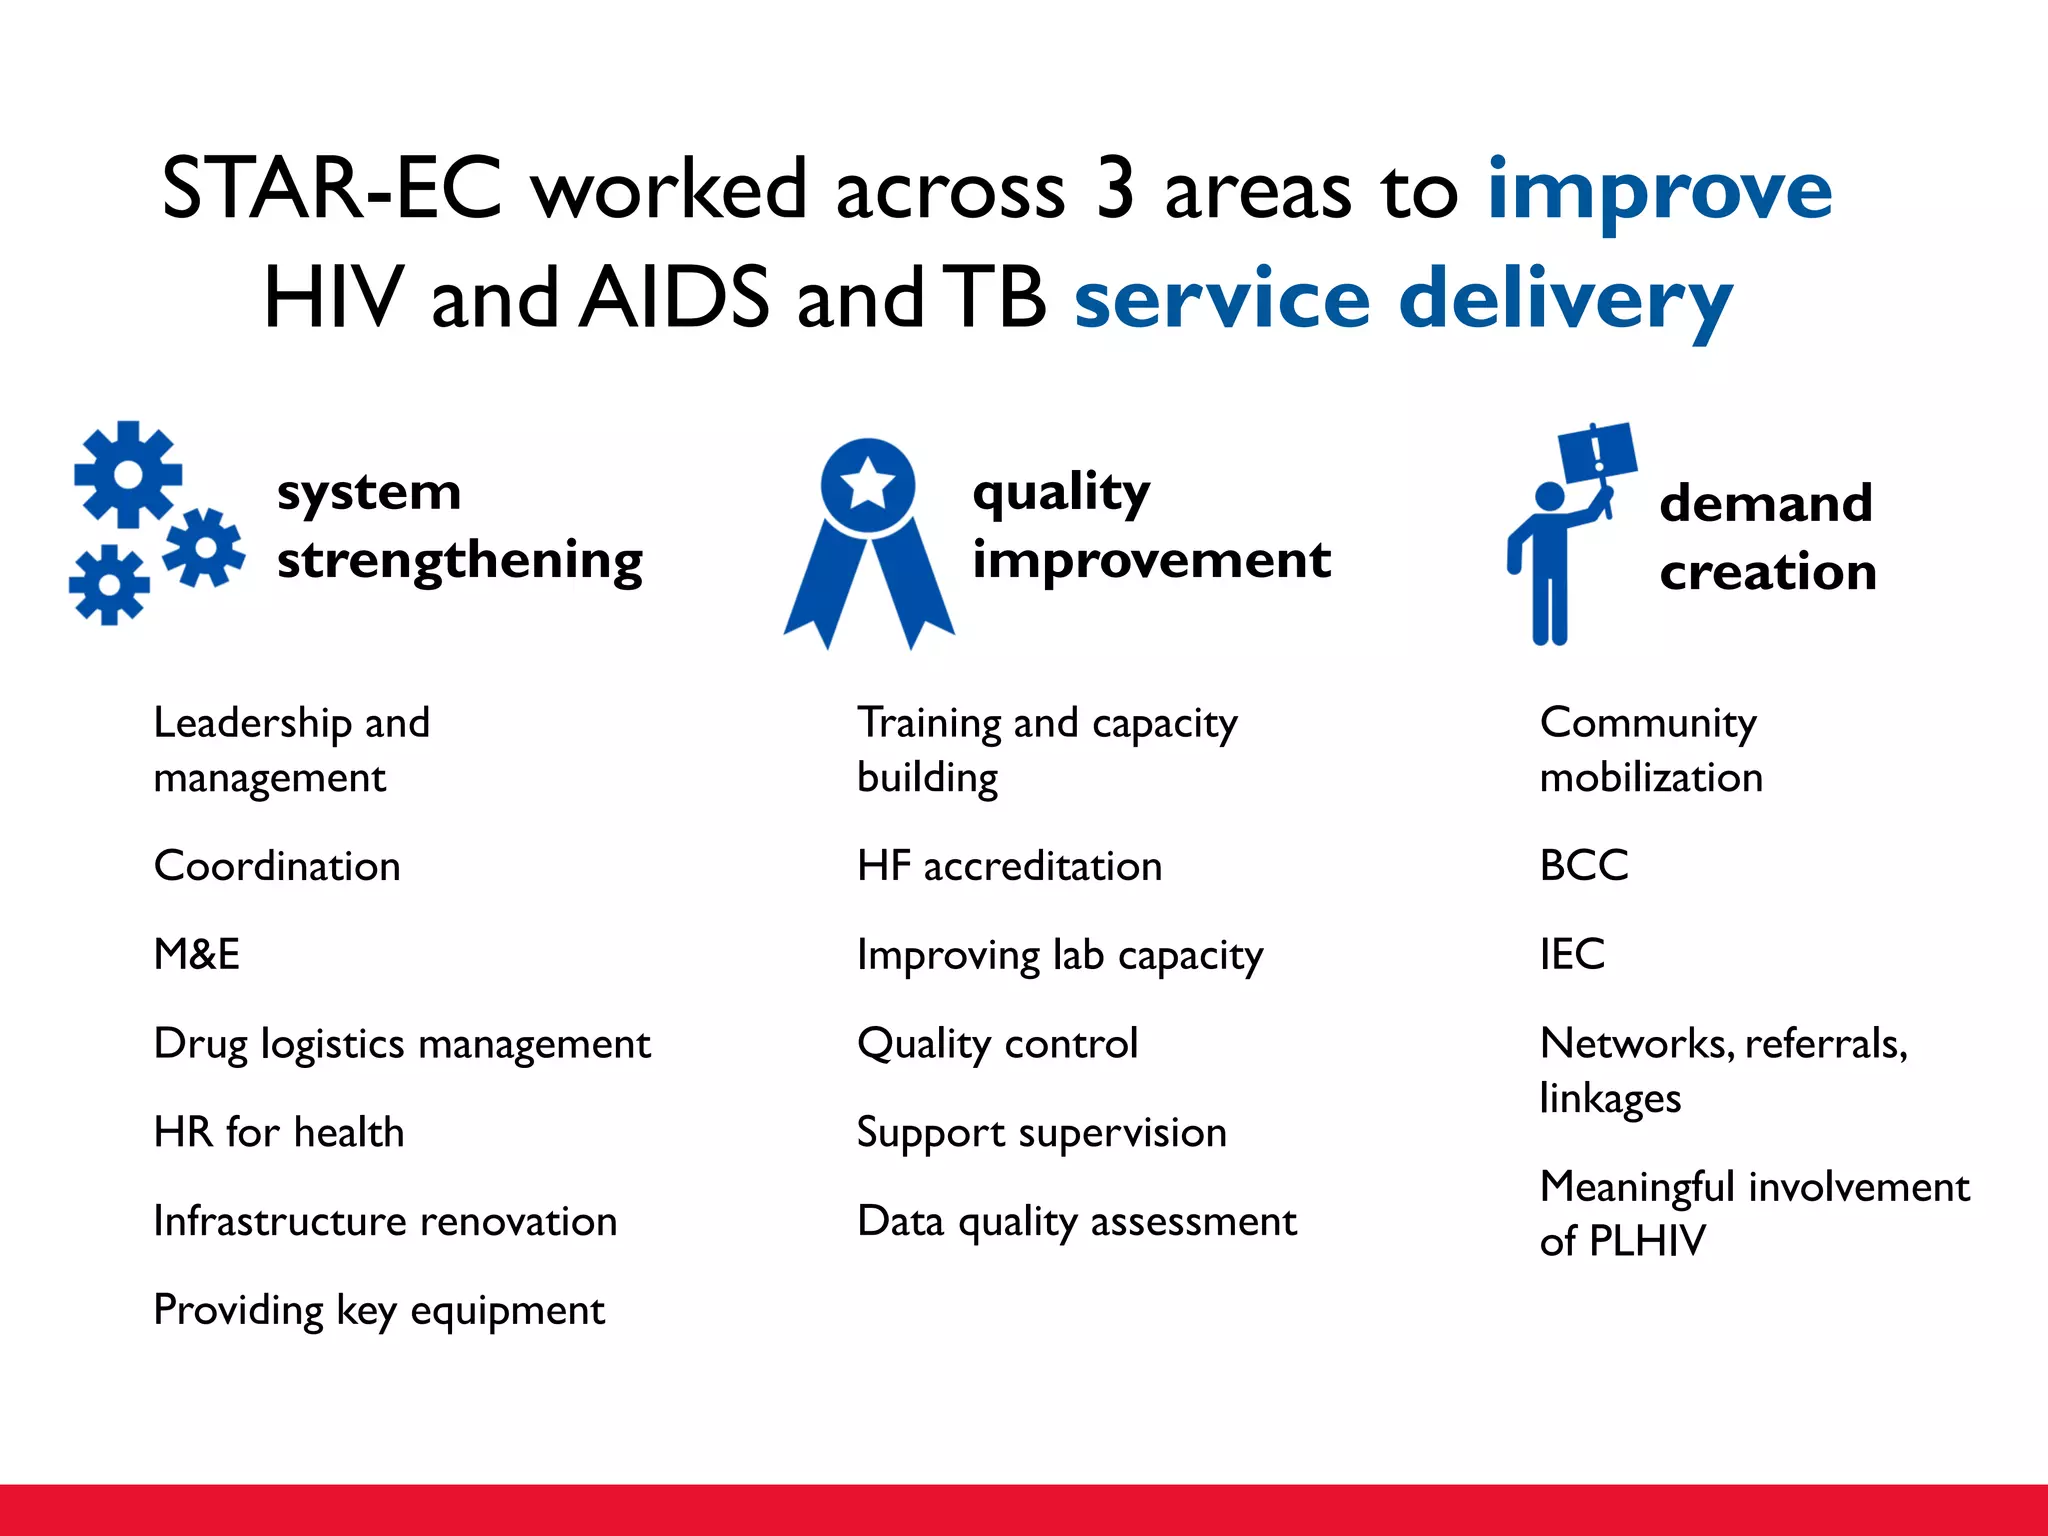
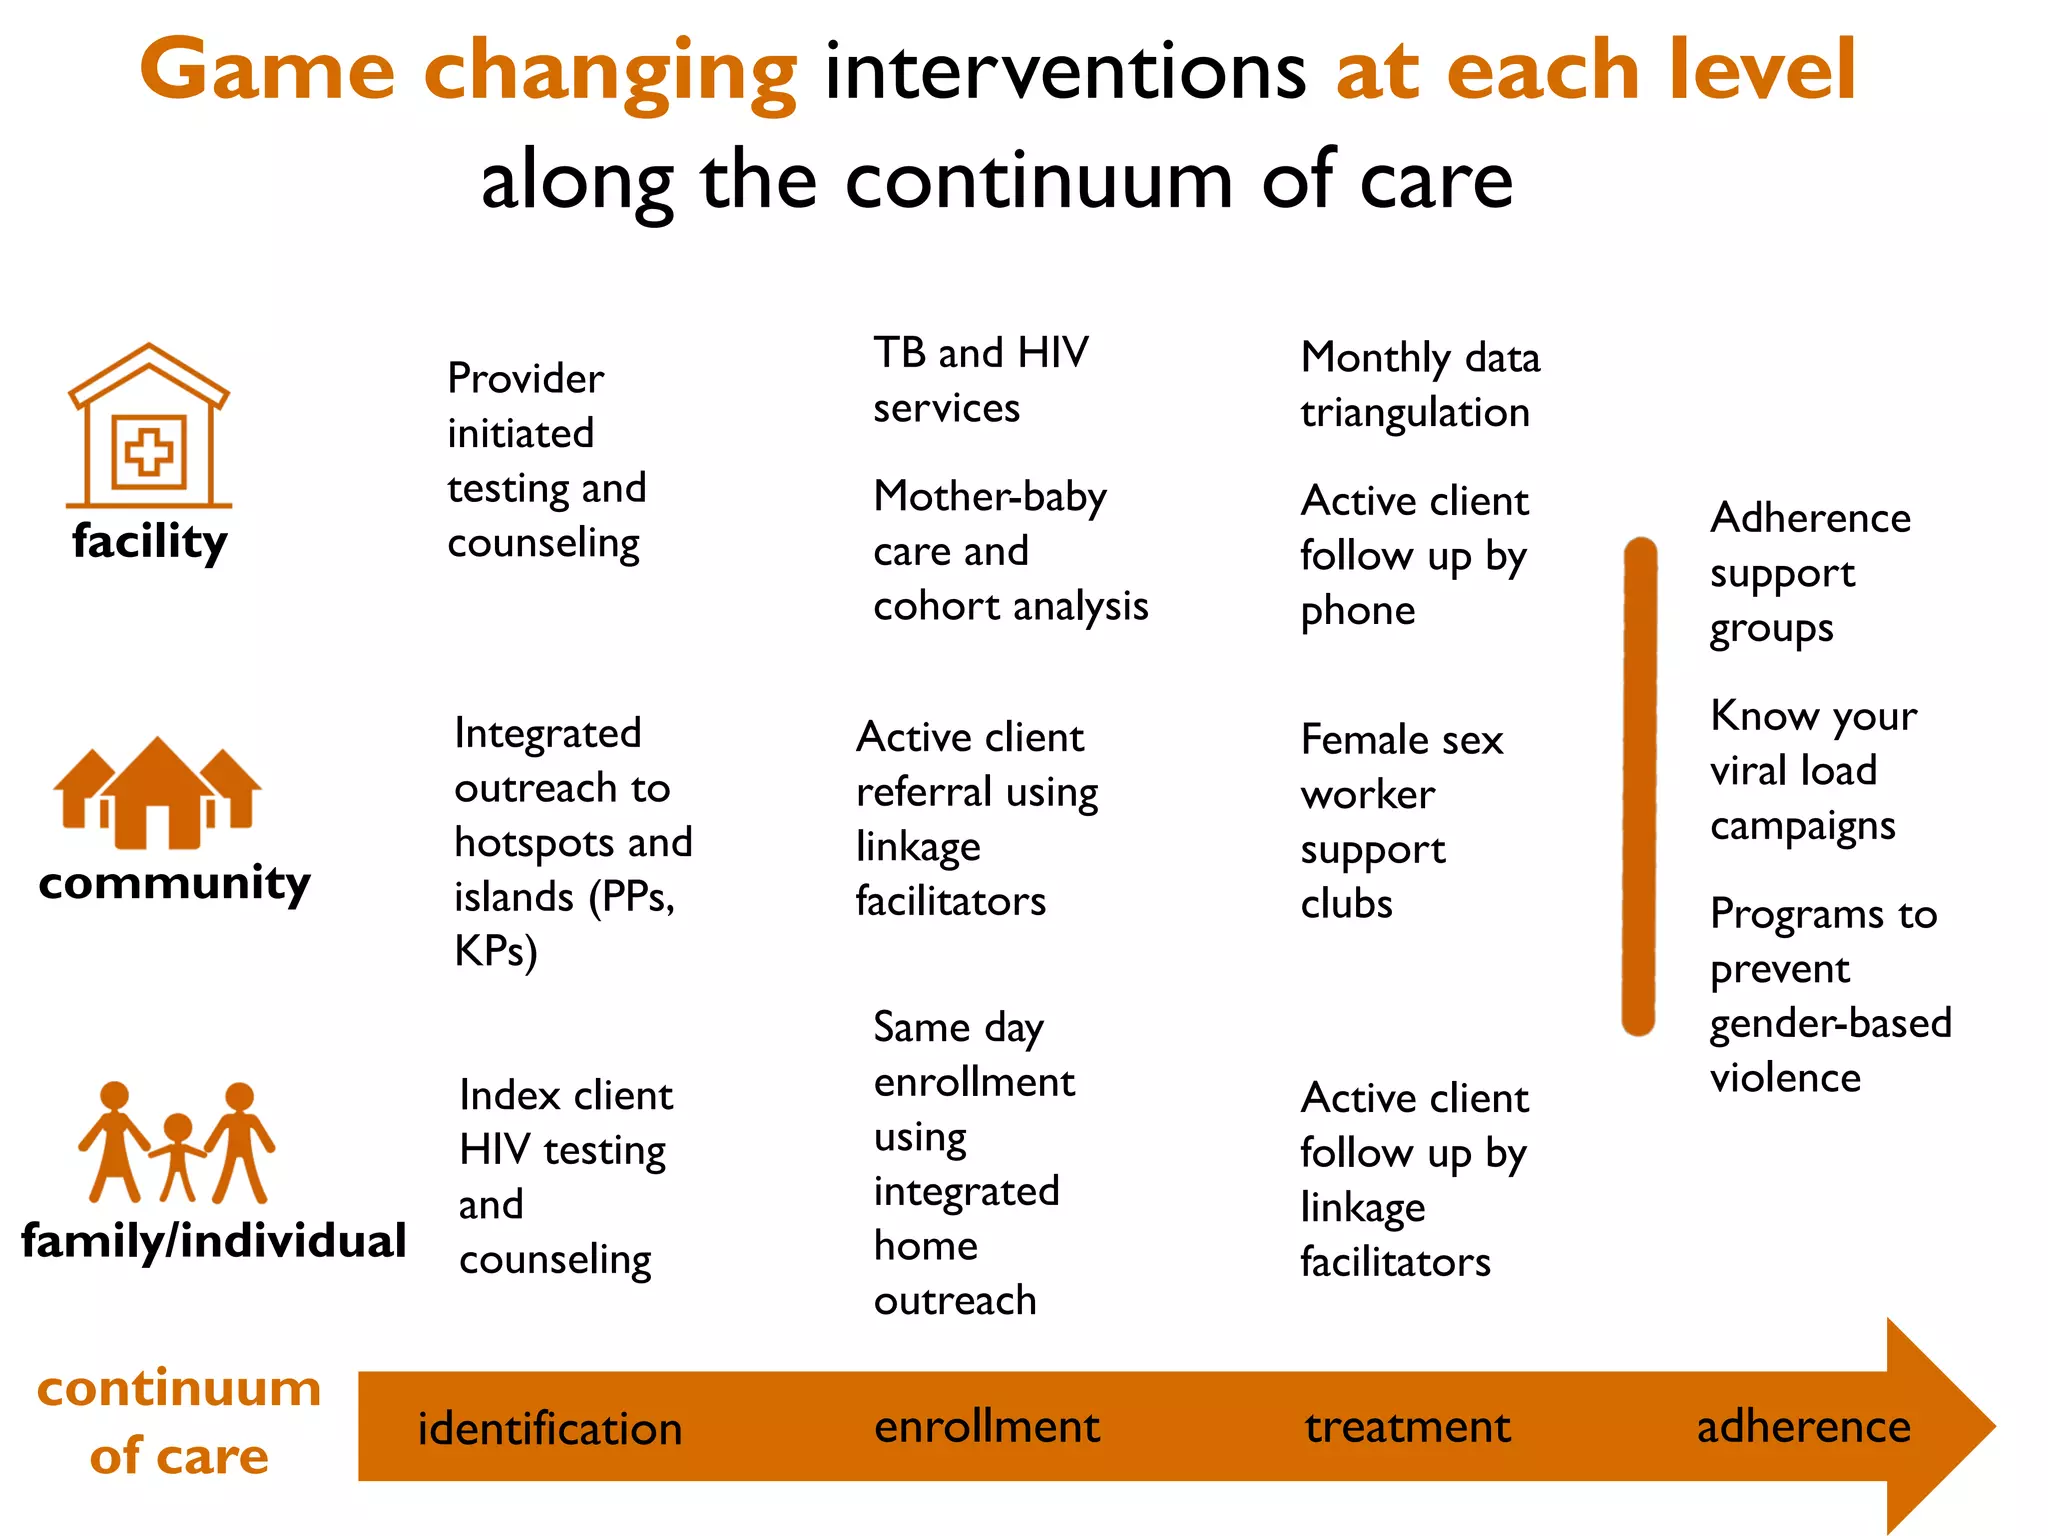
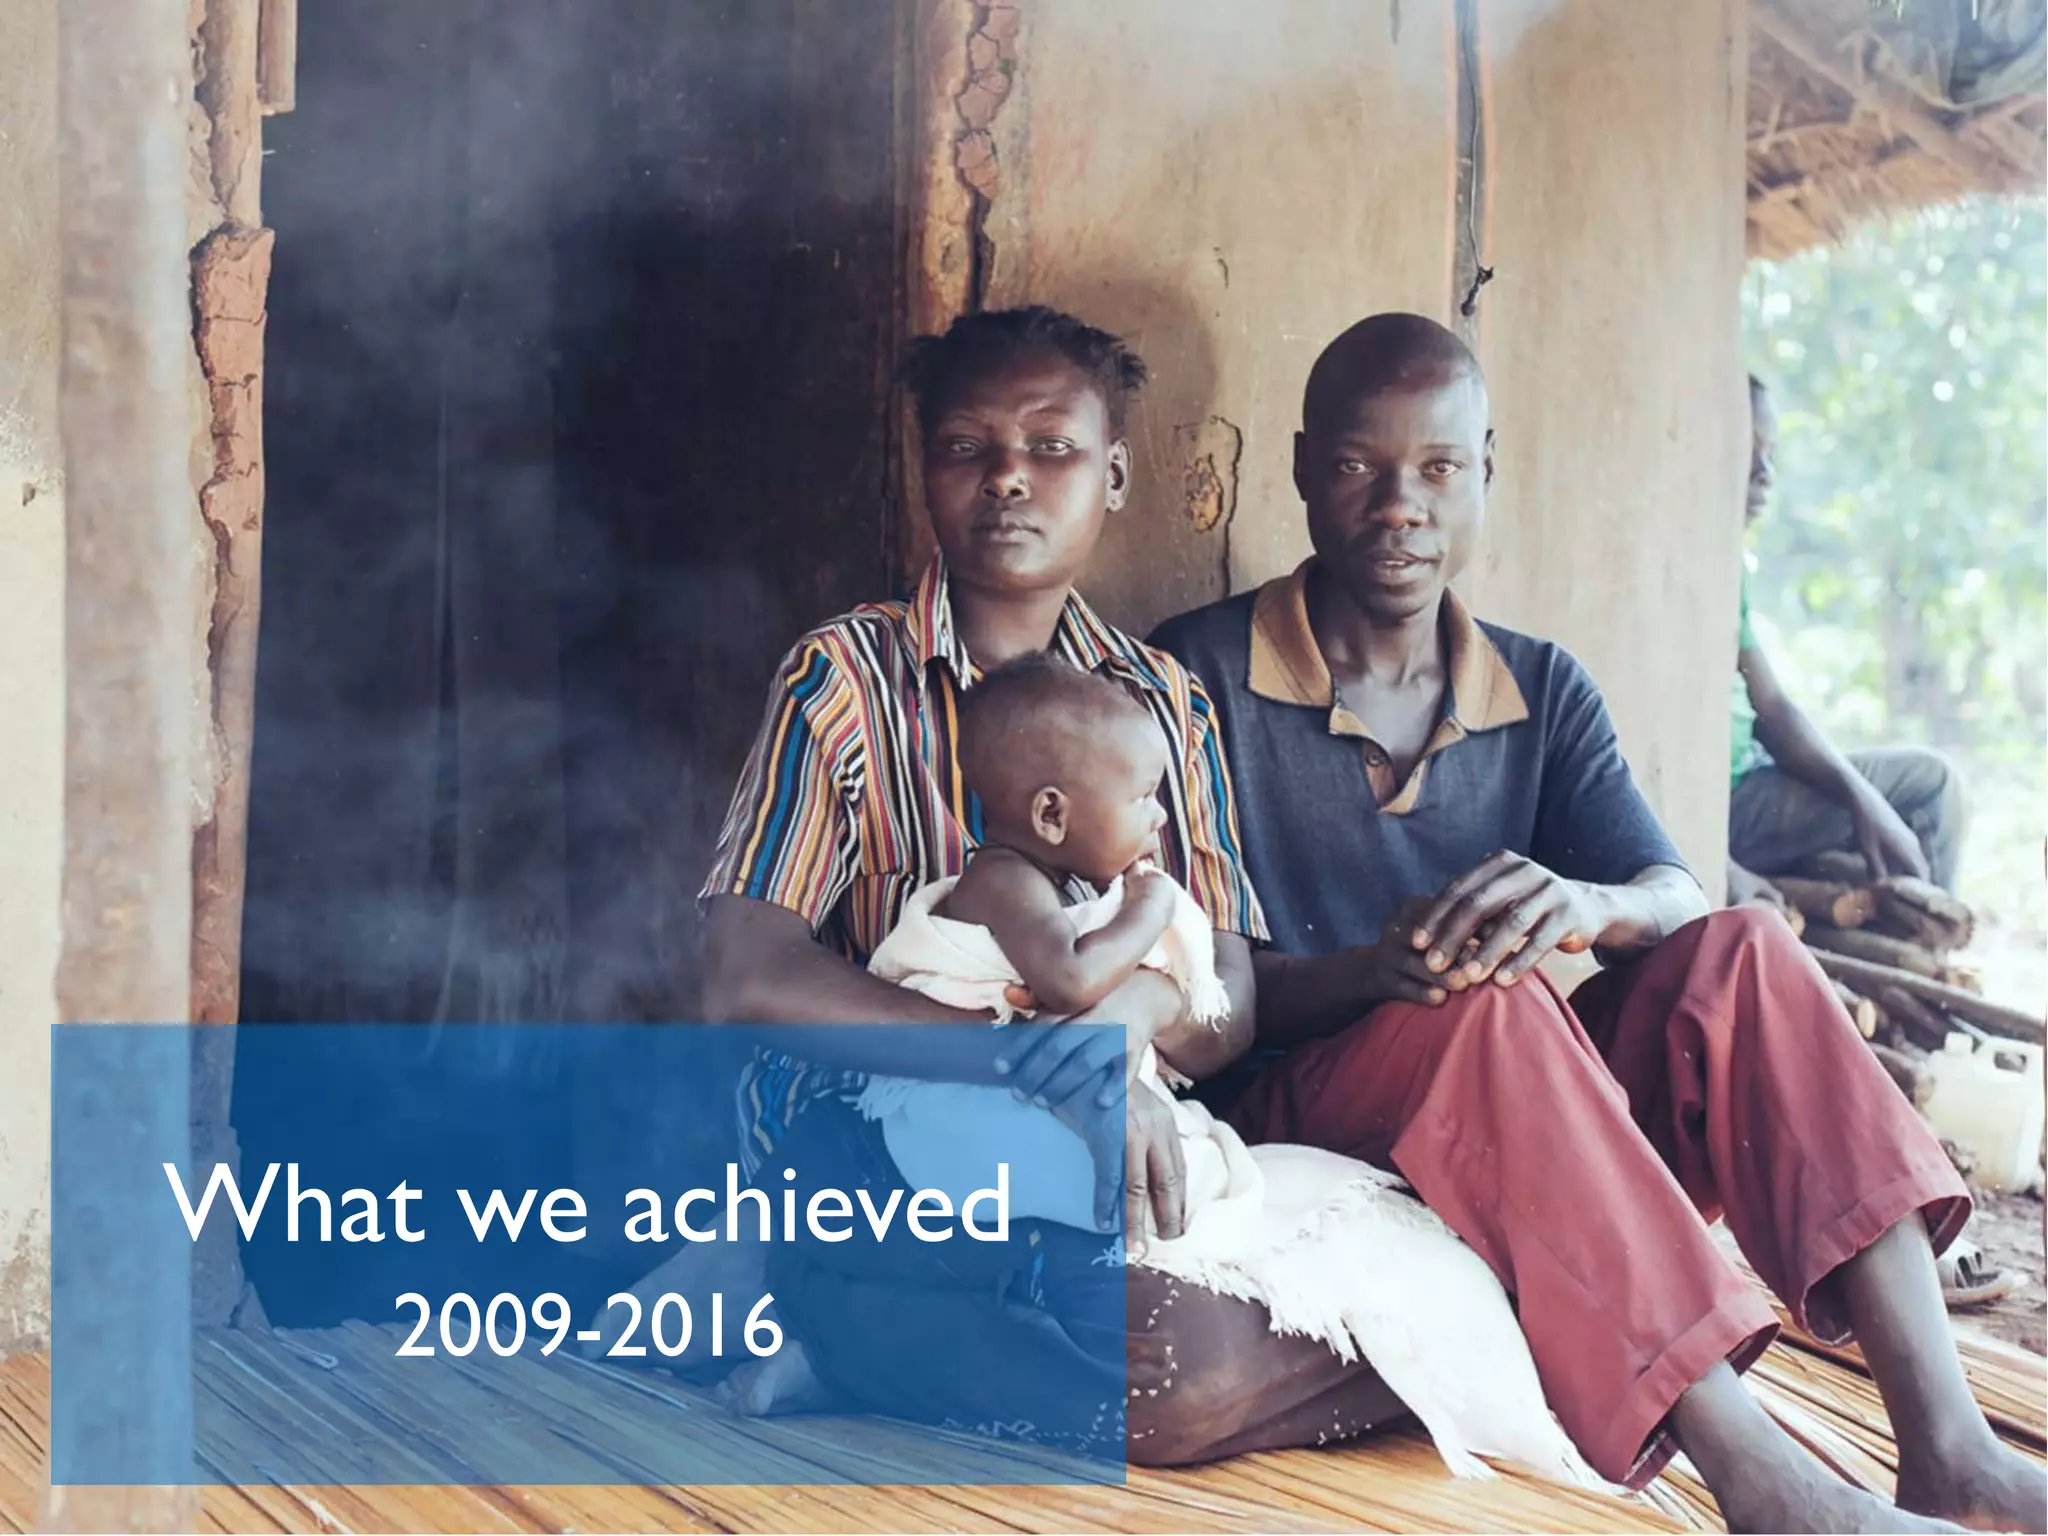
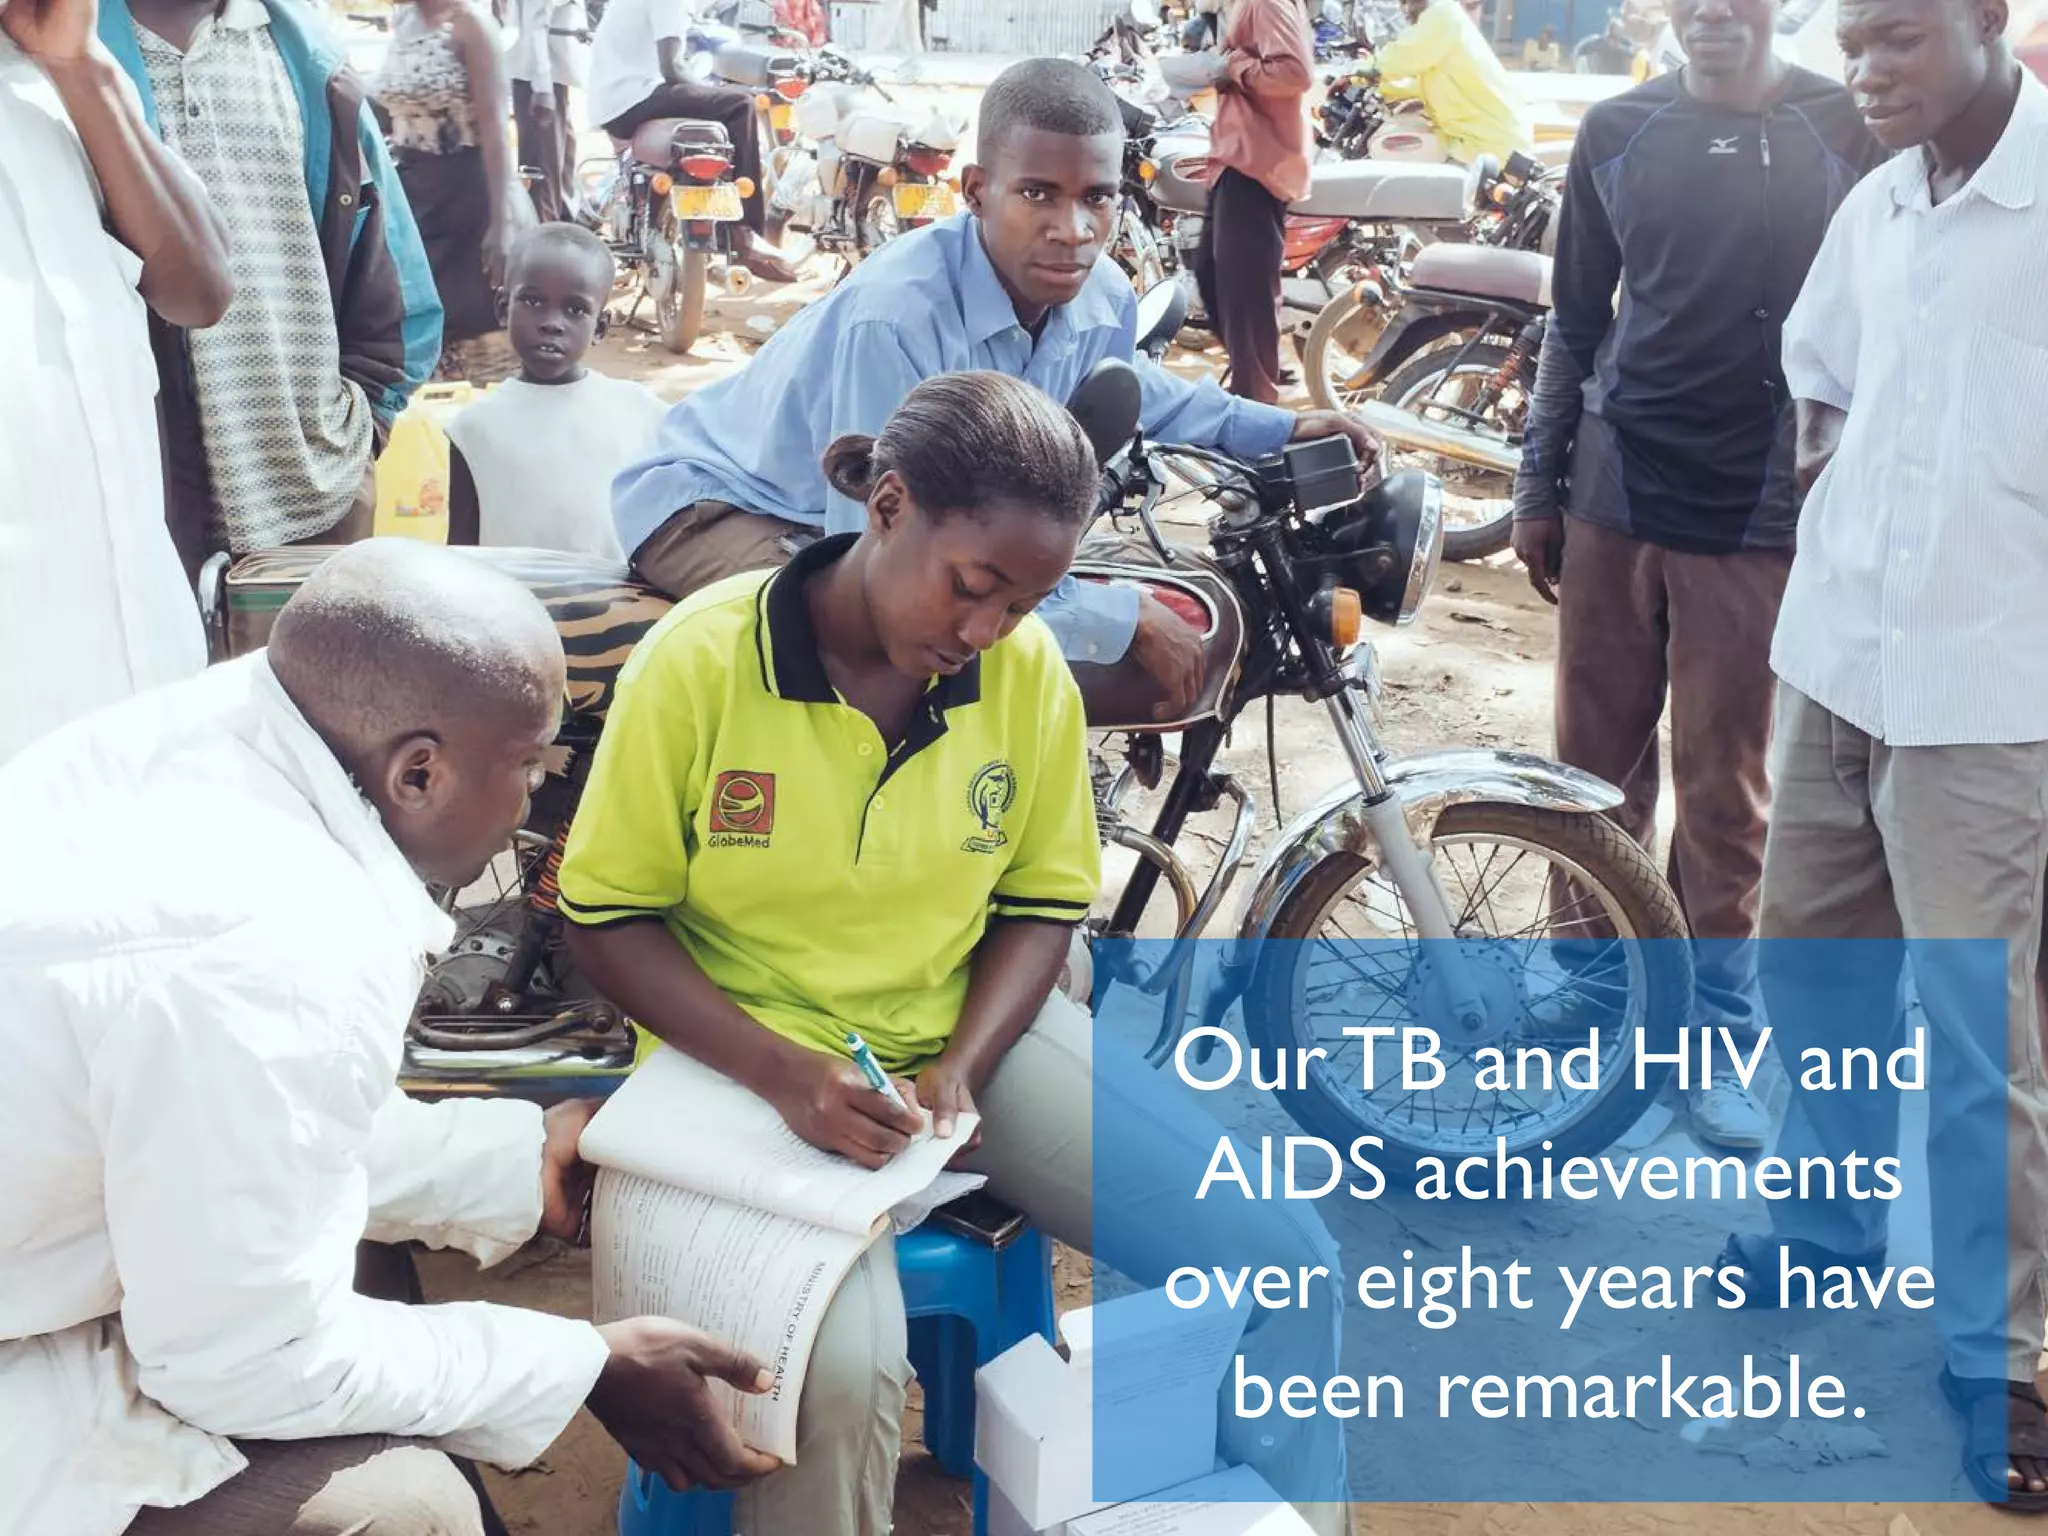
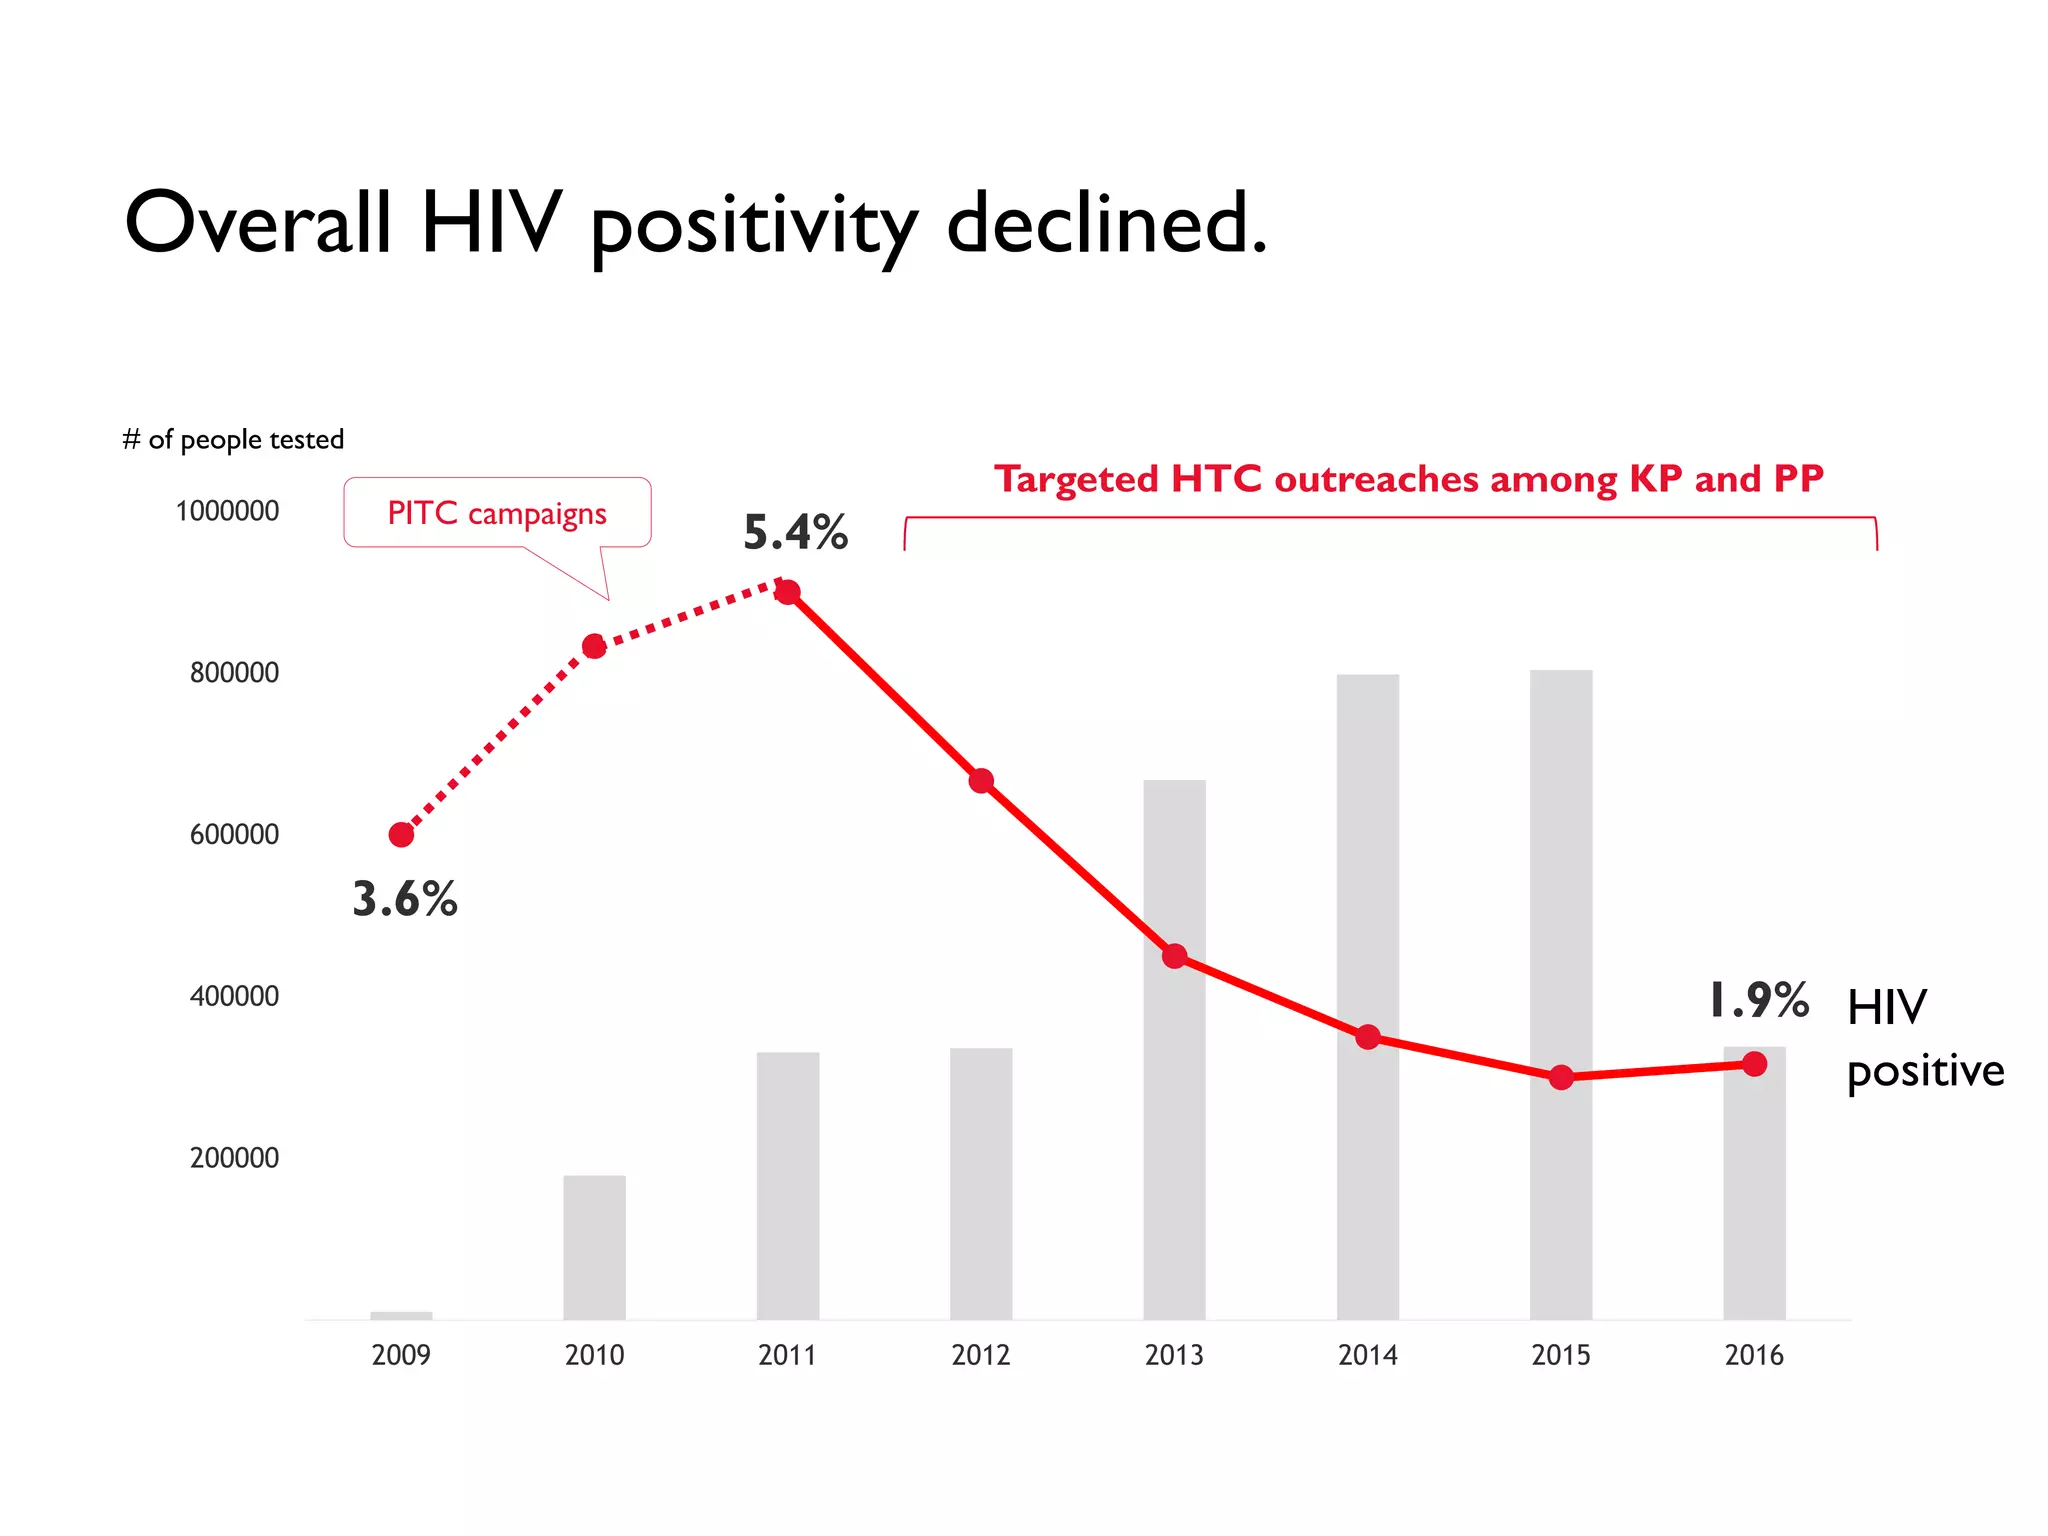
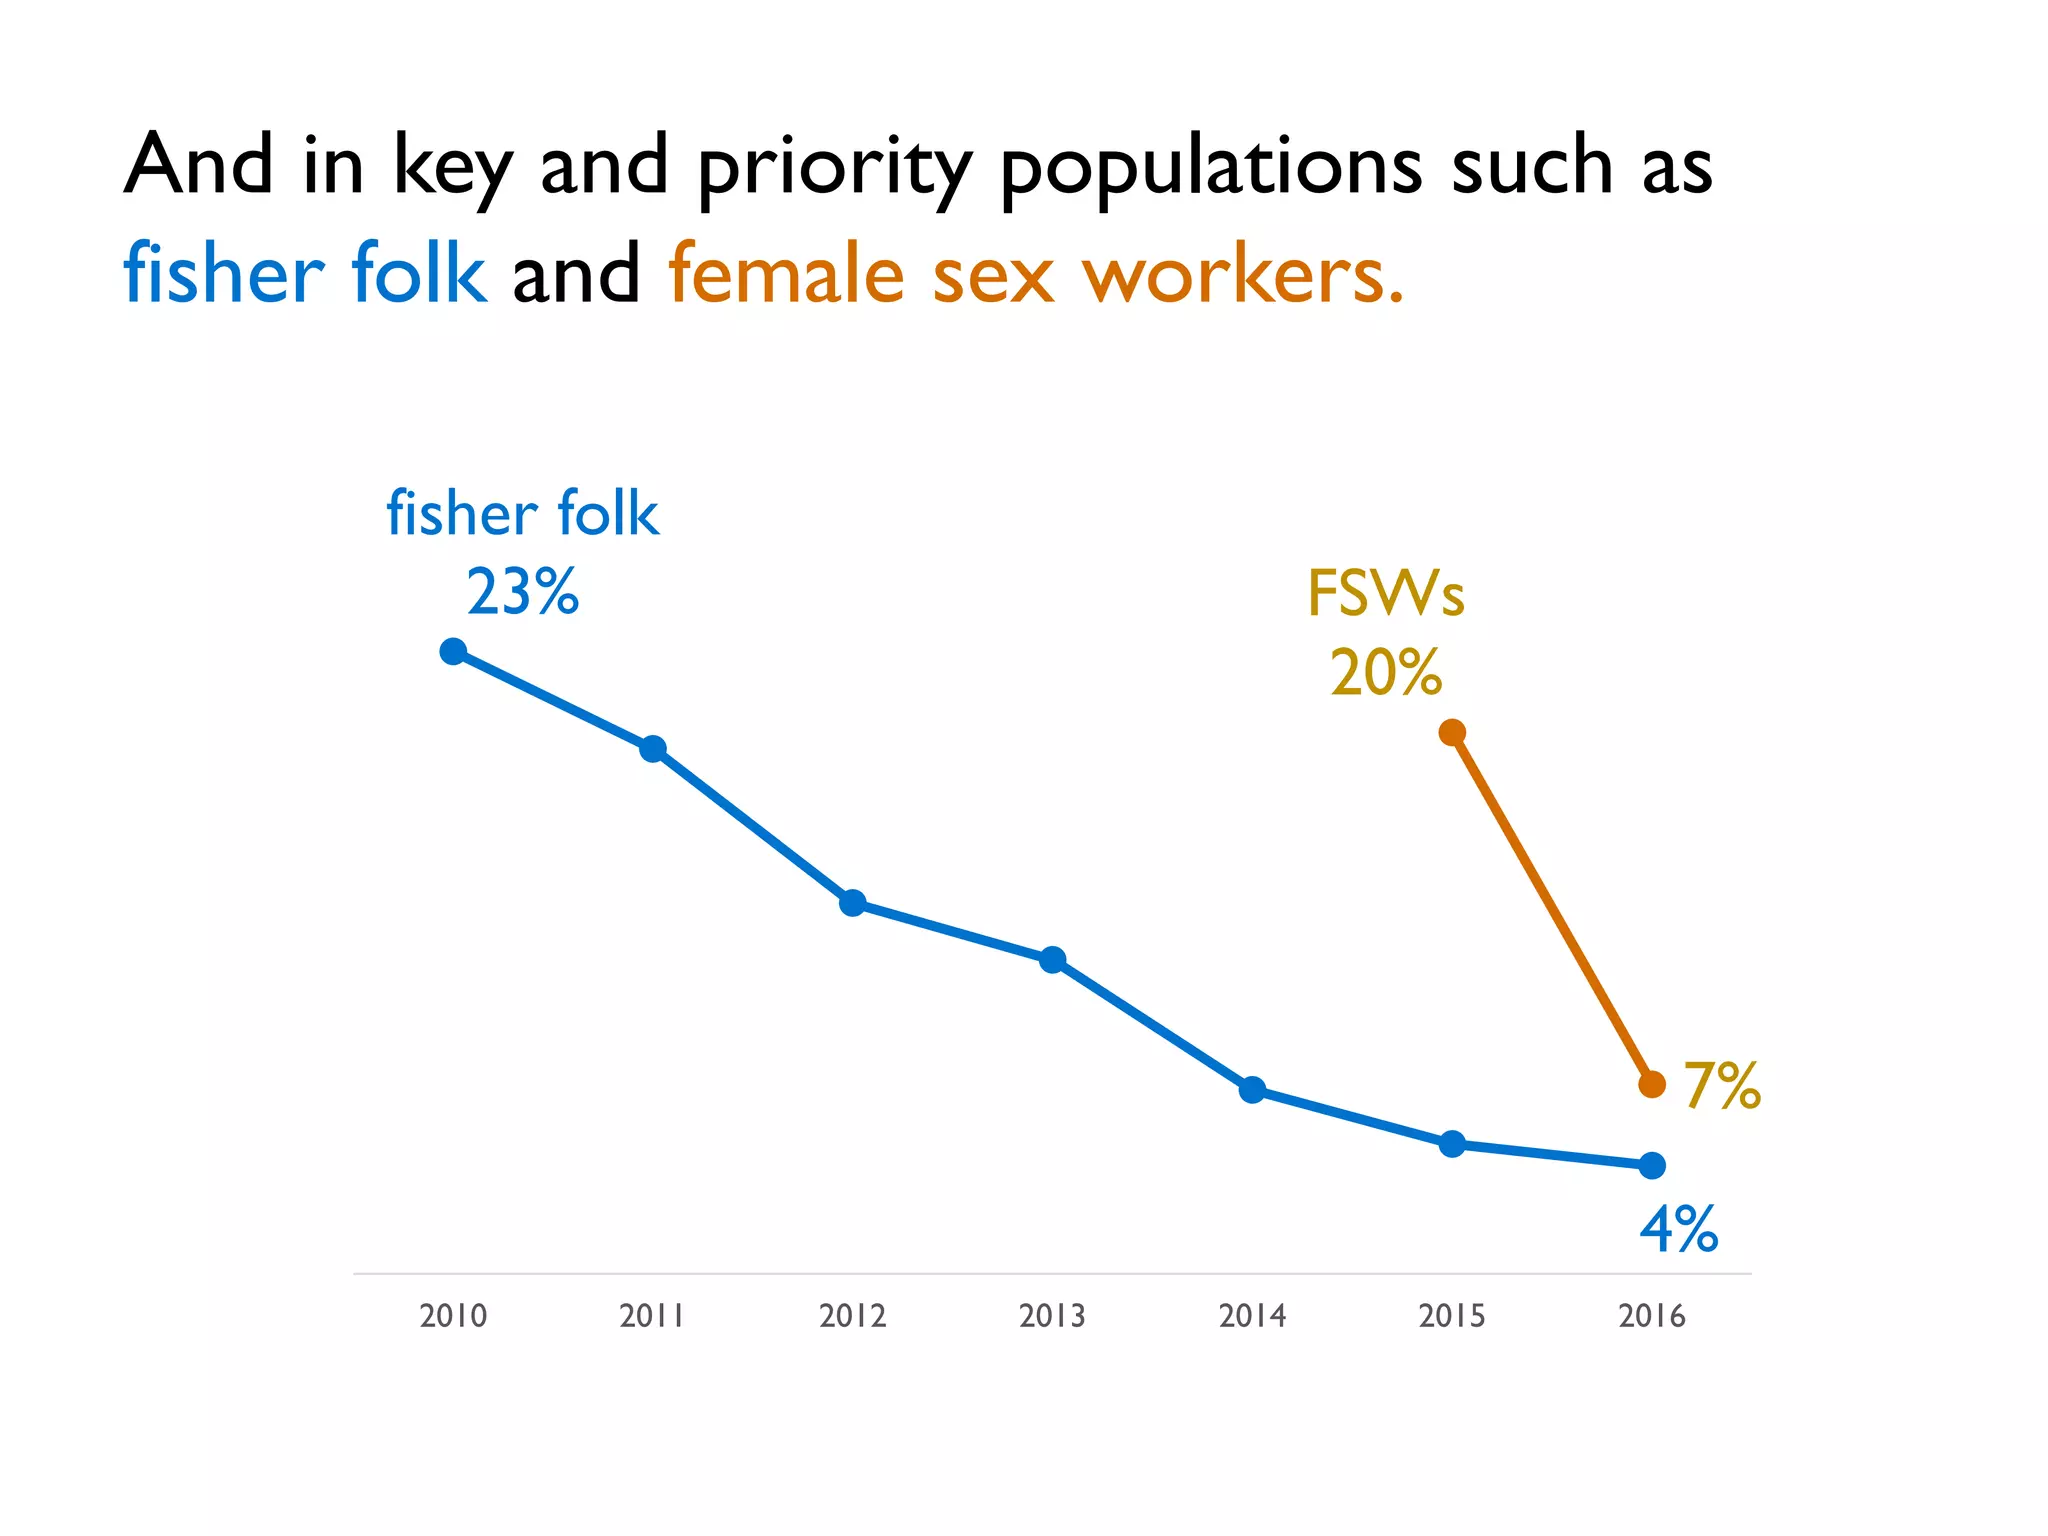
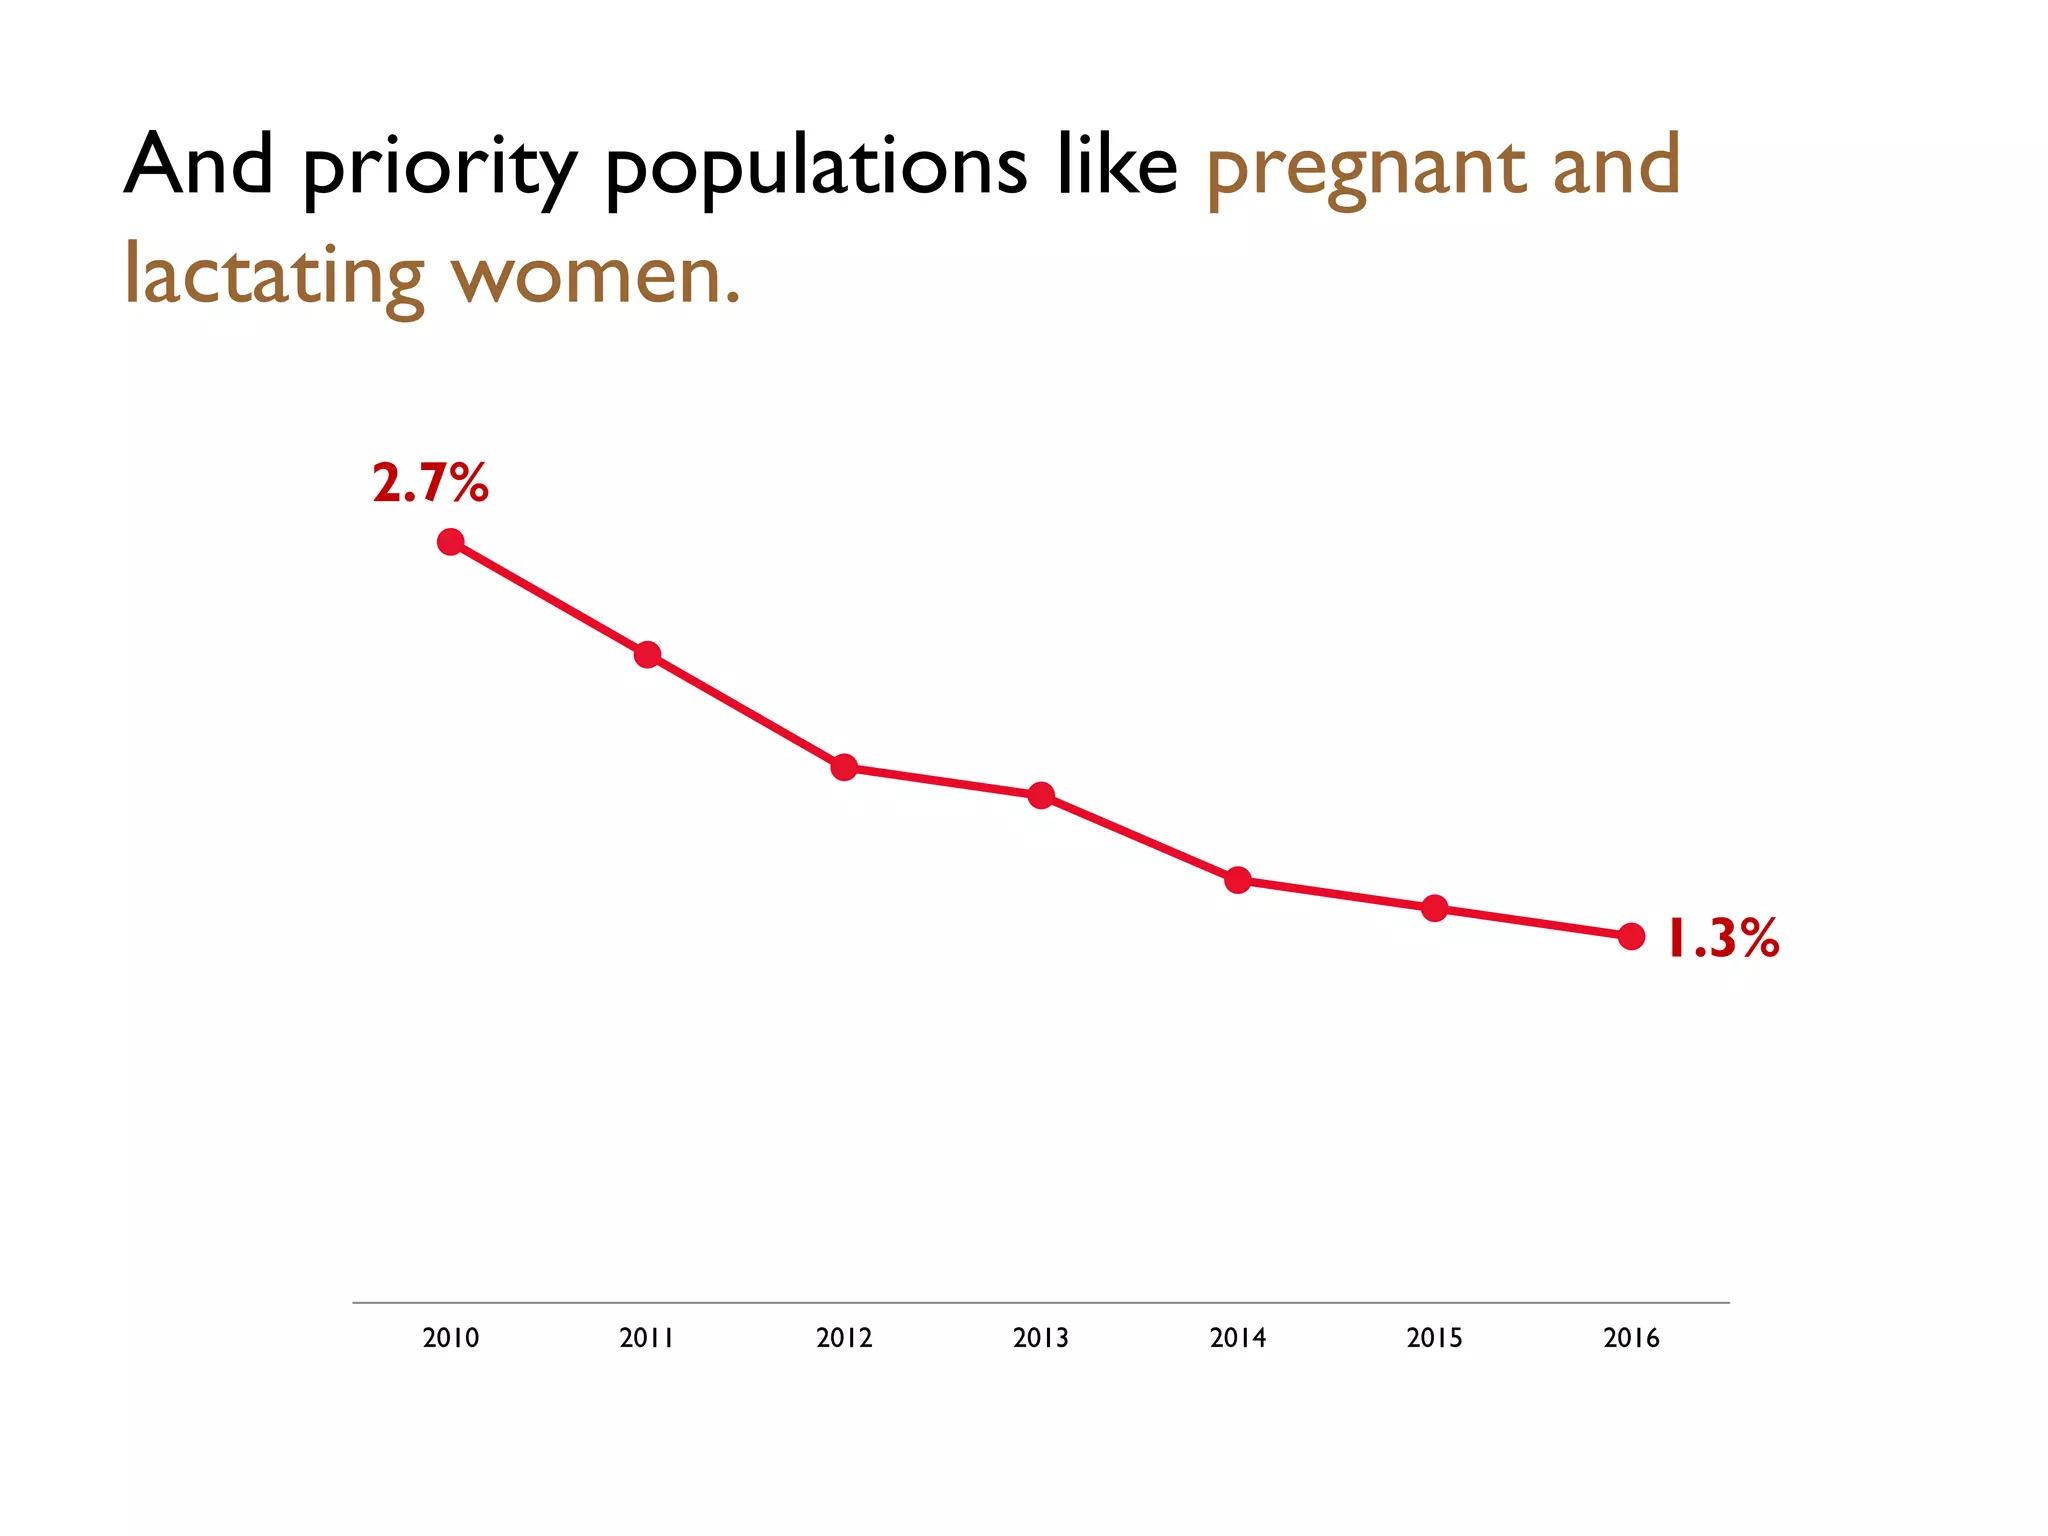
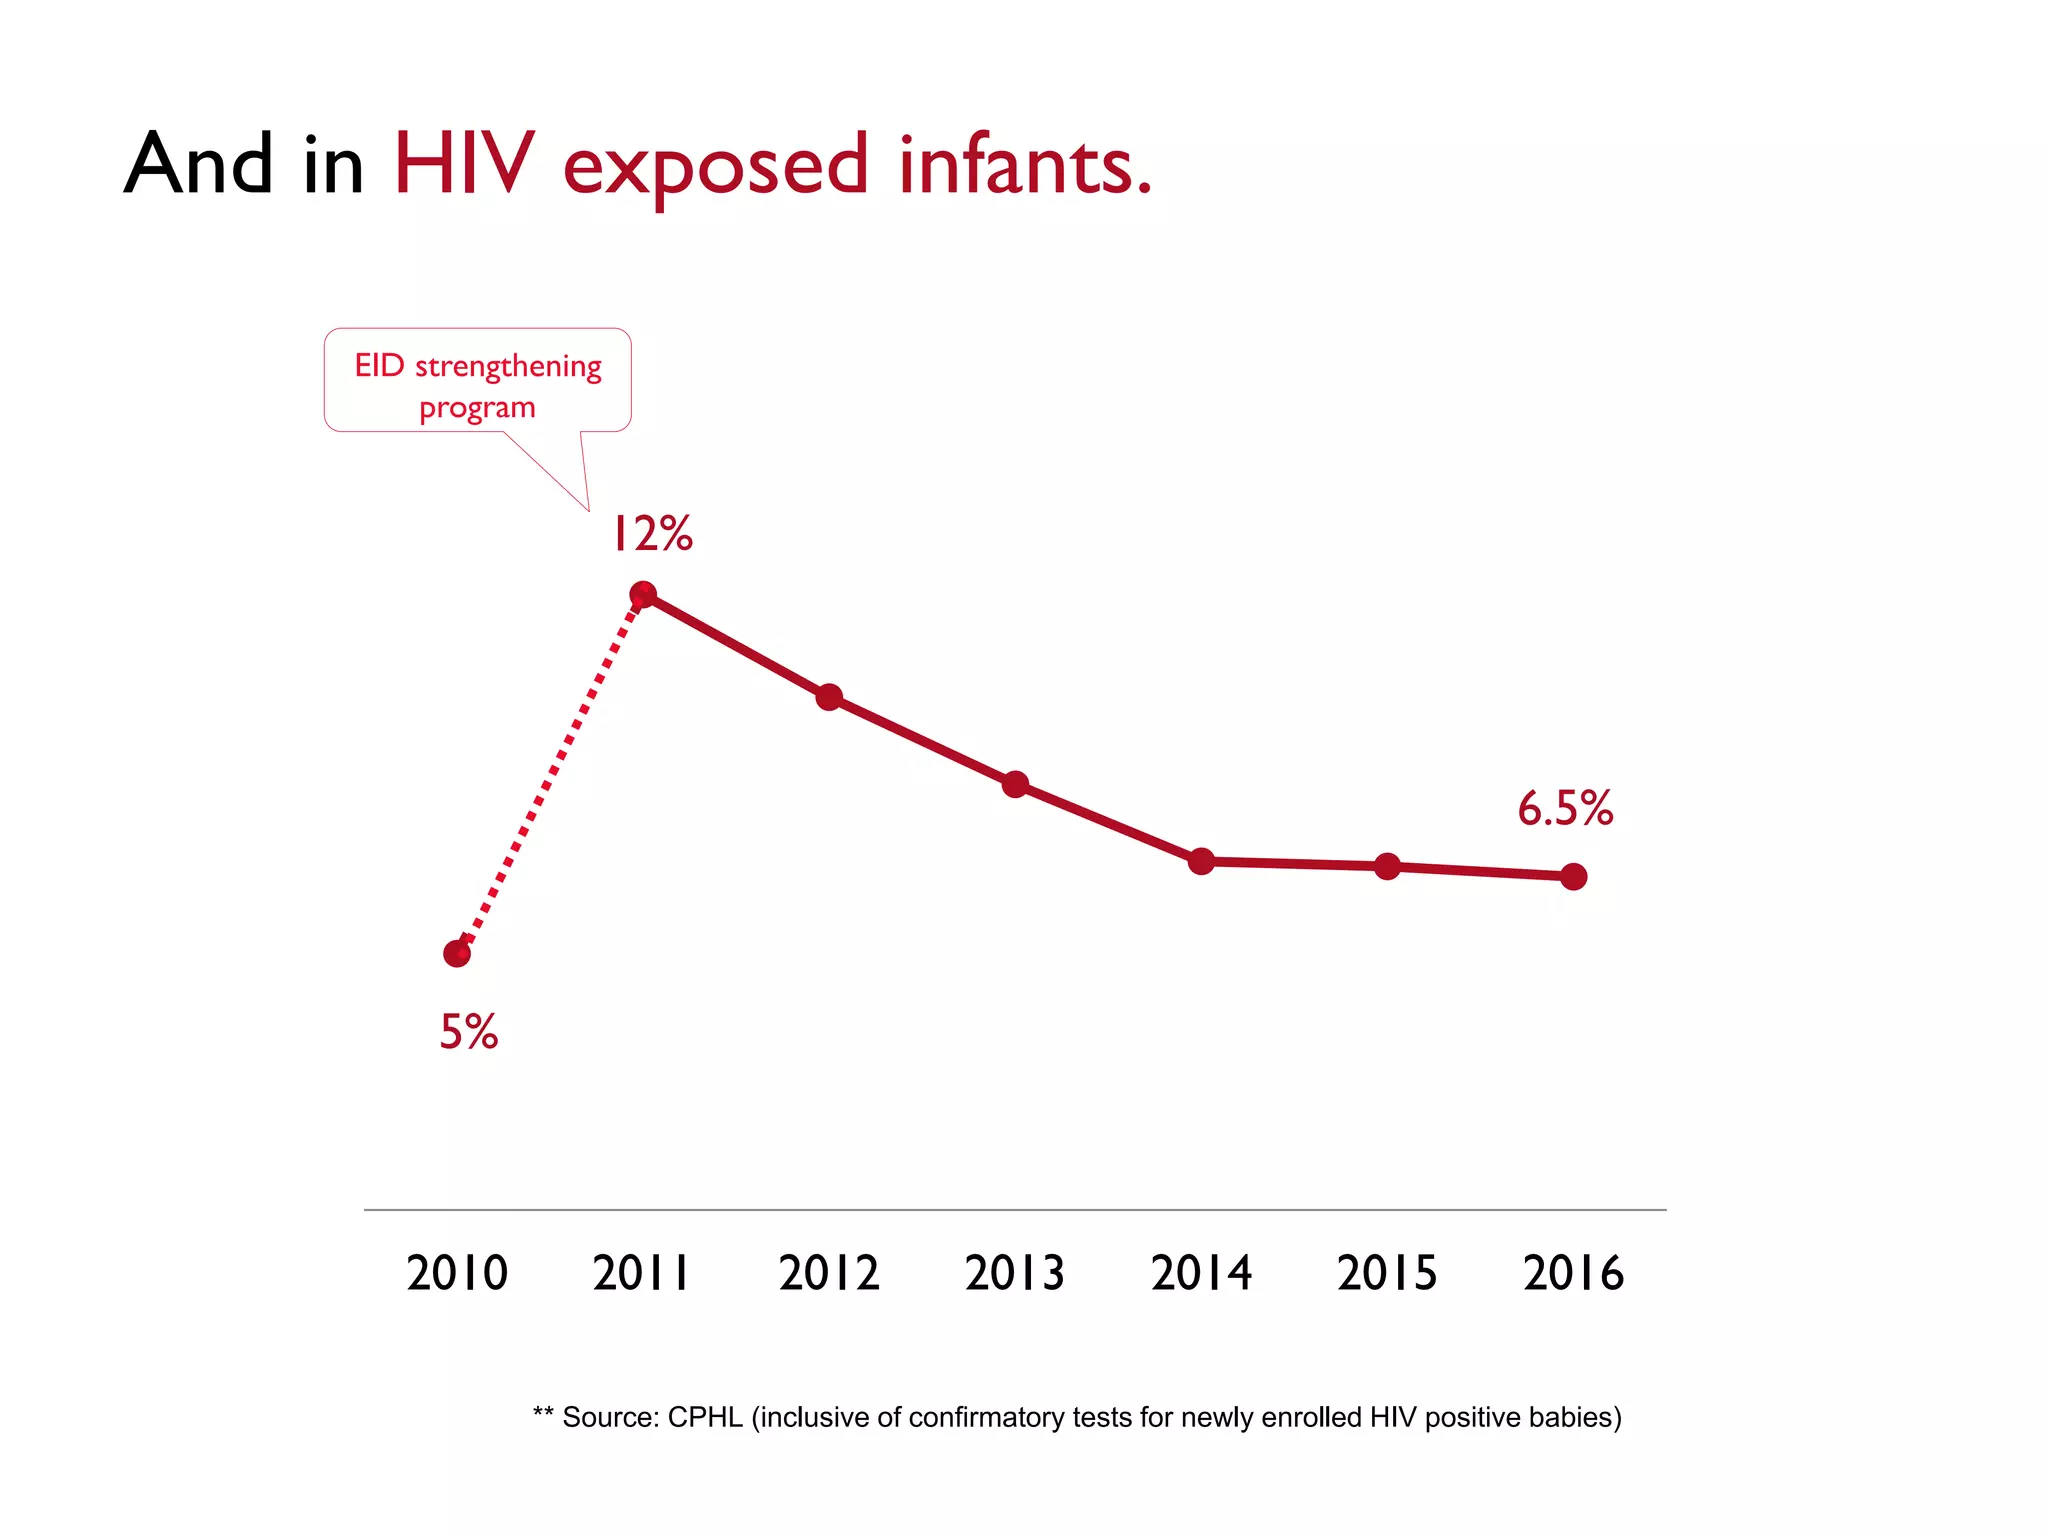
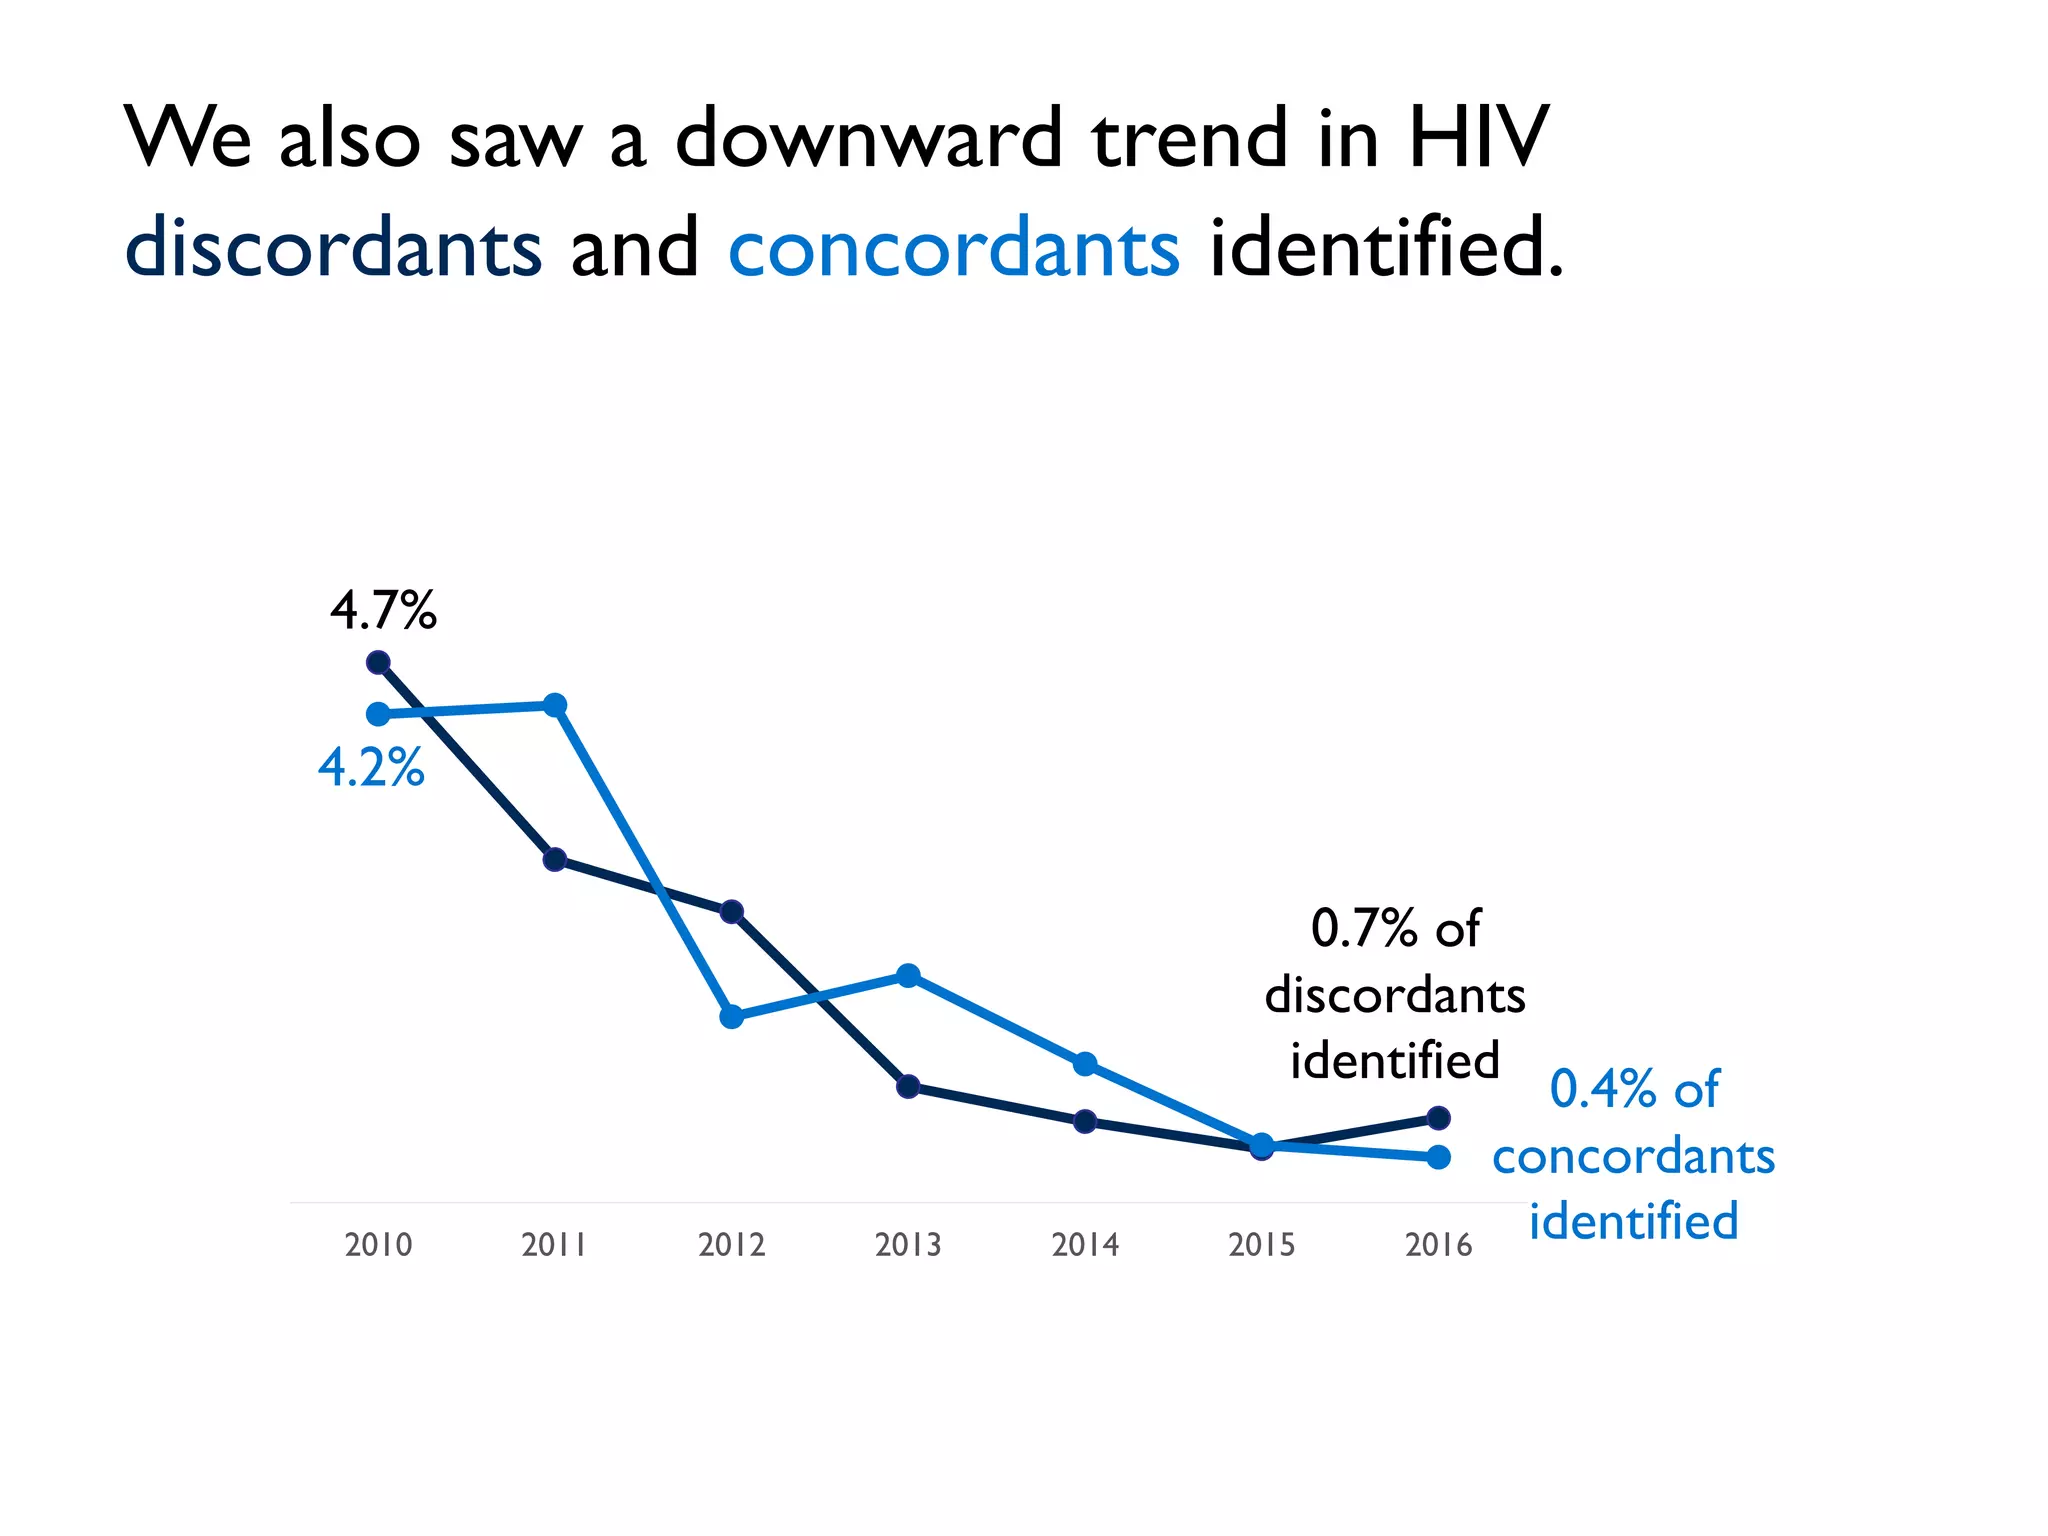
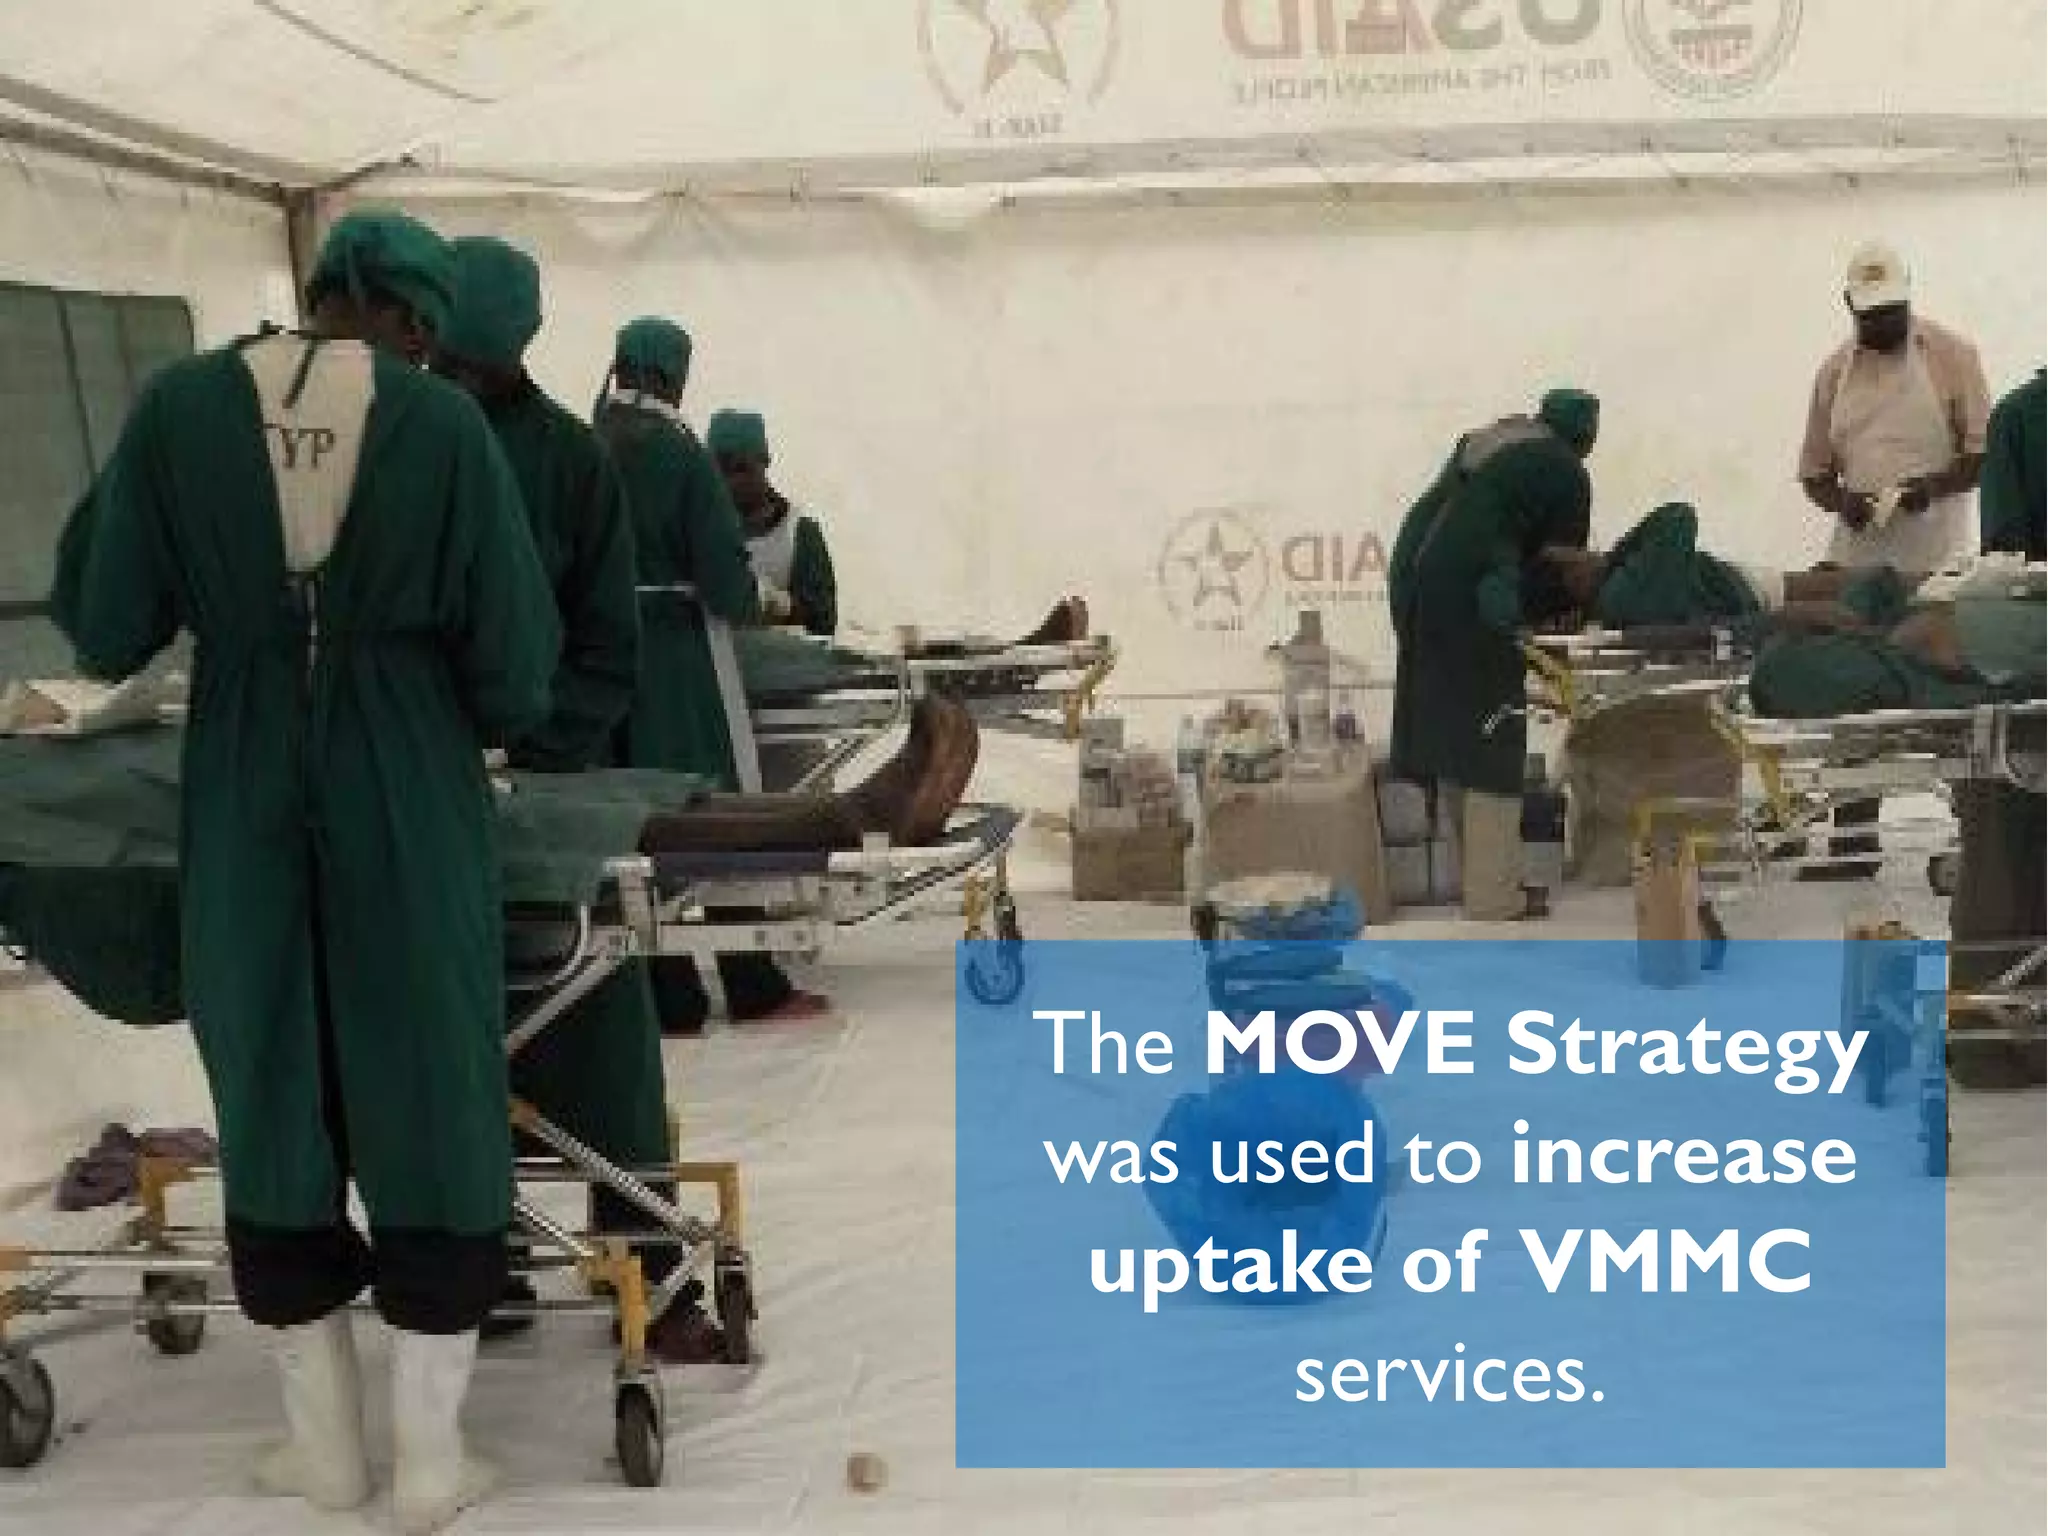
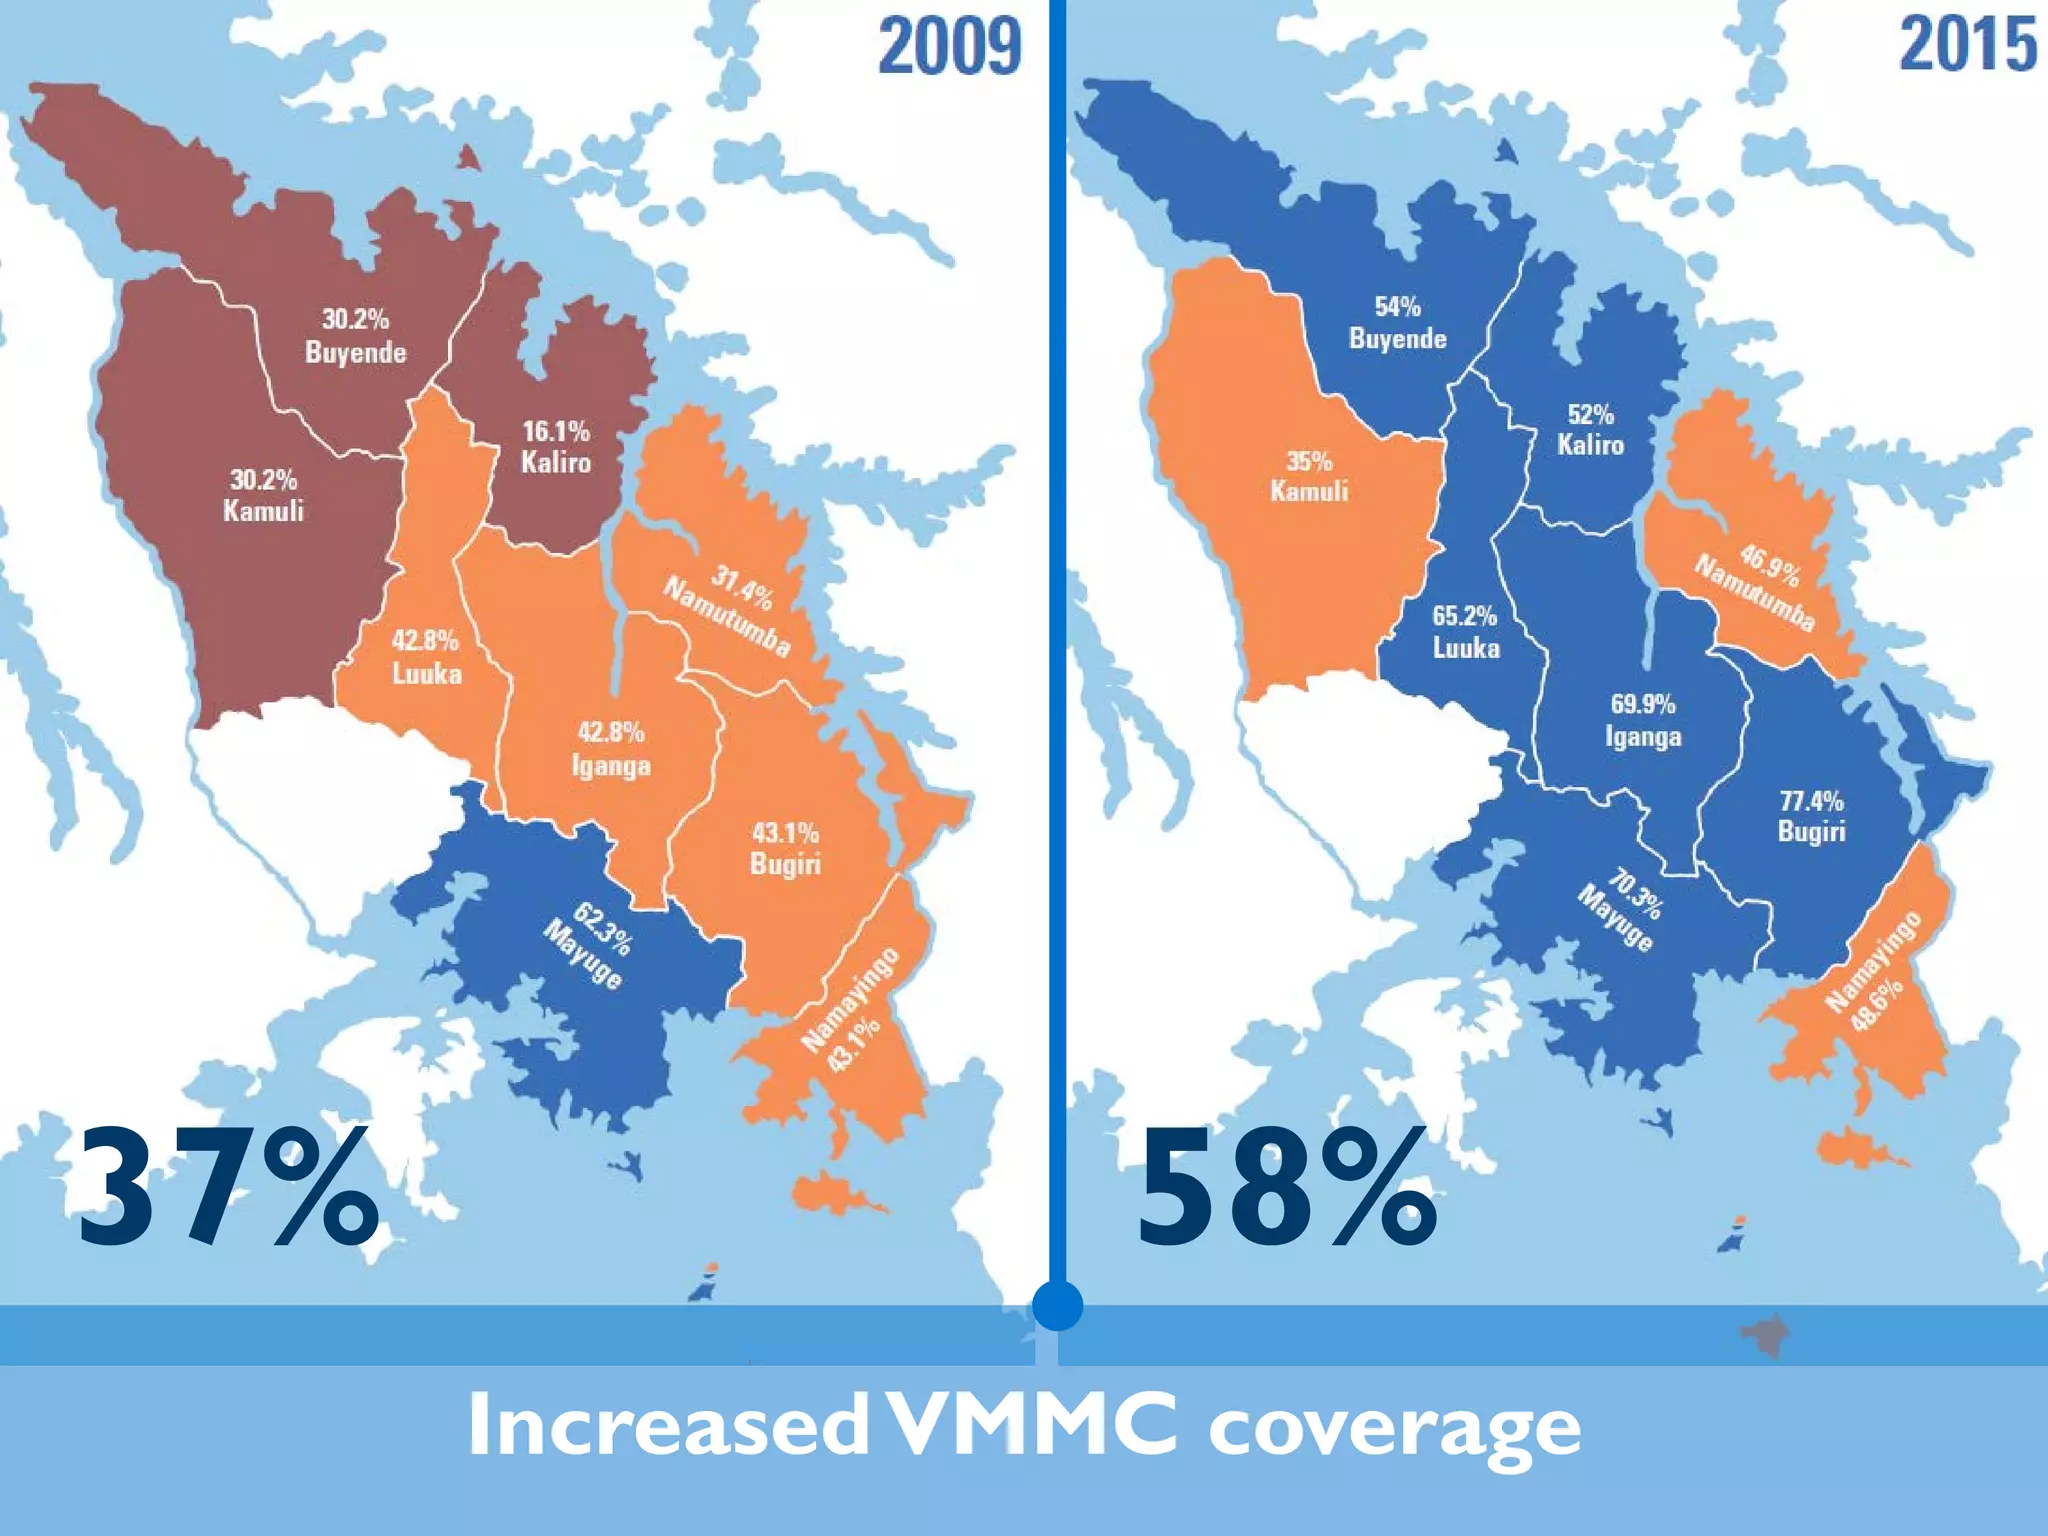
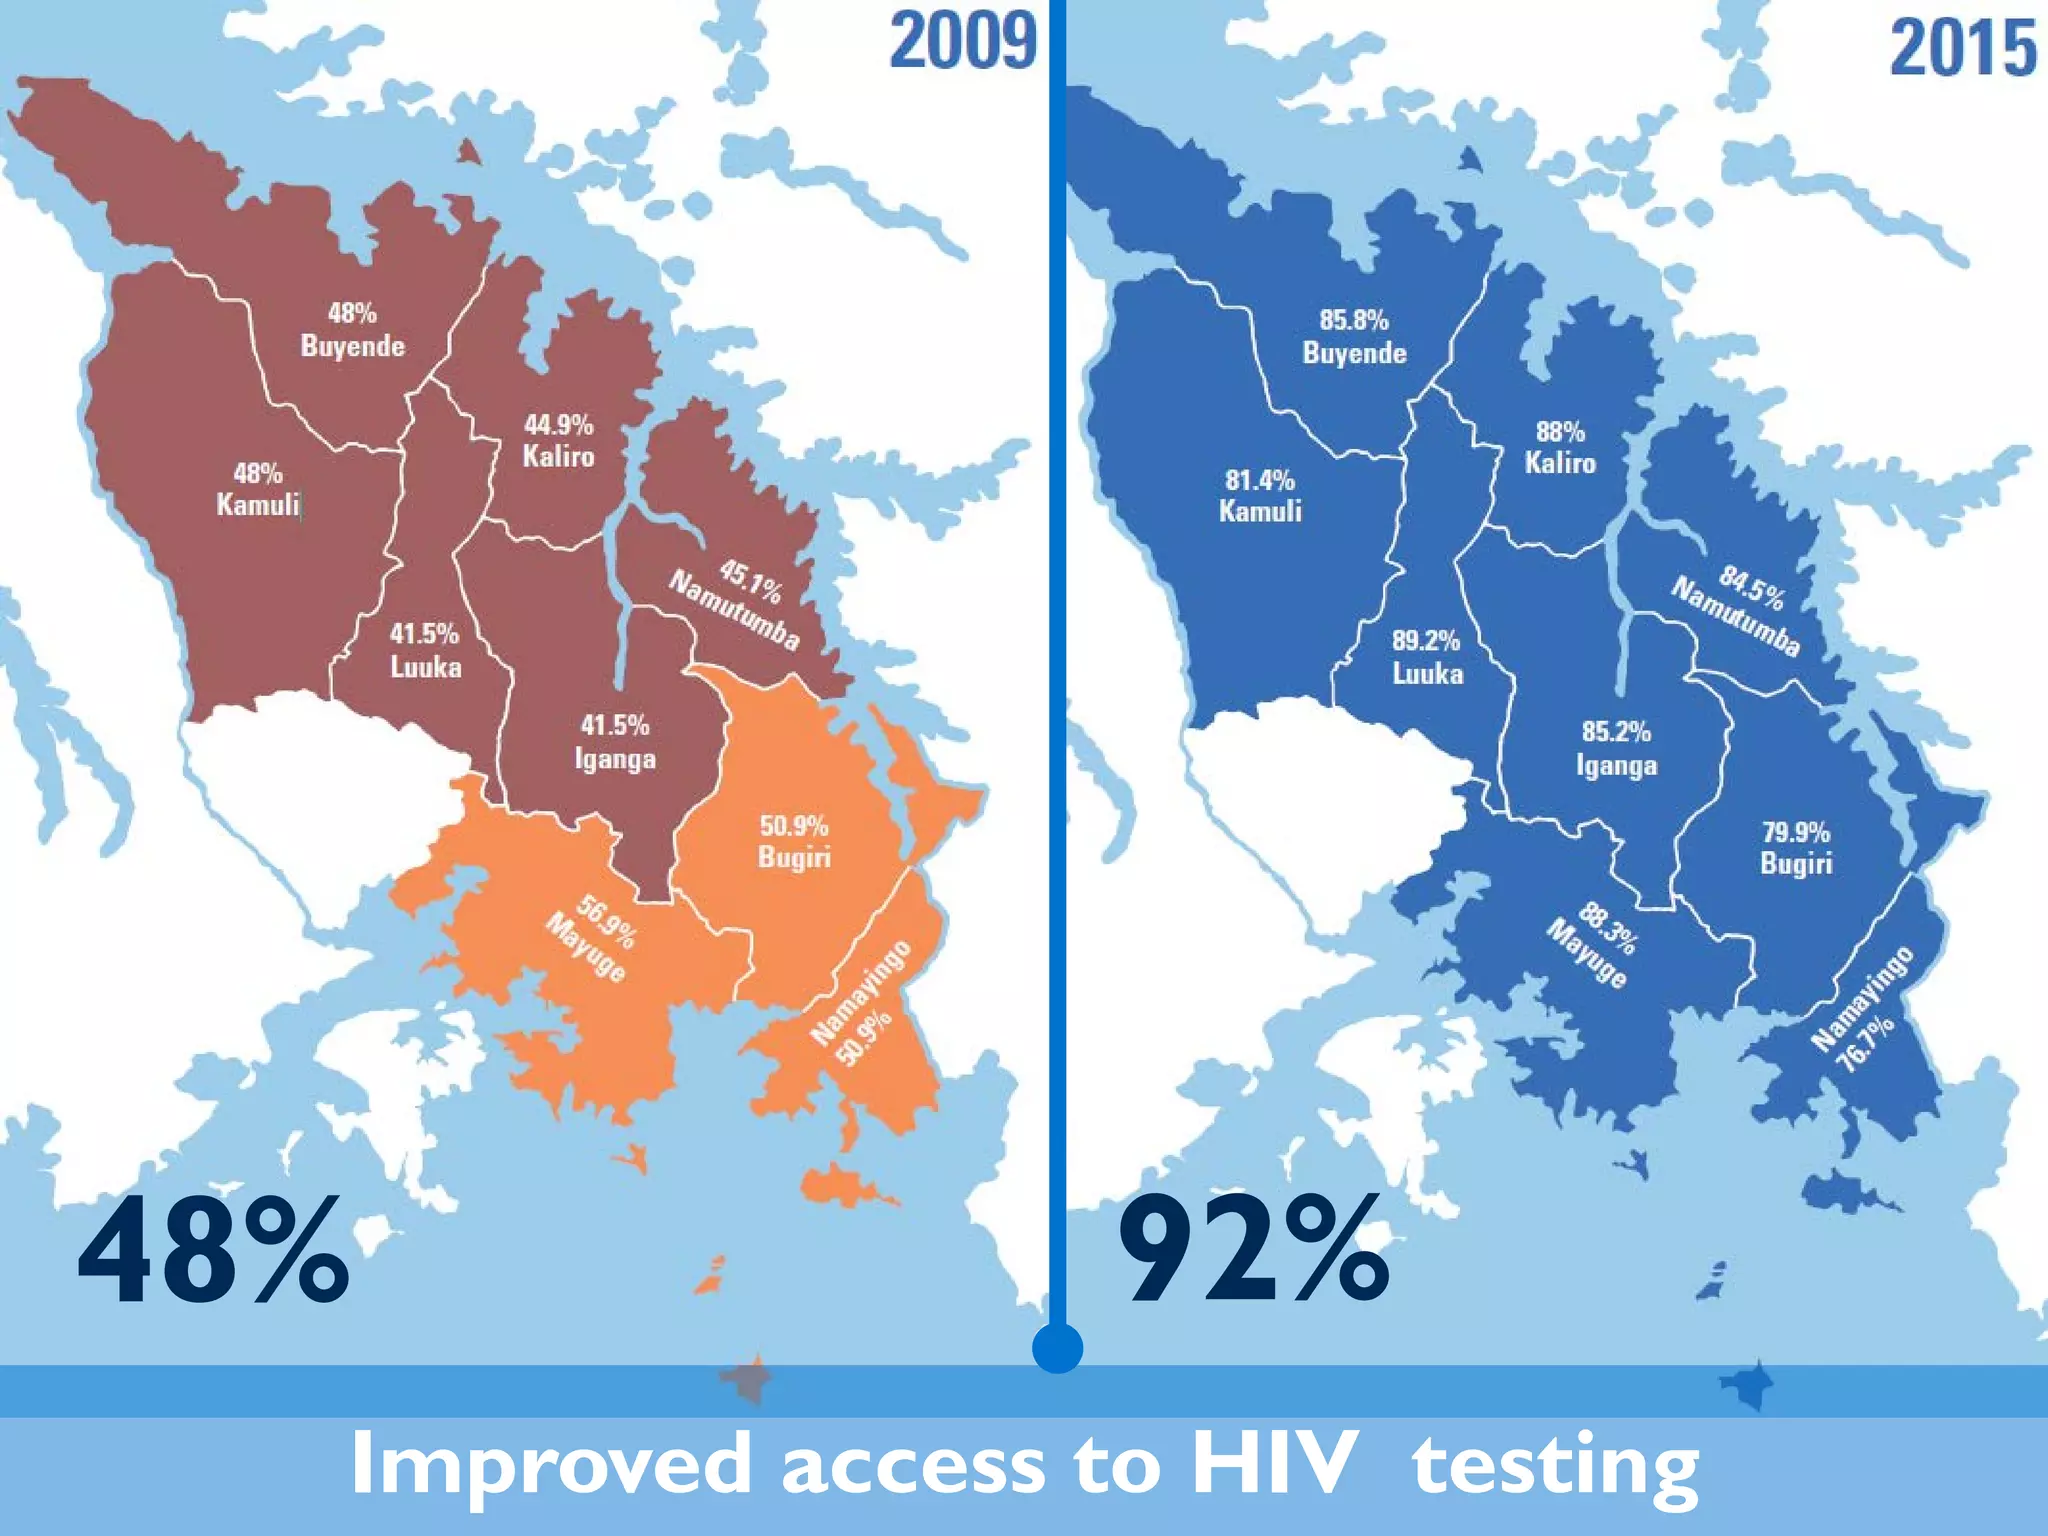
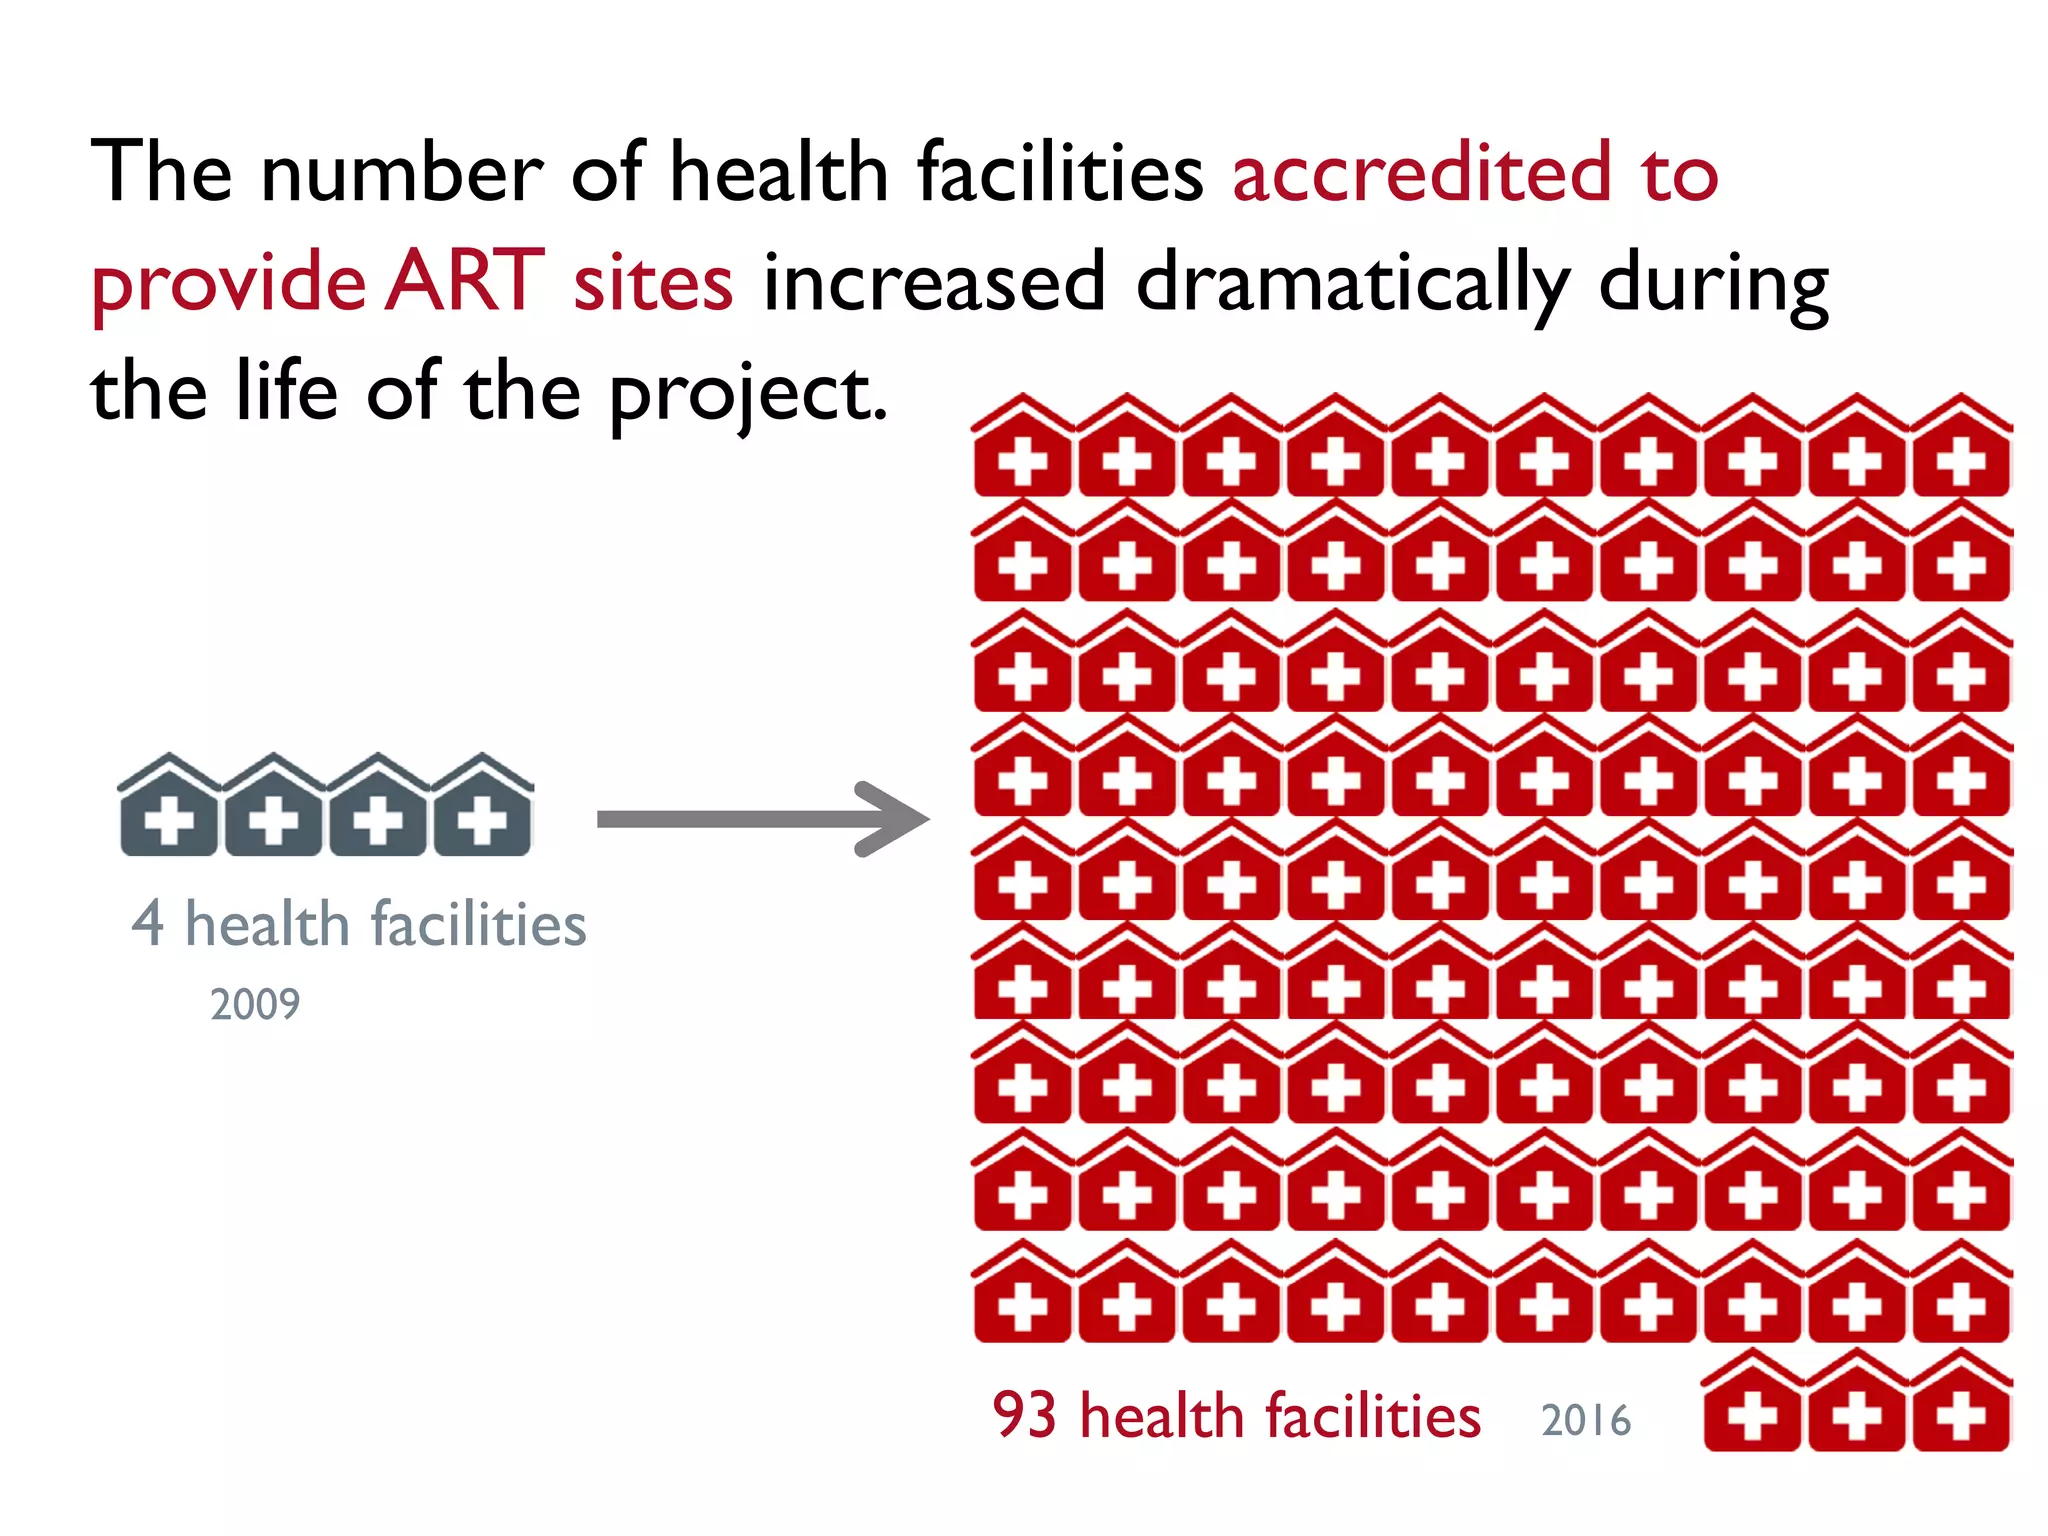
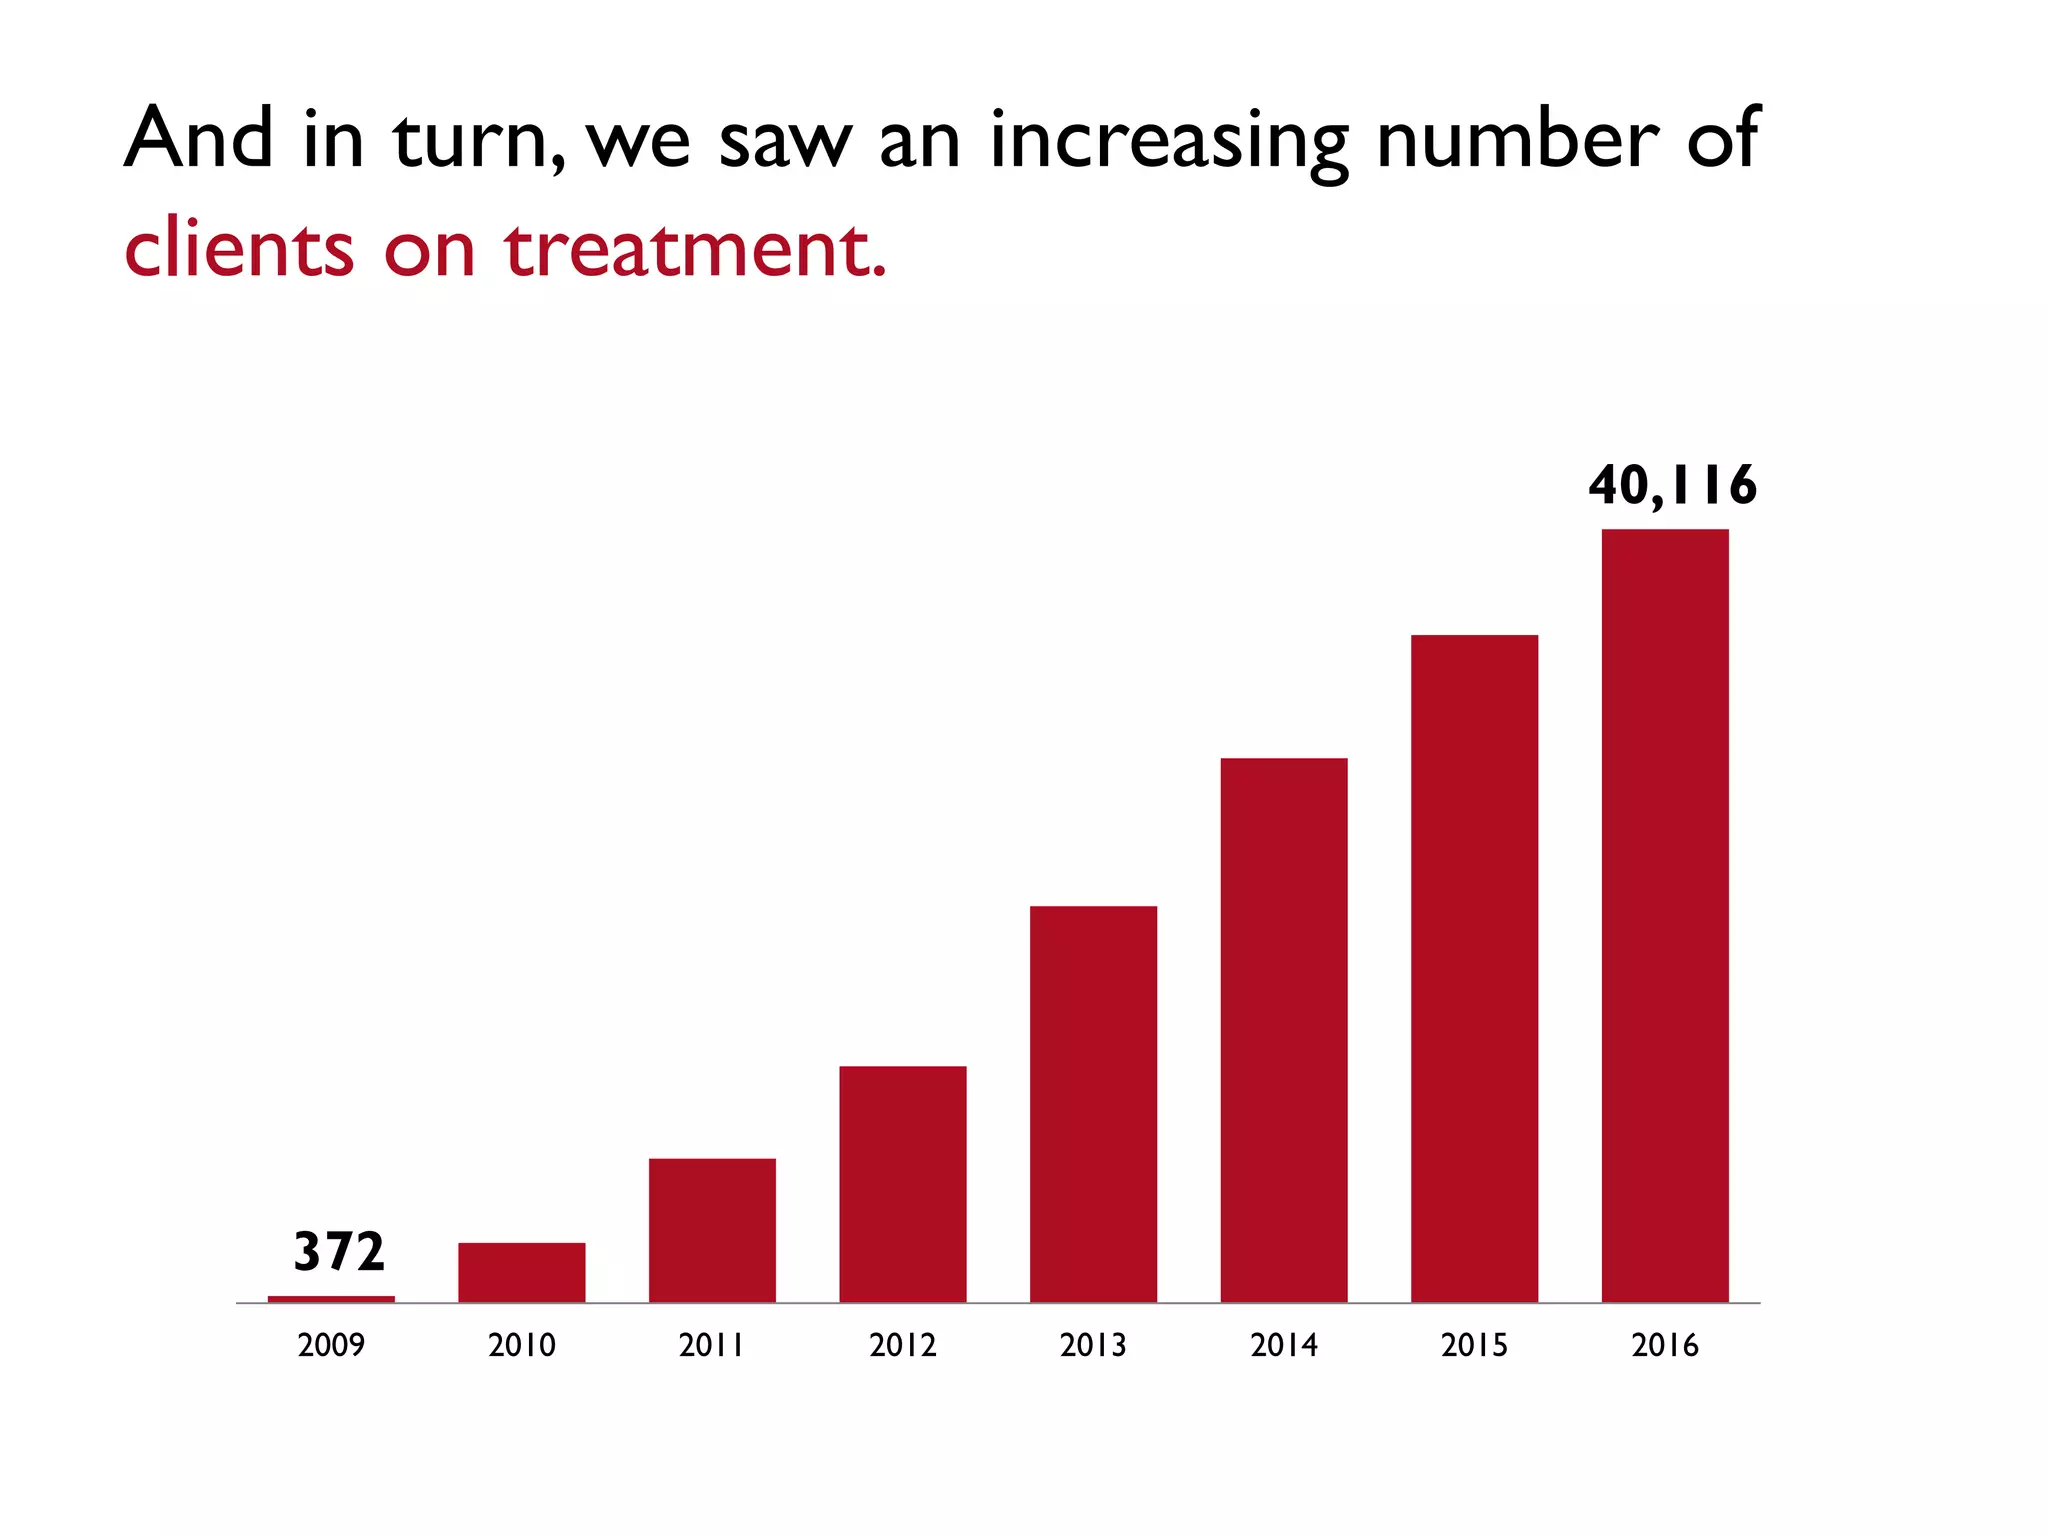
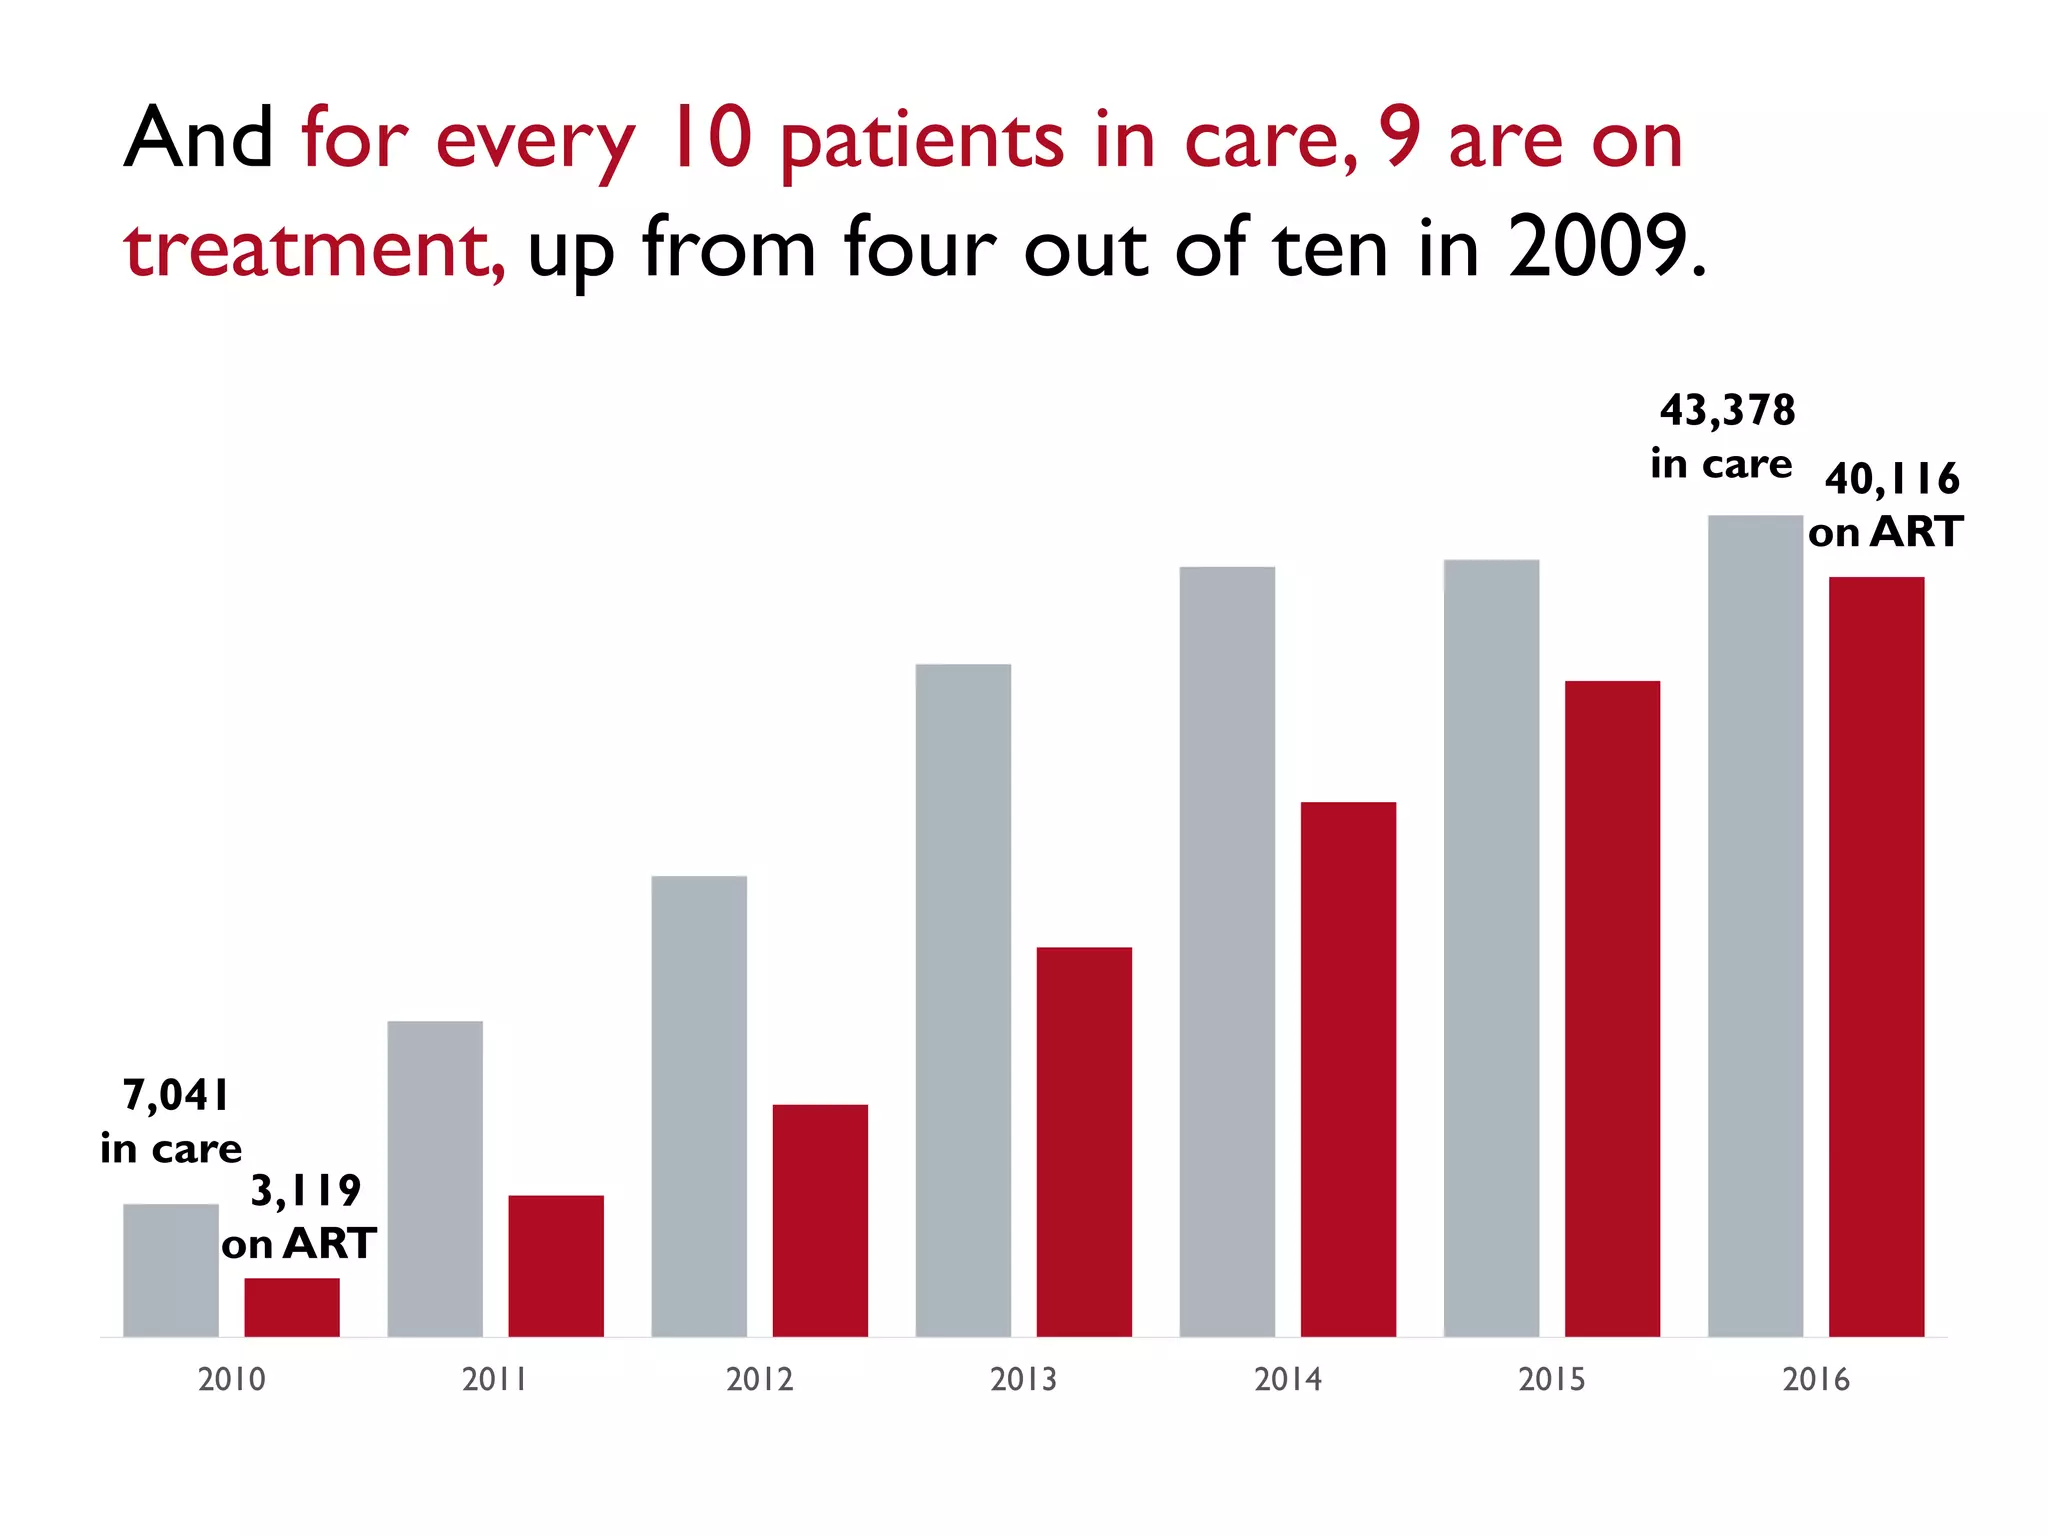
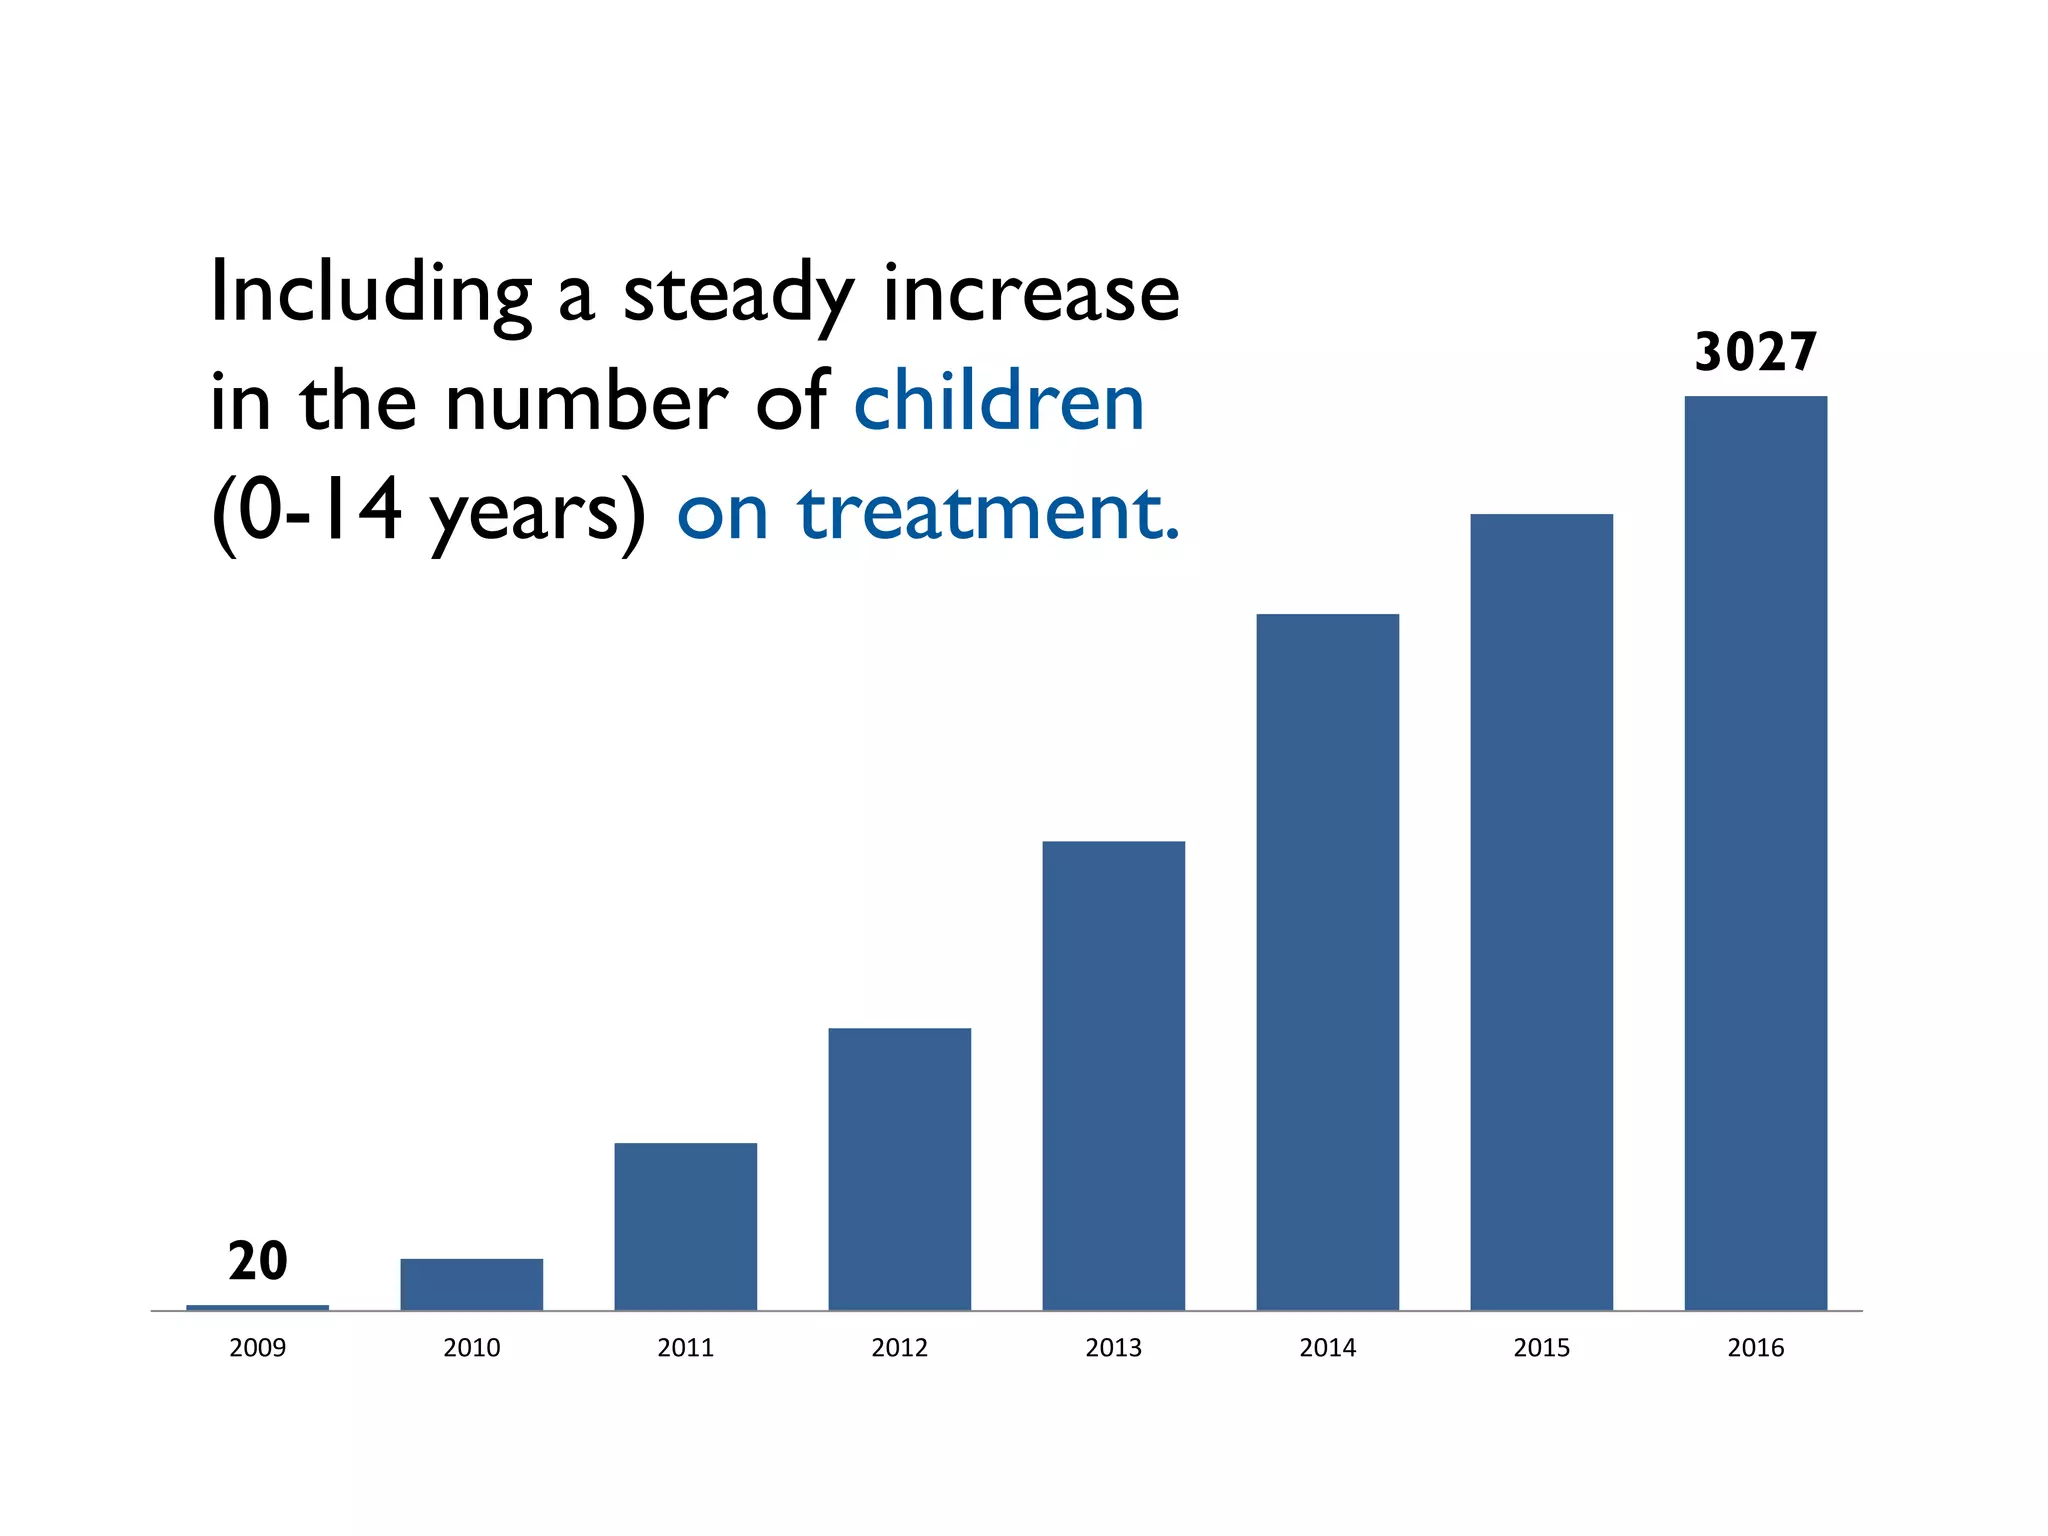
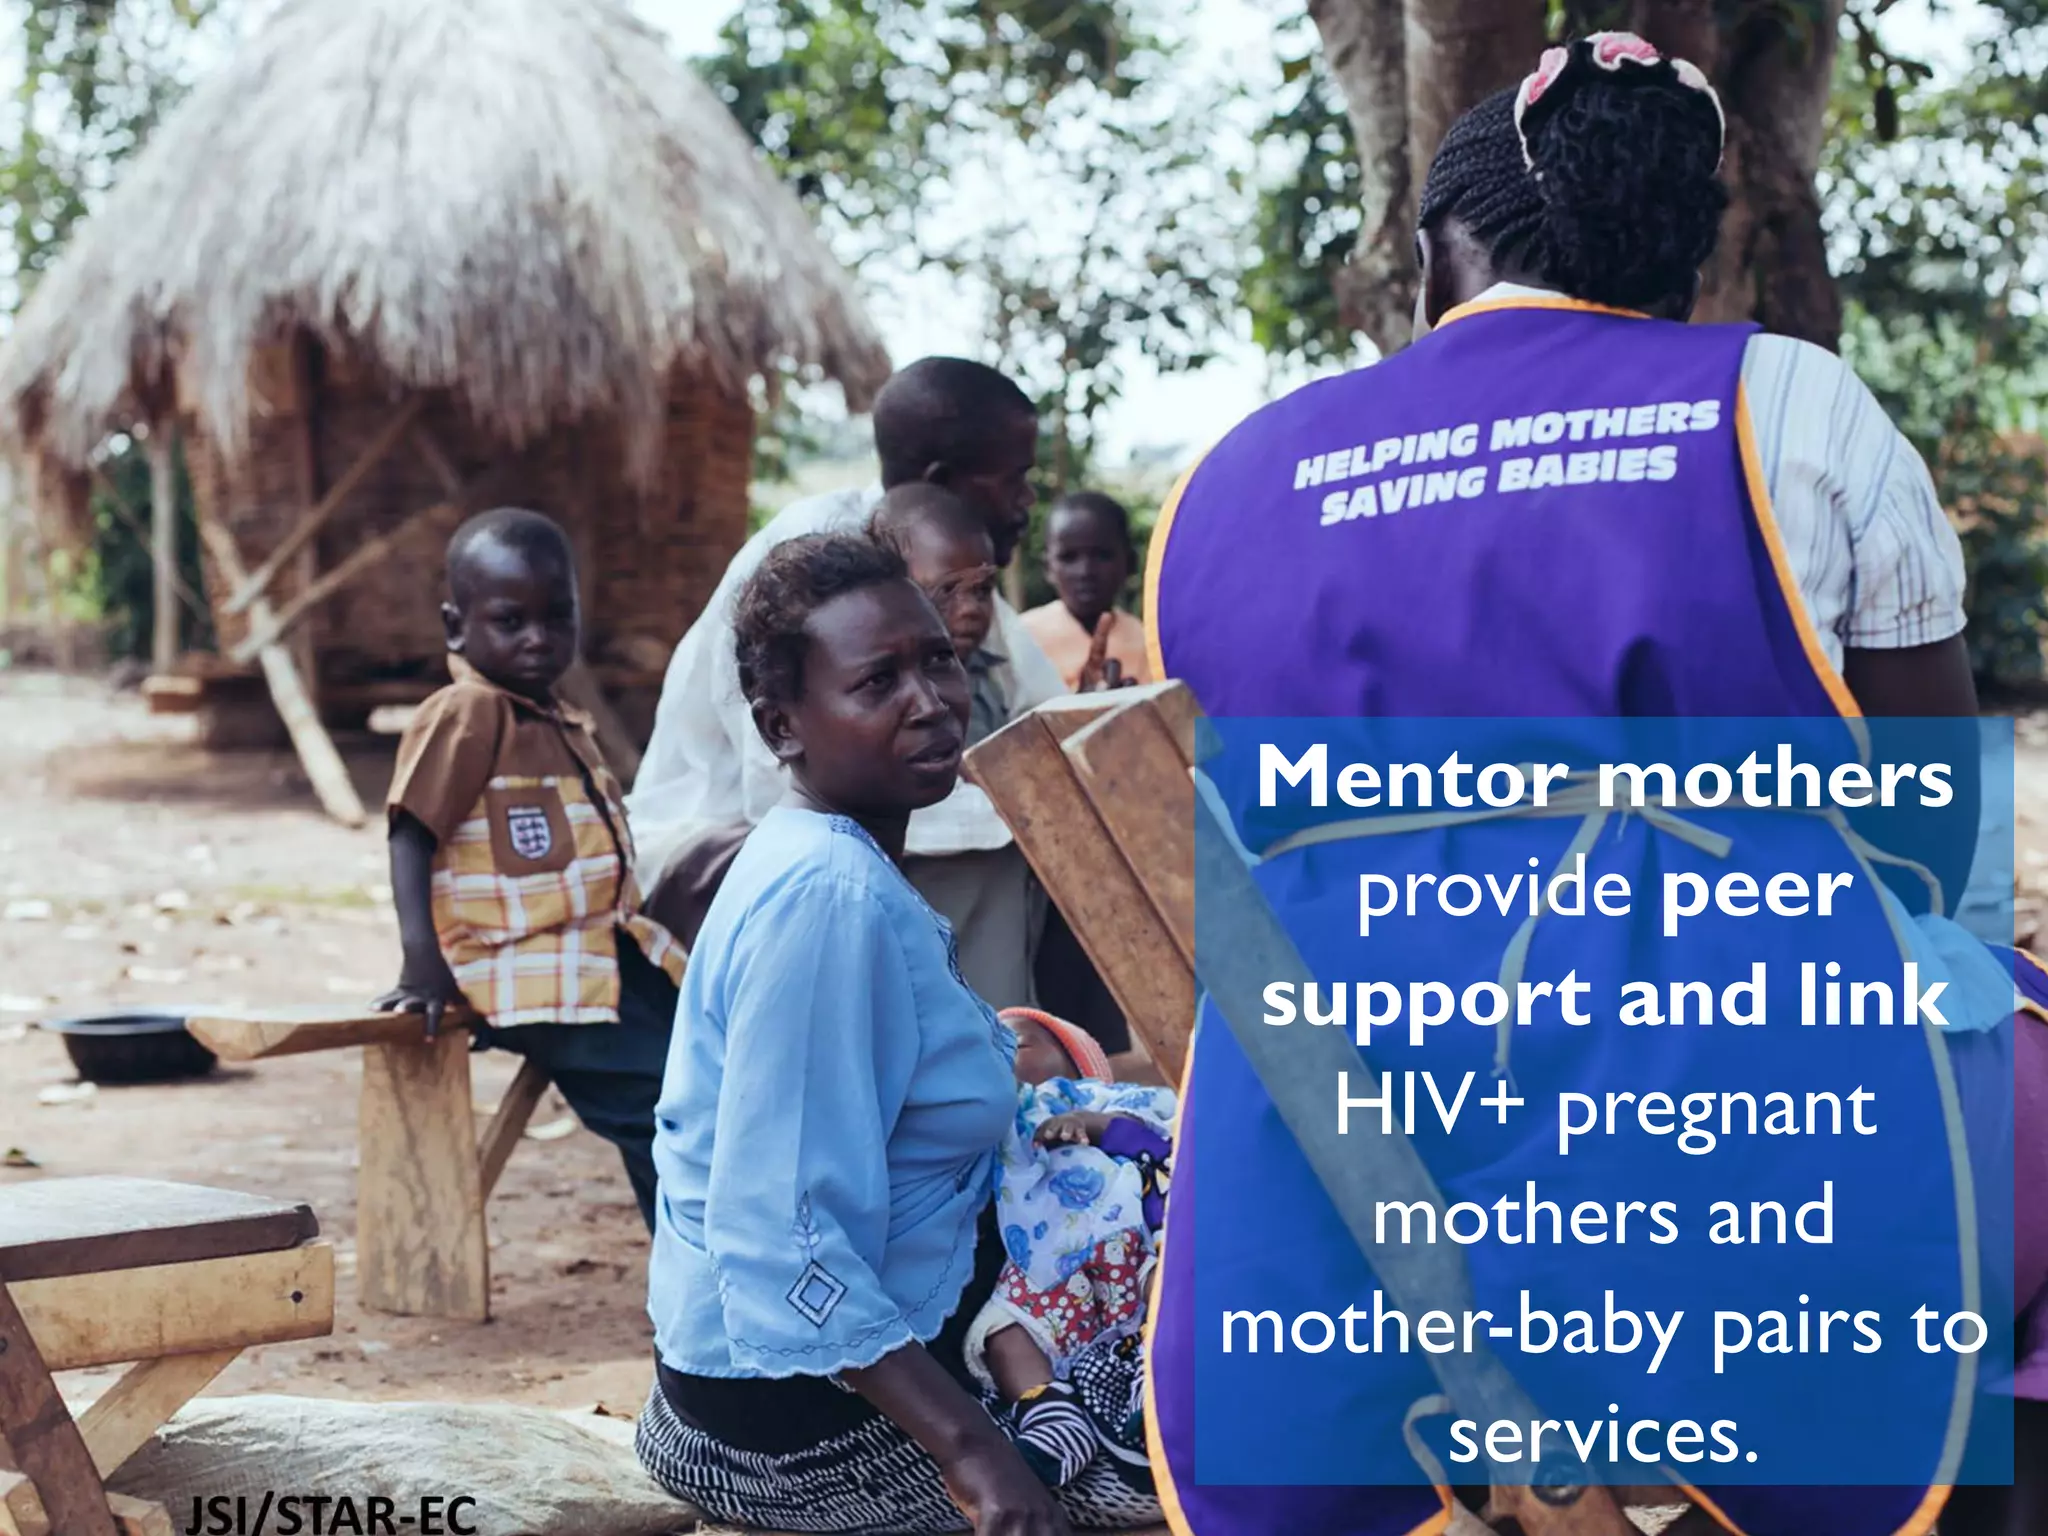
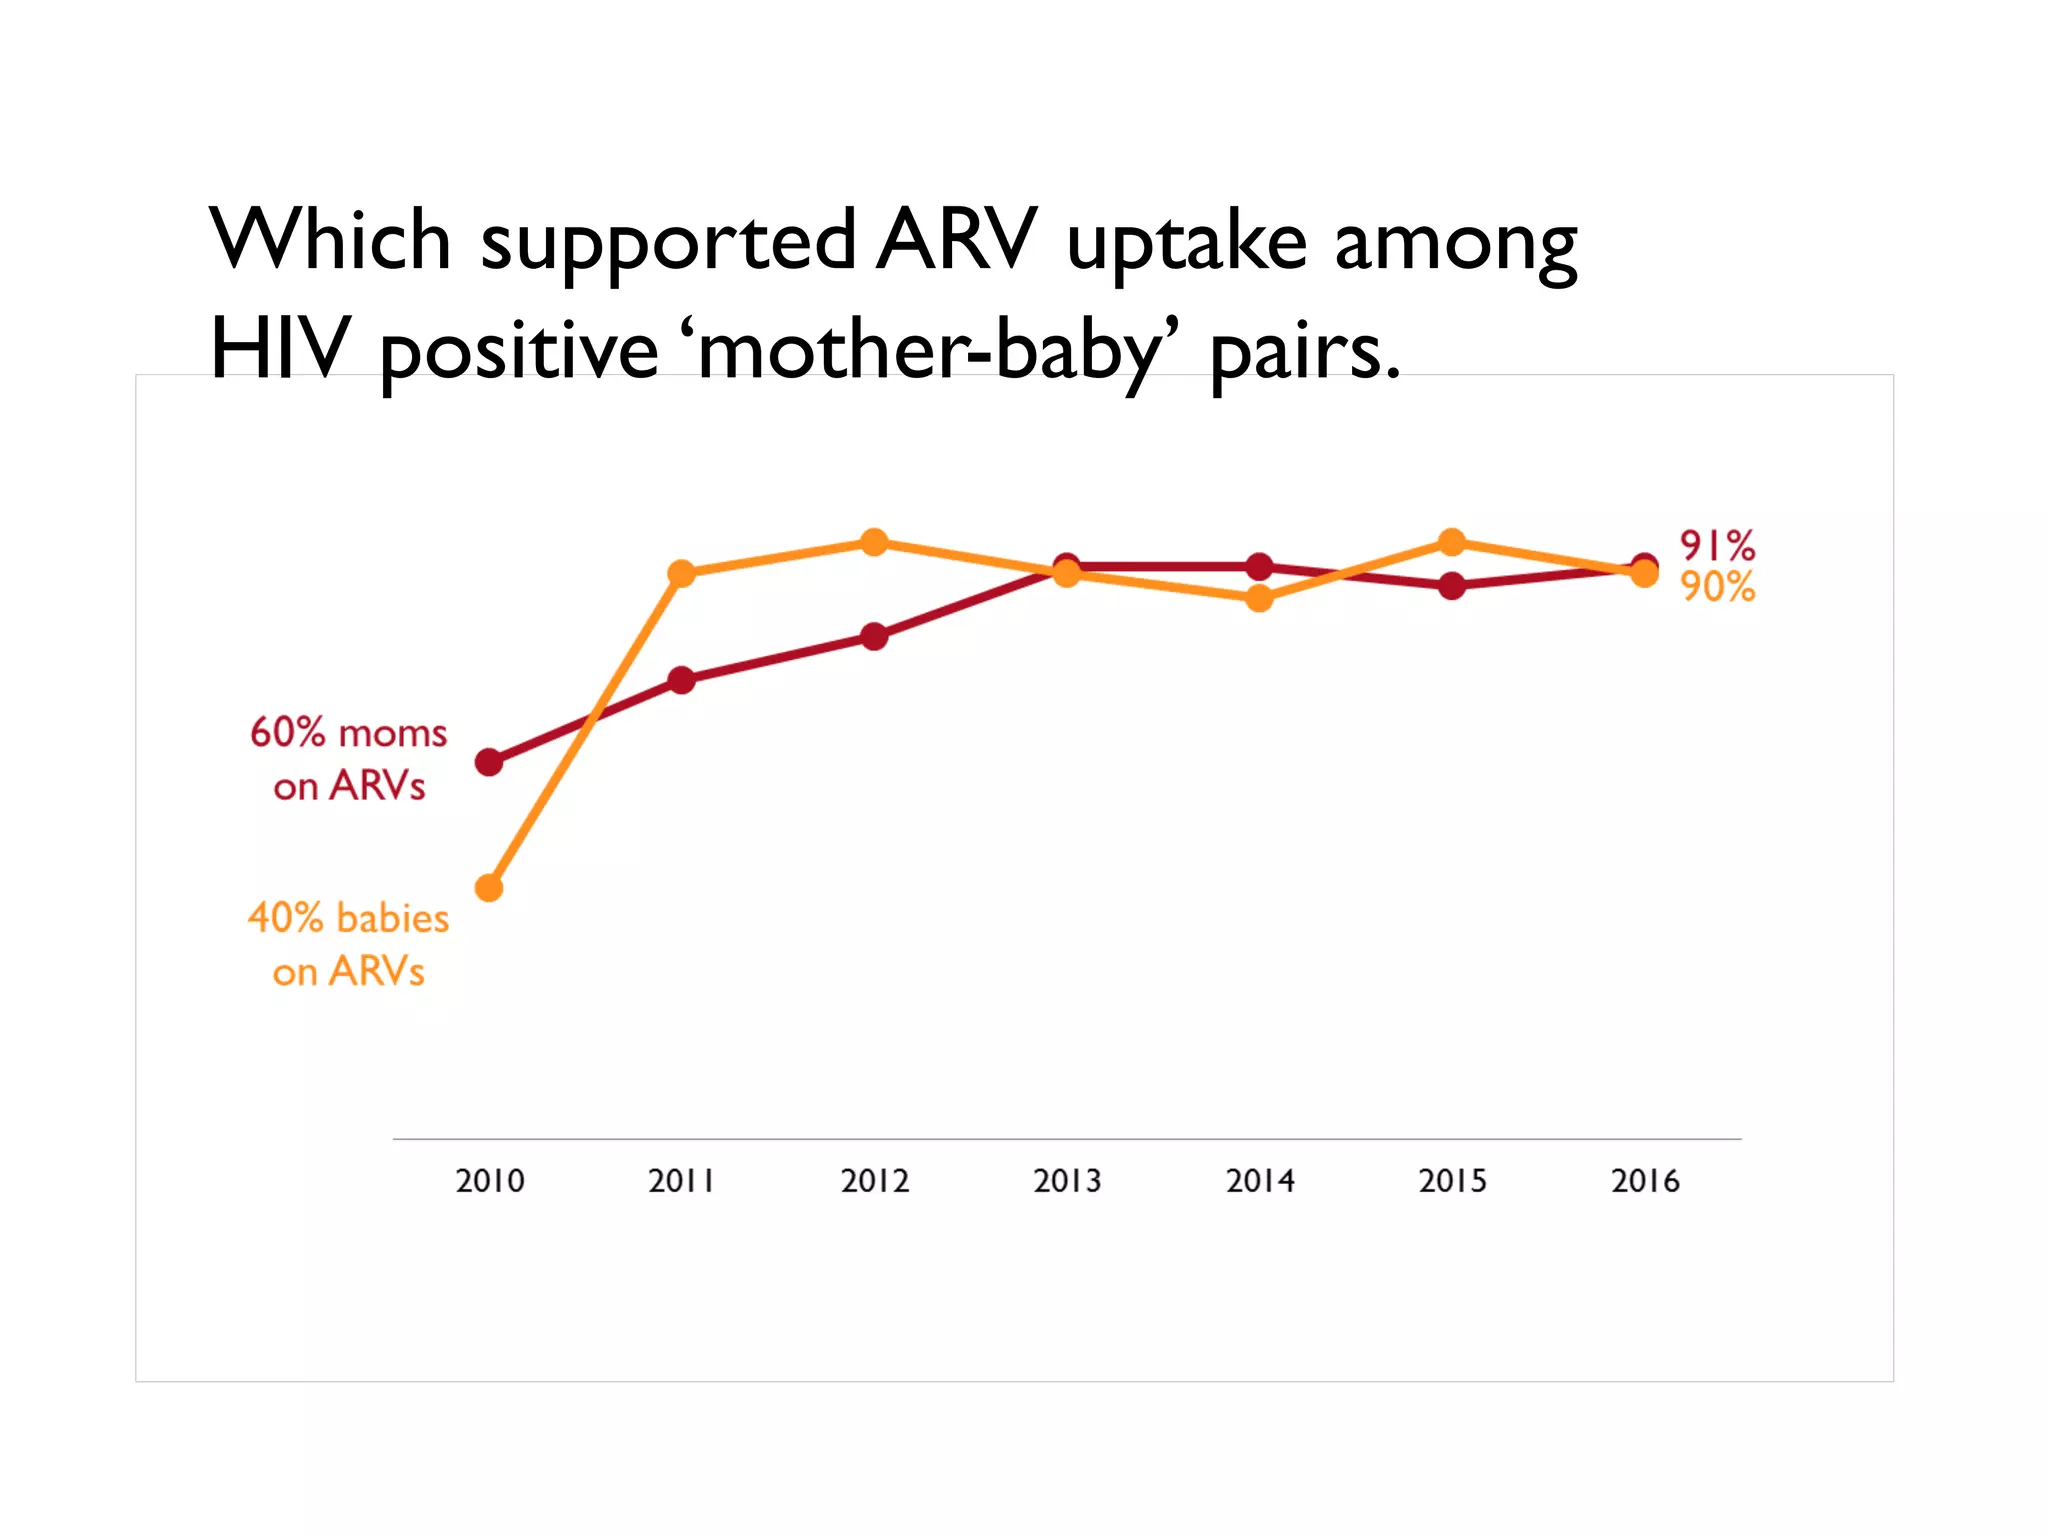
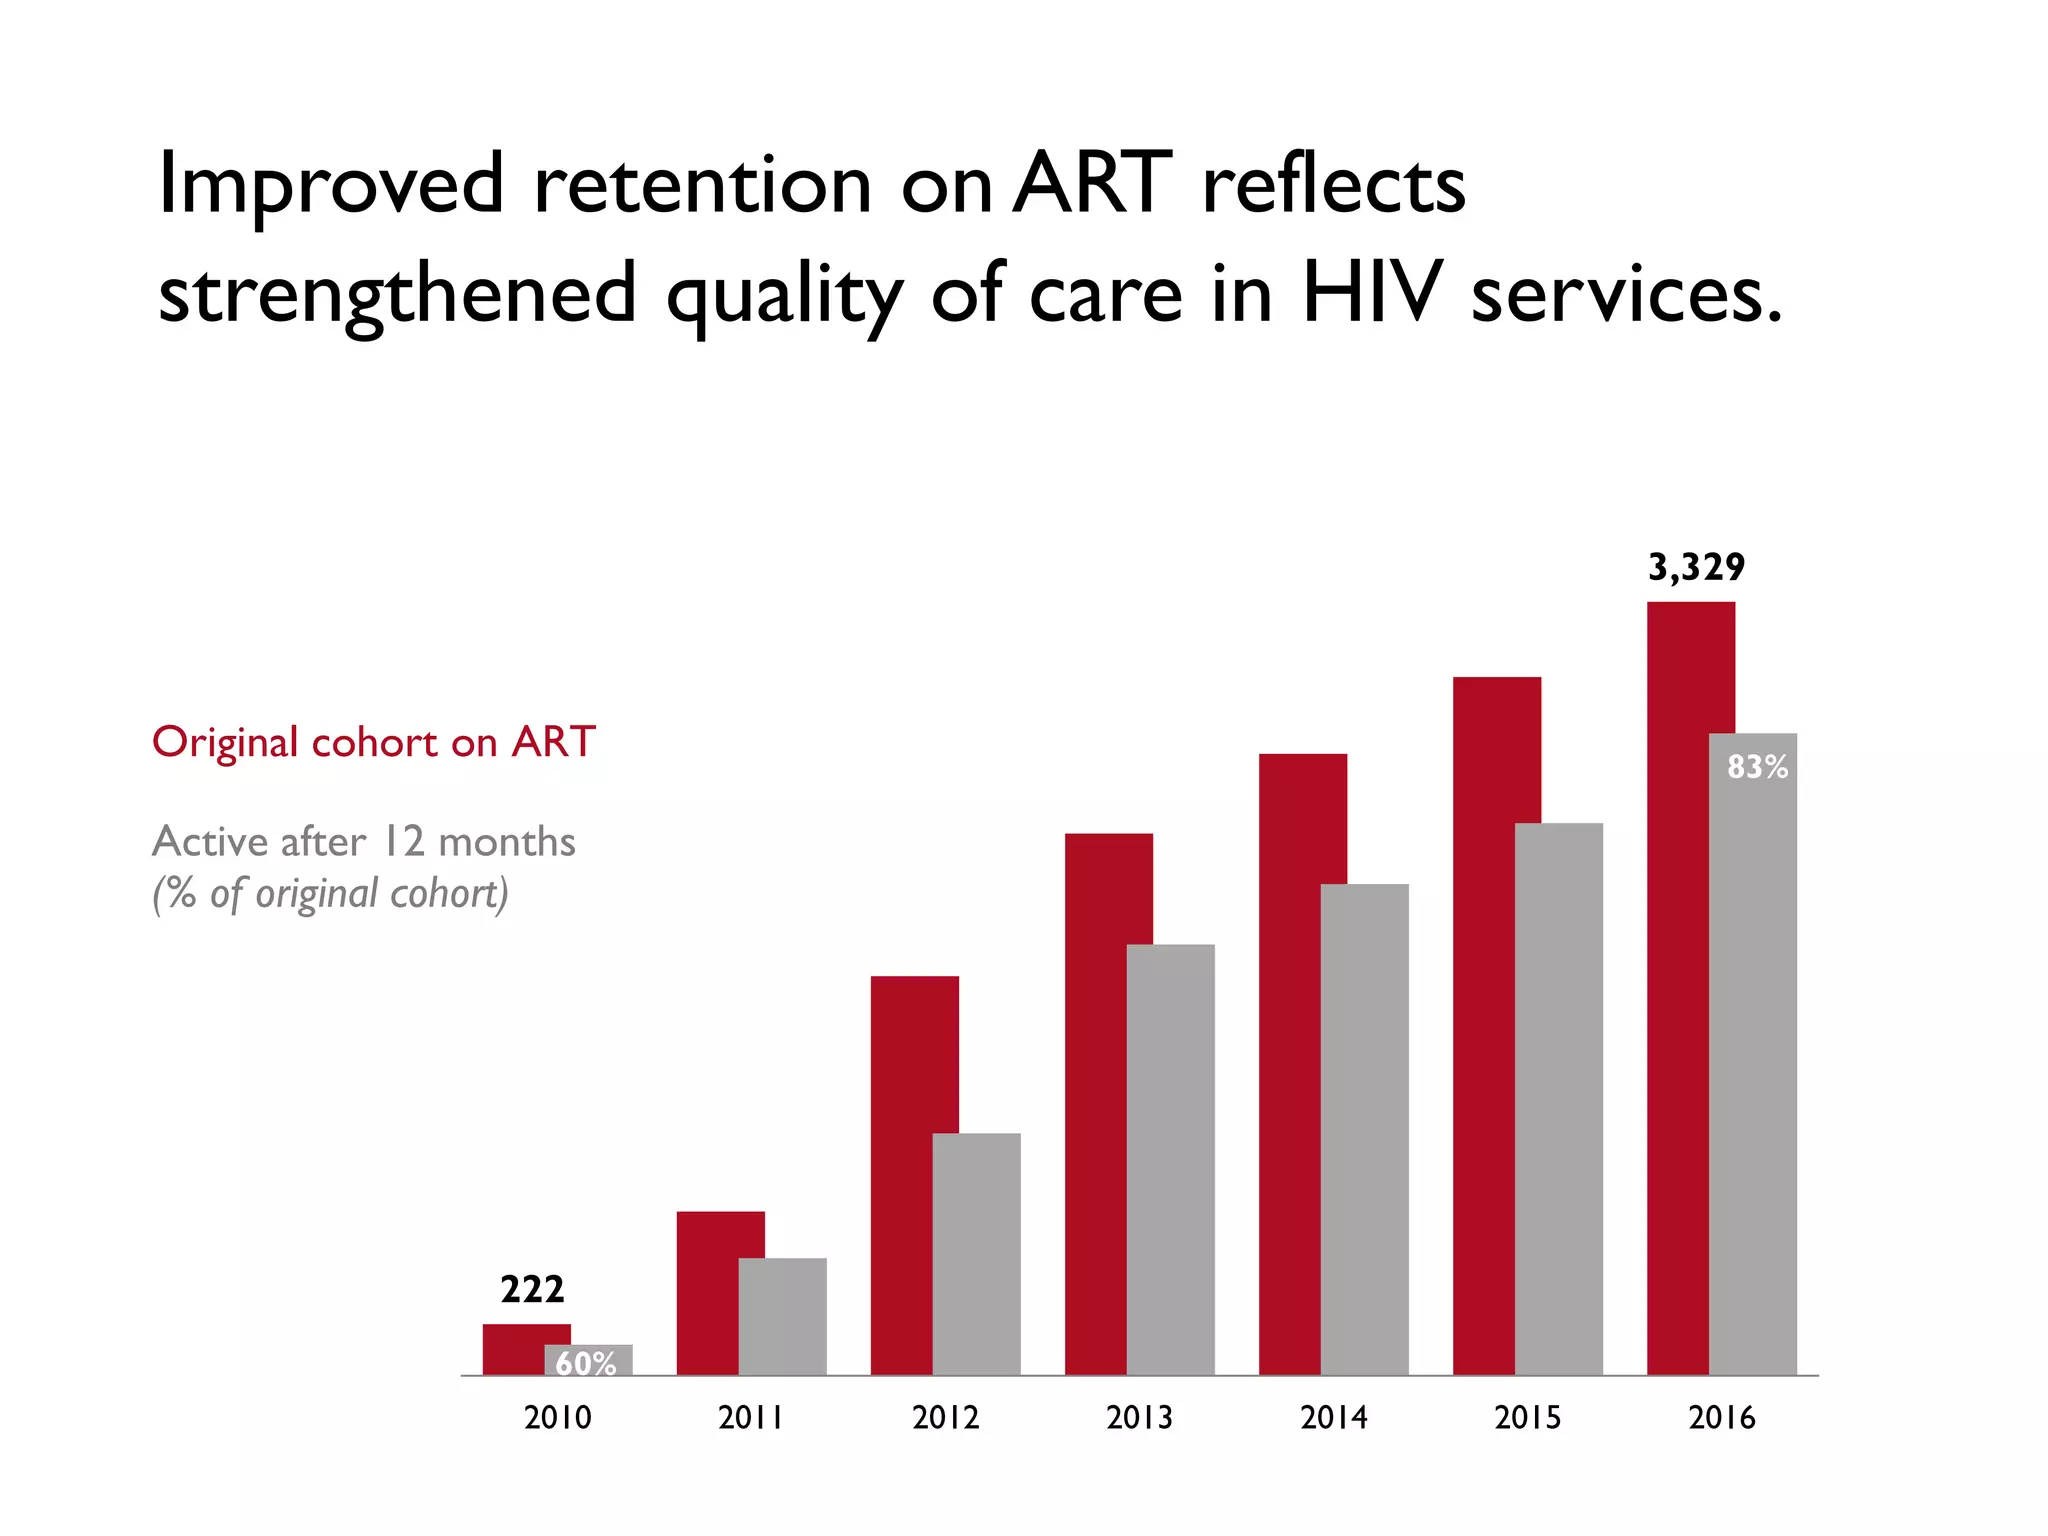
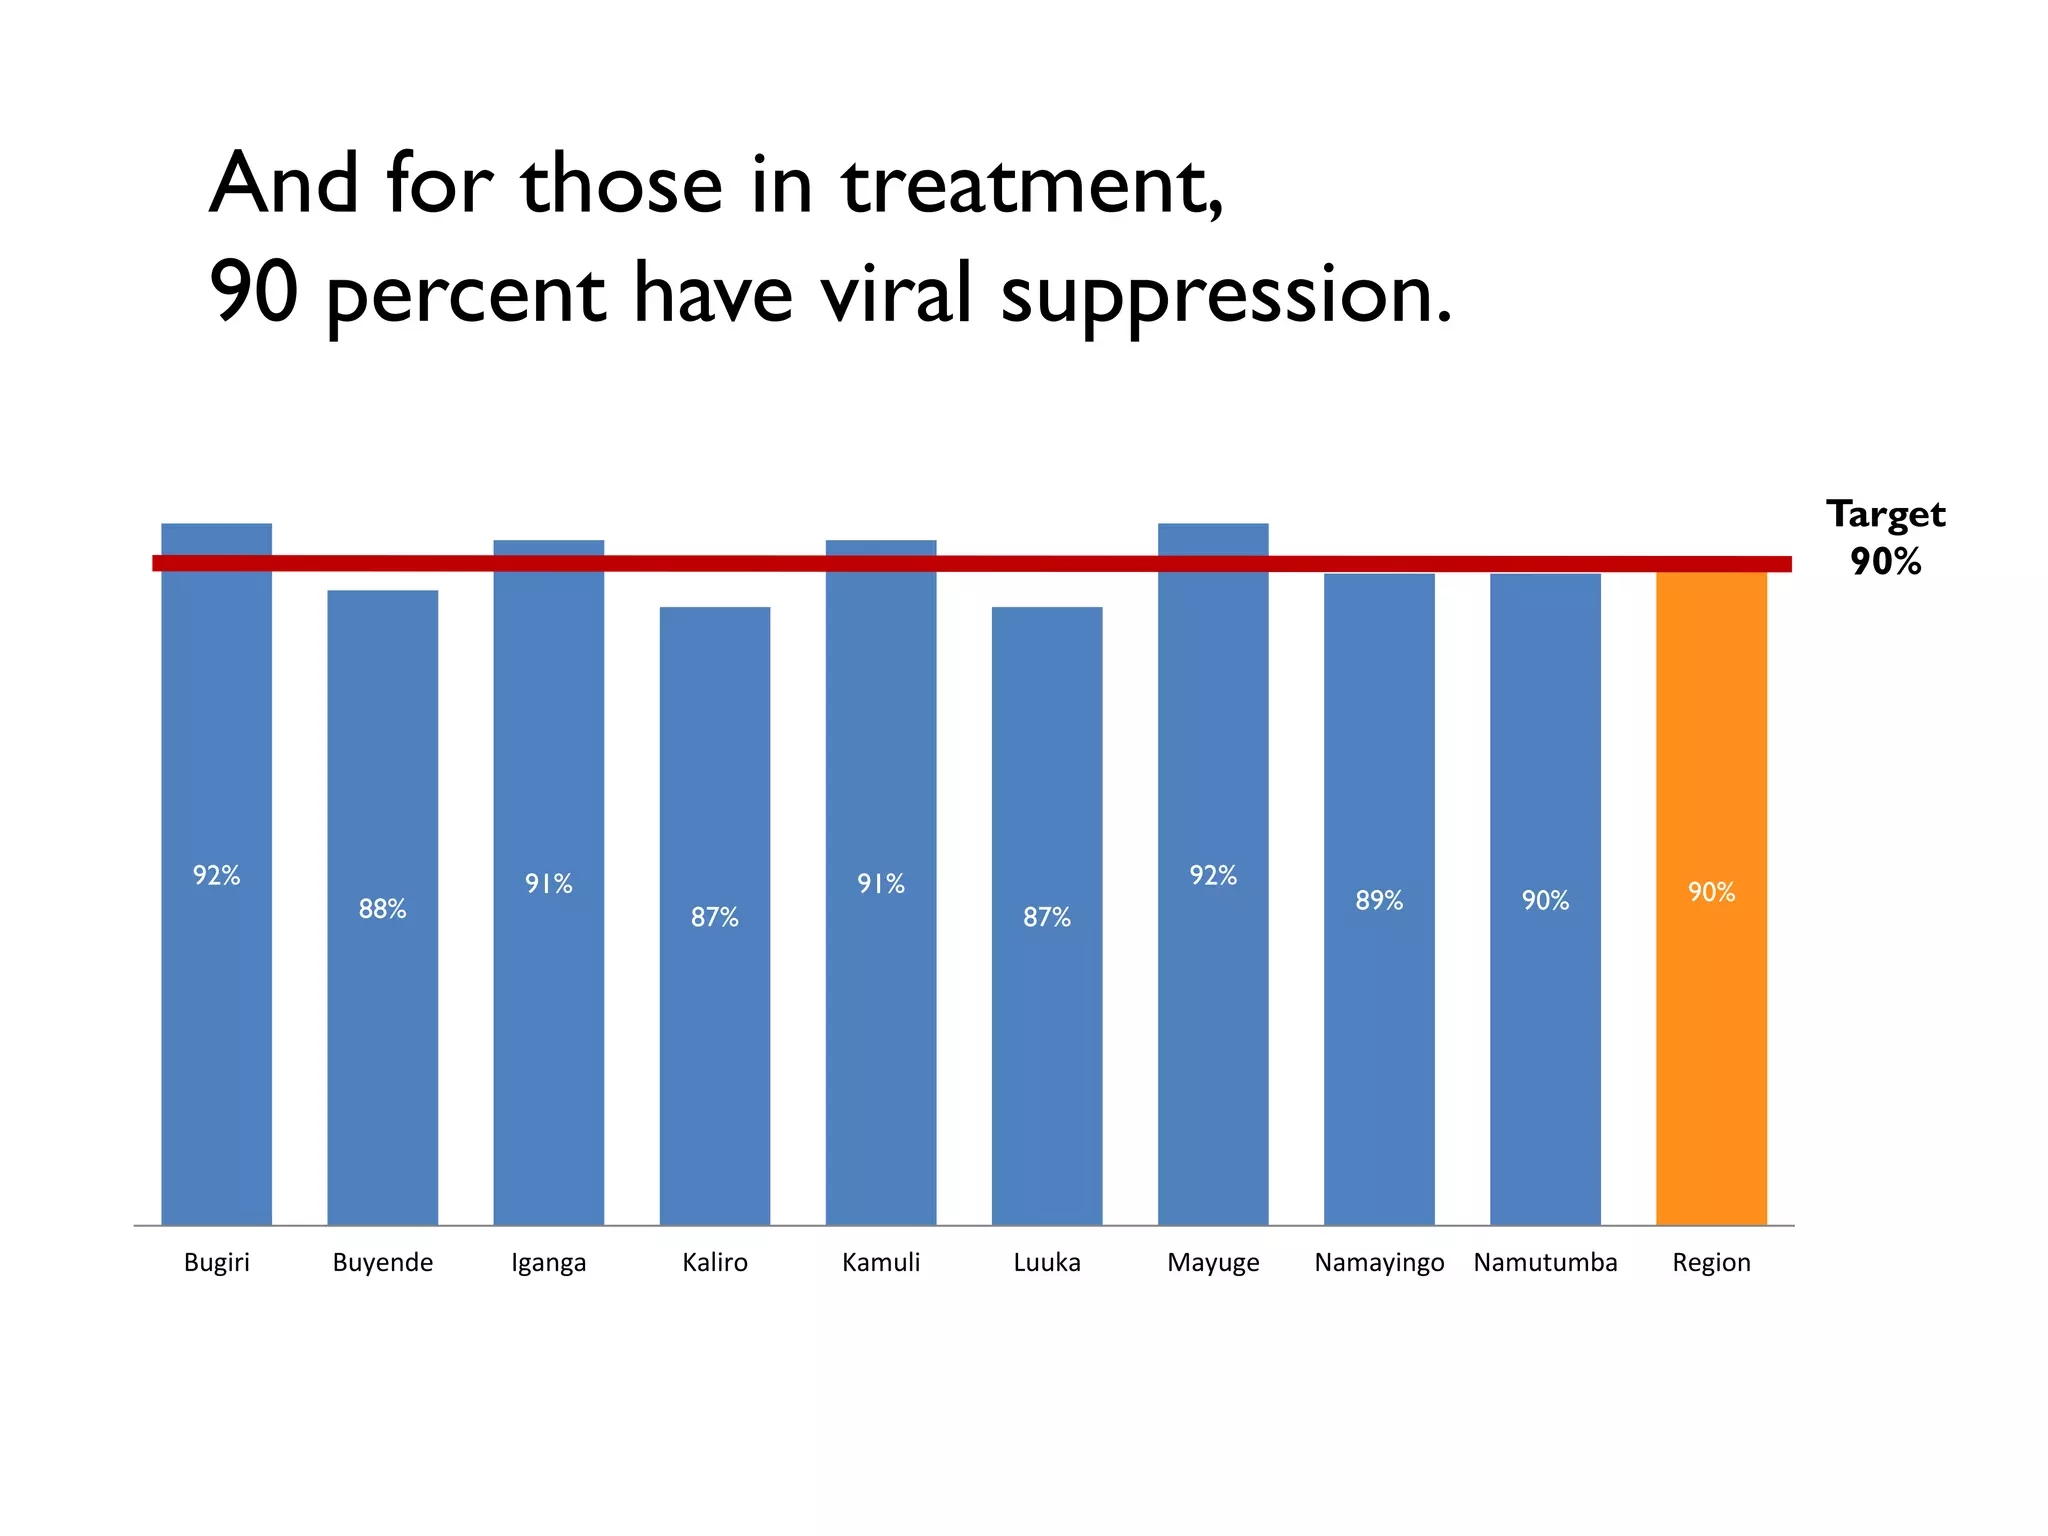
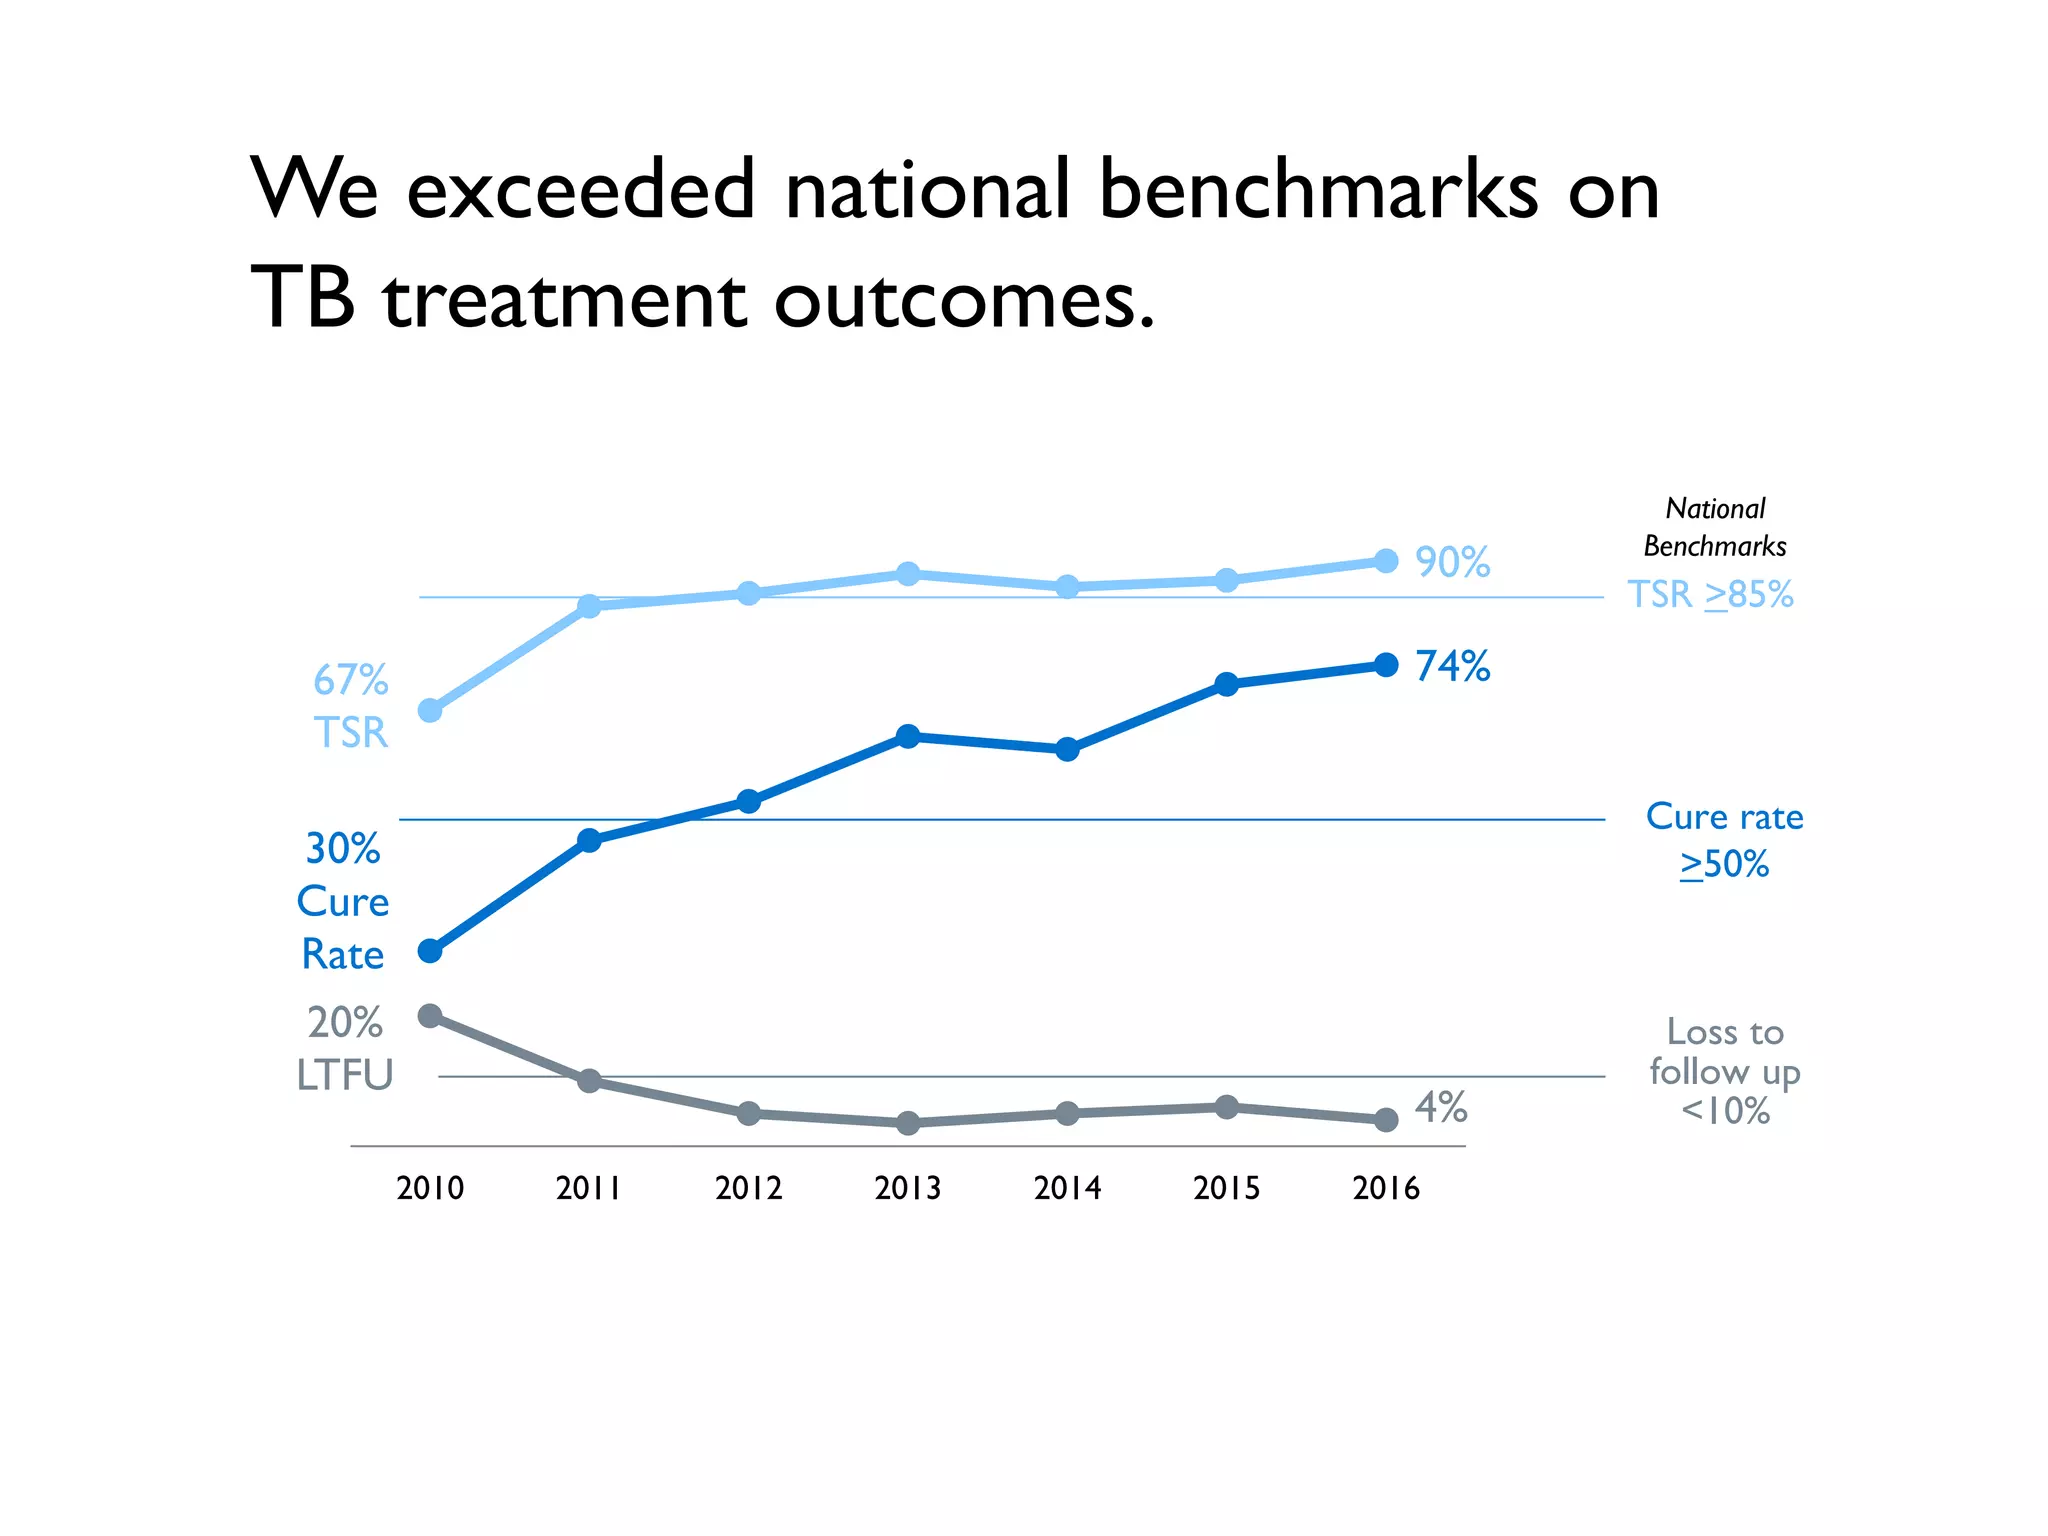
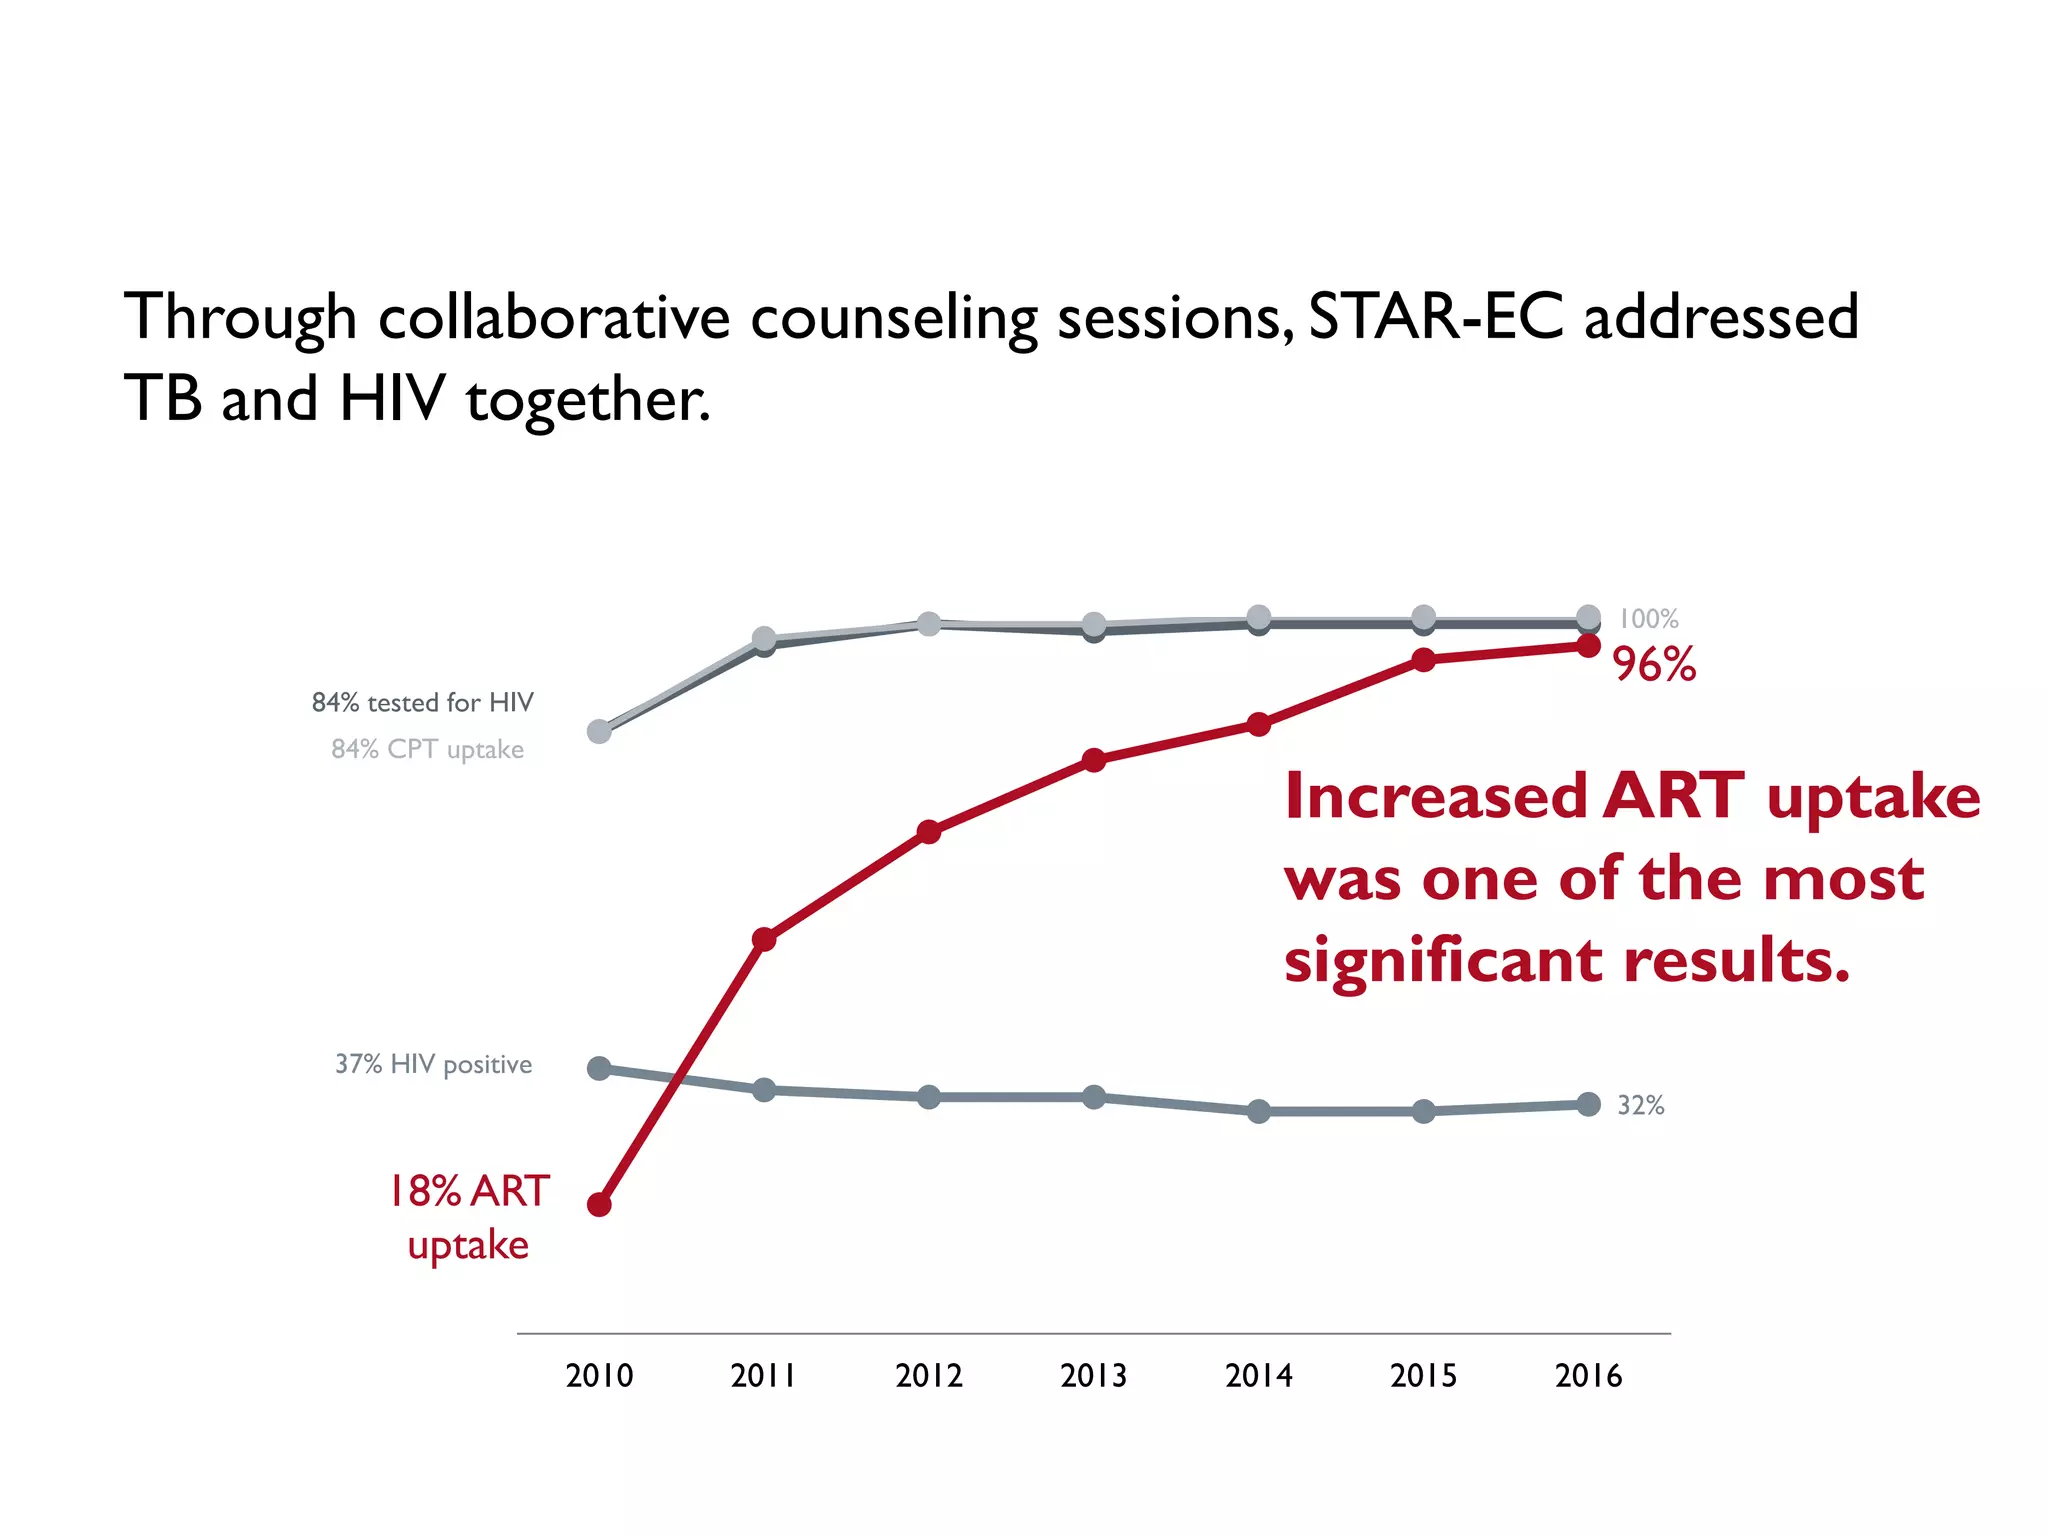
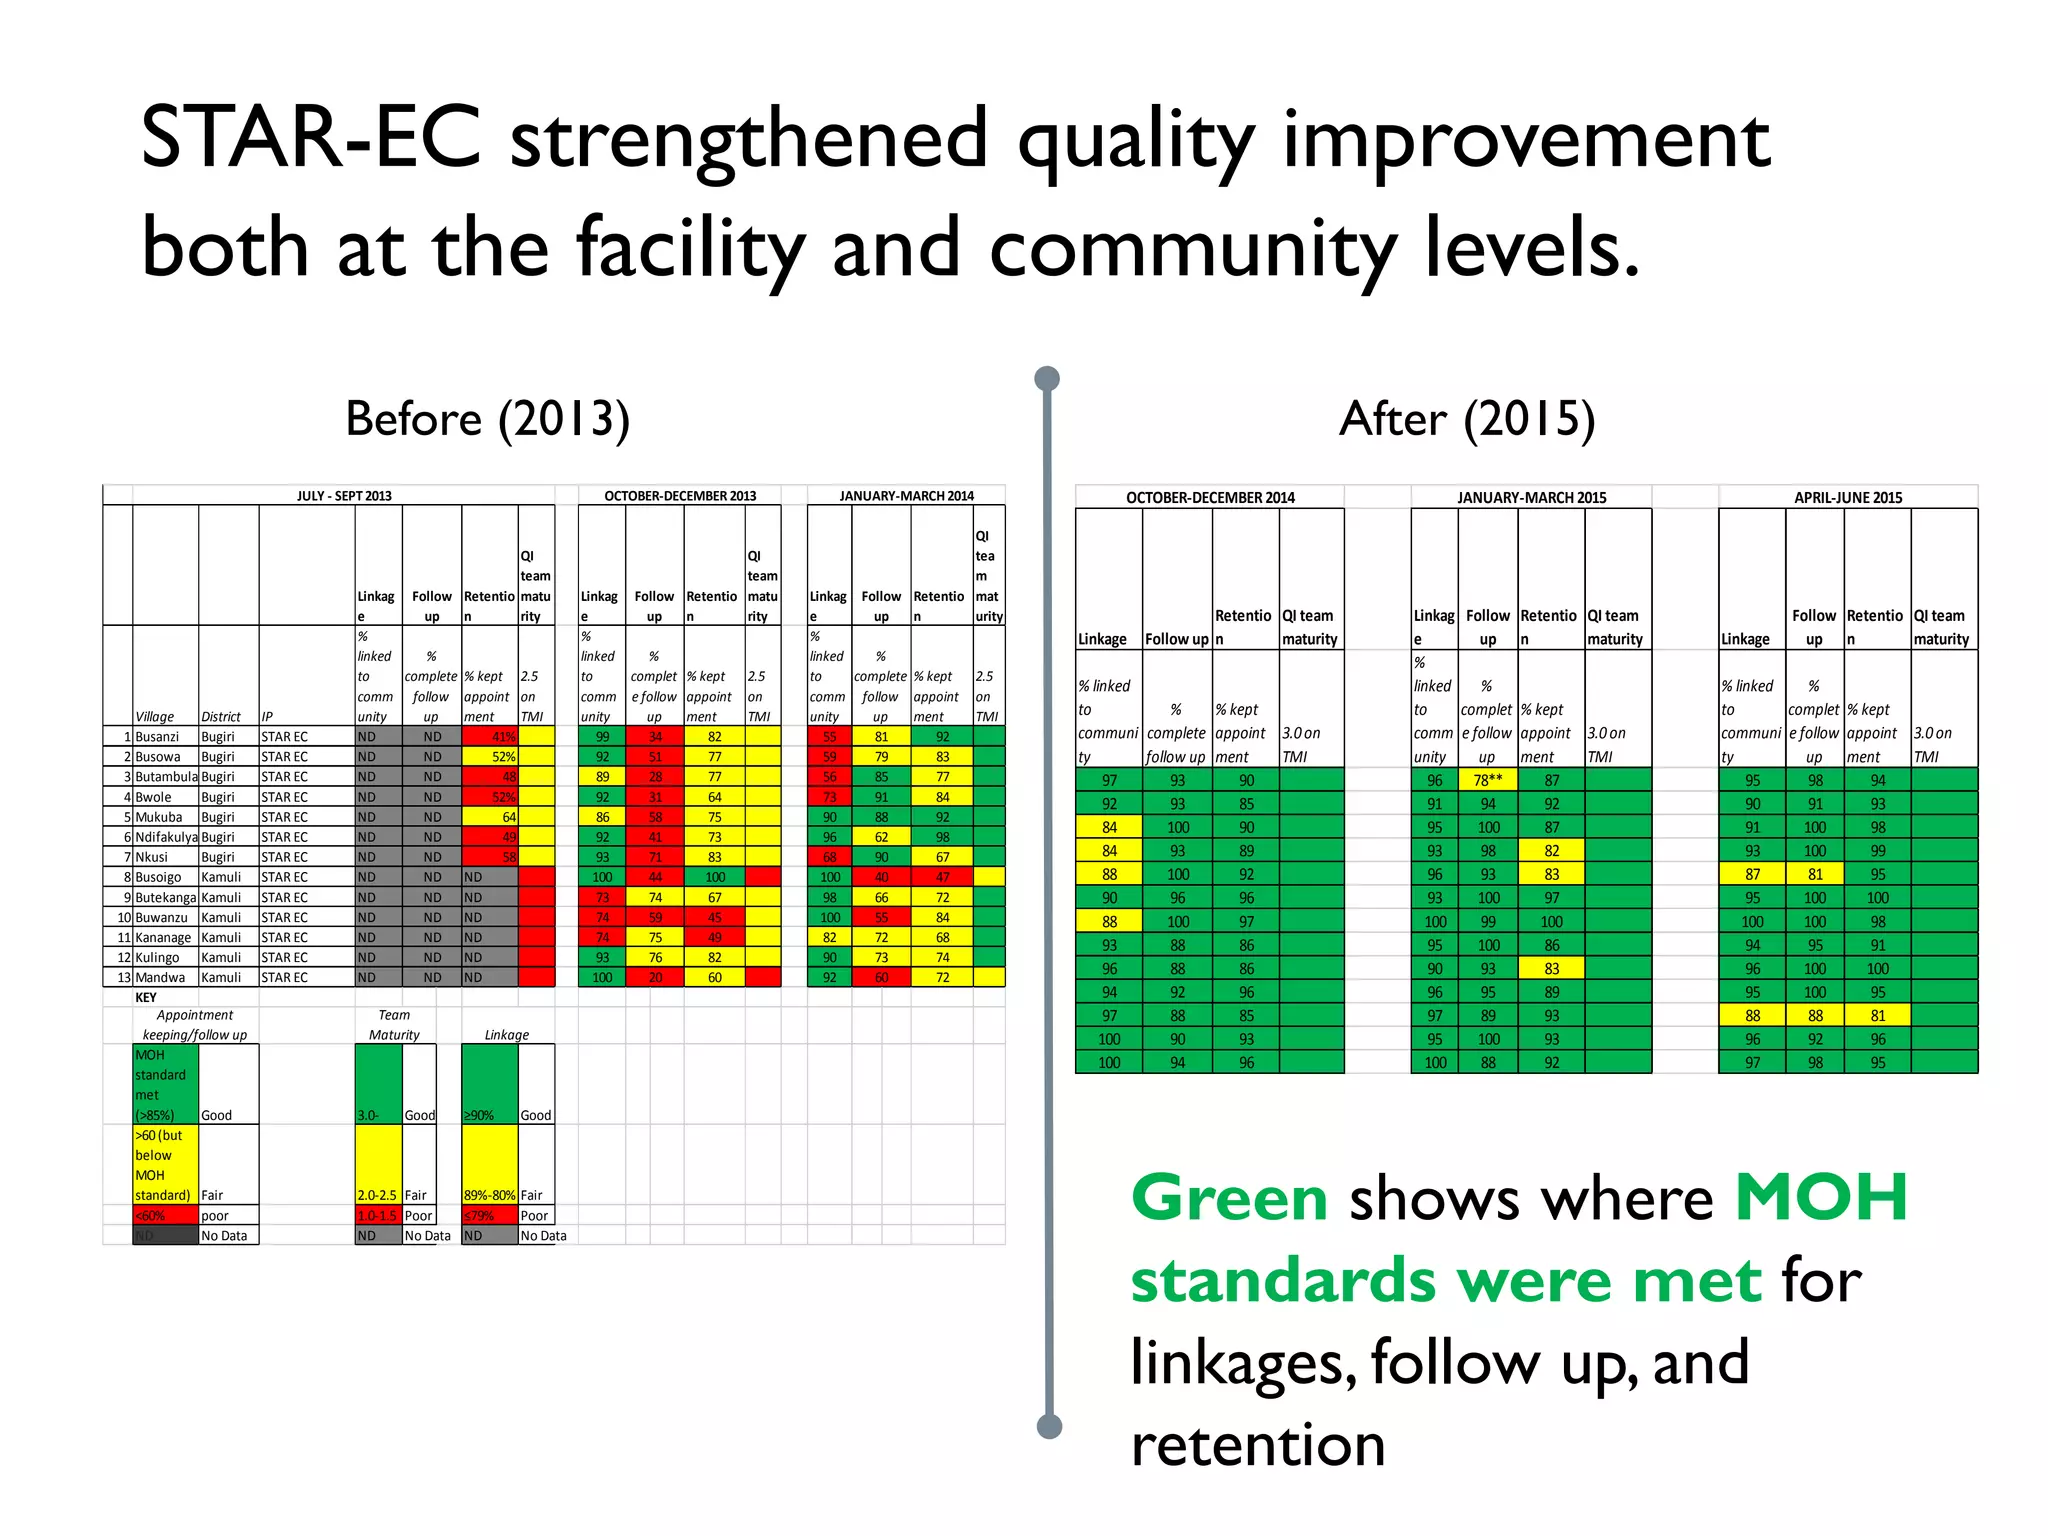
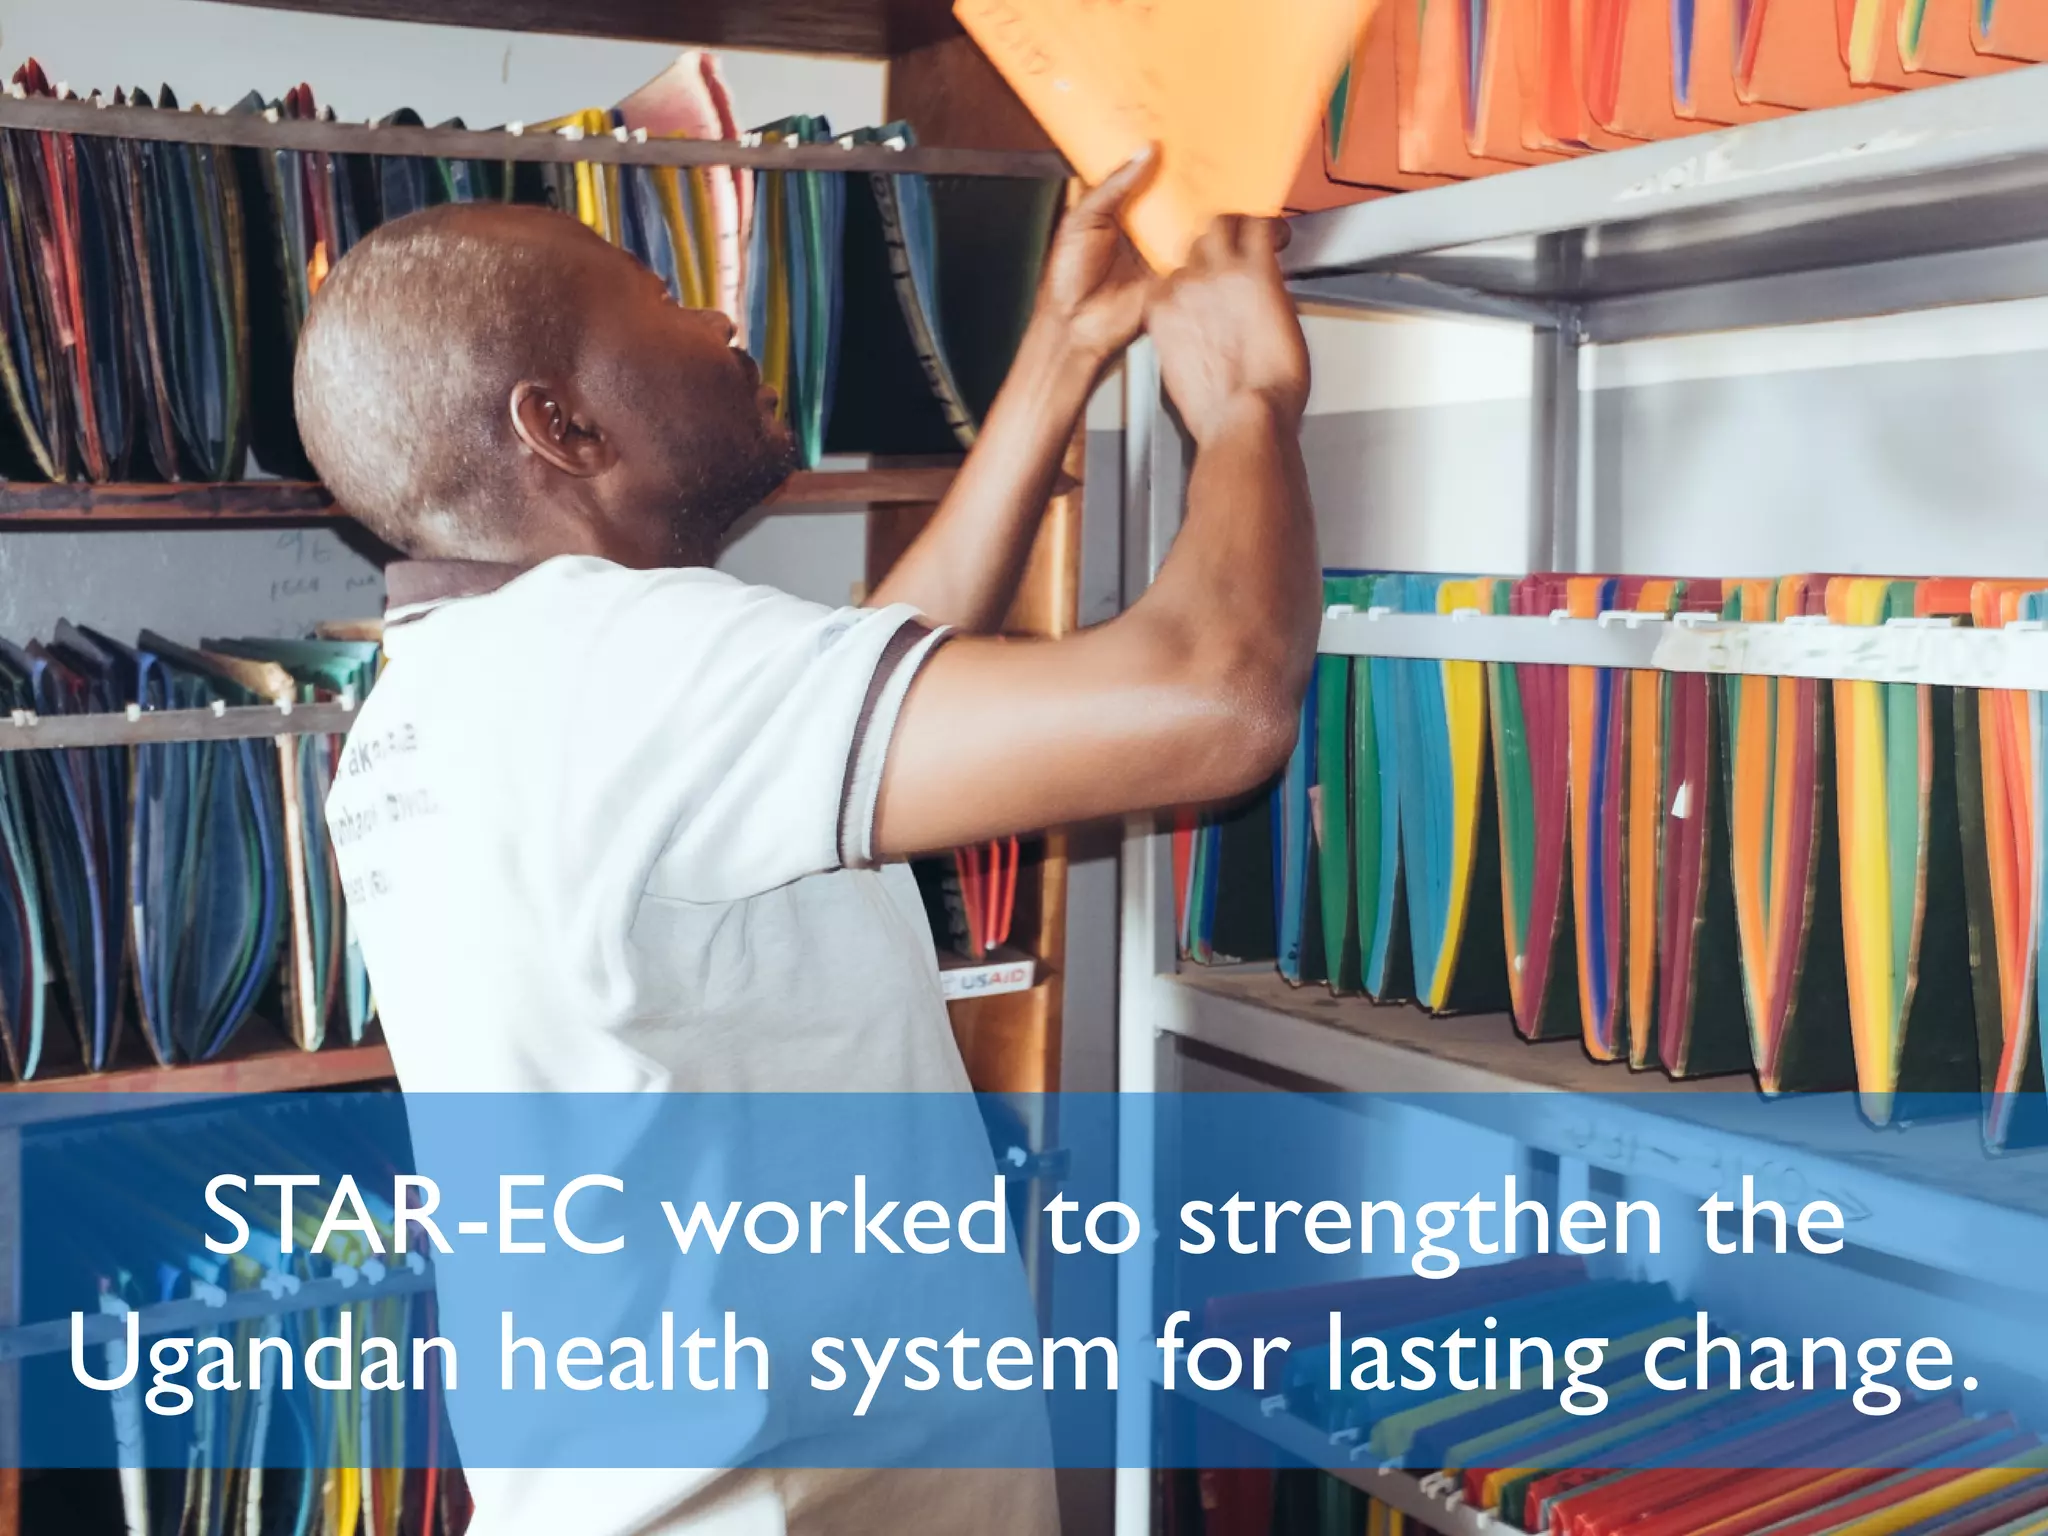
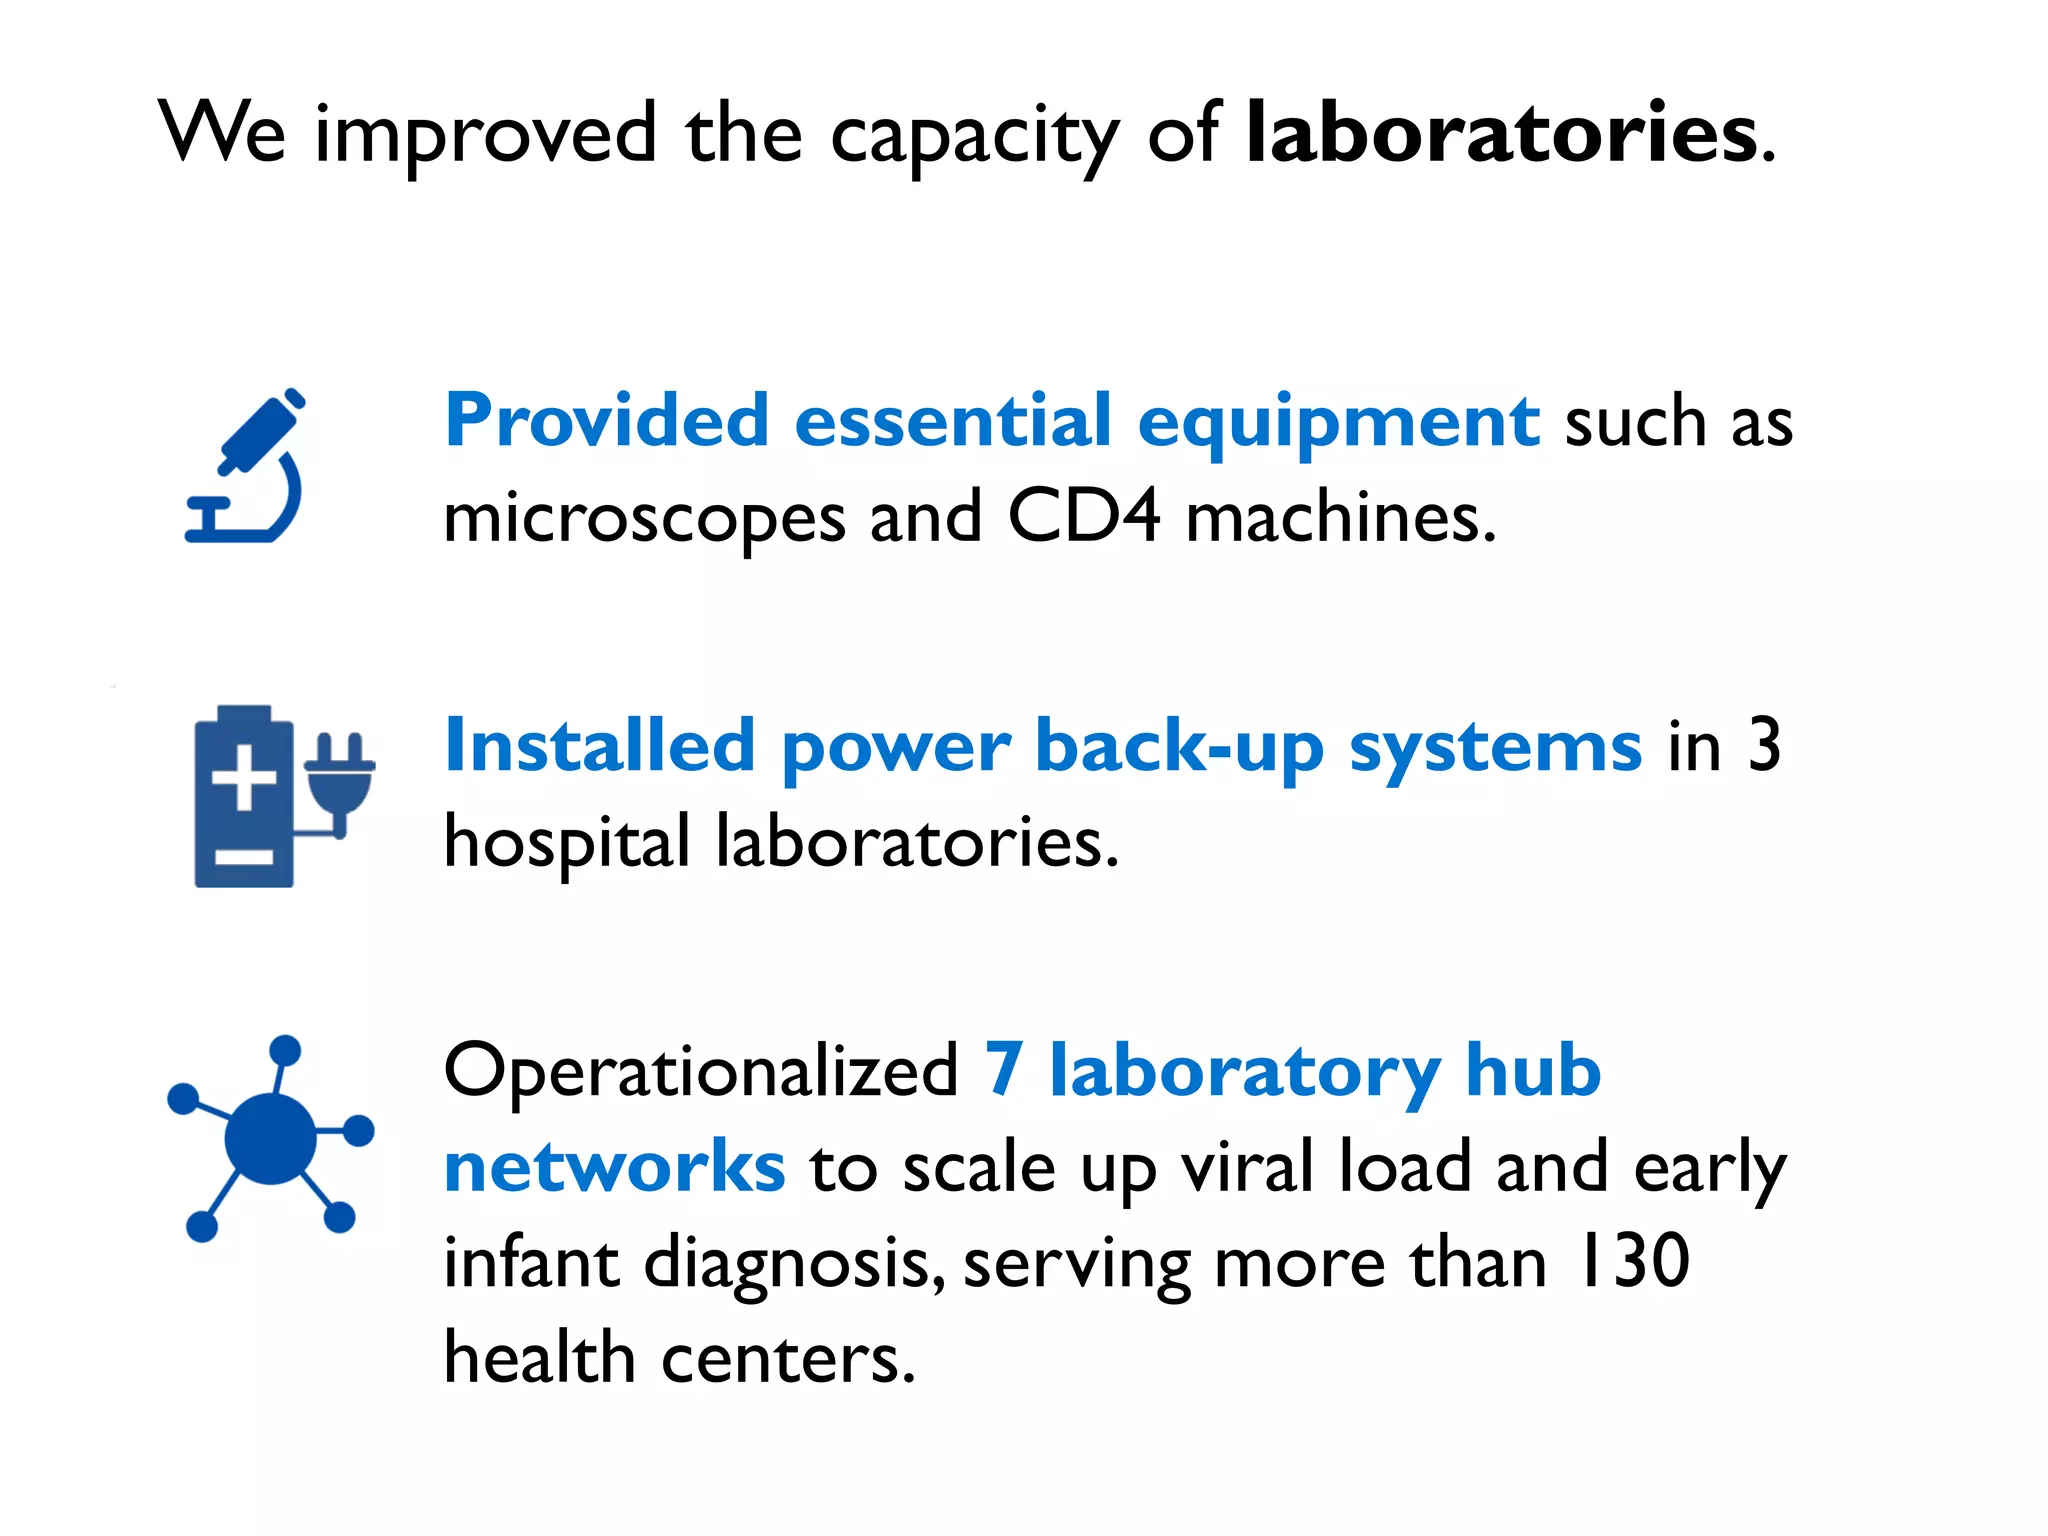
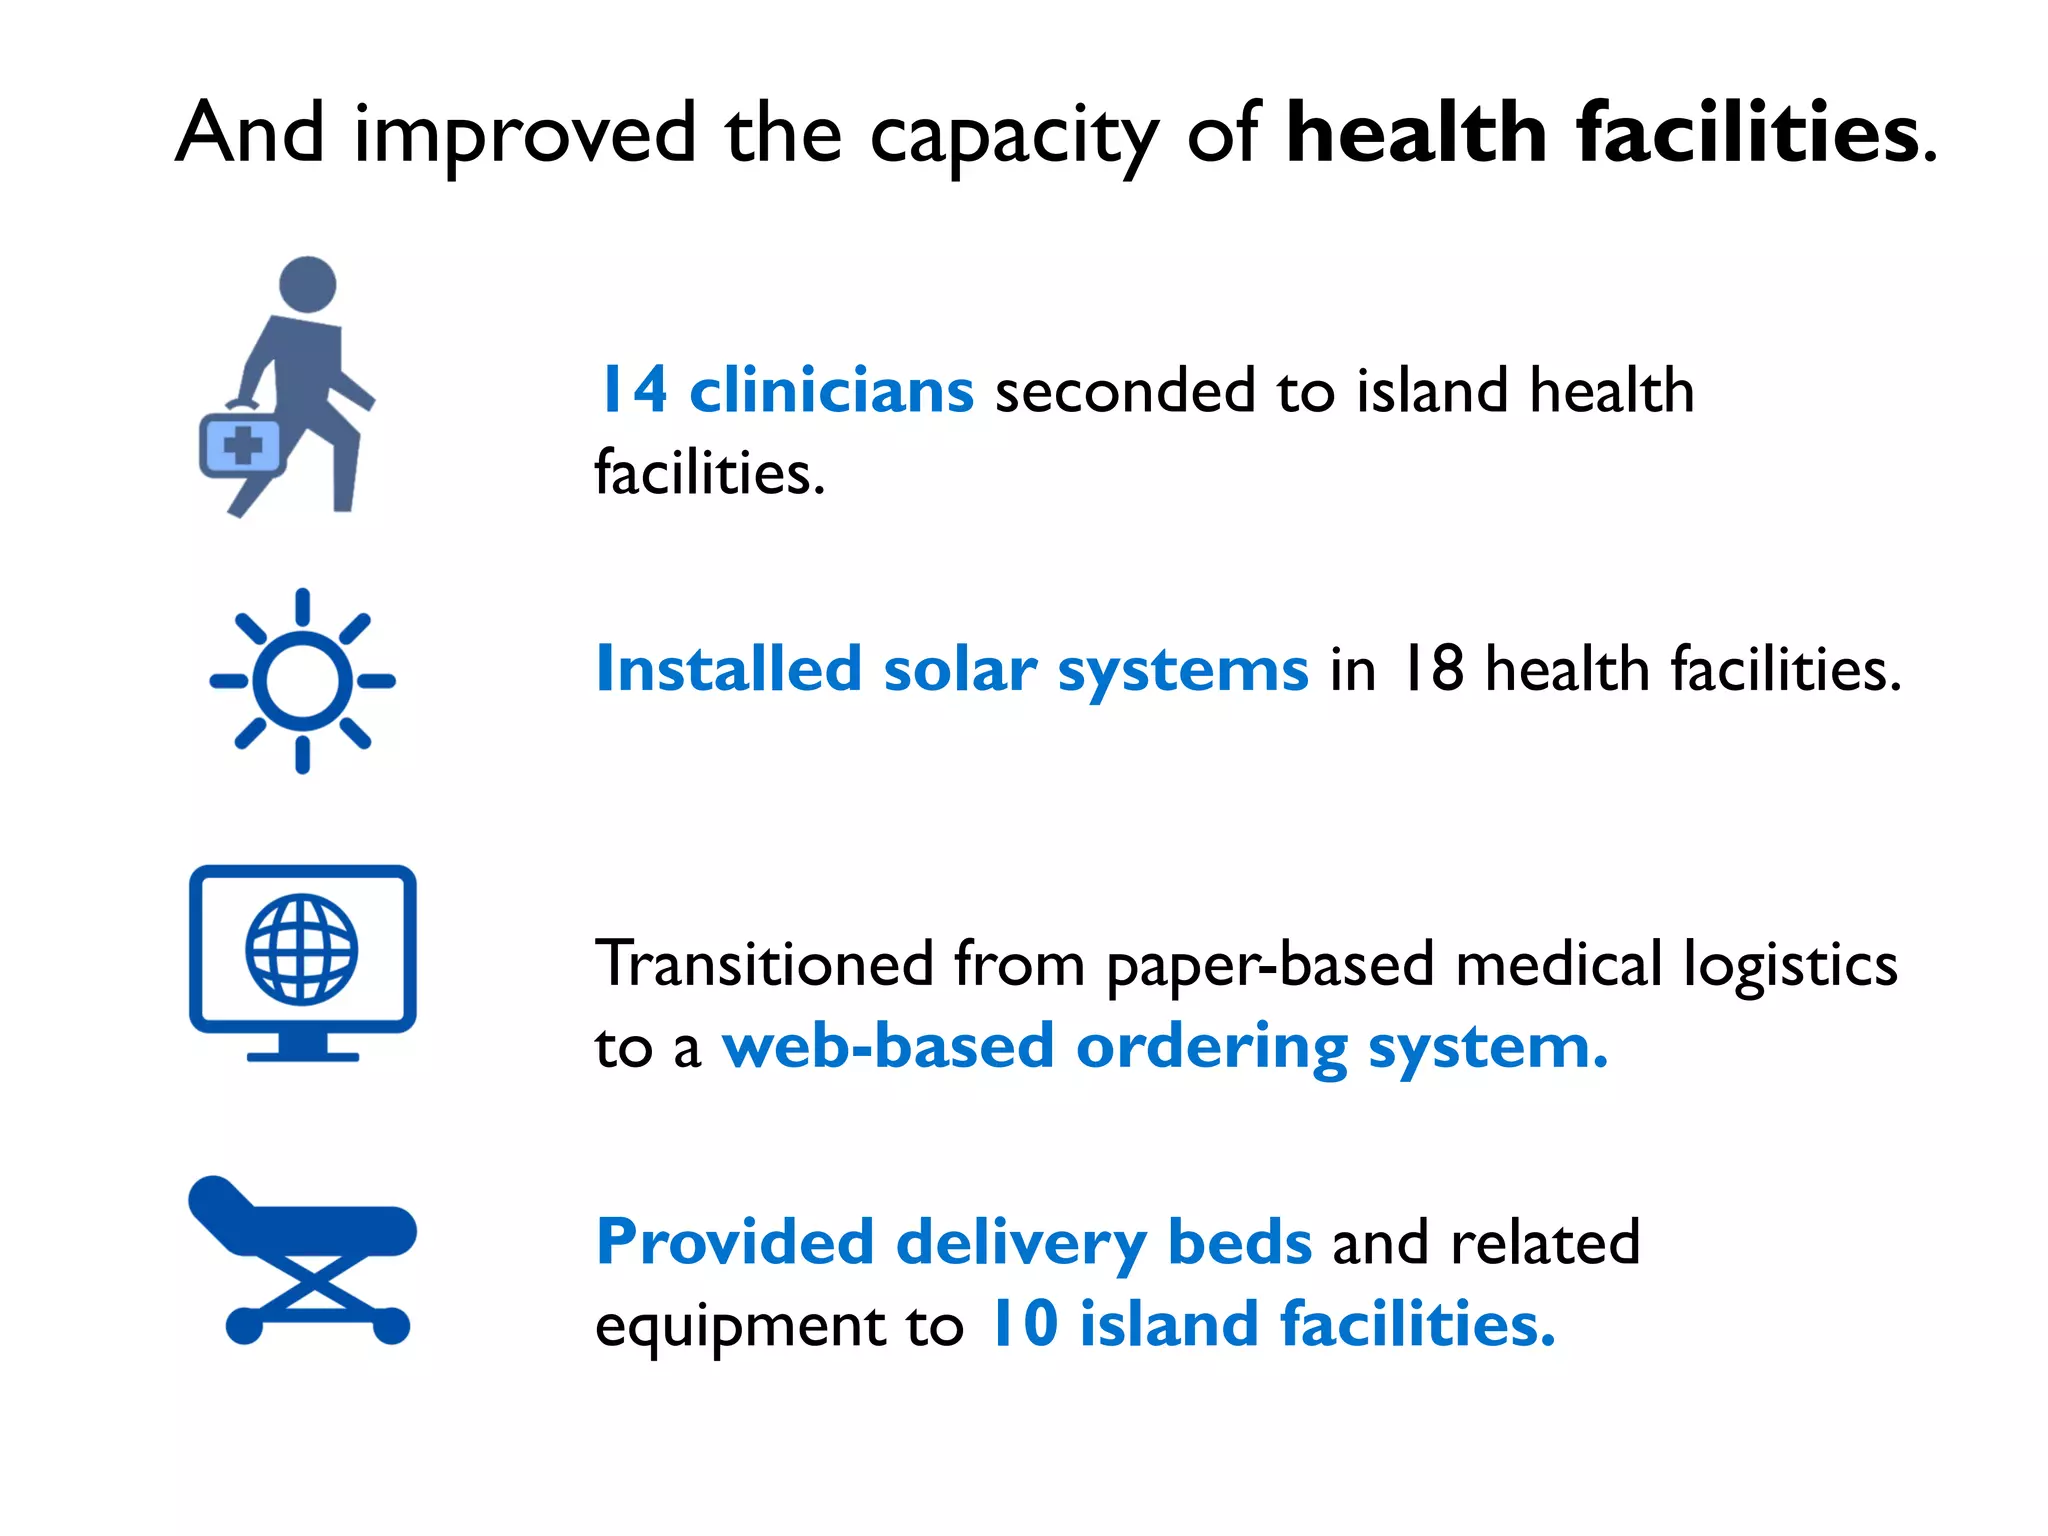
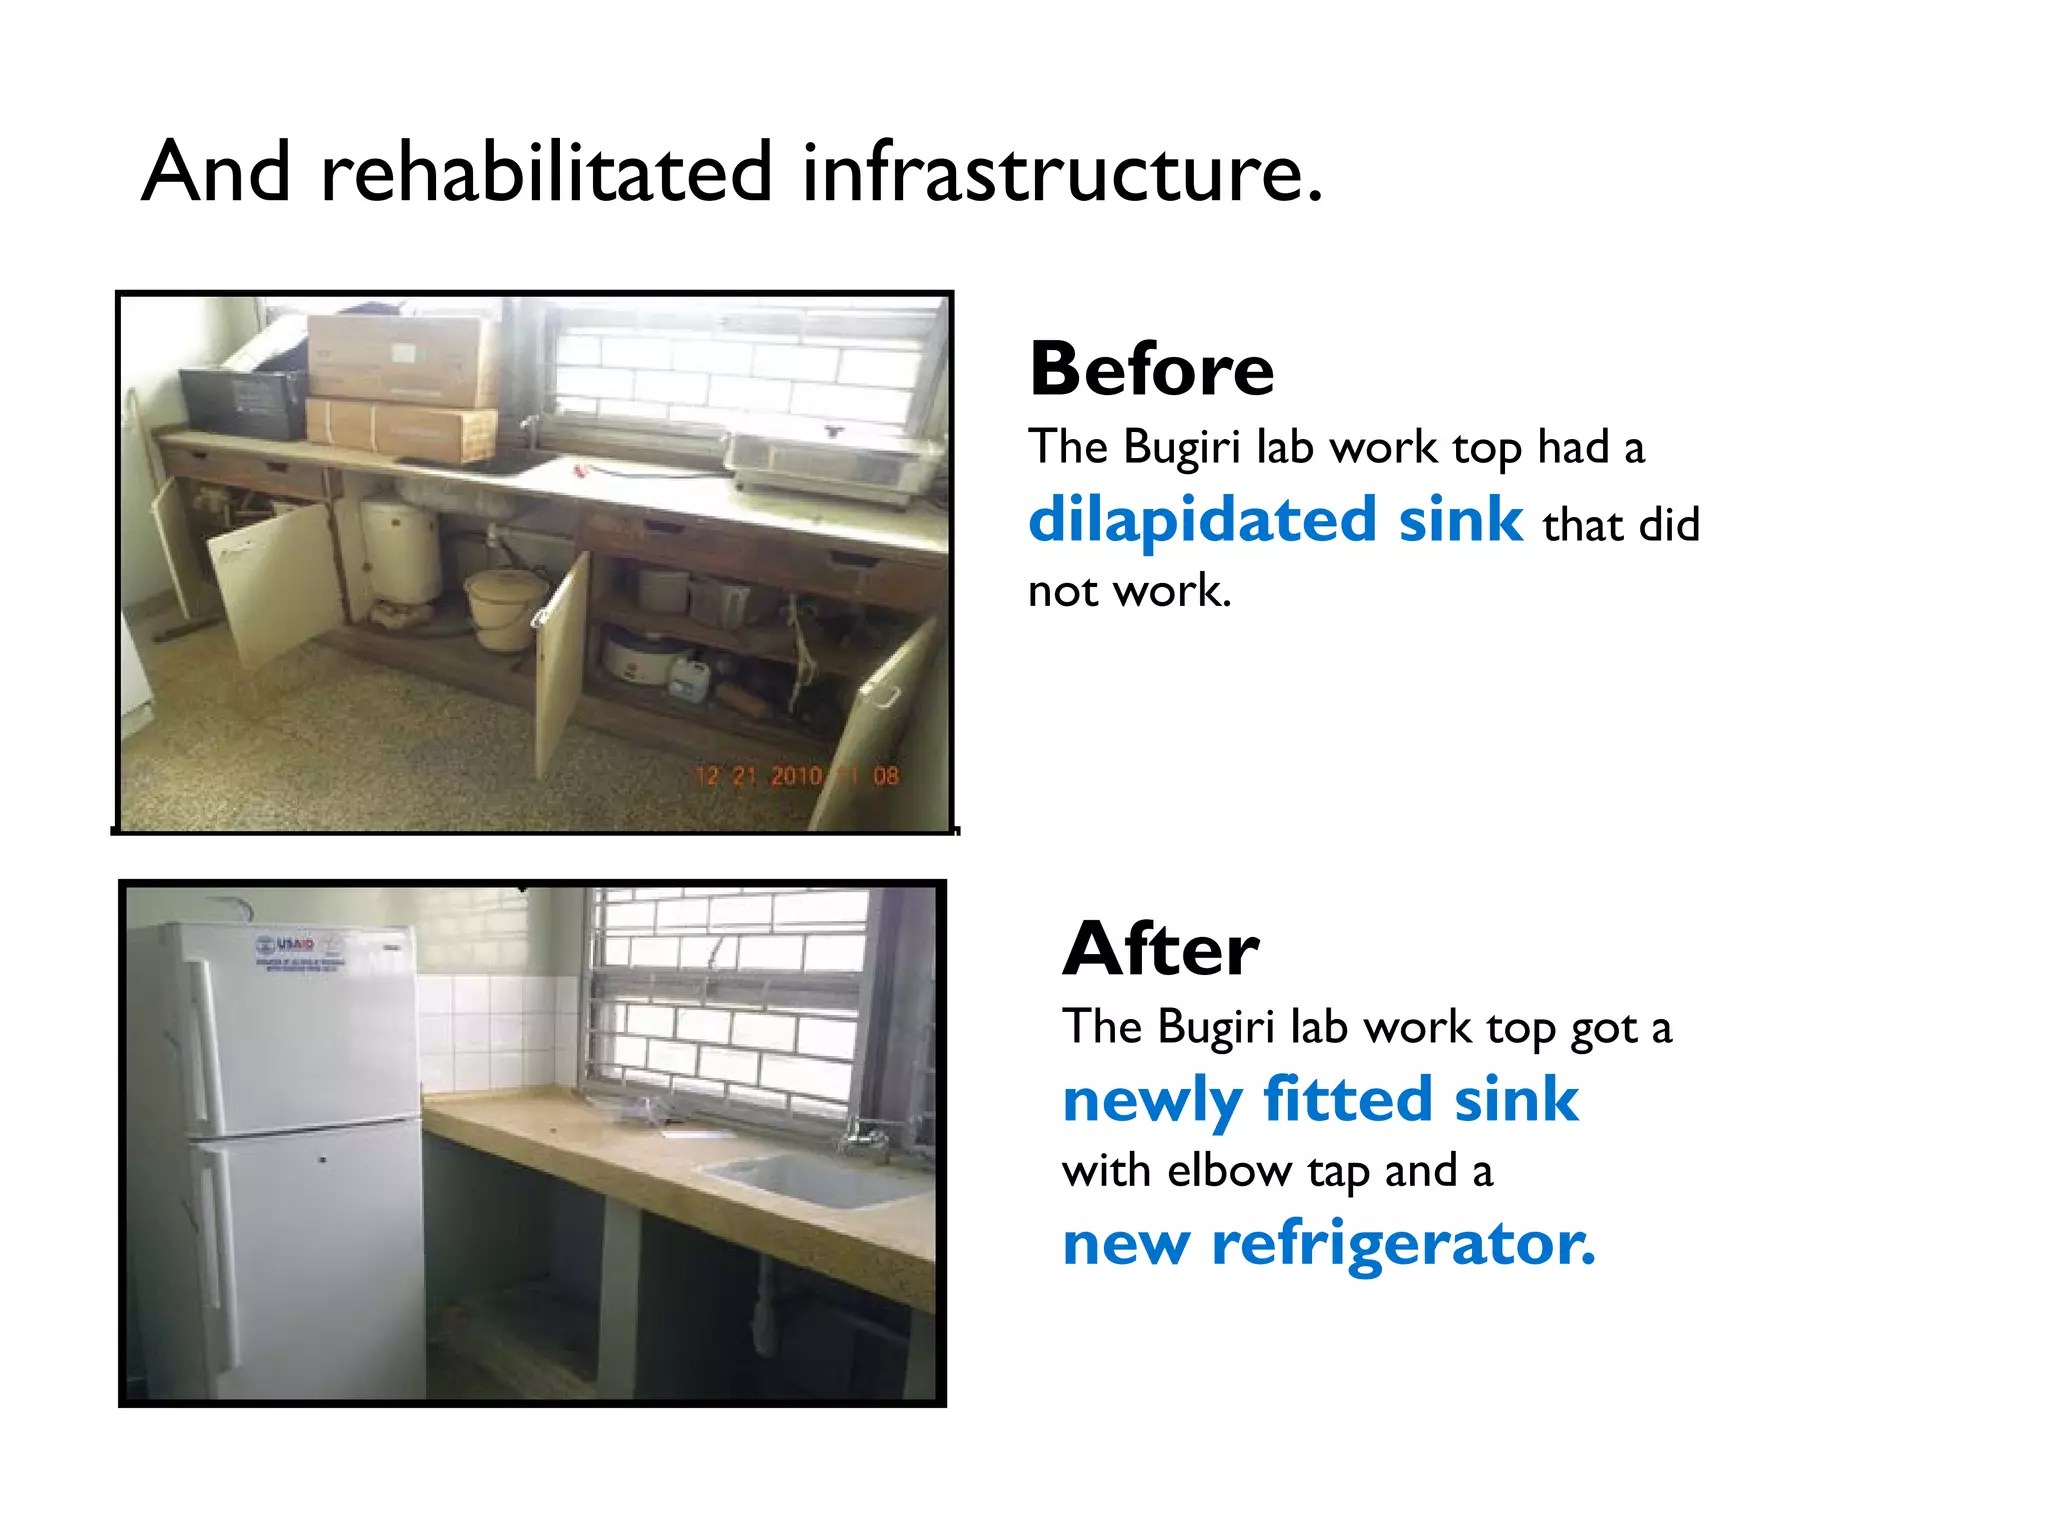
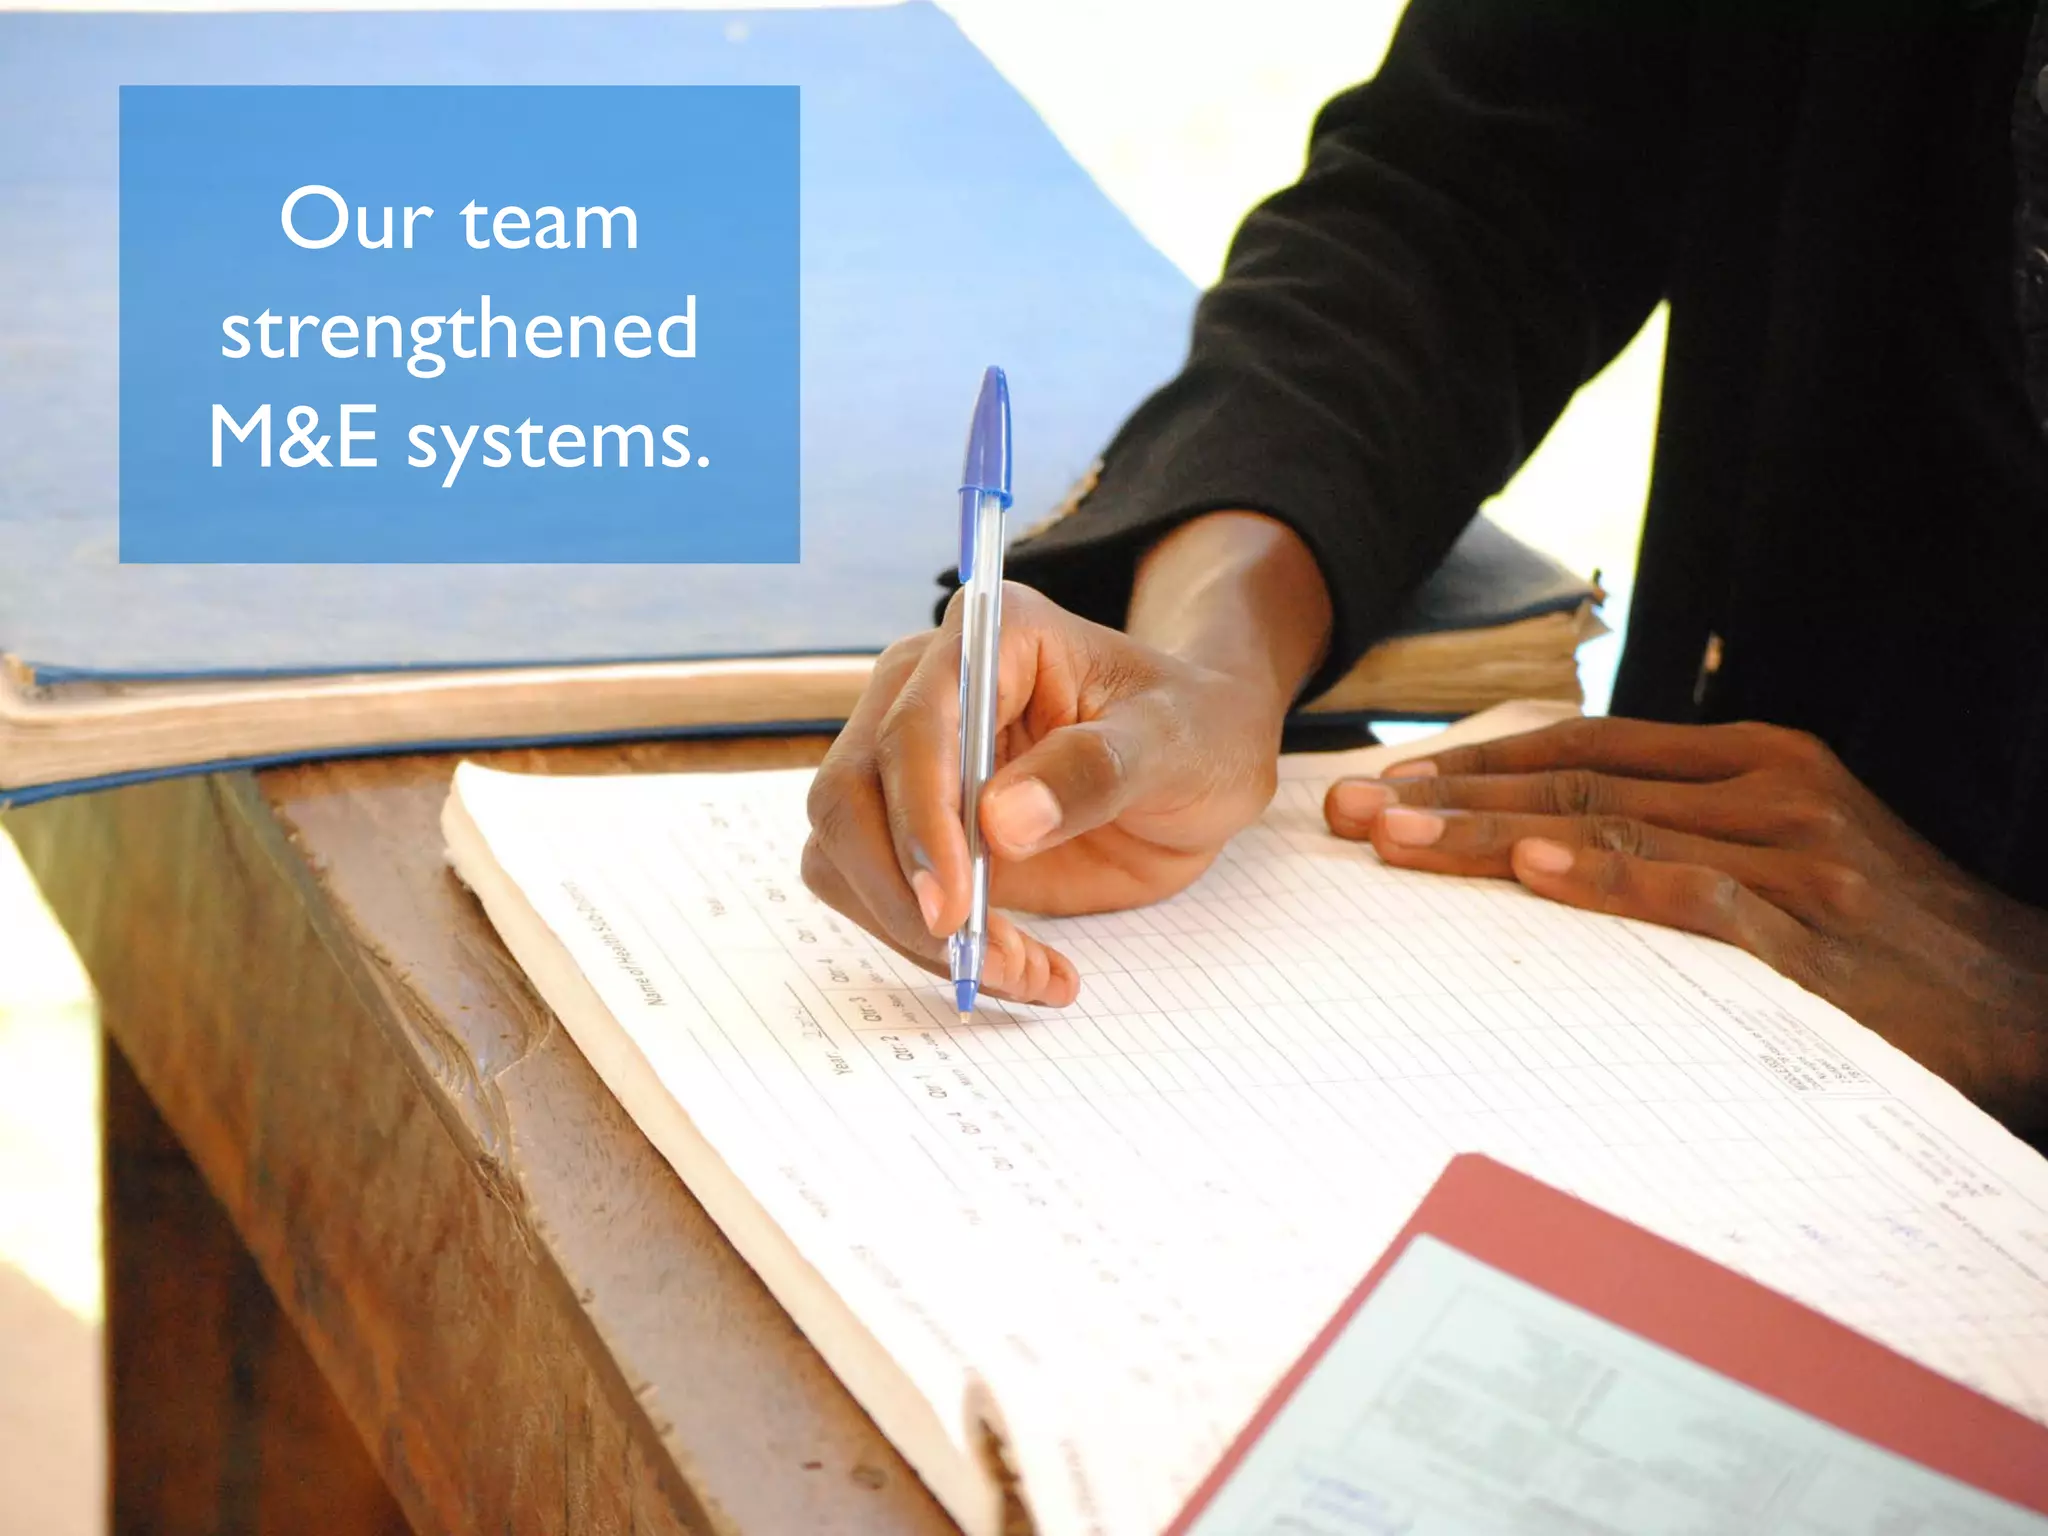
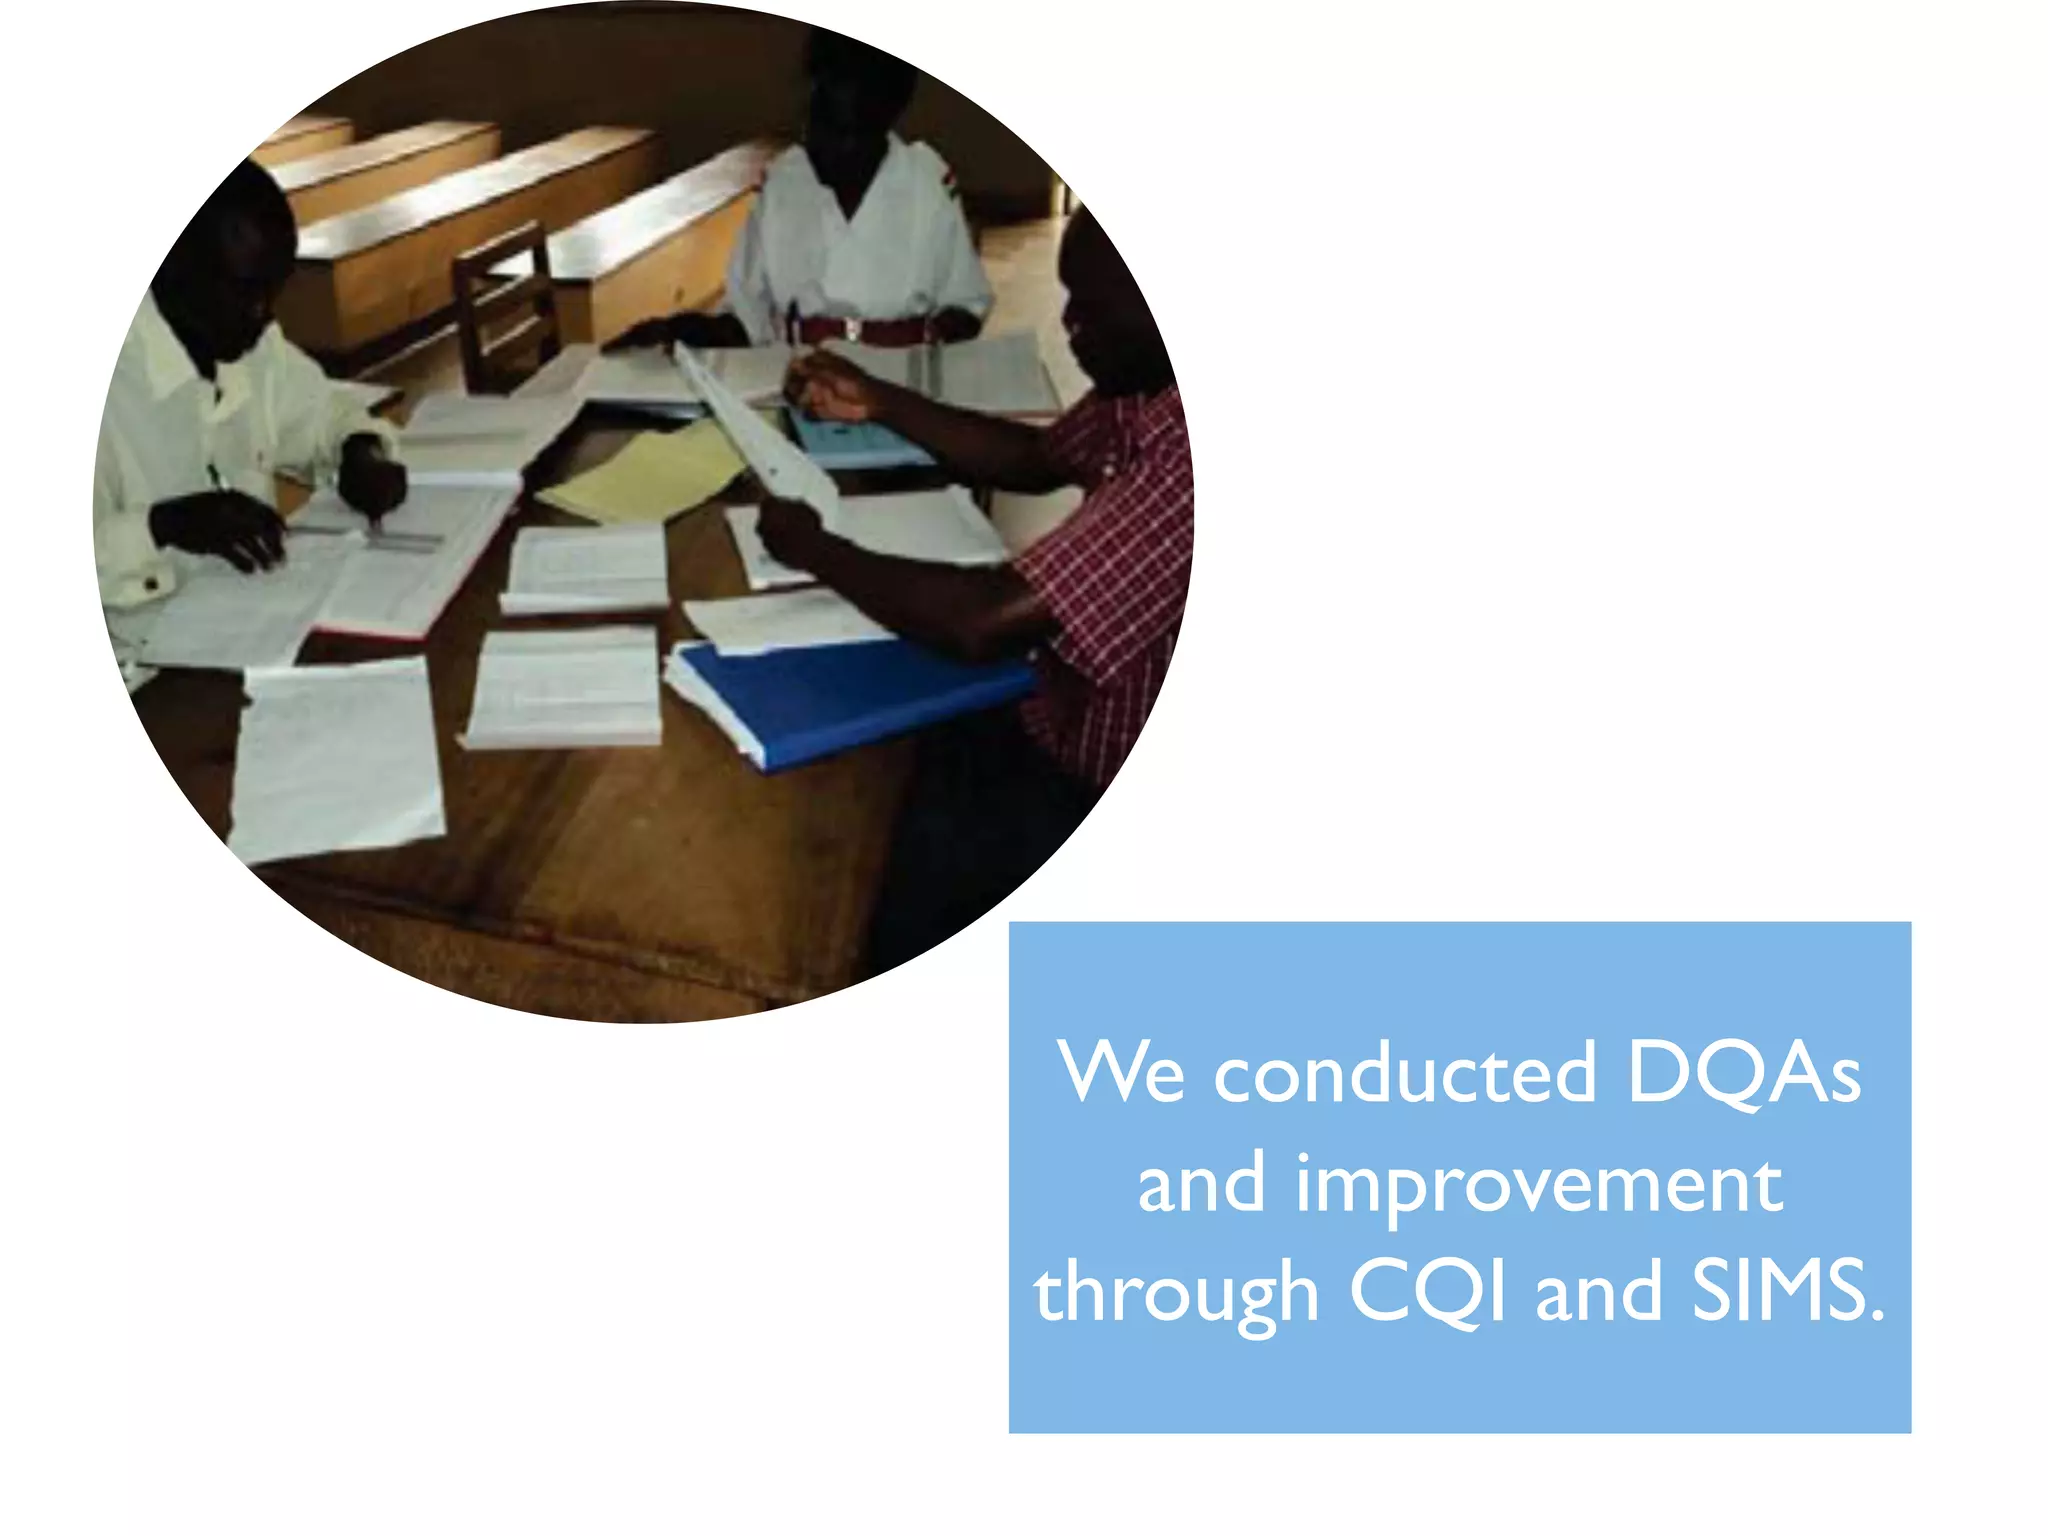
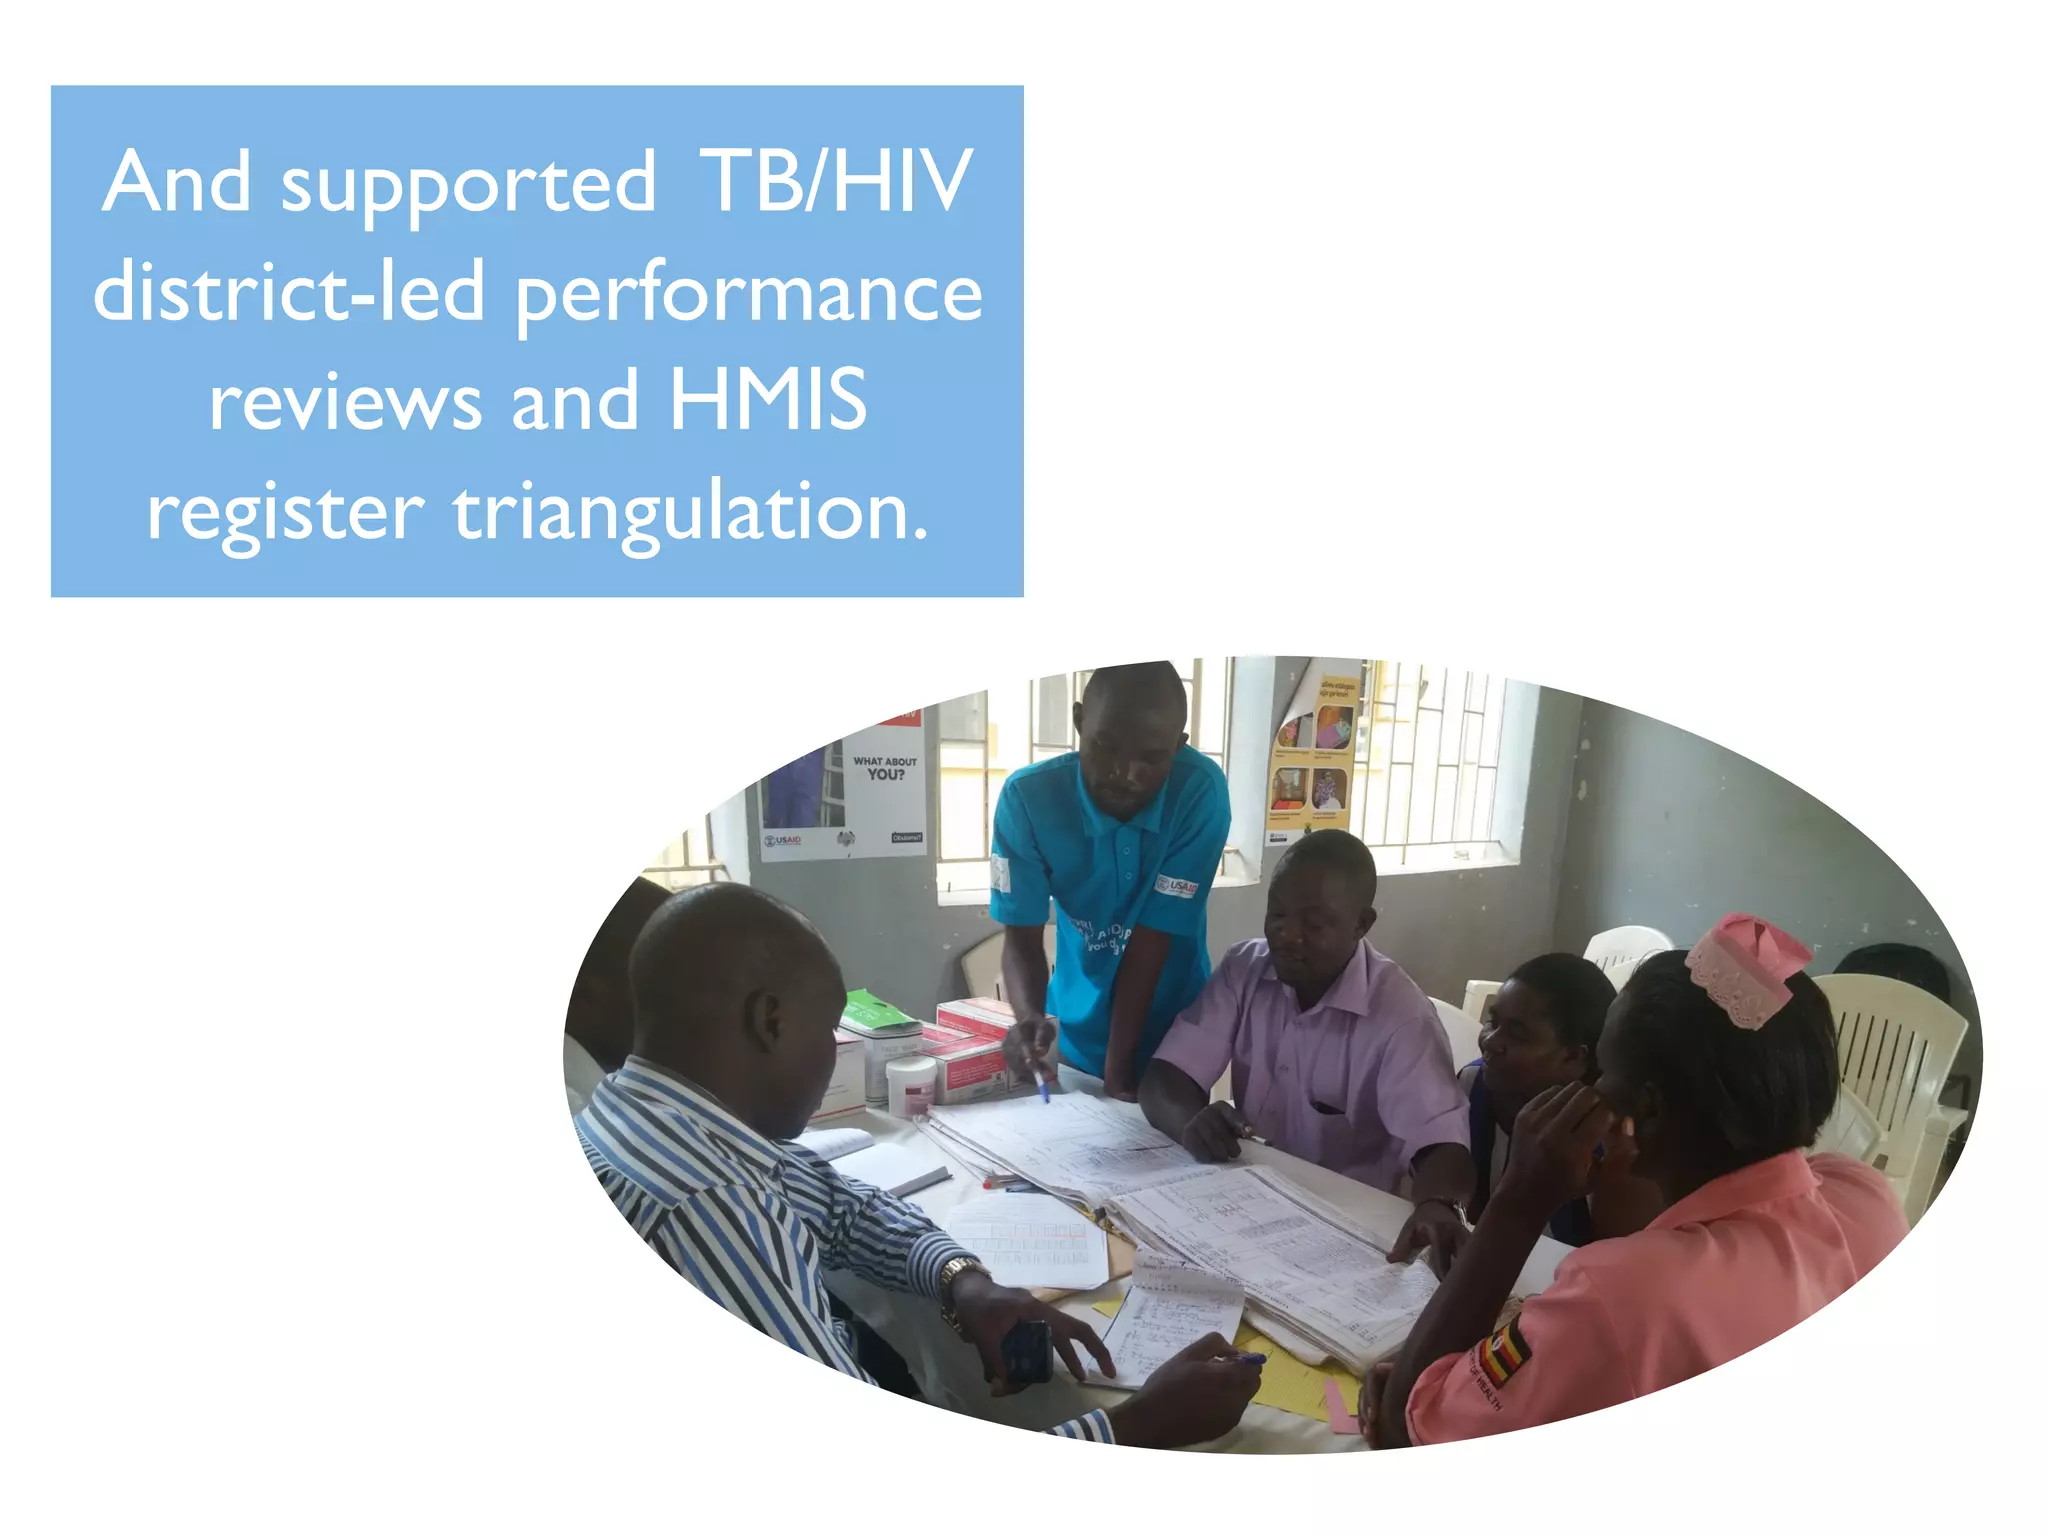
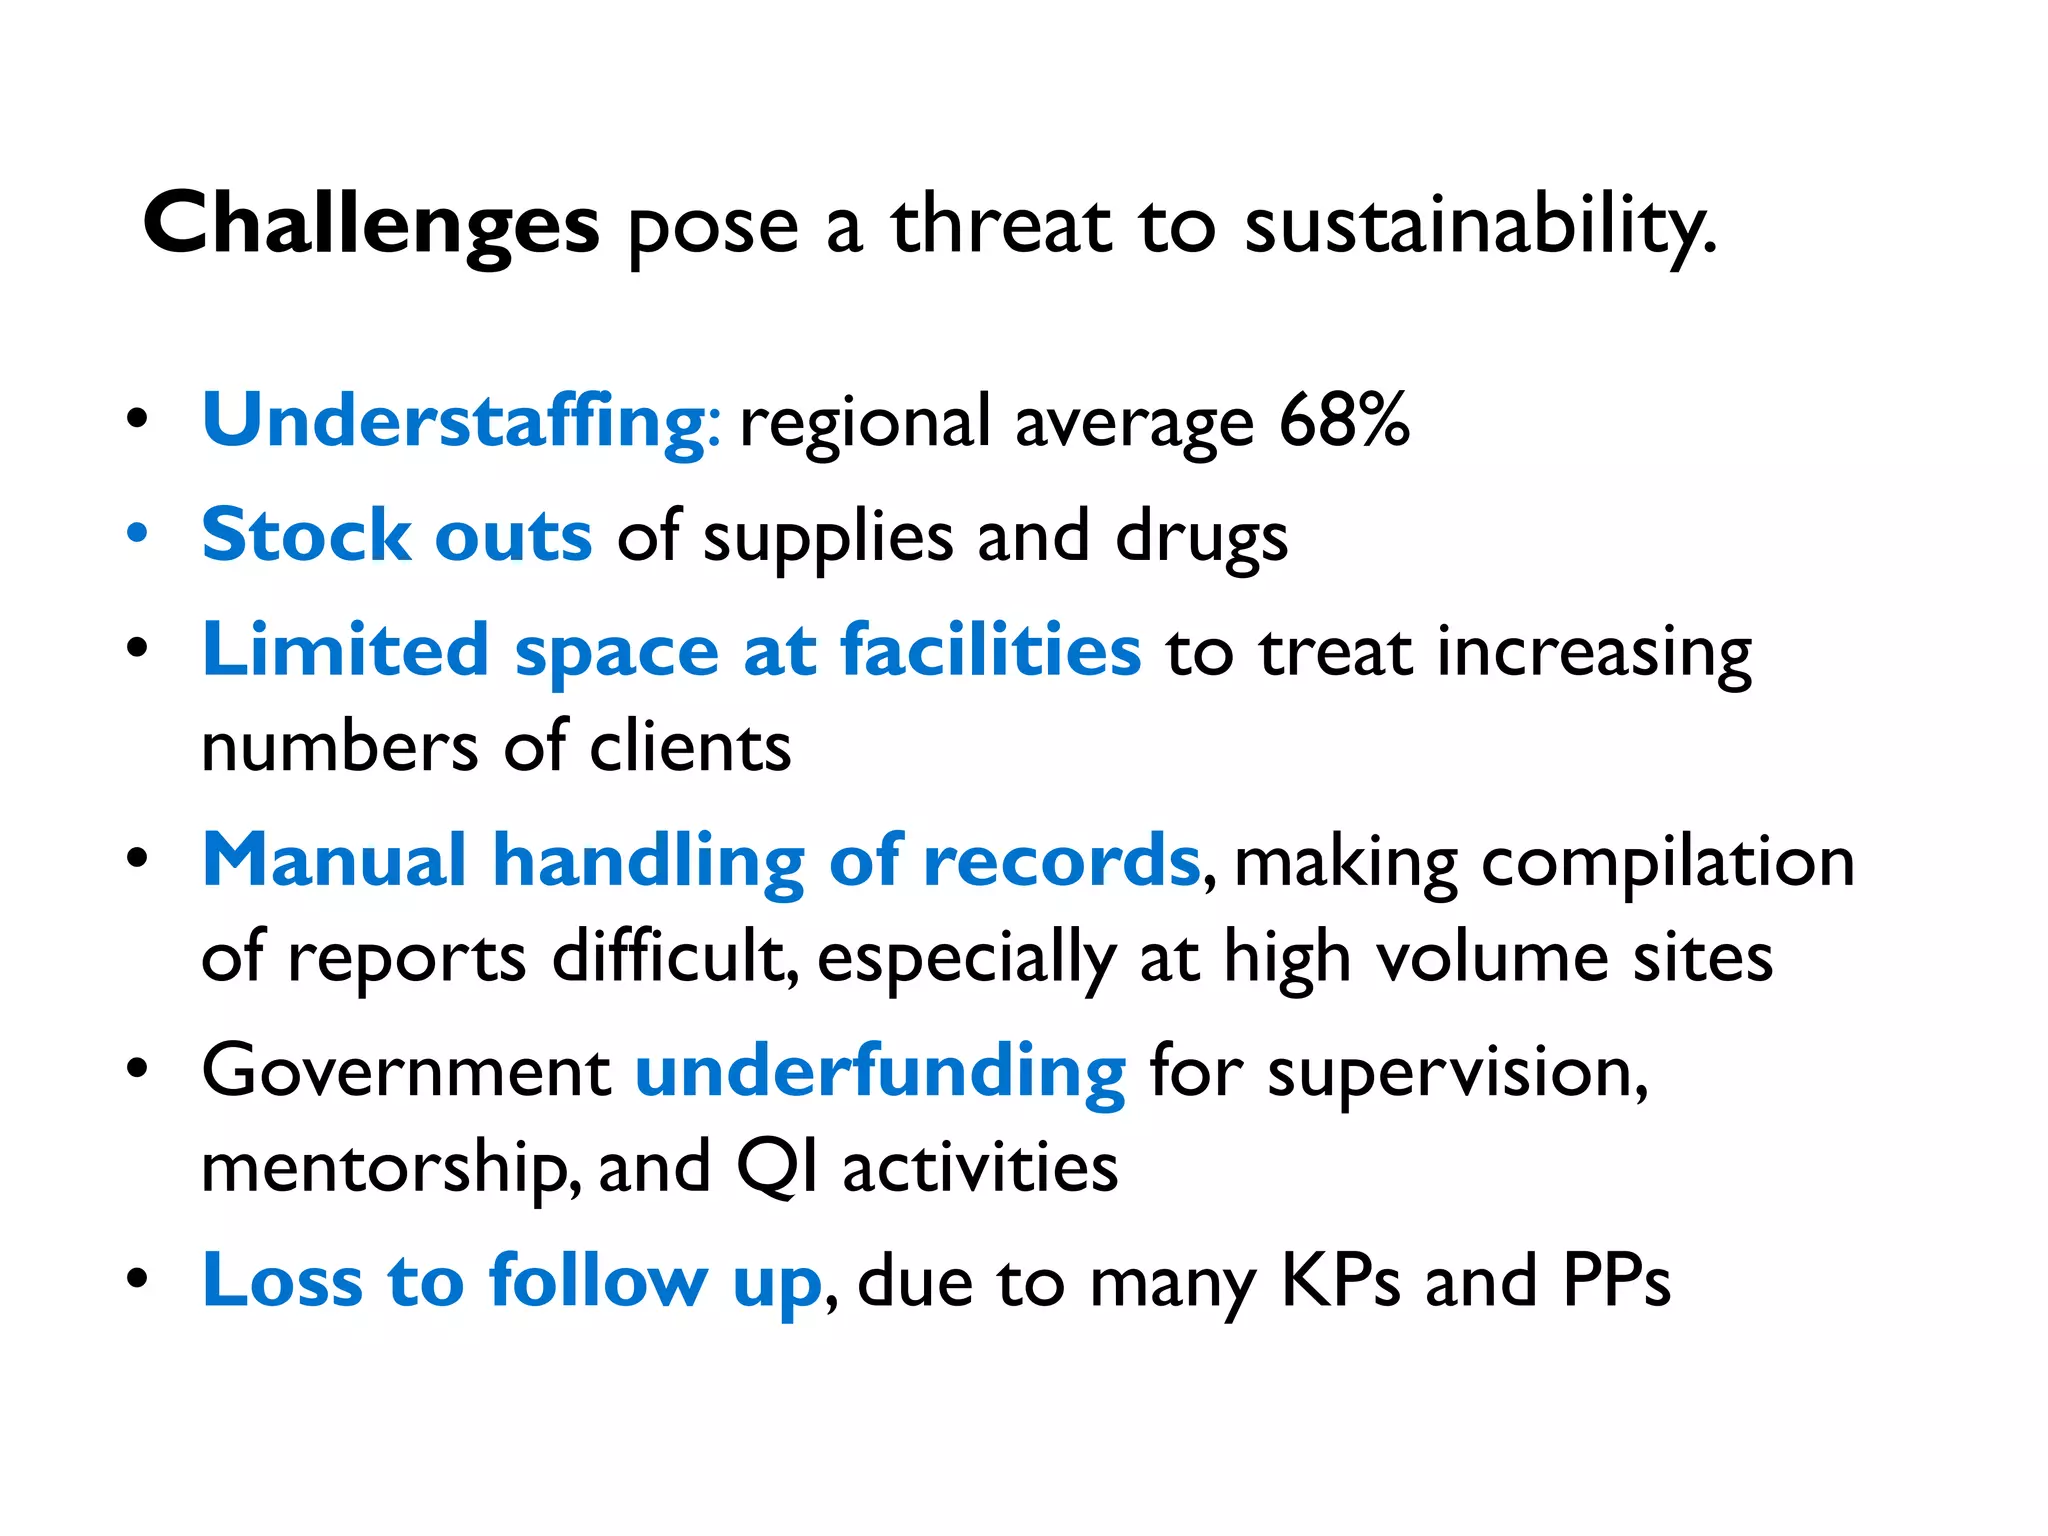
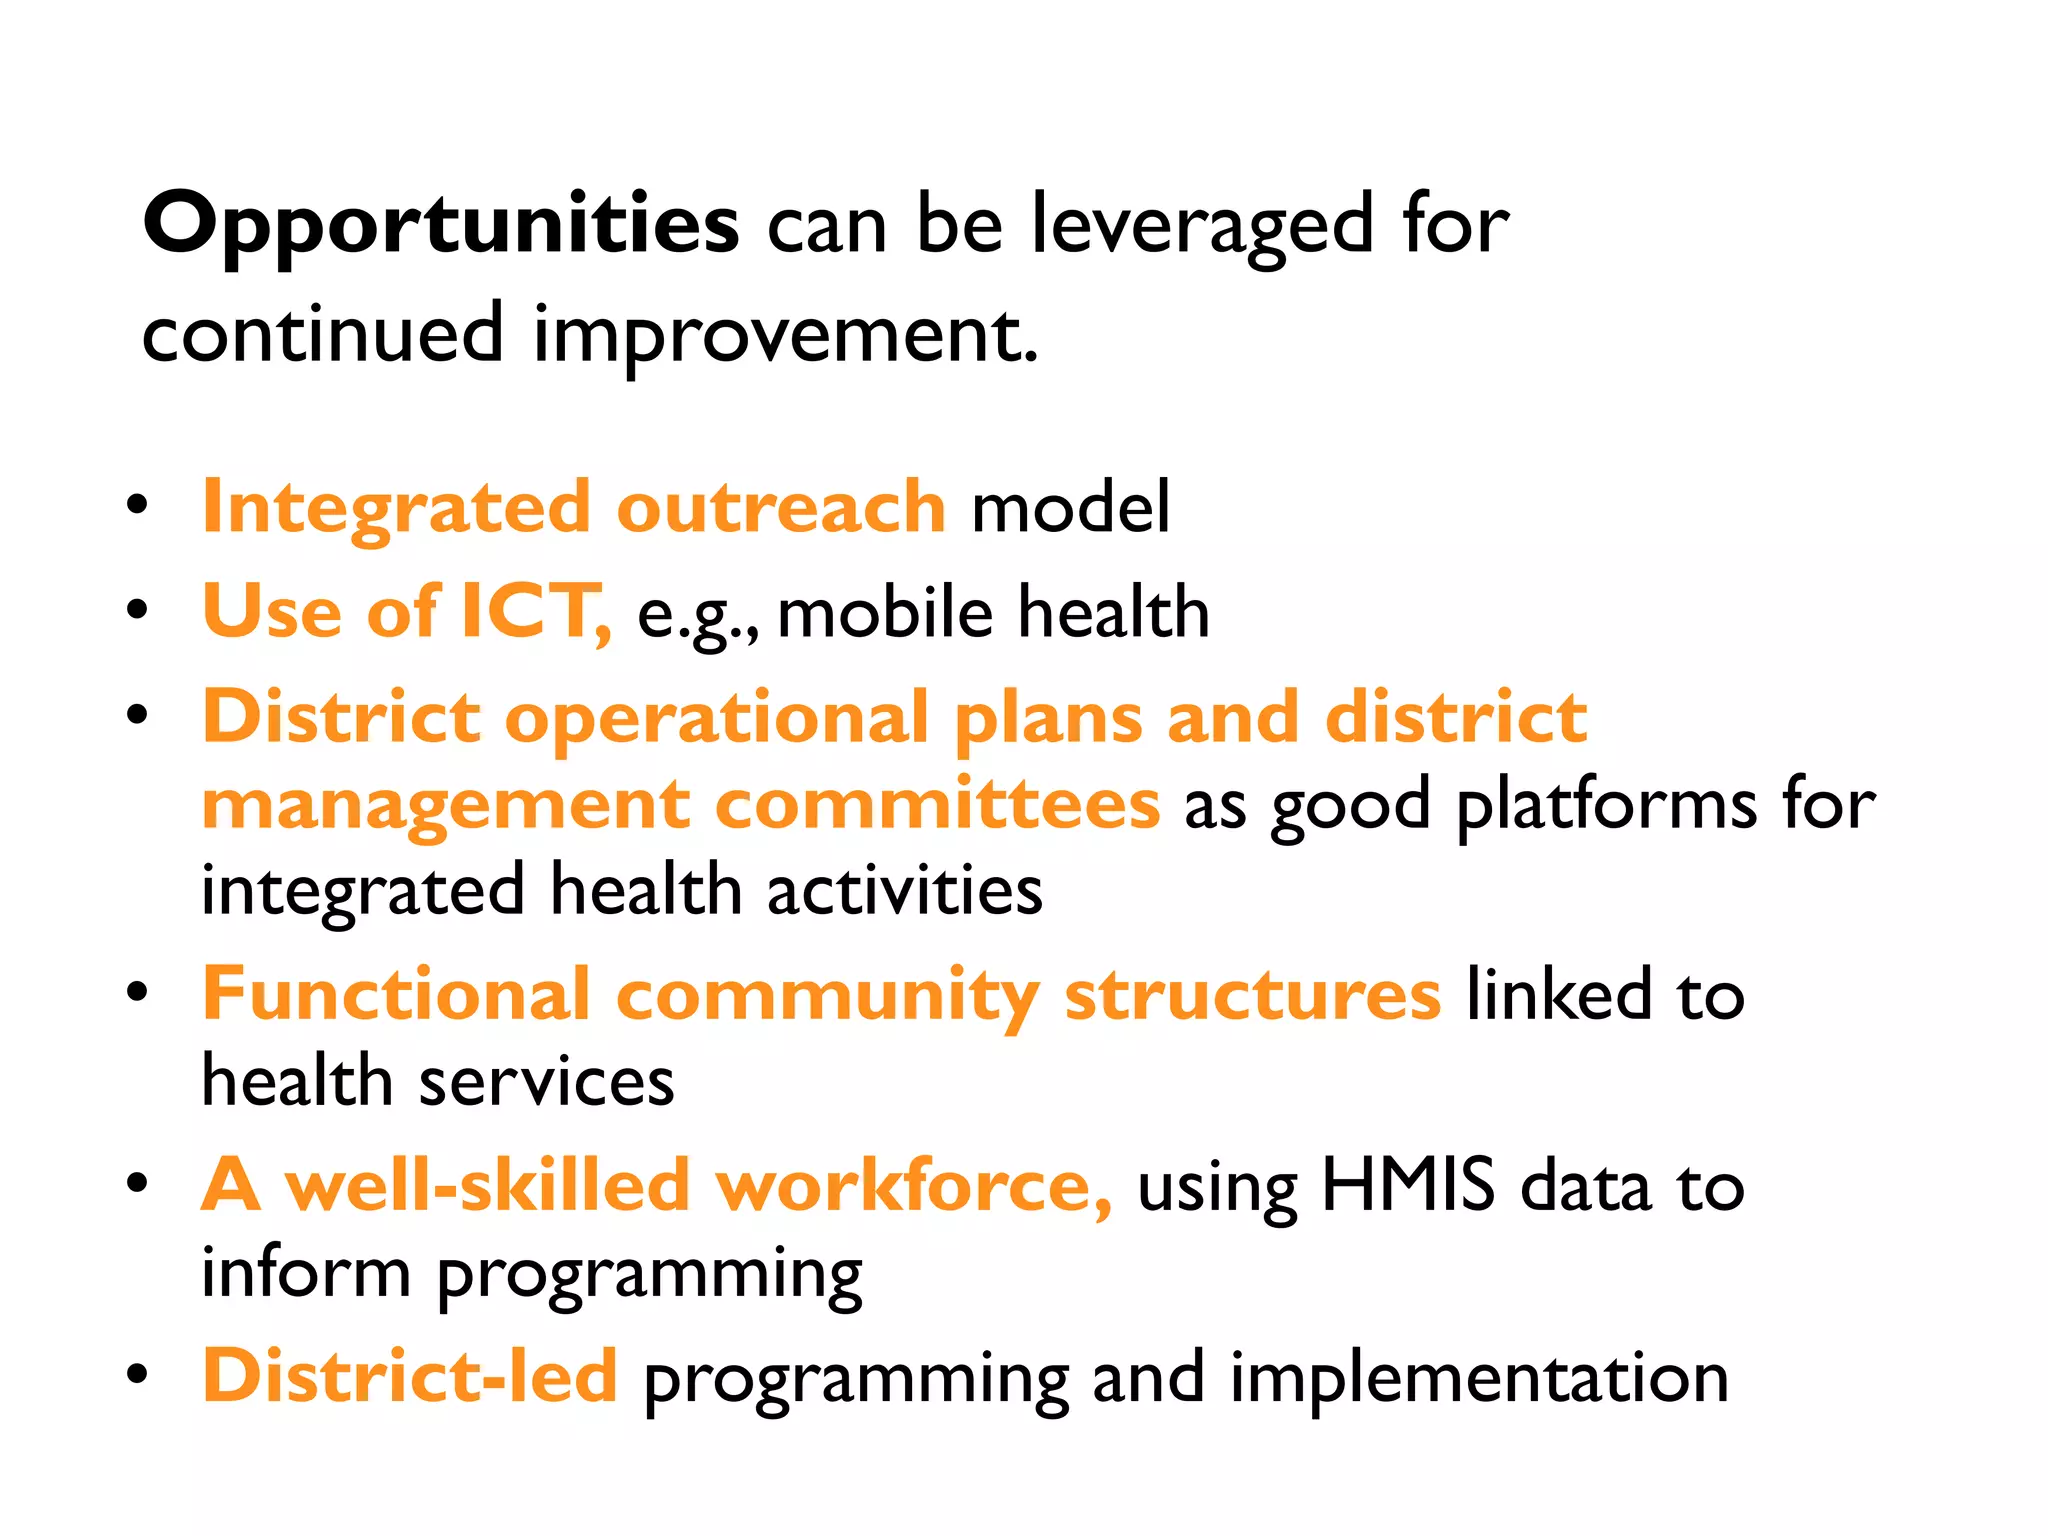
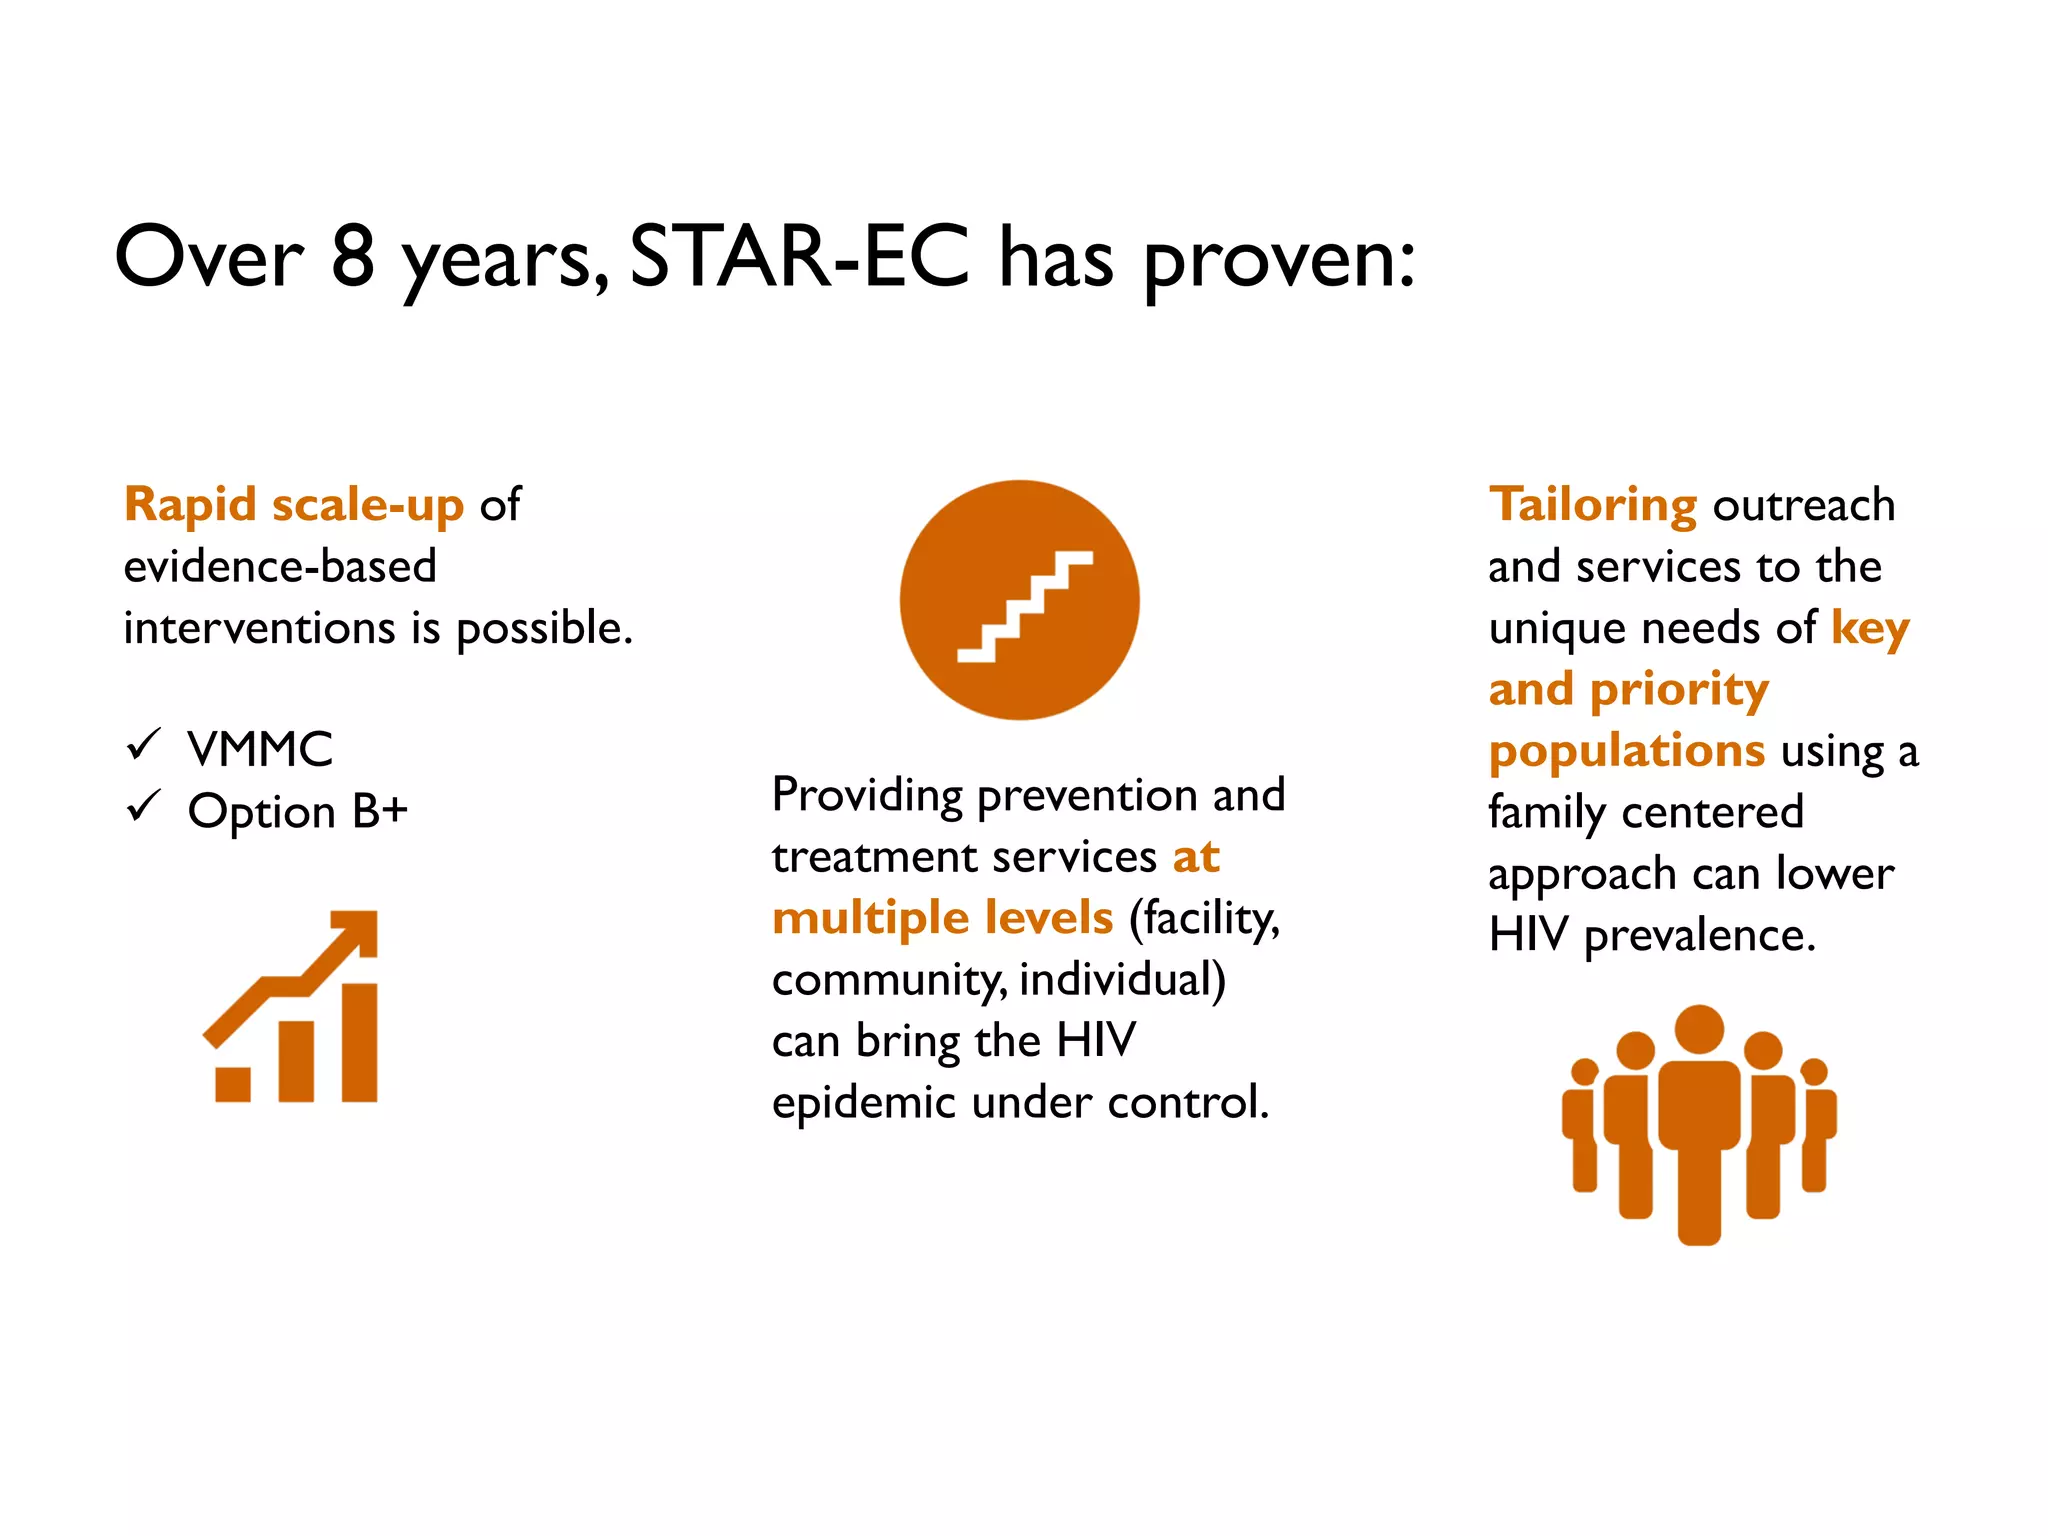

The 8-year STAR-EC project in East Central Uganda achieved remarkable results in improving HIV and TB outcomes. Key accomplishments included reducing HIV positivity from 5.4% to 3.6%, increasing the number of people on ART from 372 to over 40,000, and exceeding treatment success benchmarks for TB. The project strengthened health systems by expanding laboratory networks, improving infrastructure, and building workforce capacity. Challenges around staffing and supply stockouts were addressed. The project demonstrated that rapid scale-up of evidence-based interventions can control epidemics through tailored outreach and multi-level services.


![Apporach to lung biopsy [Auto-saved].pptx latest](https://cdn.slidesharecdn.com/ss_thumbnails/apporachtolungbiopsyauto-saved-251211225655-93258539-thumbnail.jpg?width=640&height=640&fit=bounds)


