Download to read offline

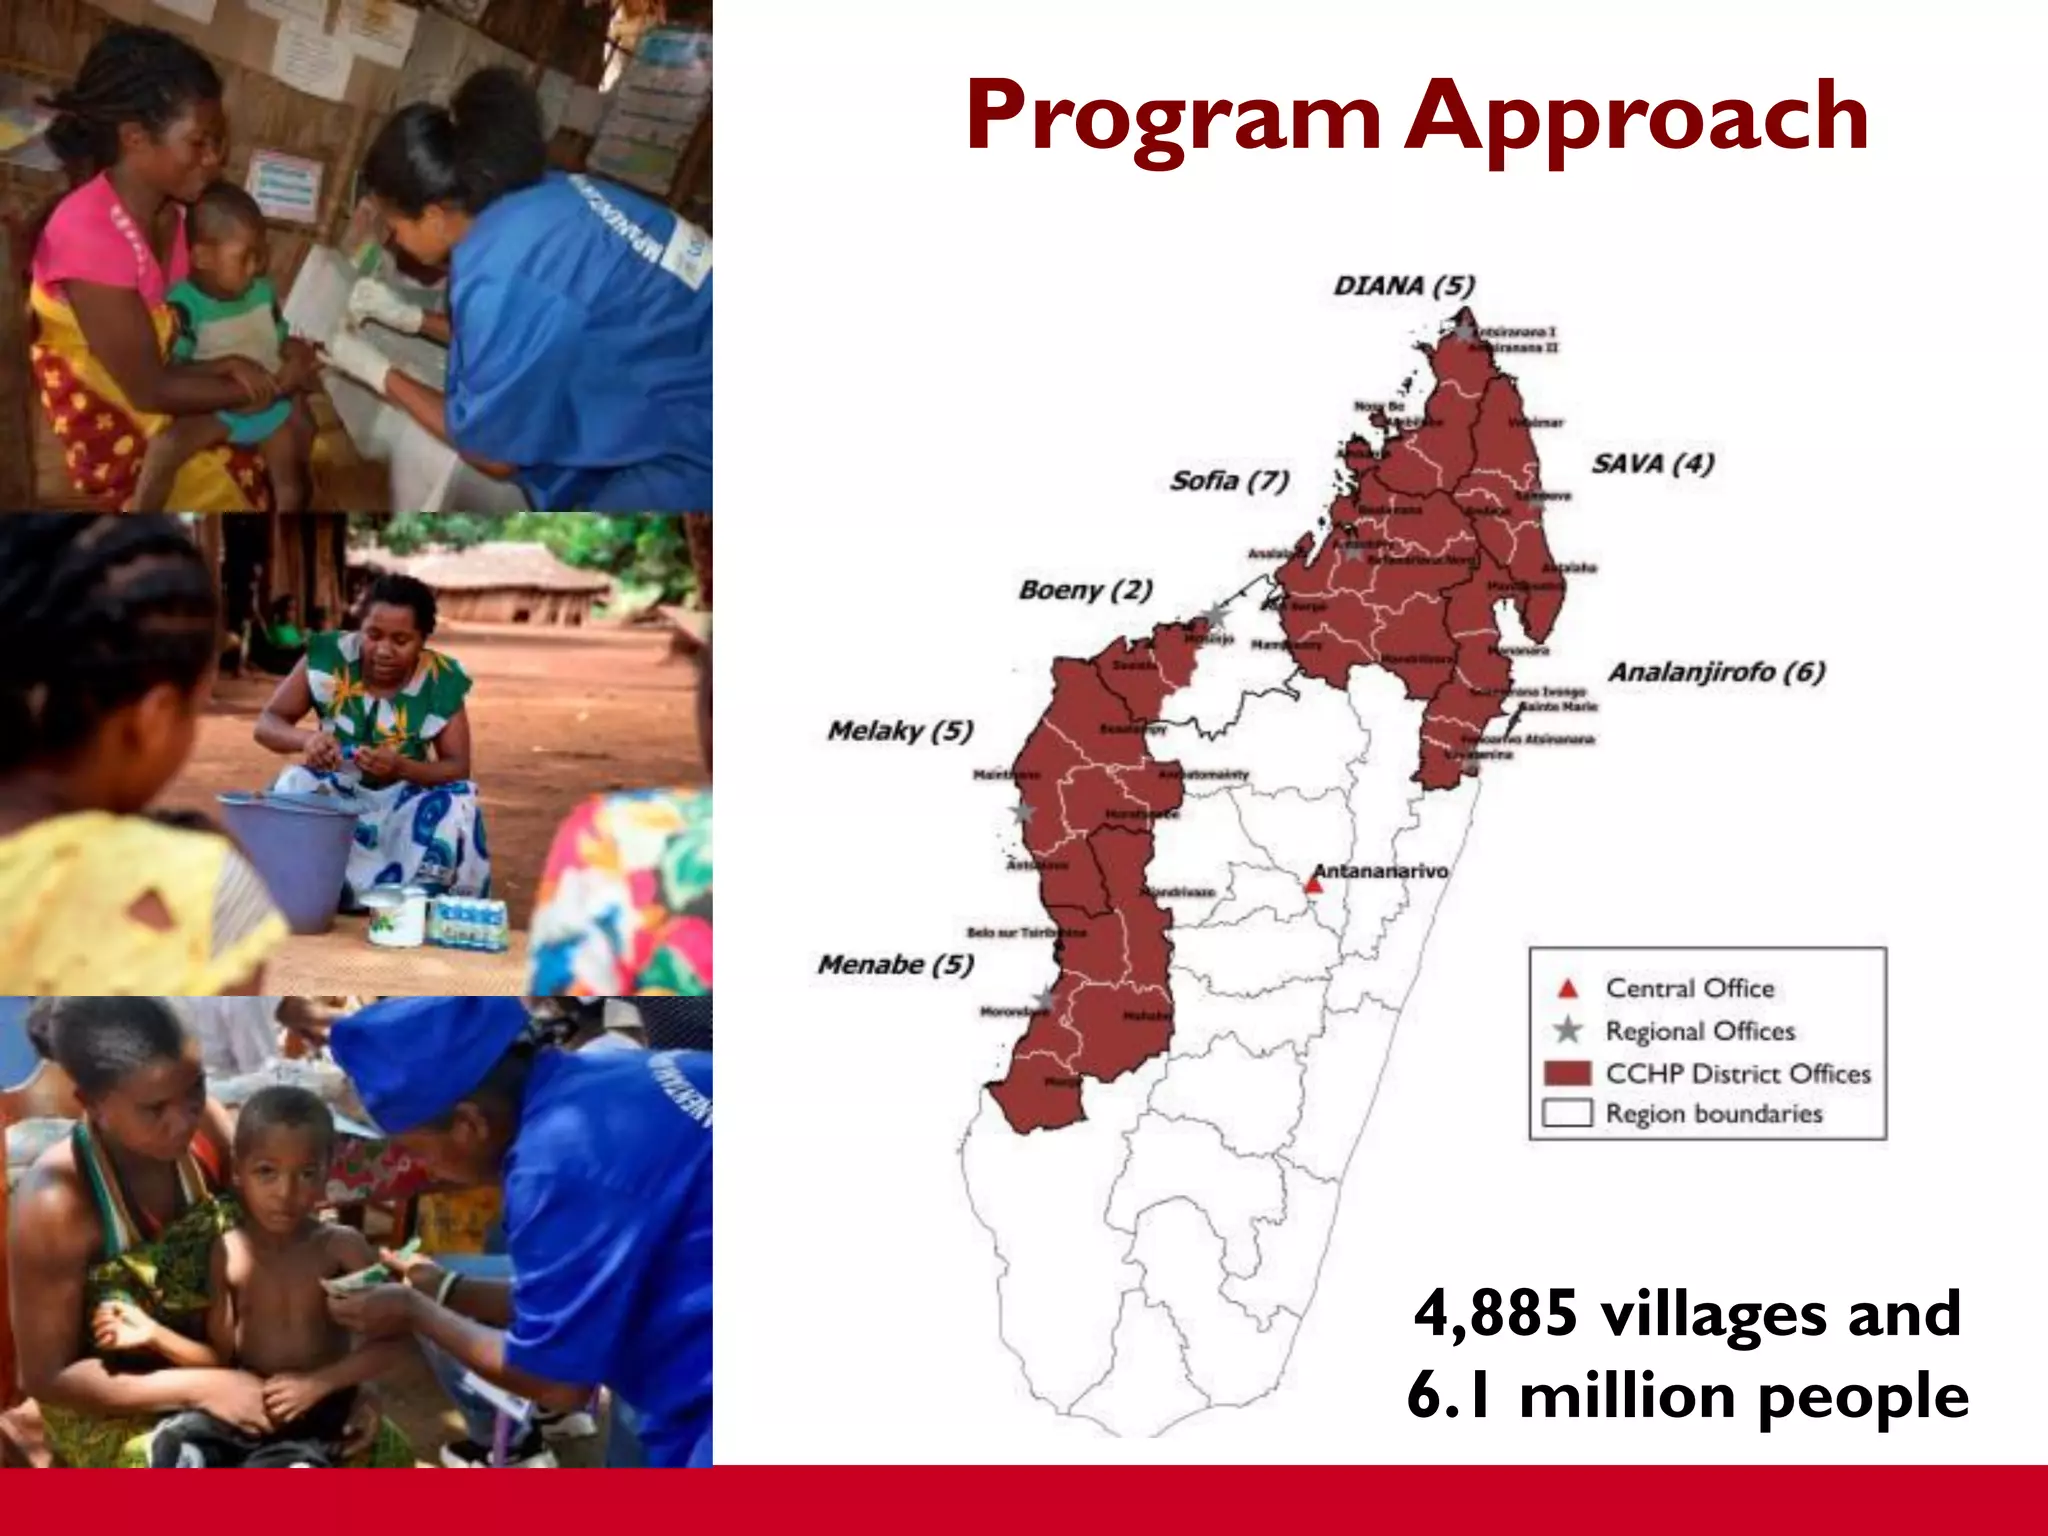

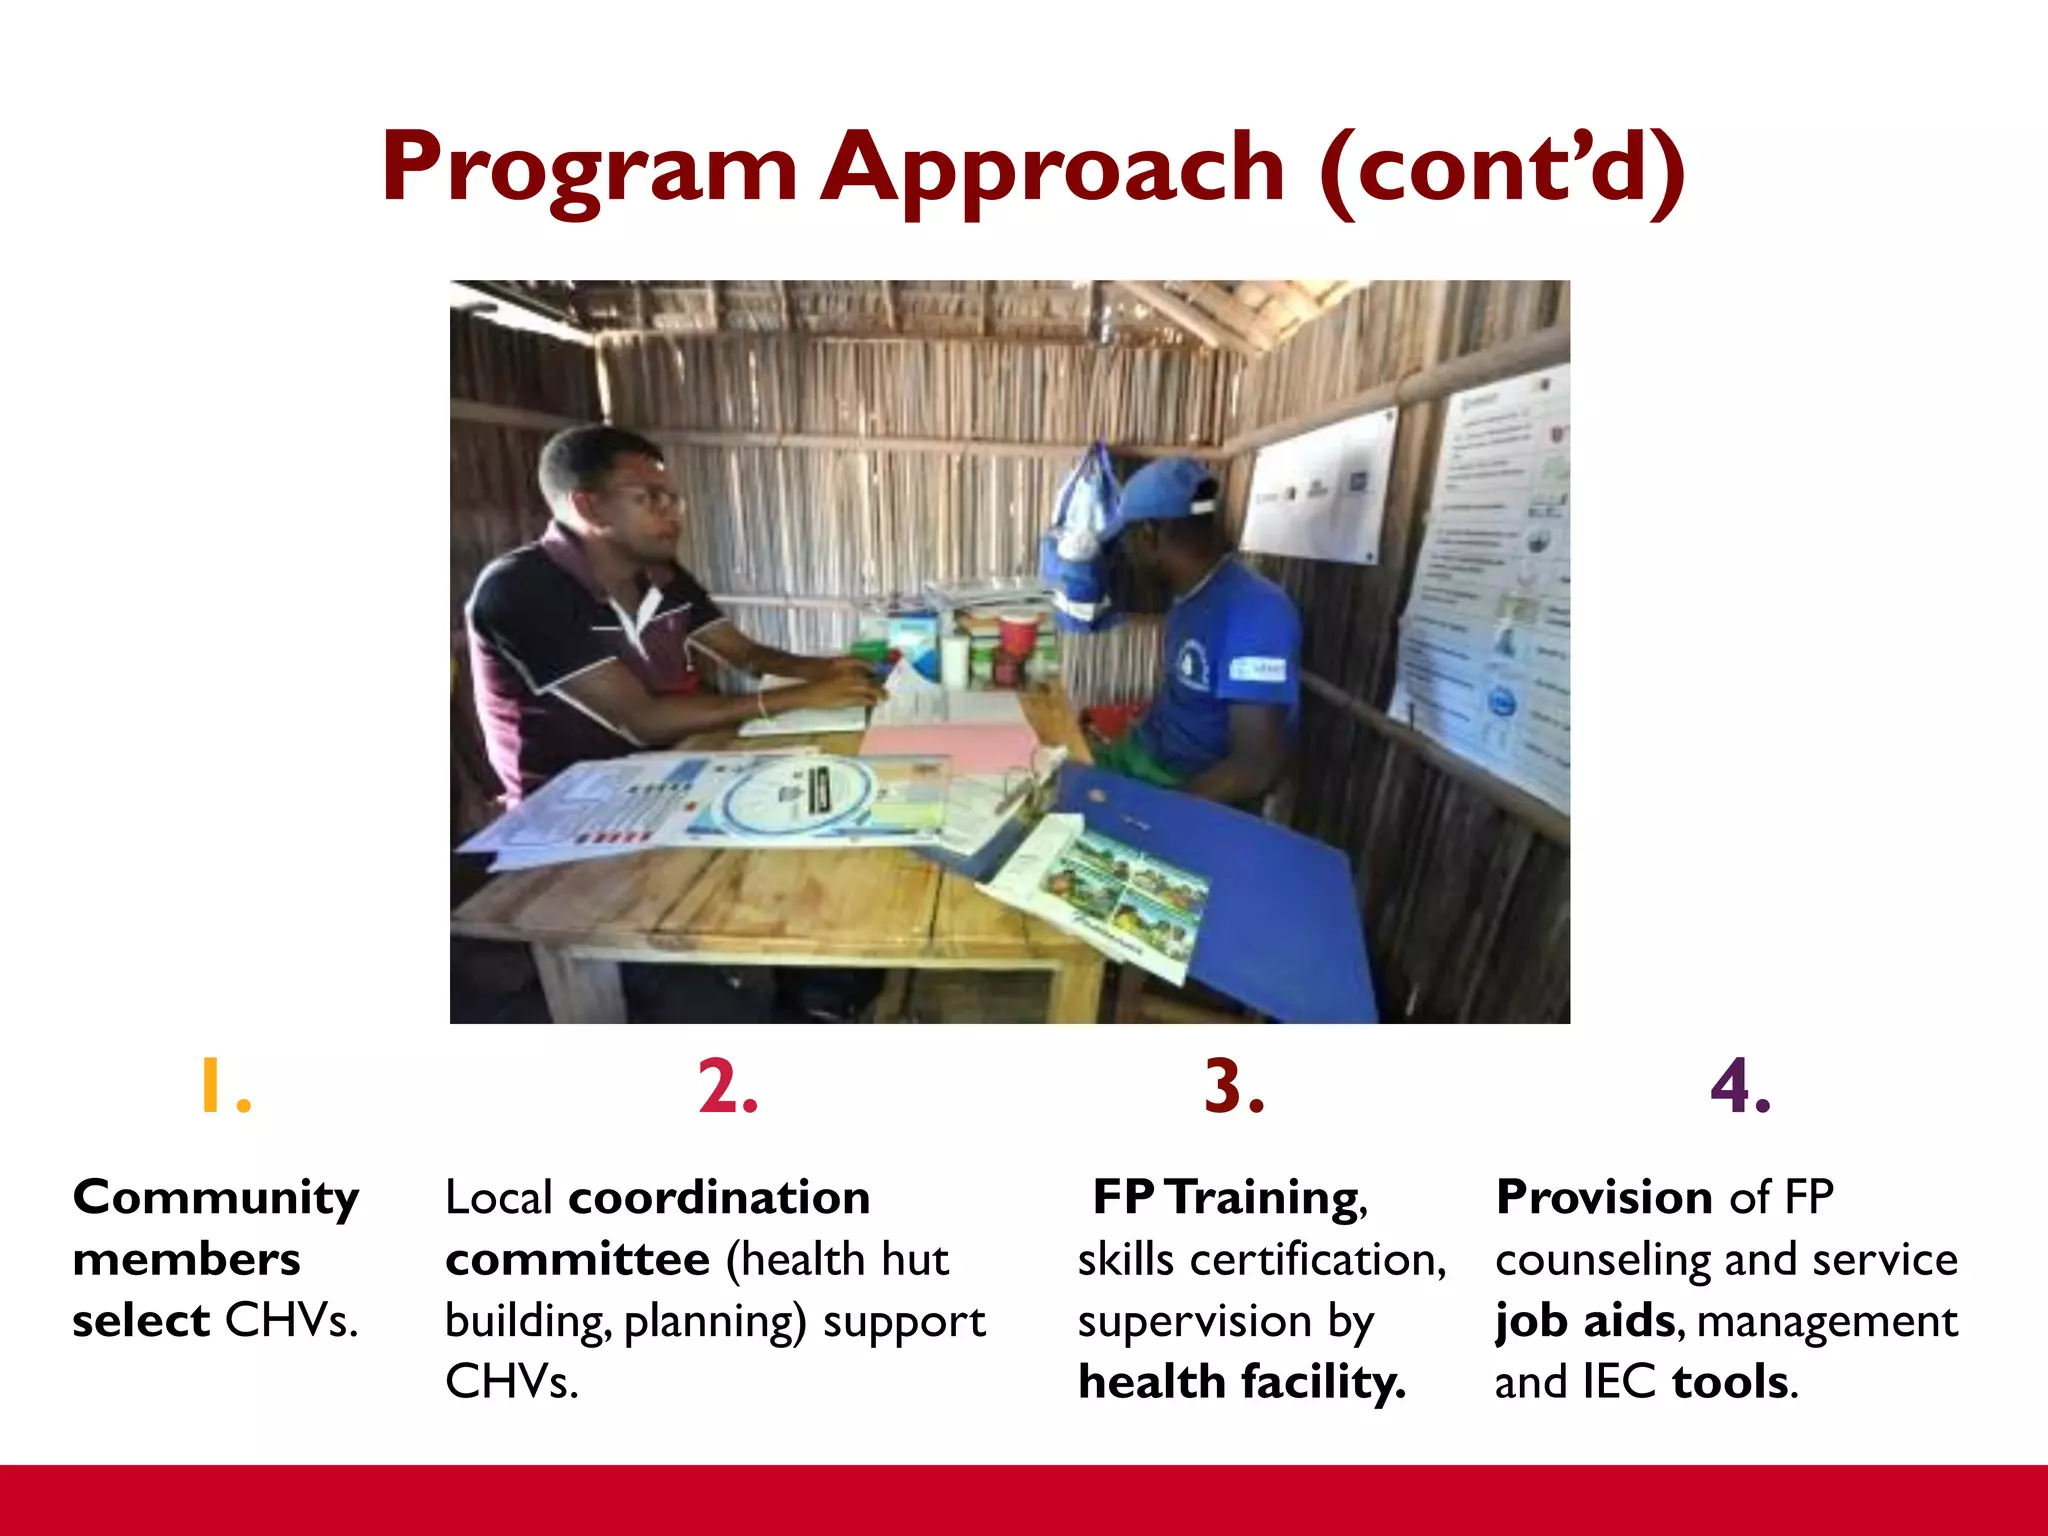
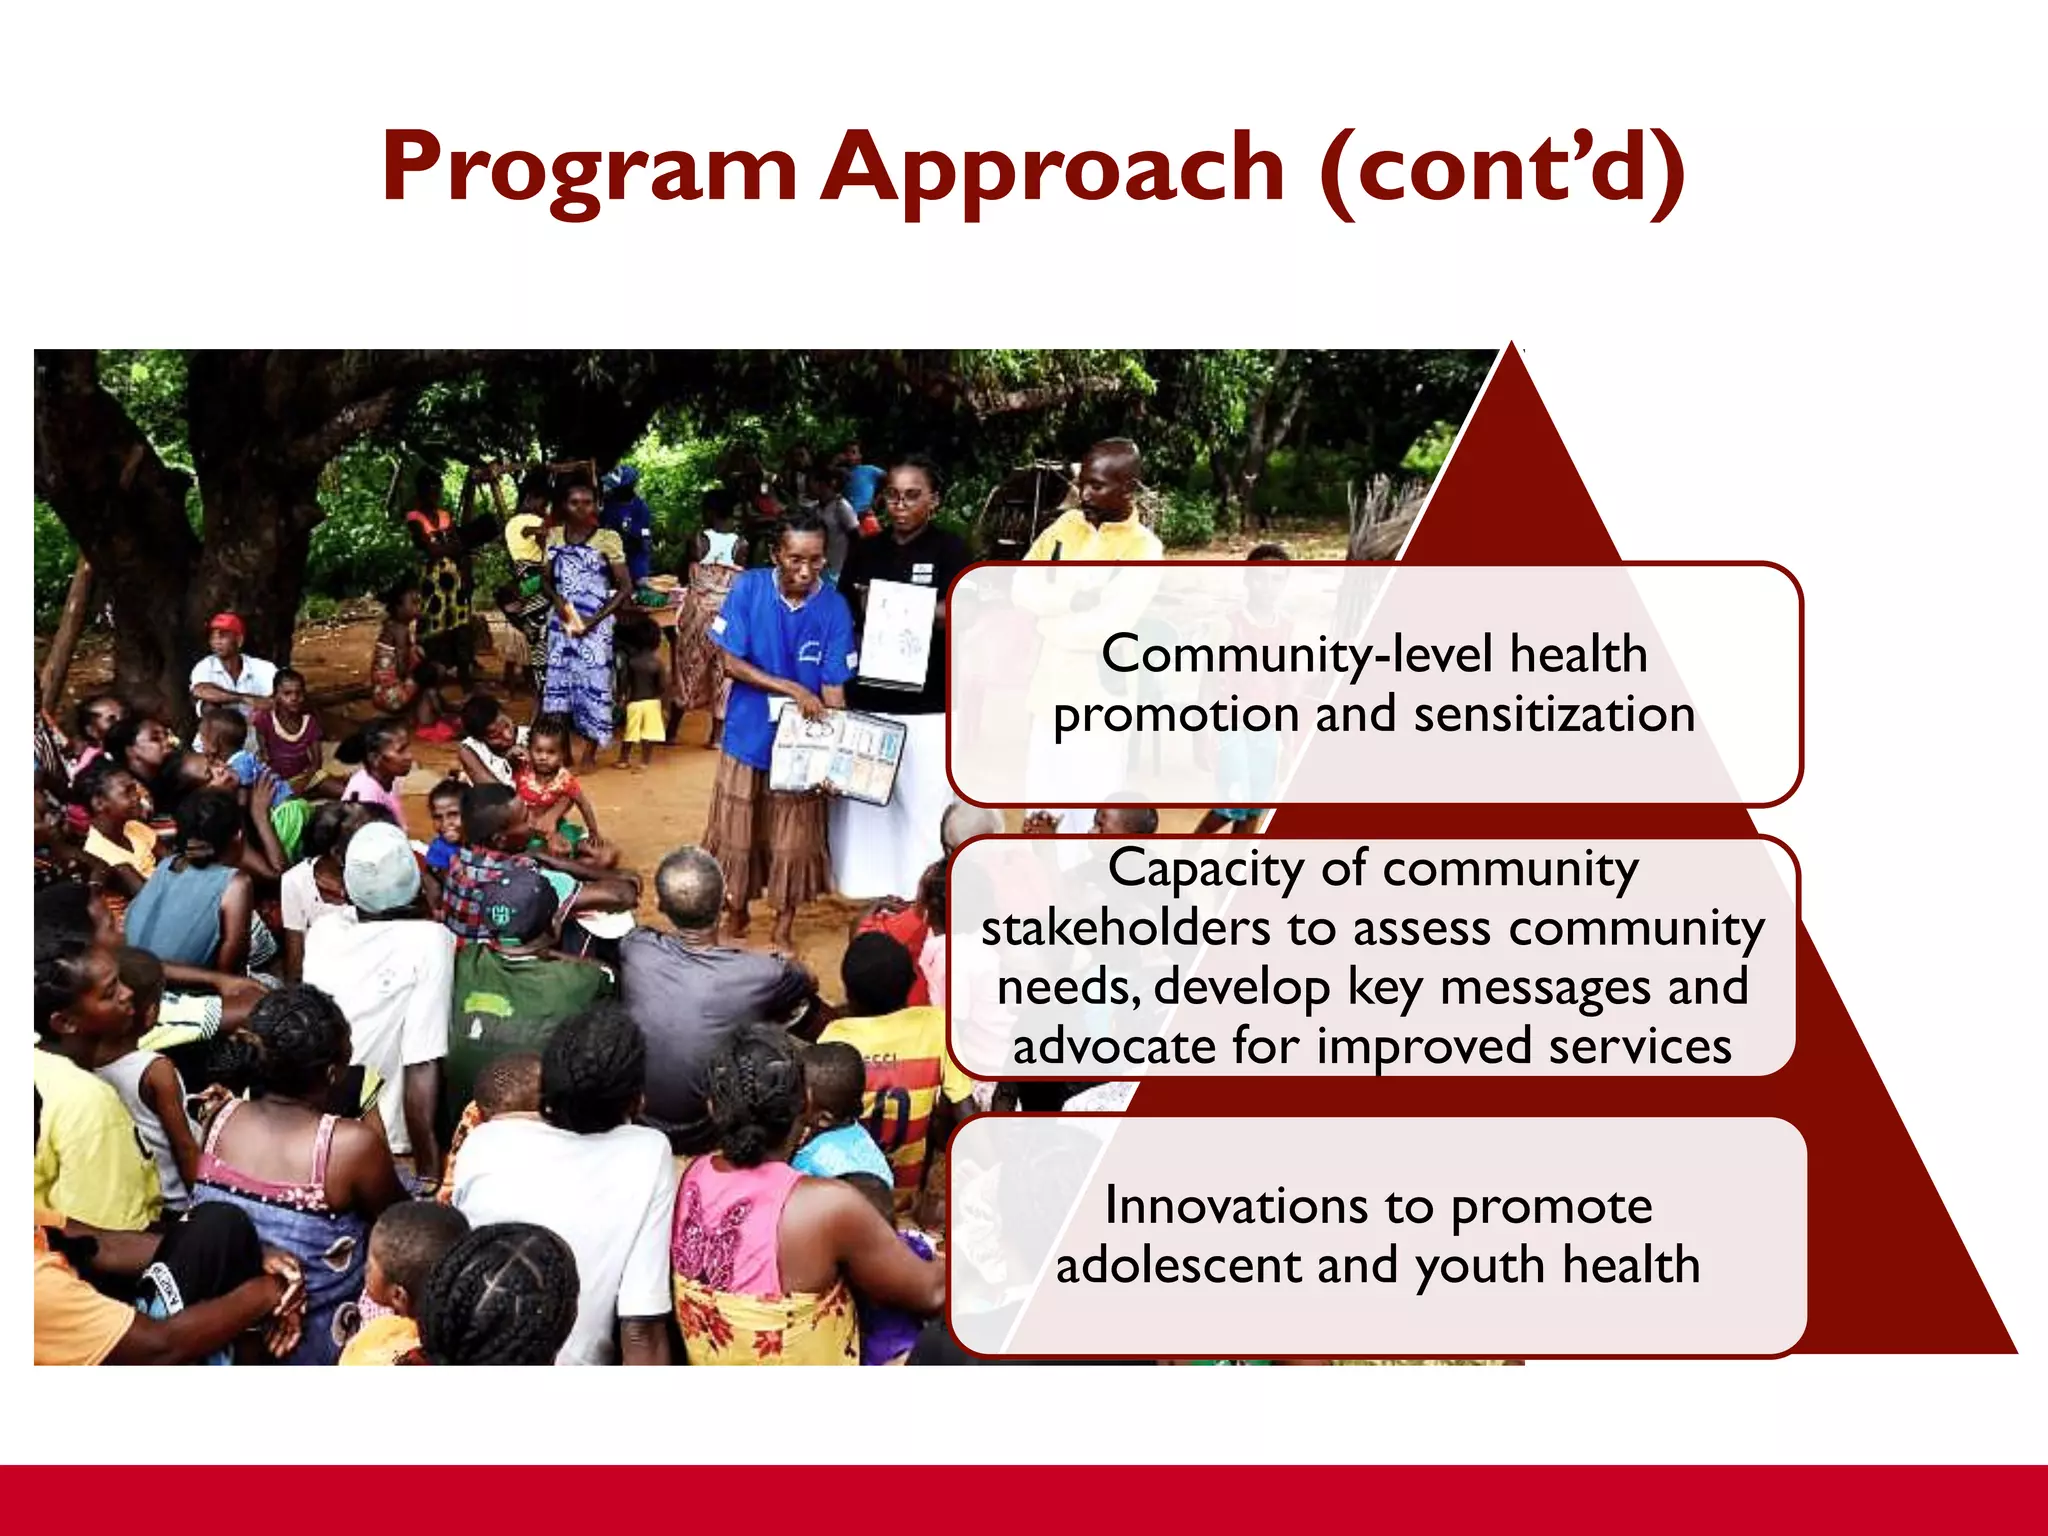


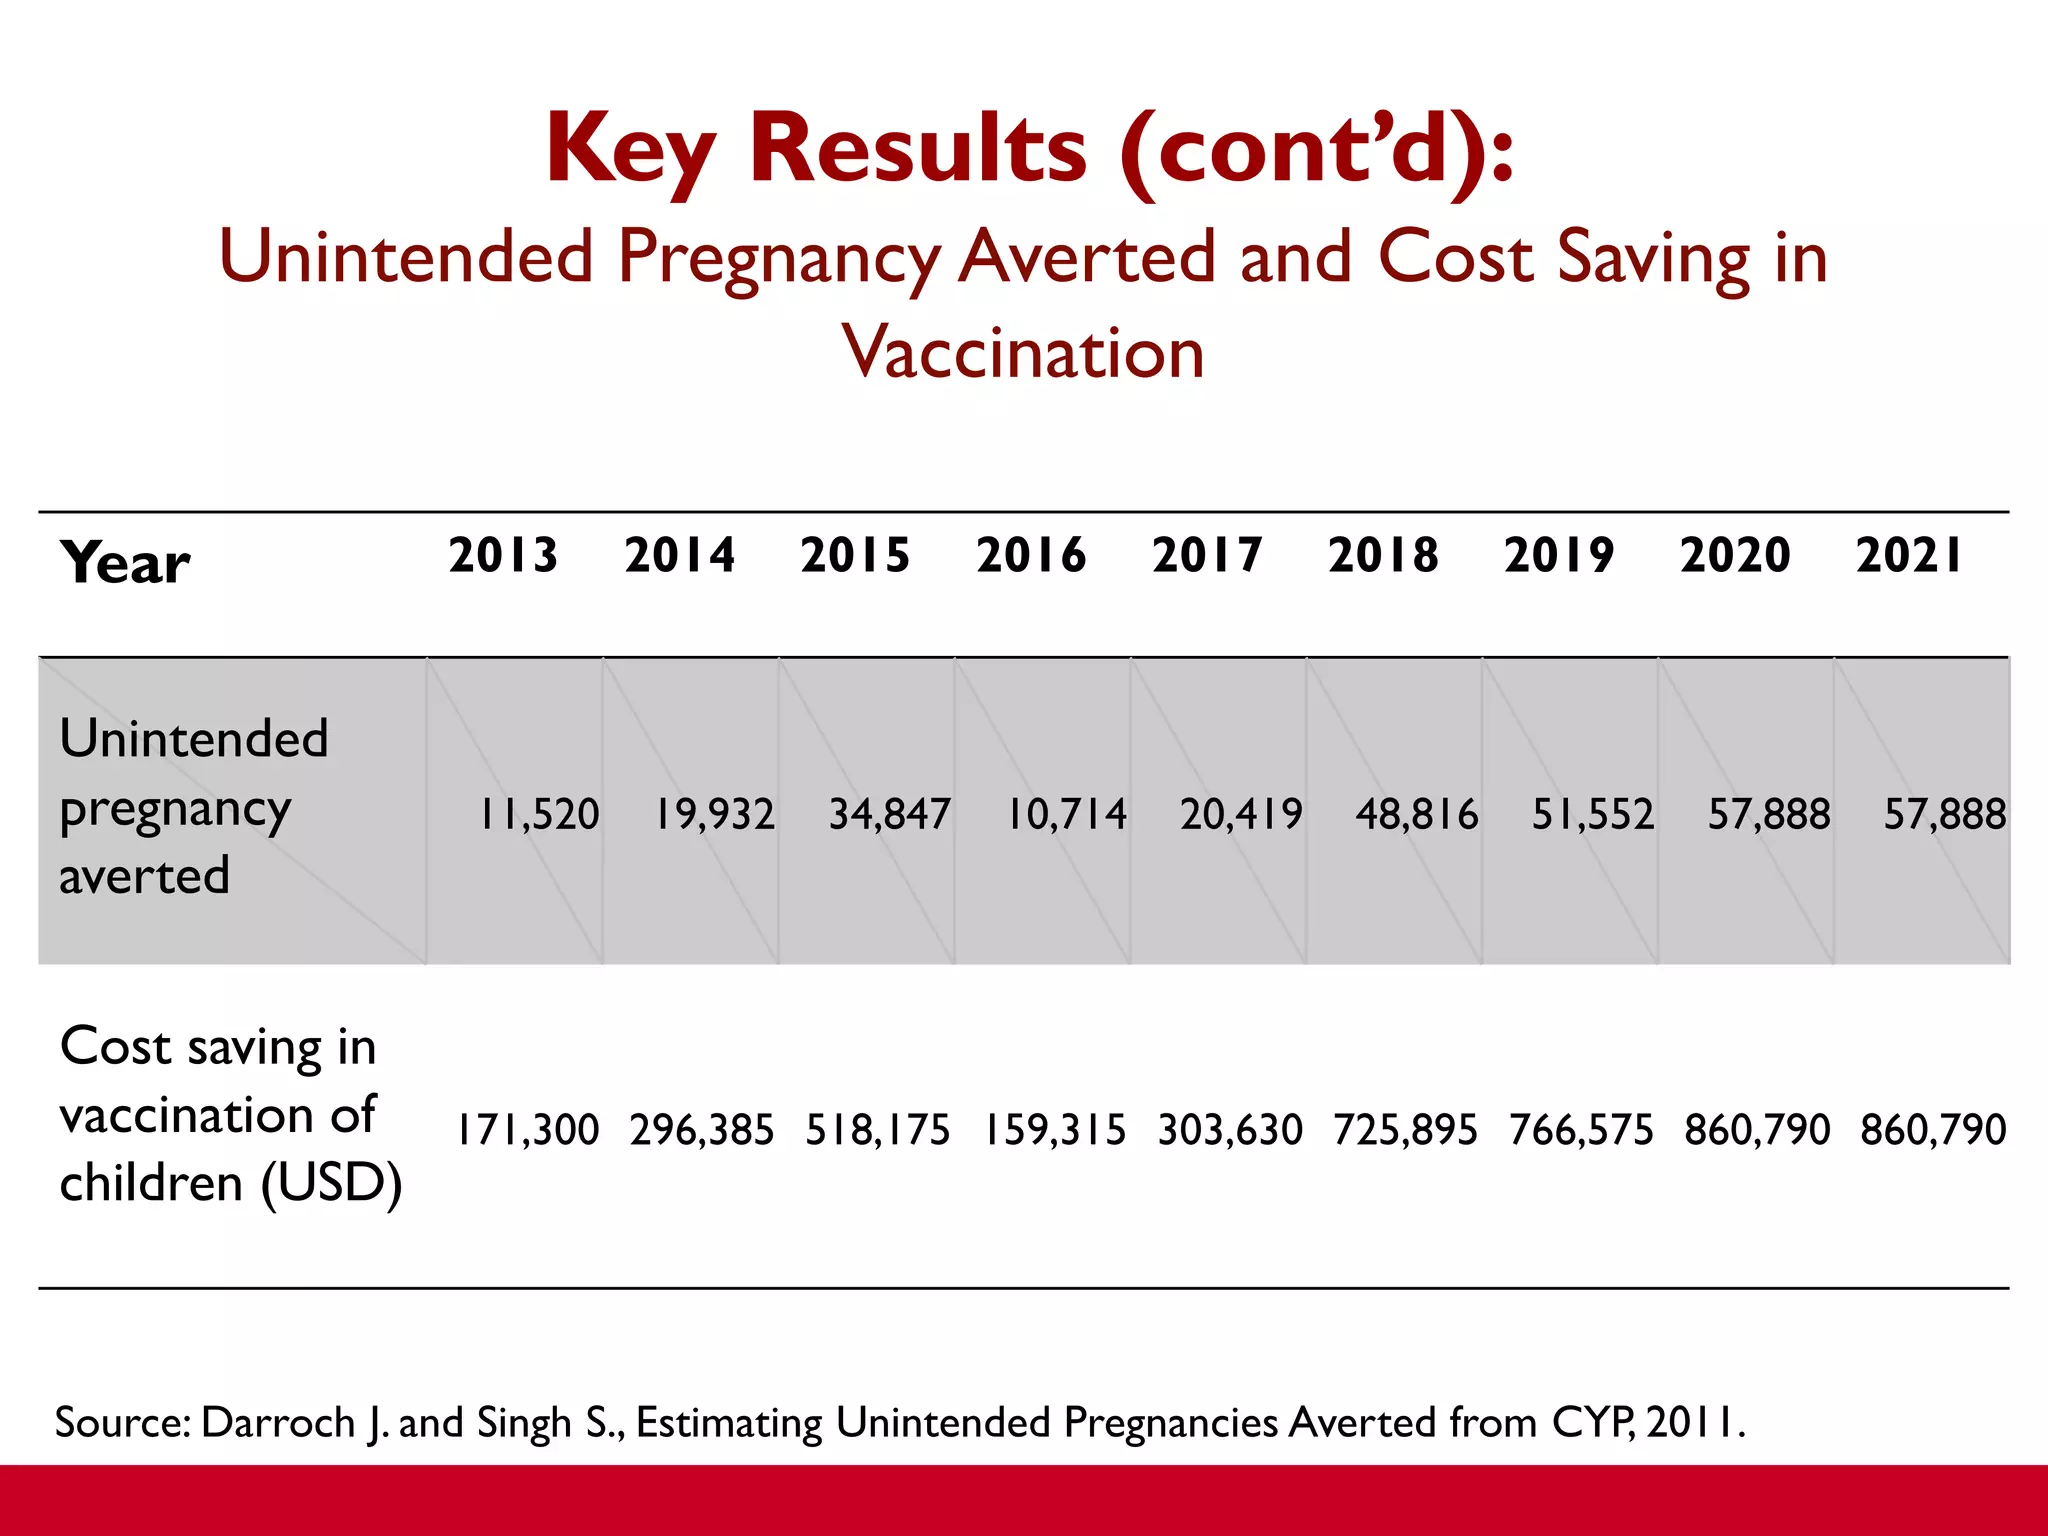

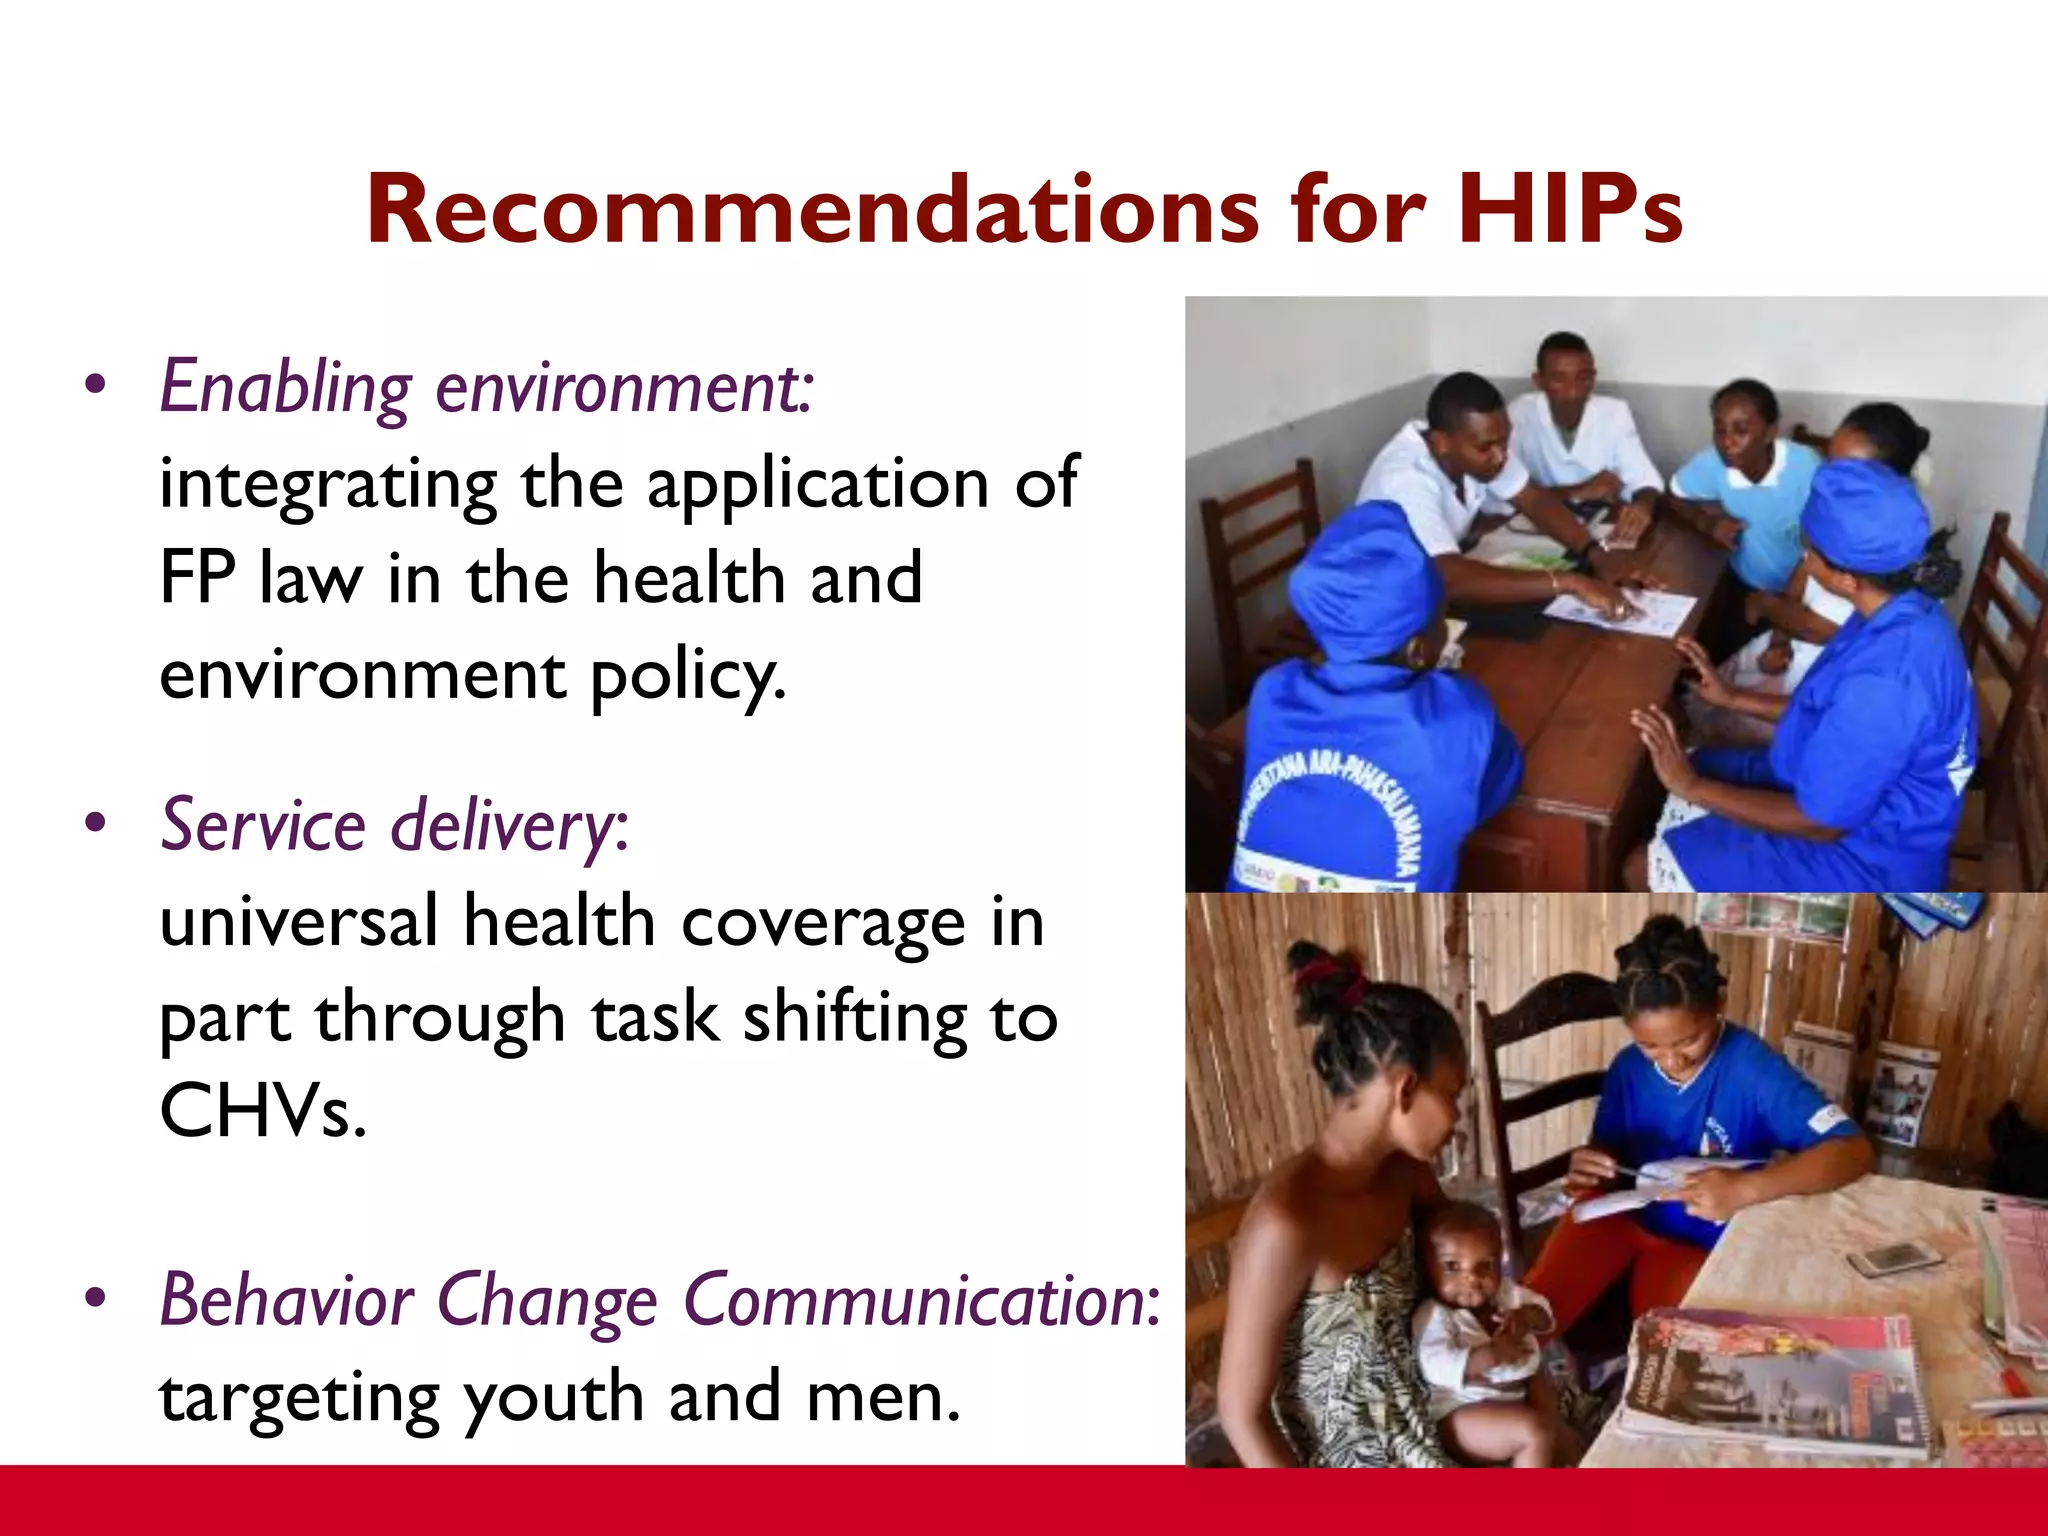

The USAID Community Capacity for Health Program (Mahafa Miara) aims to integrate family planning practices into population, health, and environment projects, reaching 4,885 villages and 6.1 million people in rural areas. Key findings highlight a significant increase in contraceptive prevalence and a reduction in unmet family planning needs, along with the establishment of community health volunteers (CHVs) trained in service delivery. Recommendations include ensuring an enabling environment for family planning laws and enhancing service delivery through community-level initiatives.


