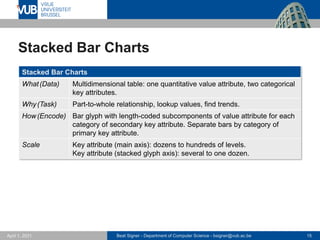
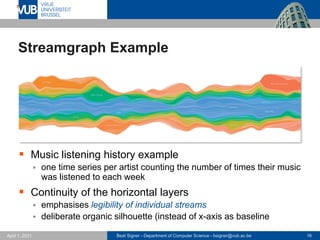
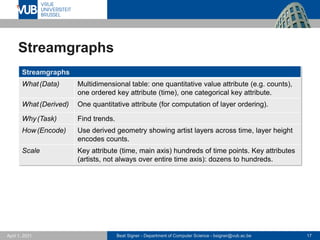
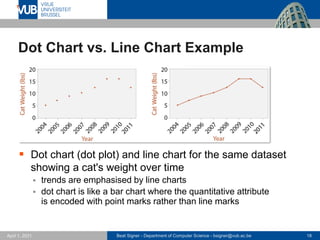
Download as PDF, PPTX


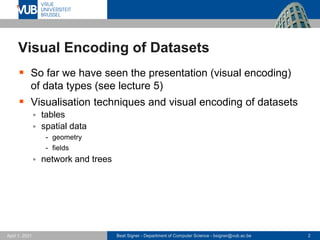
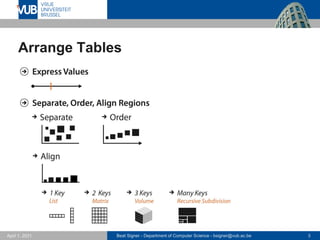
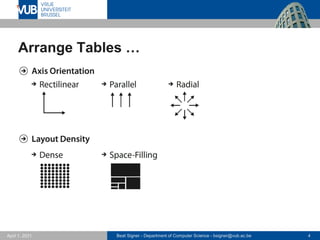


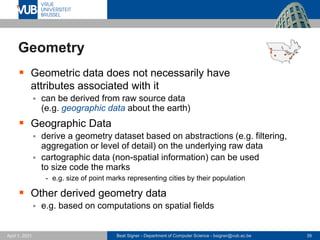

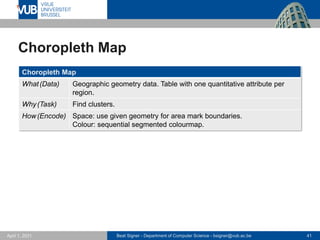


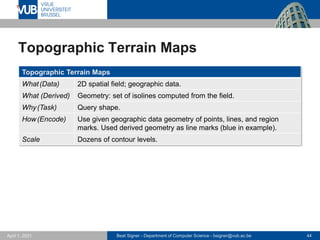
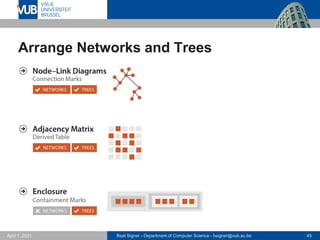


The document discusses various visual encoding techniques for datasets, emphasizing the importance of spatial position in conveying information effectively. It covers different visualization methods such as scatterplots, bar charts, heatmaps, and more, detailing their data types, purposes, and encoding strategies. The presentation also highlights the principles of visual design, emphasizing expressiveness, alignment, and the optimal use of spatial layouts.