Download to read offline

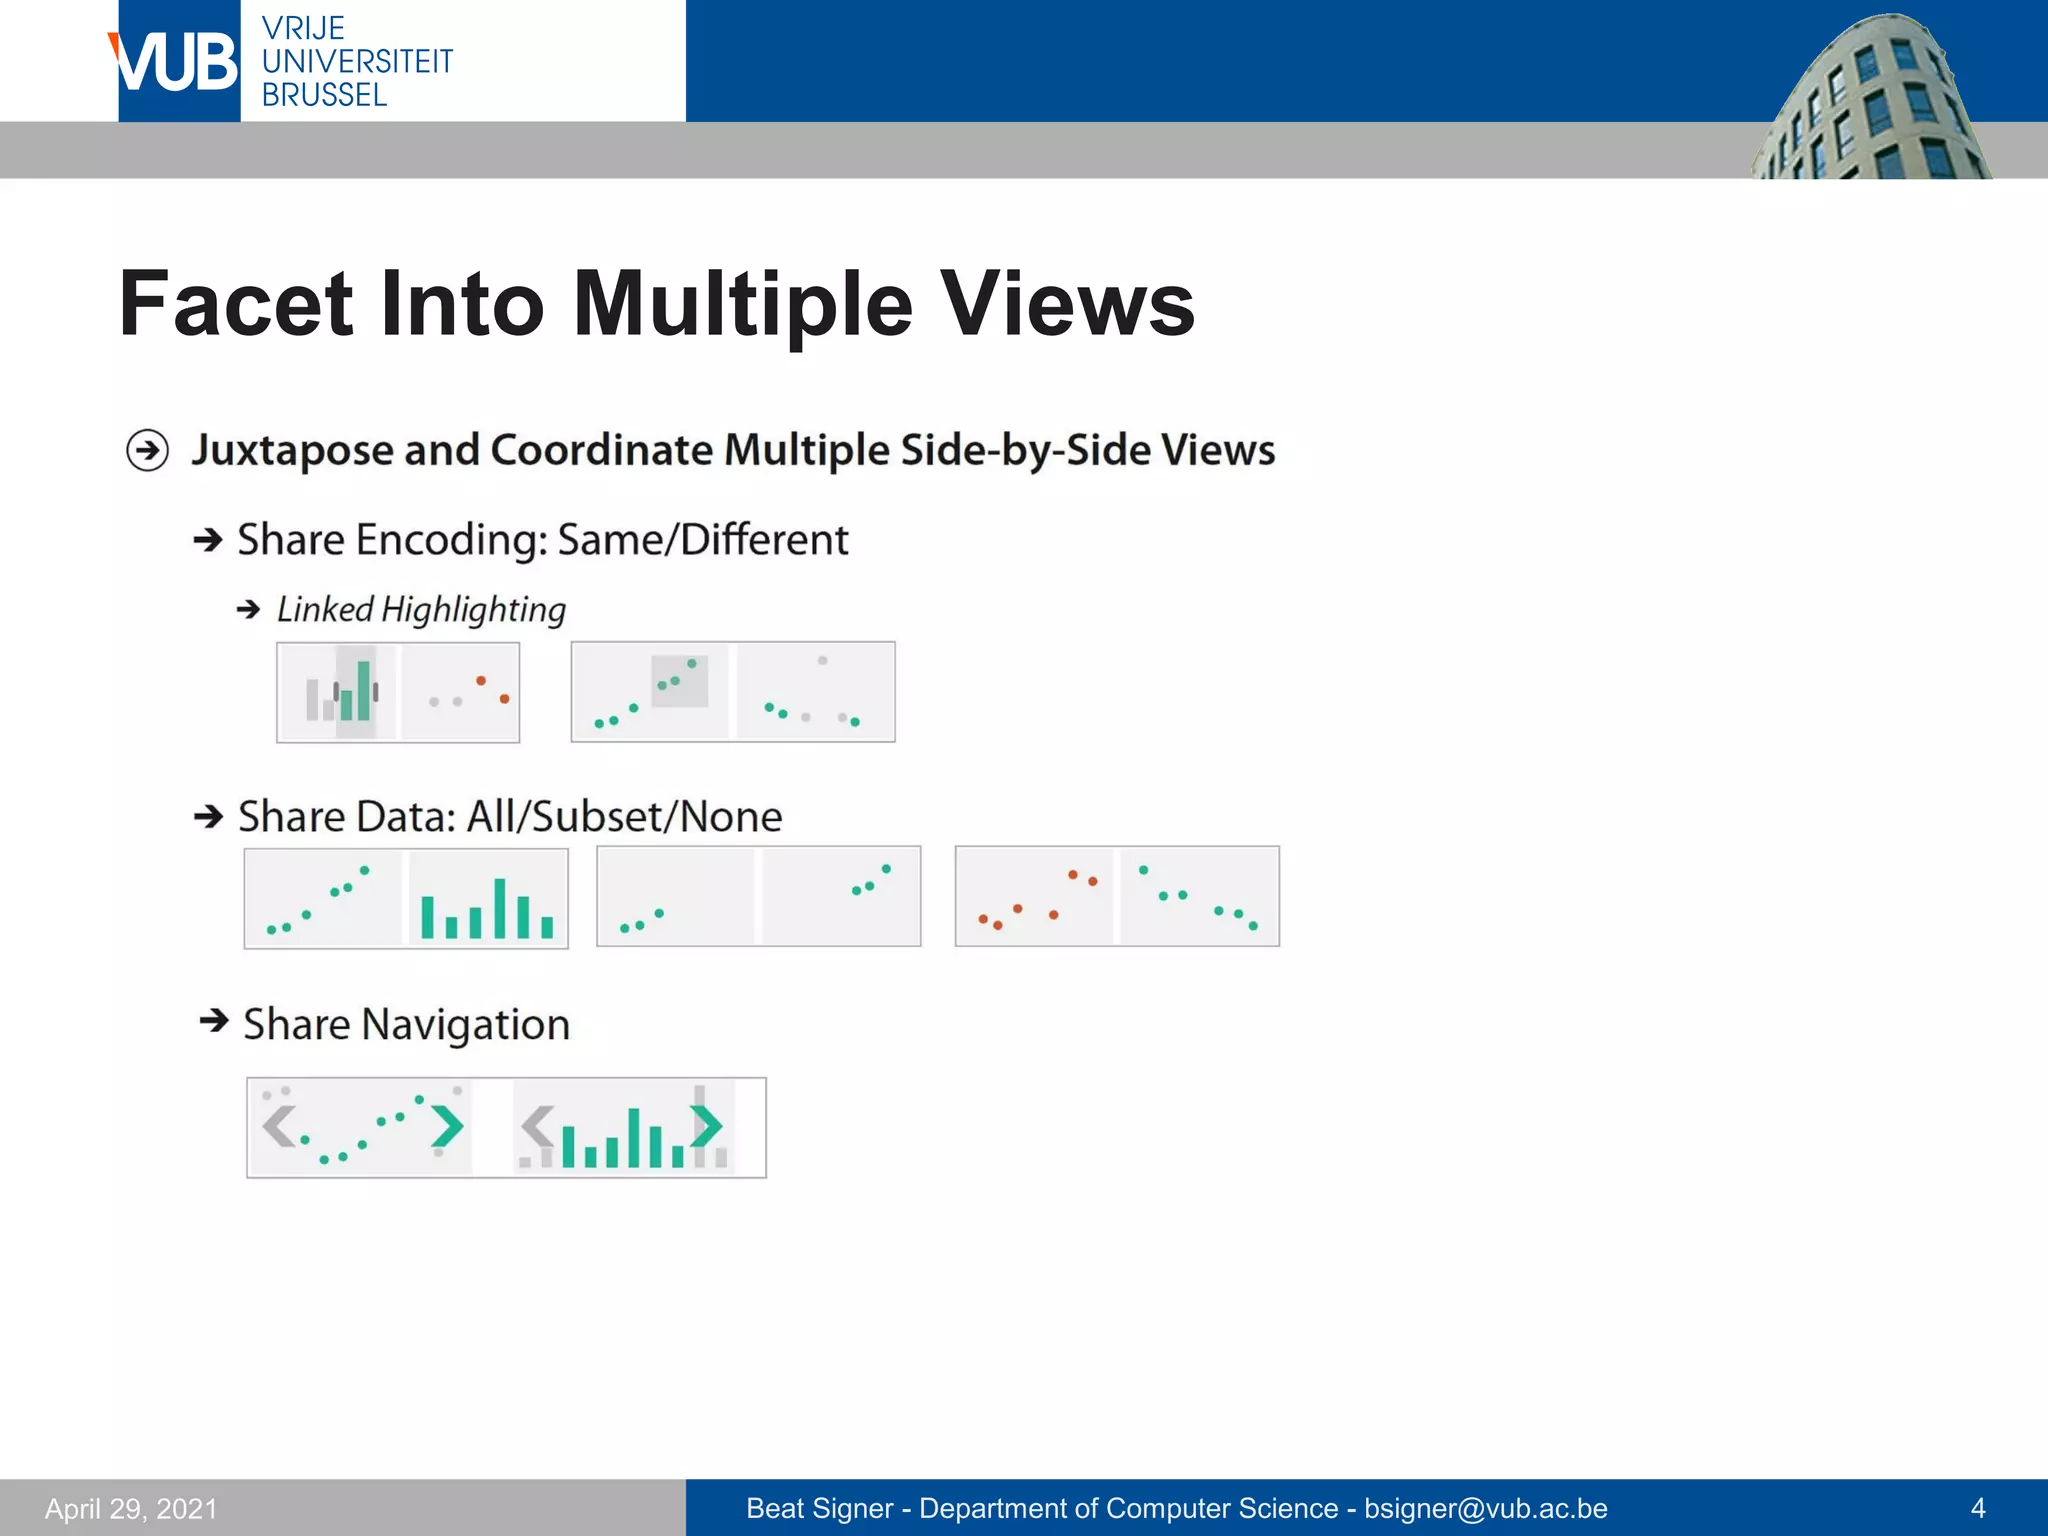
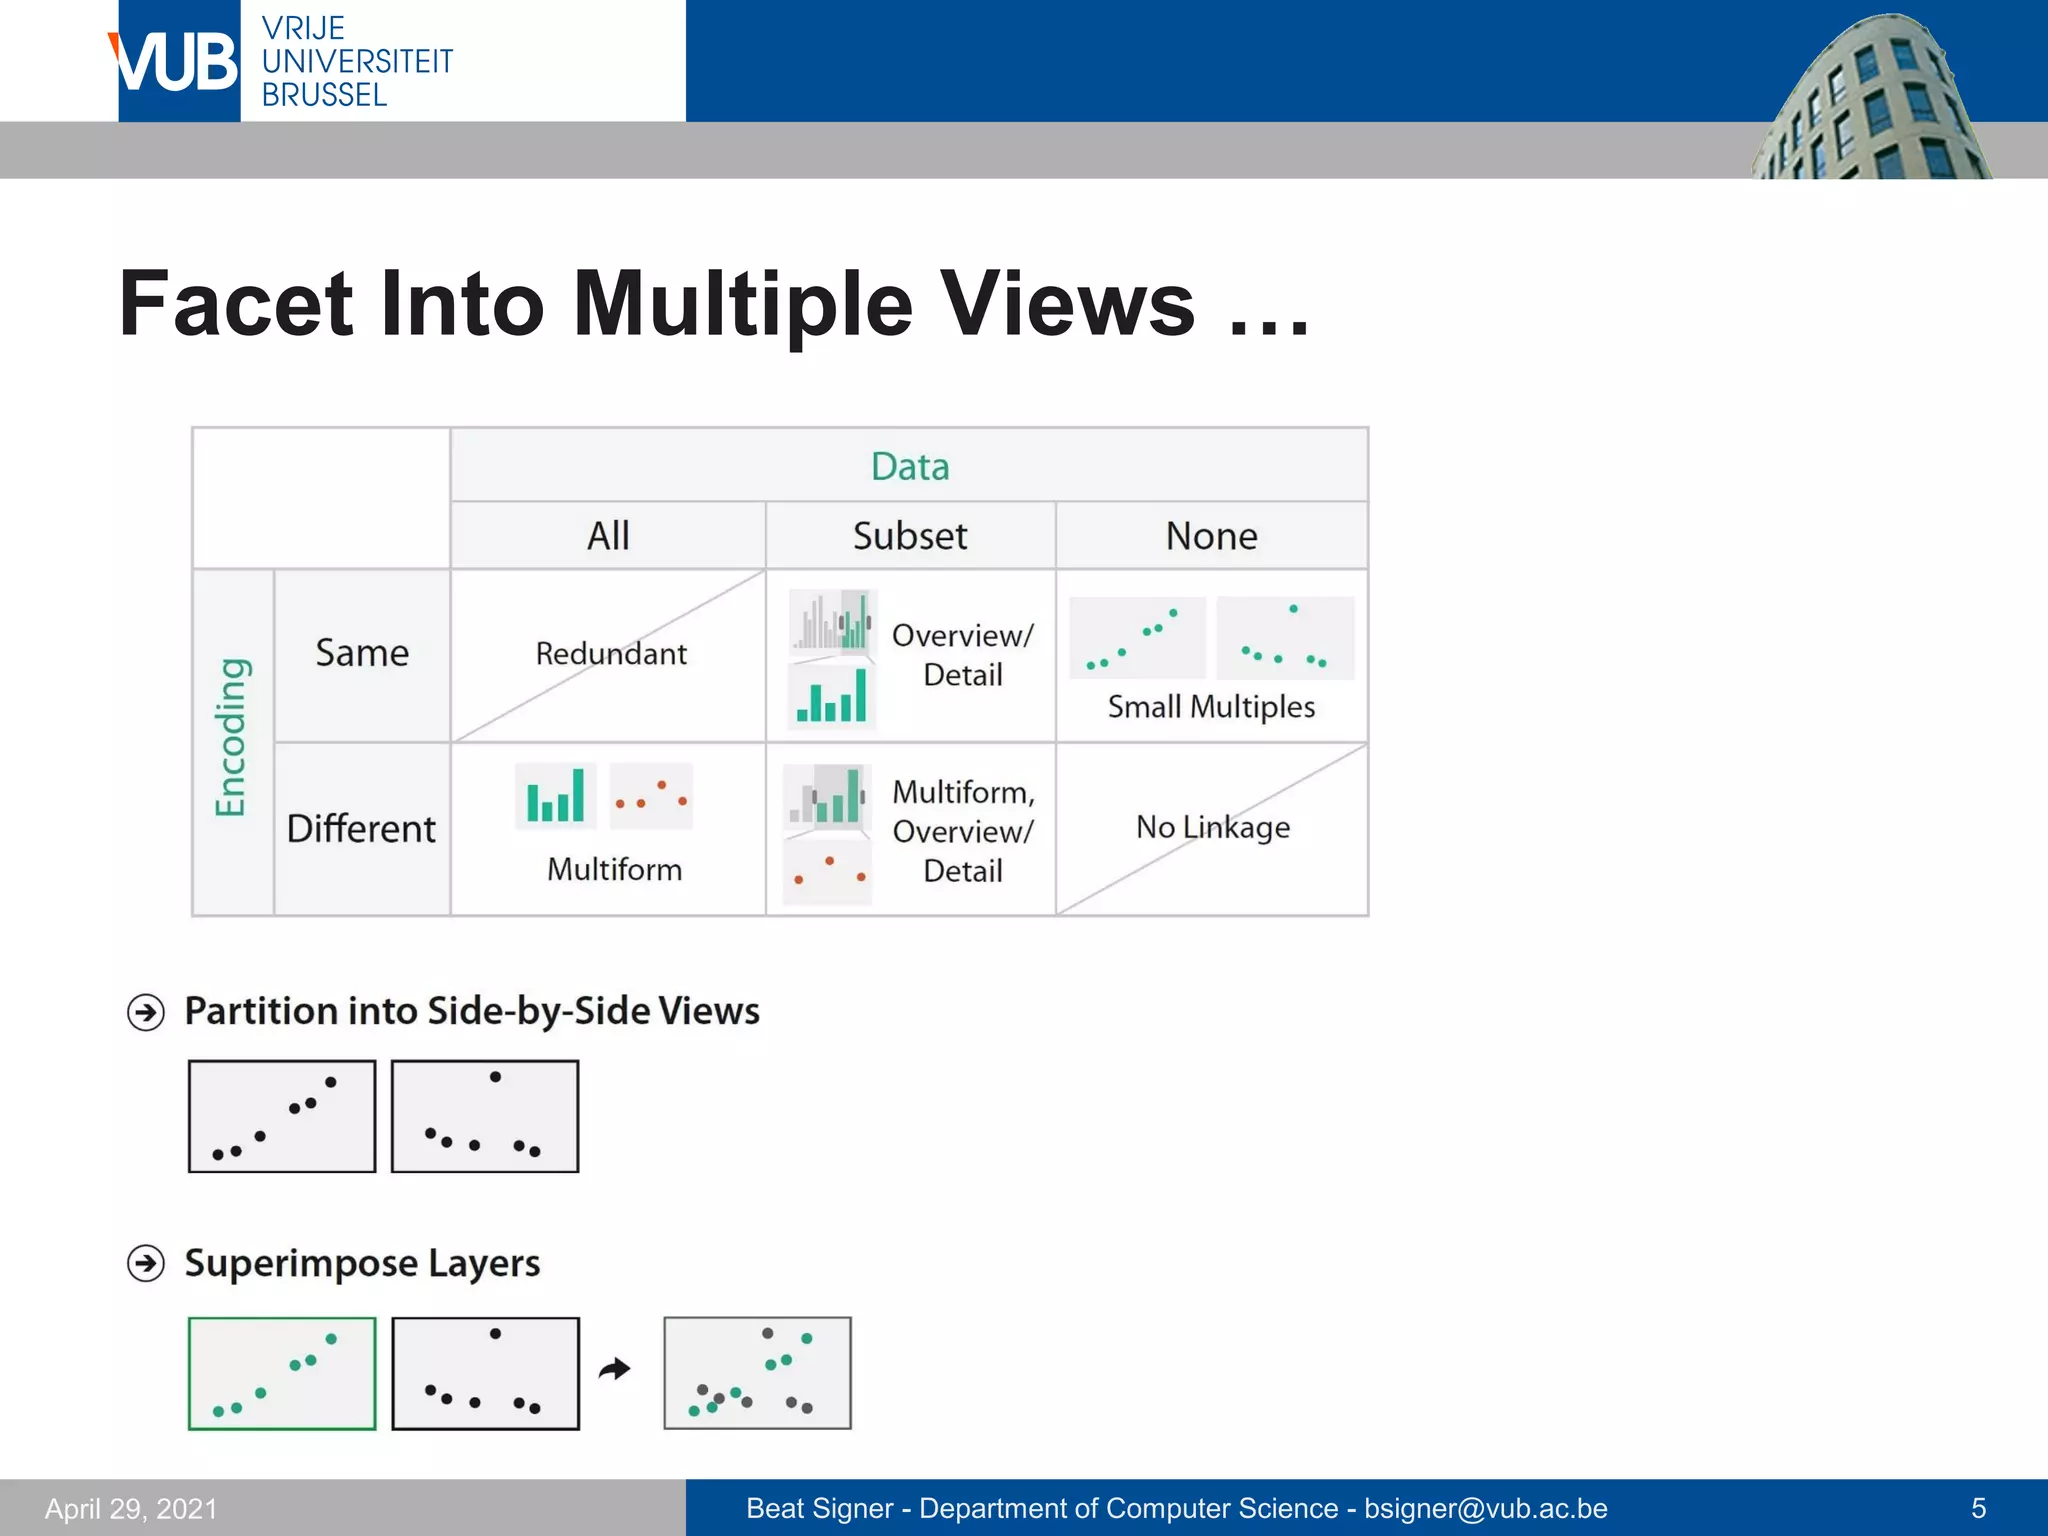
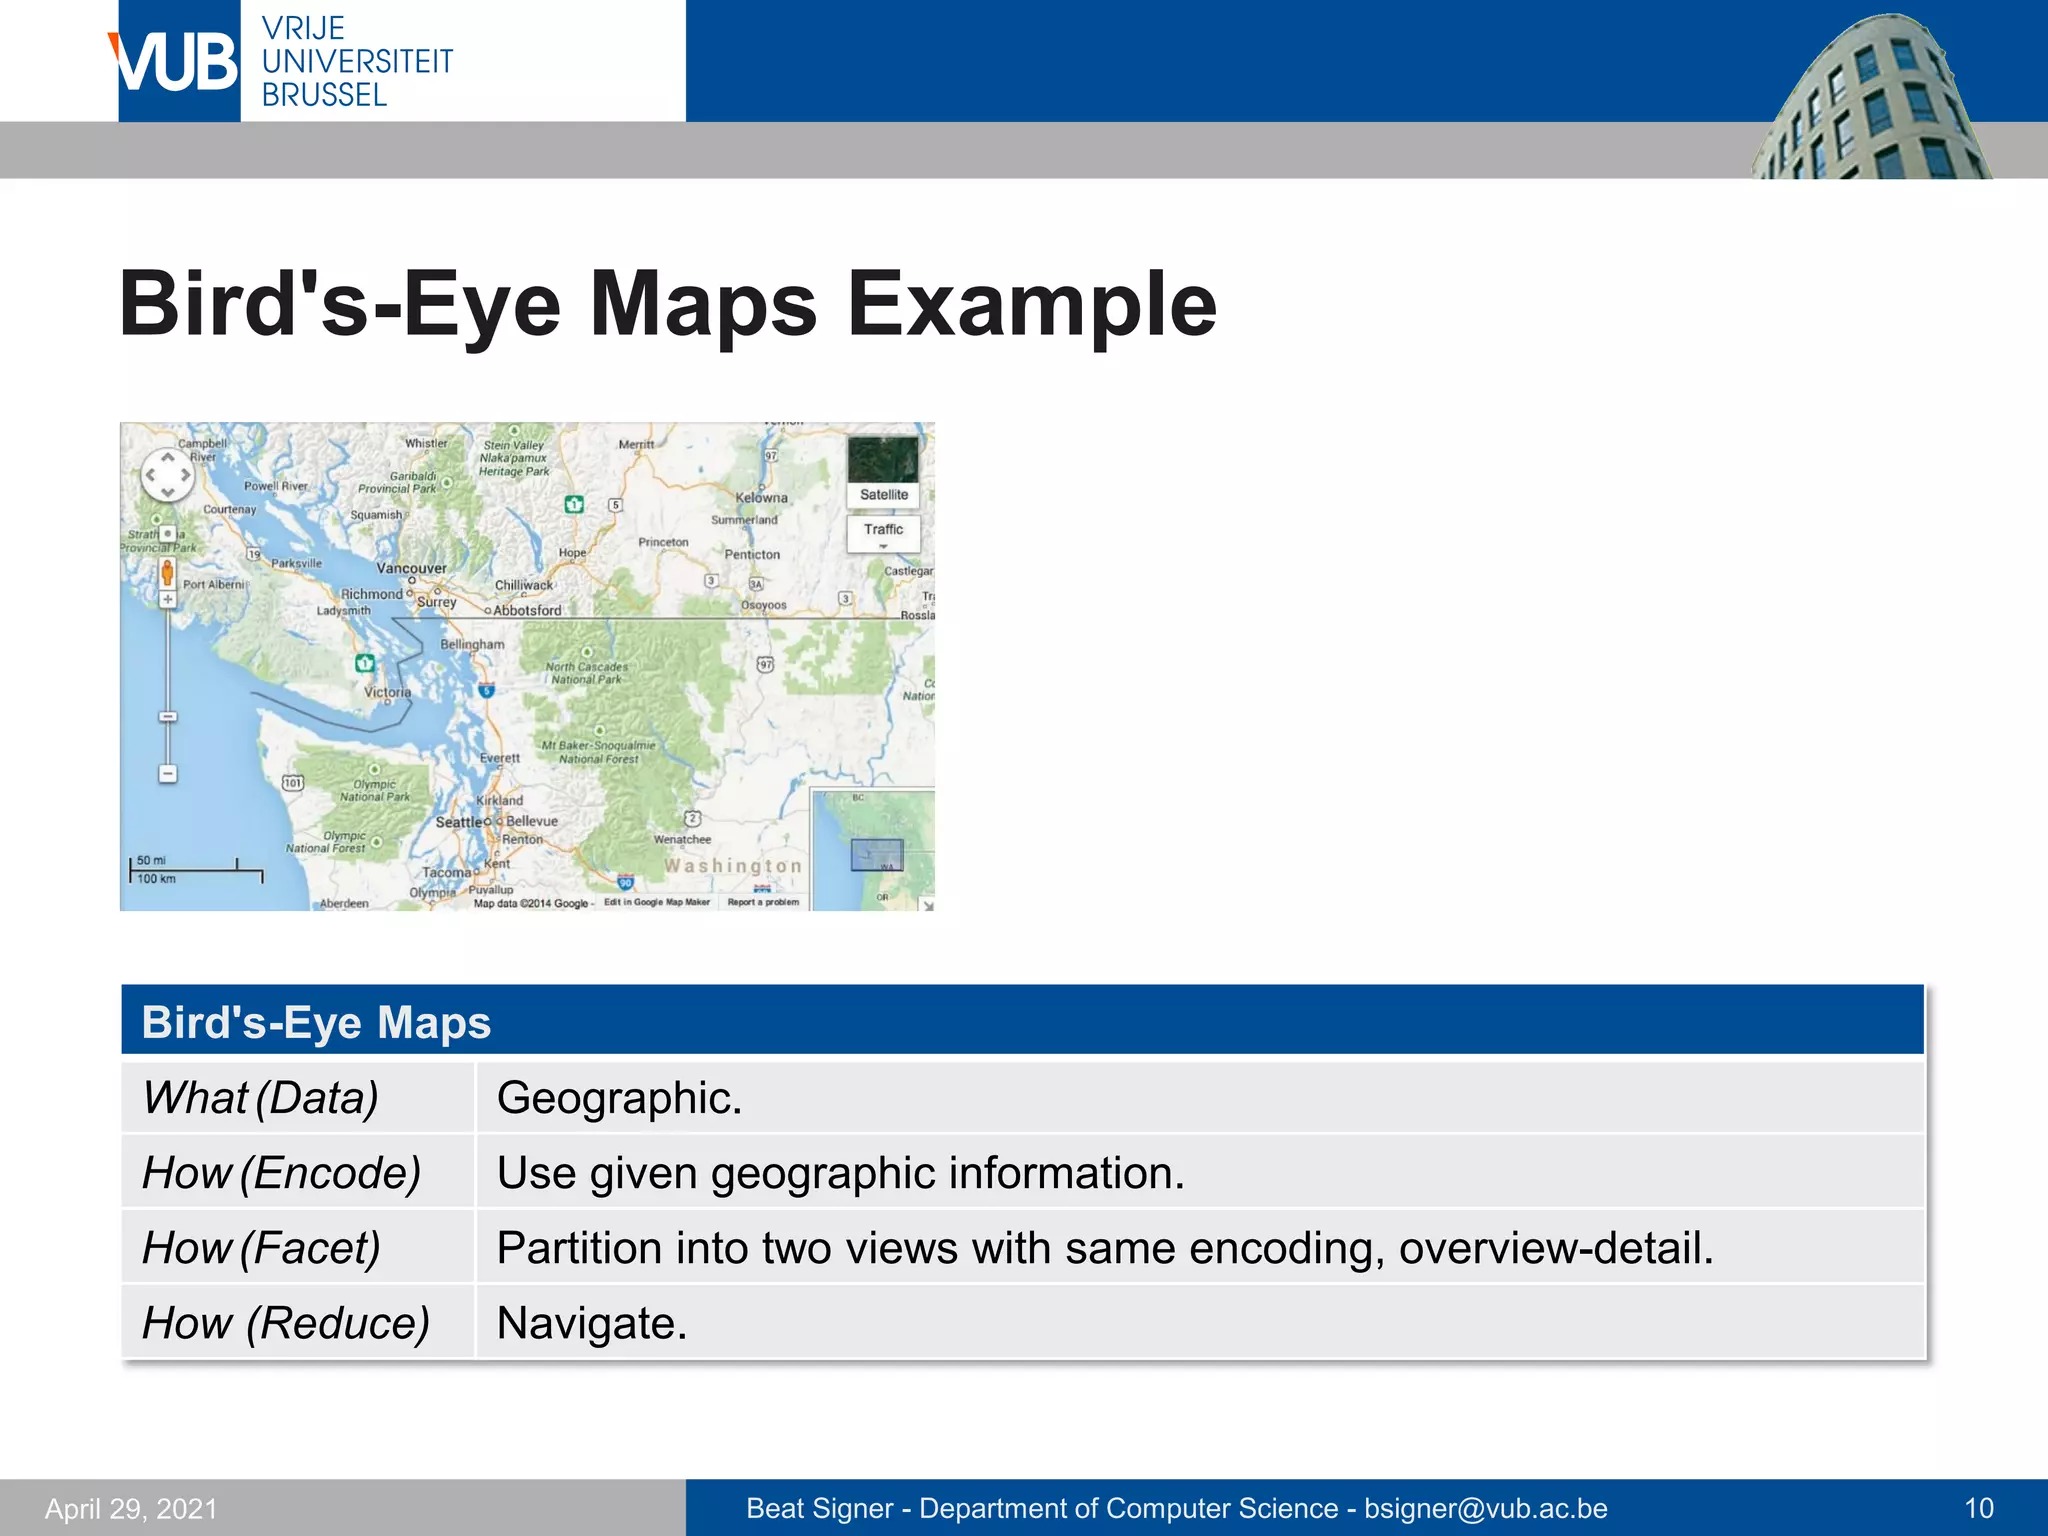
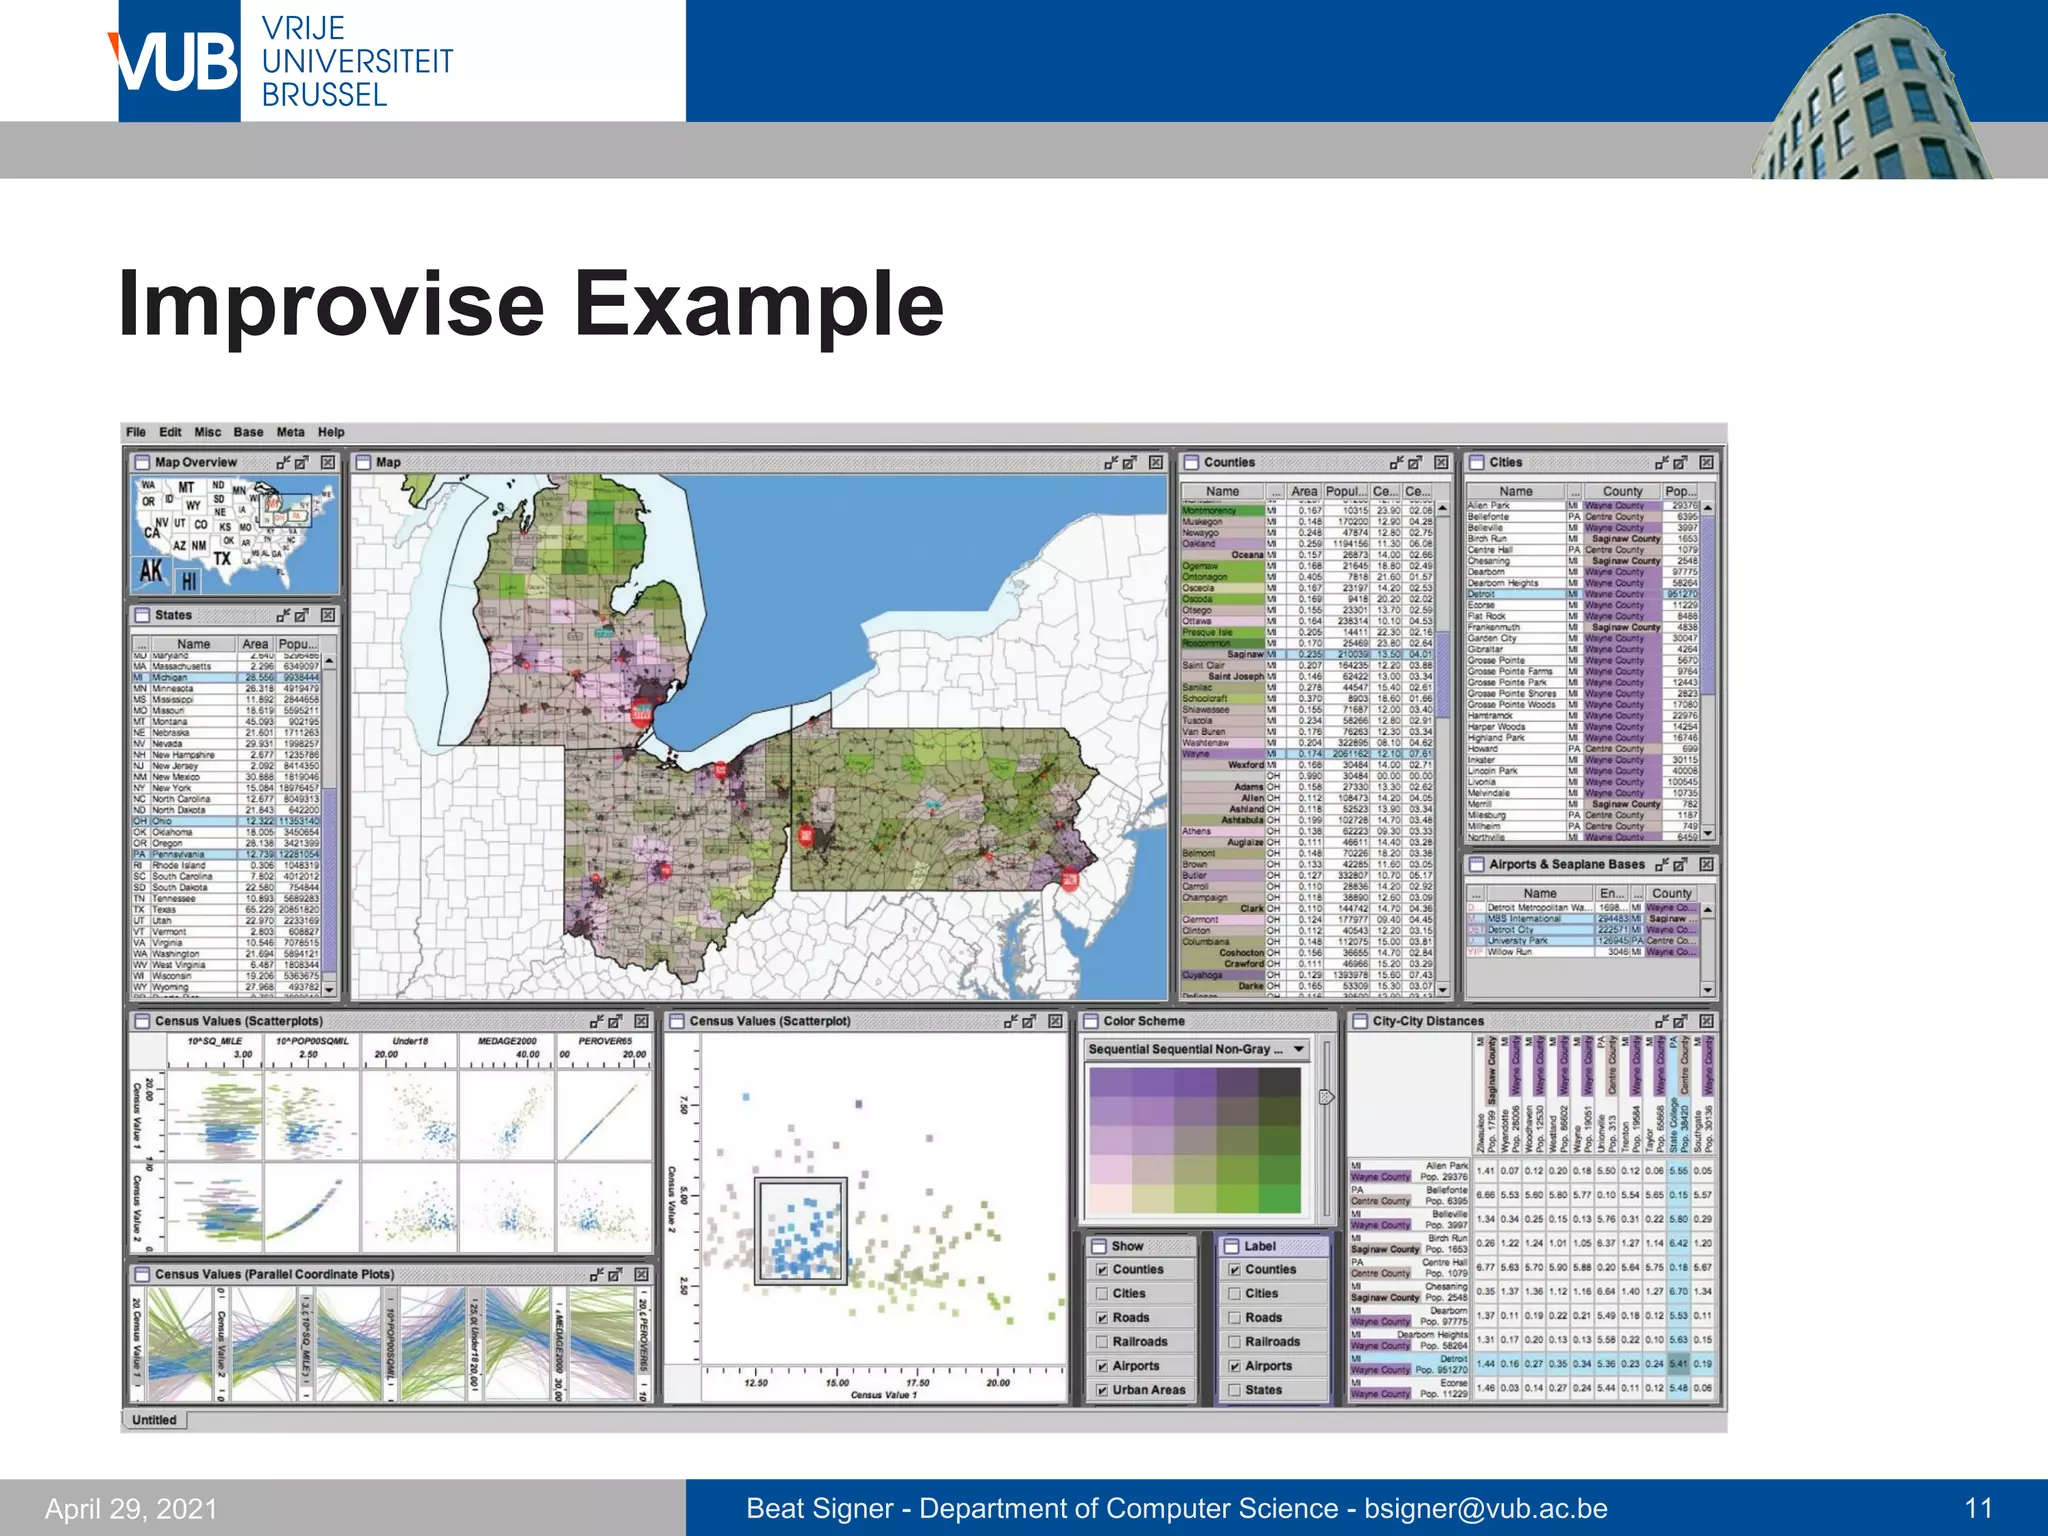
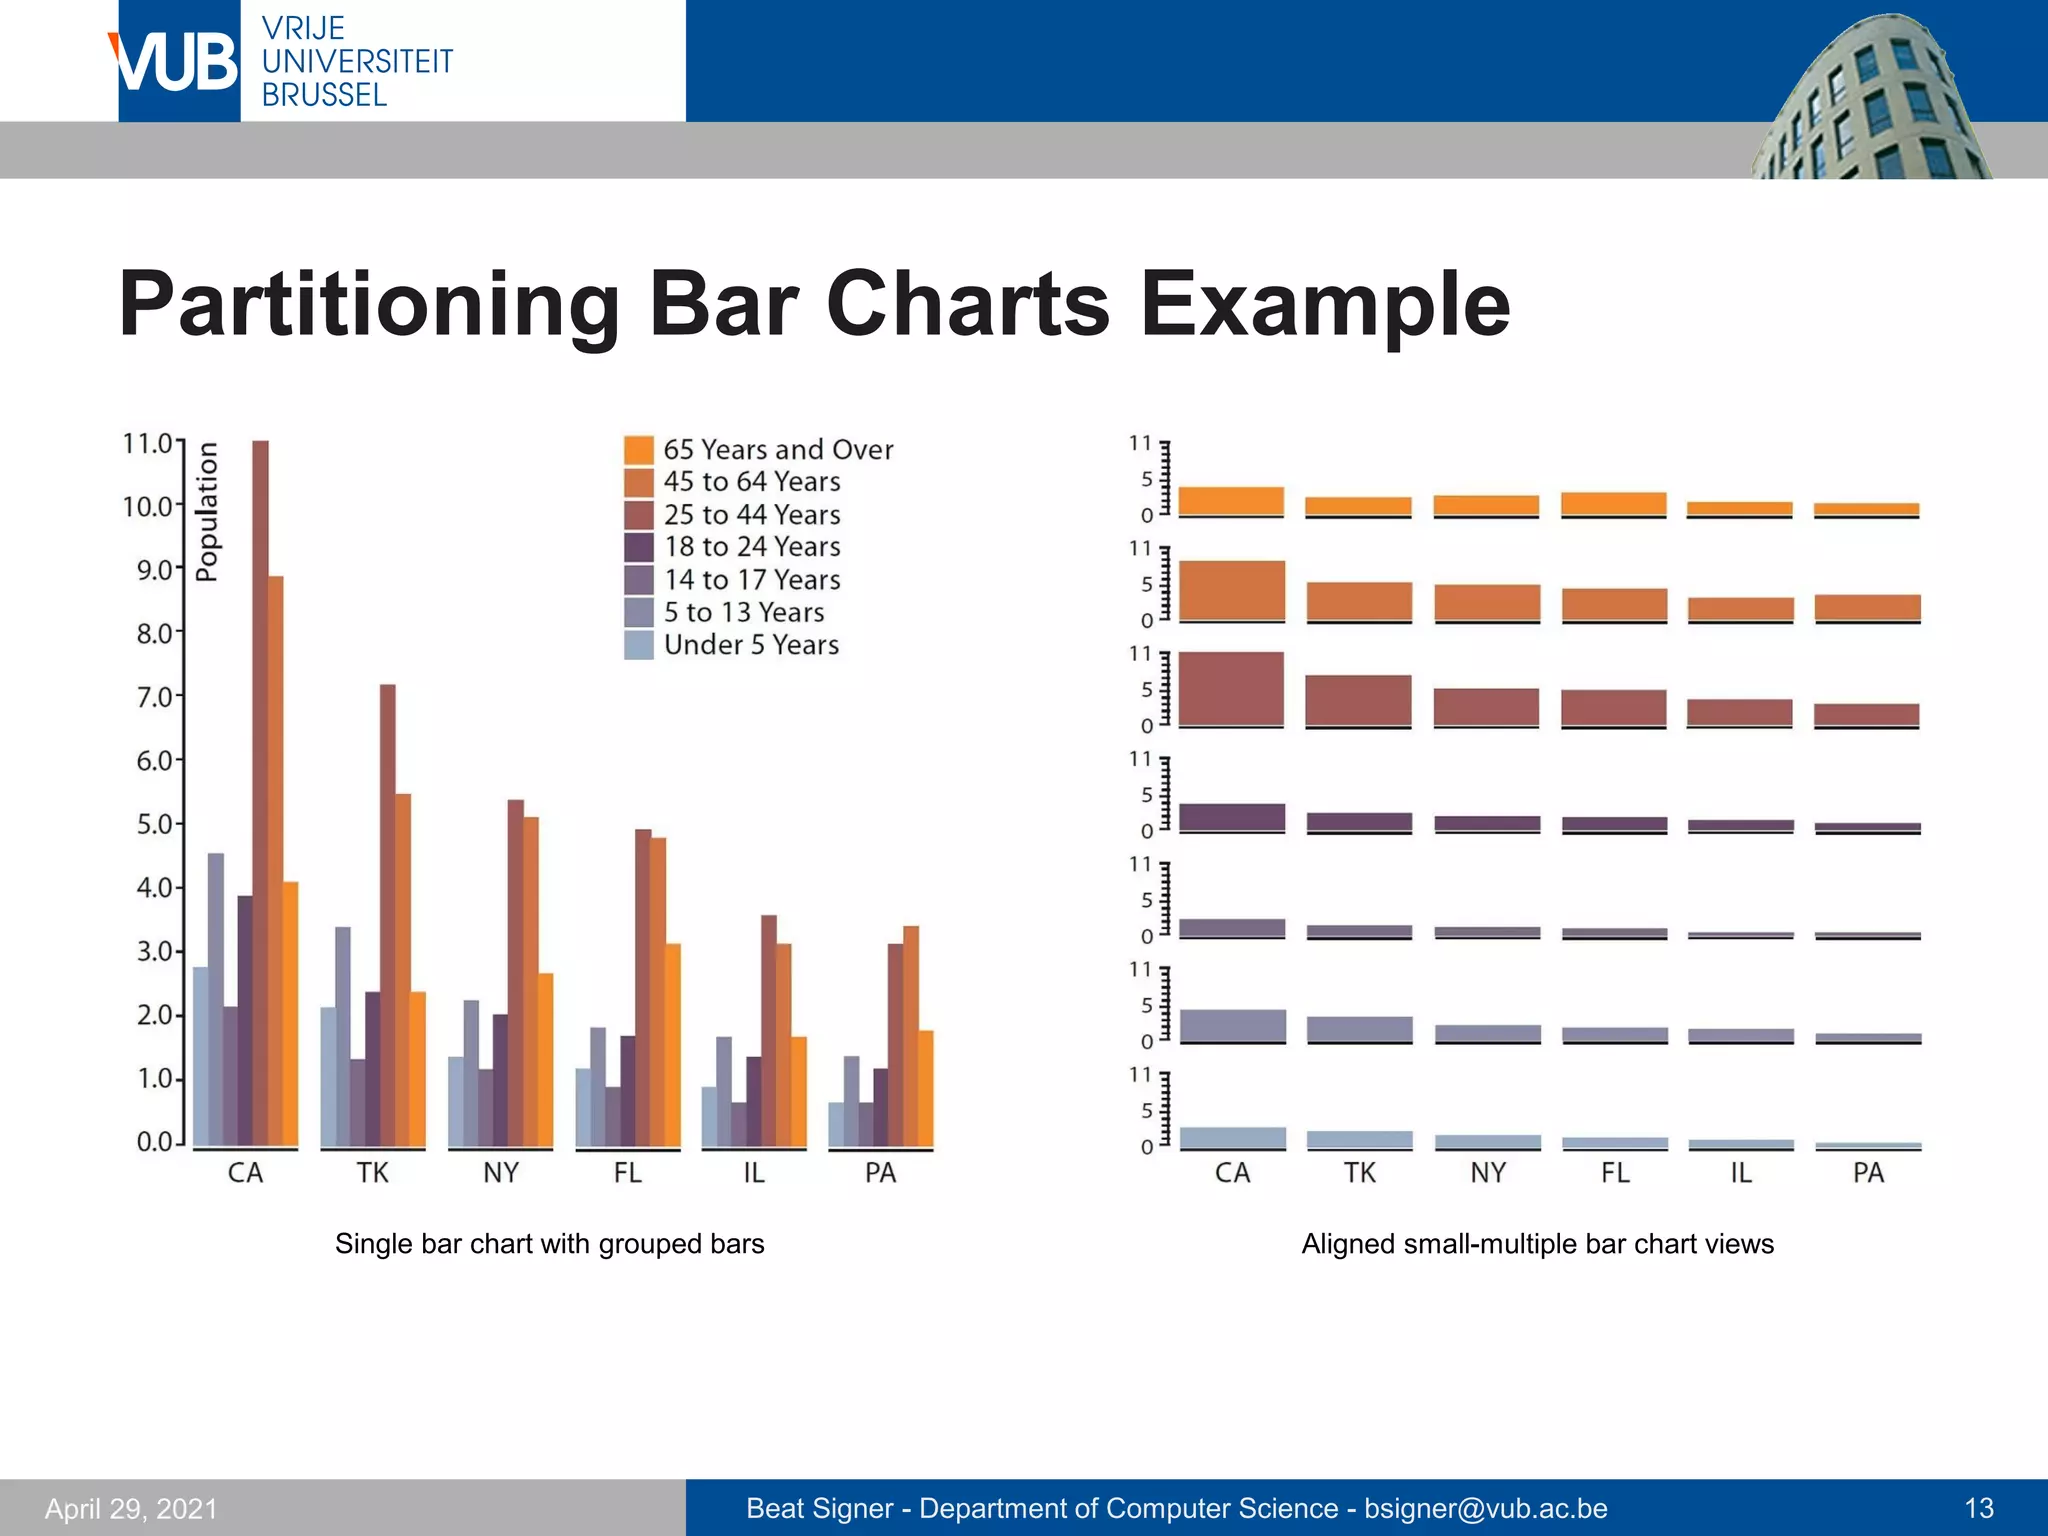
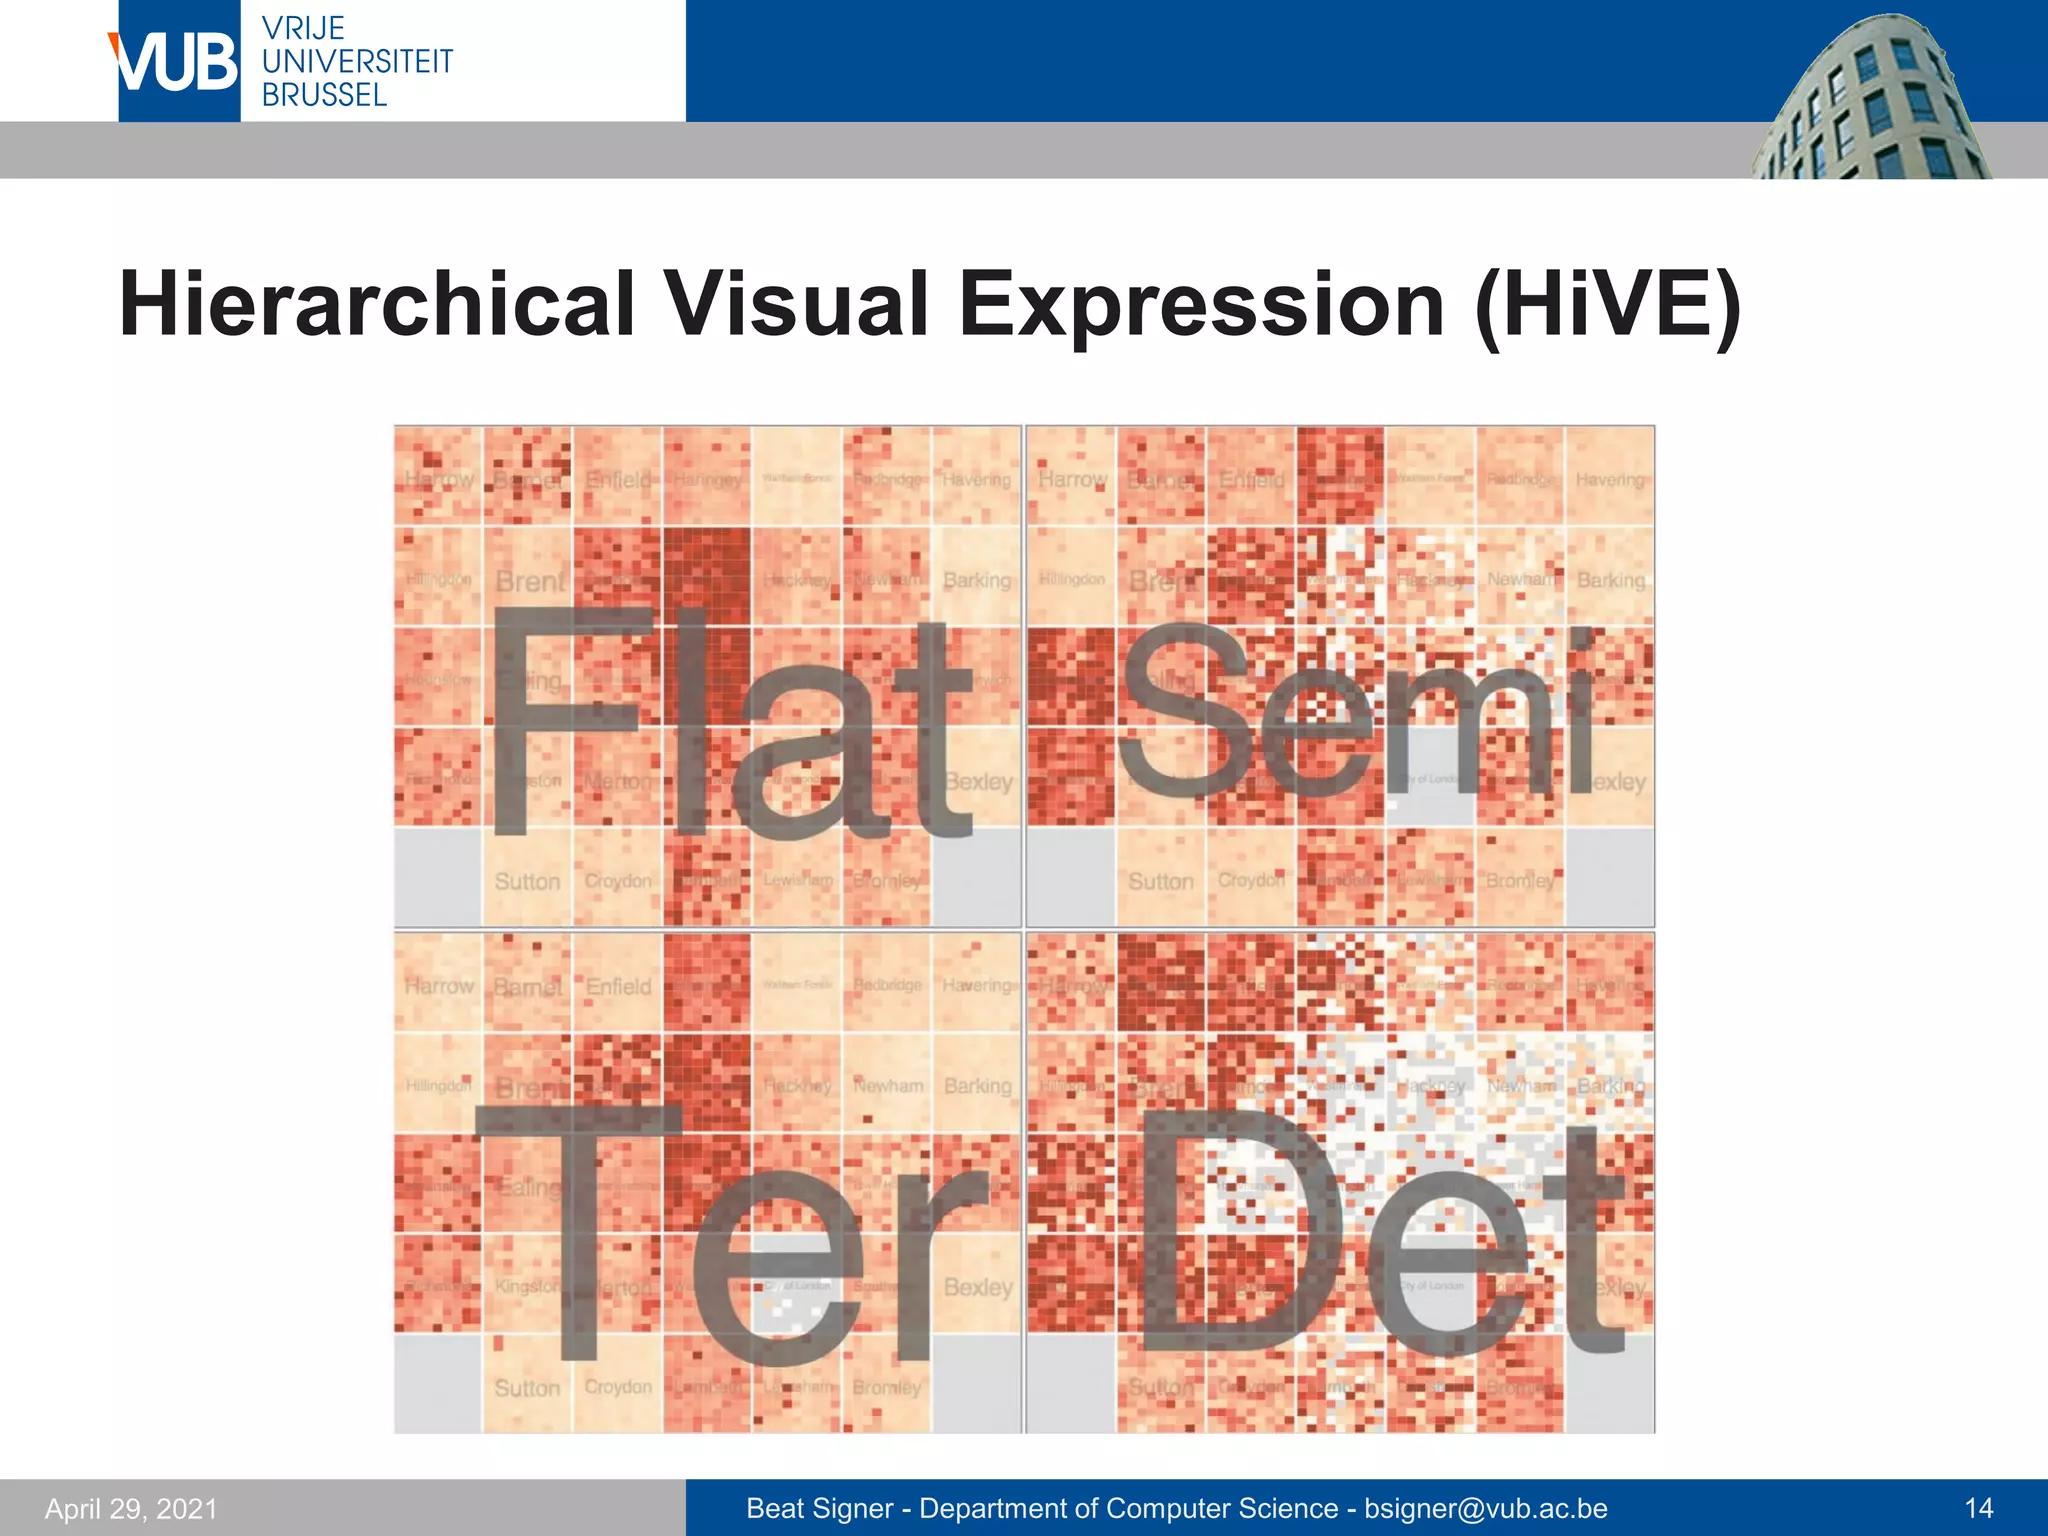
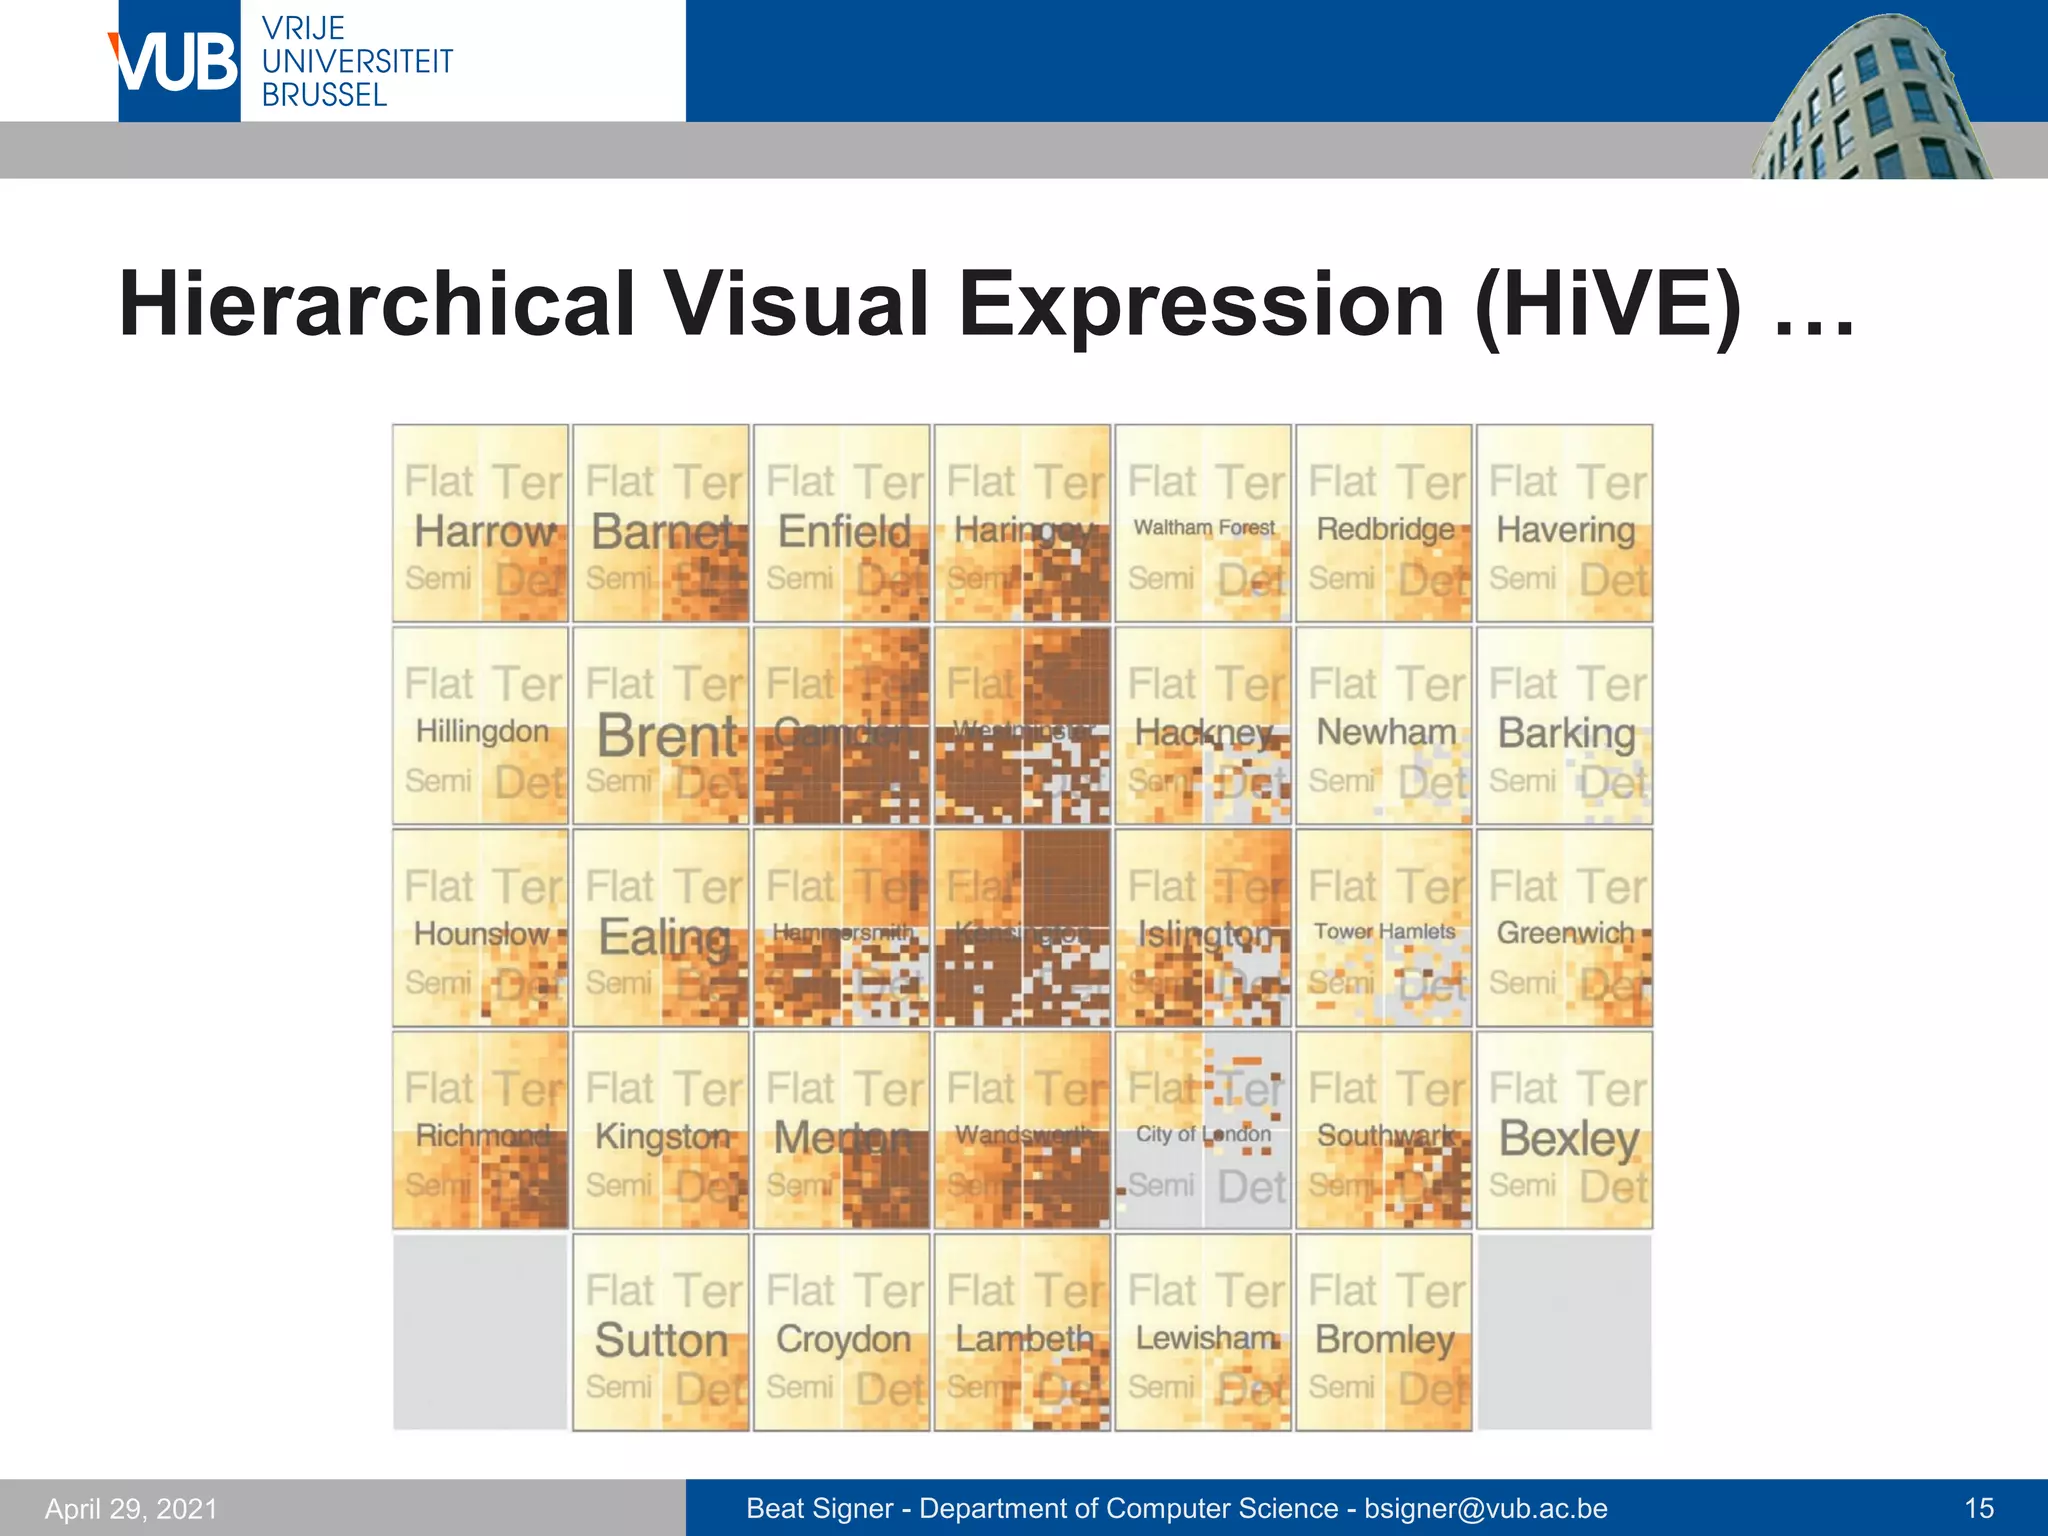
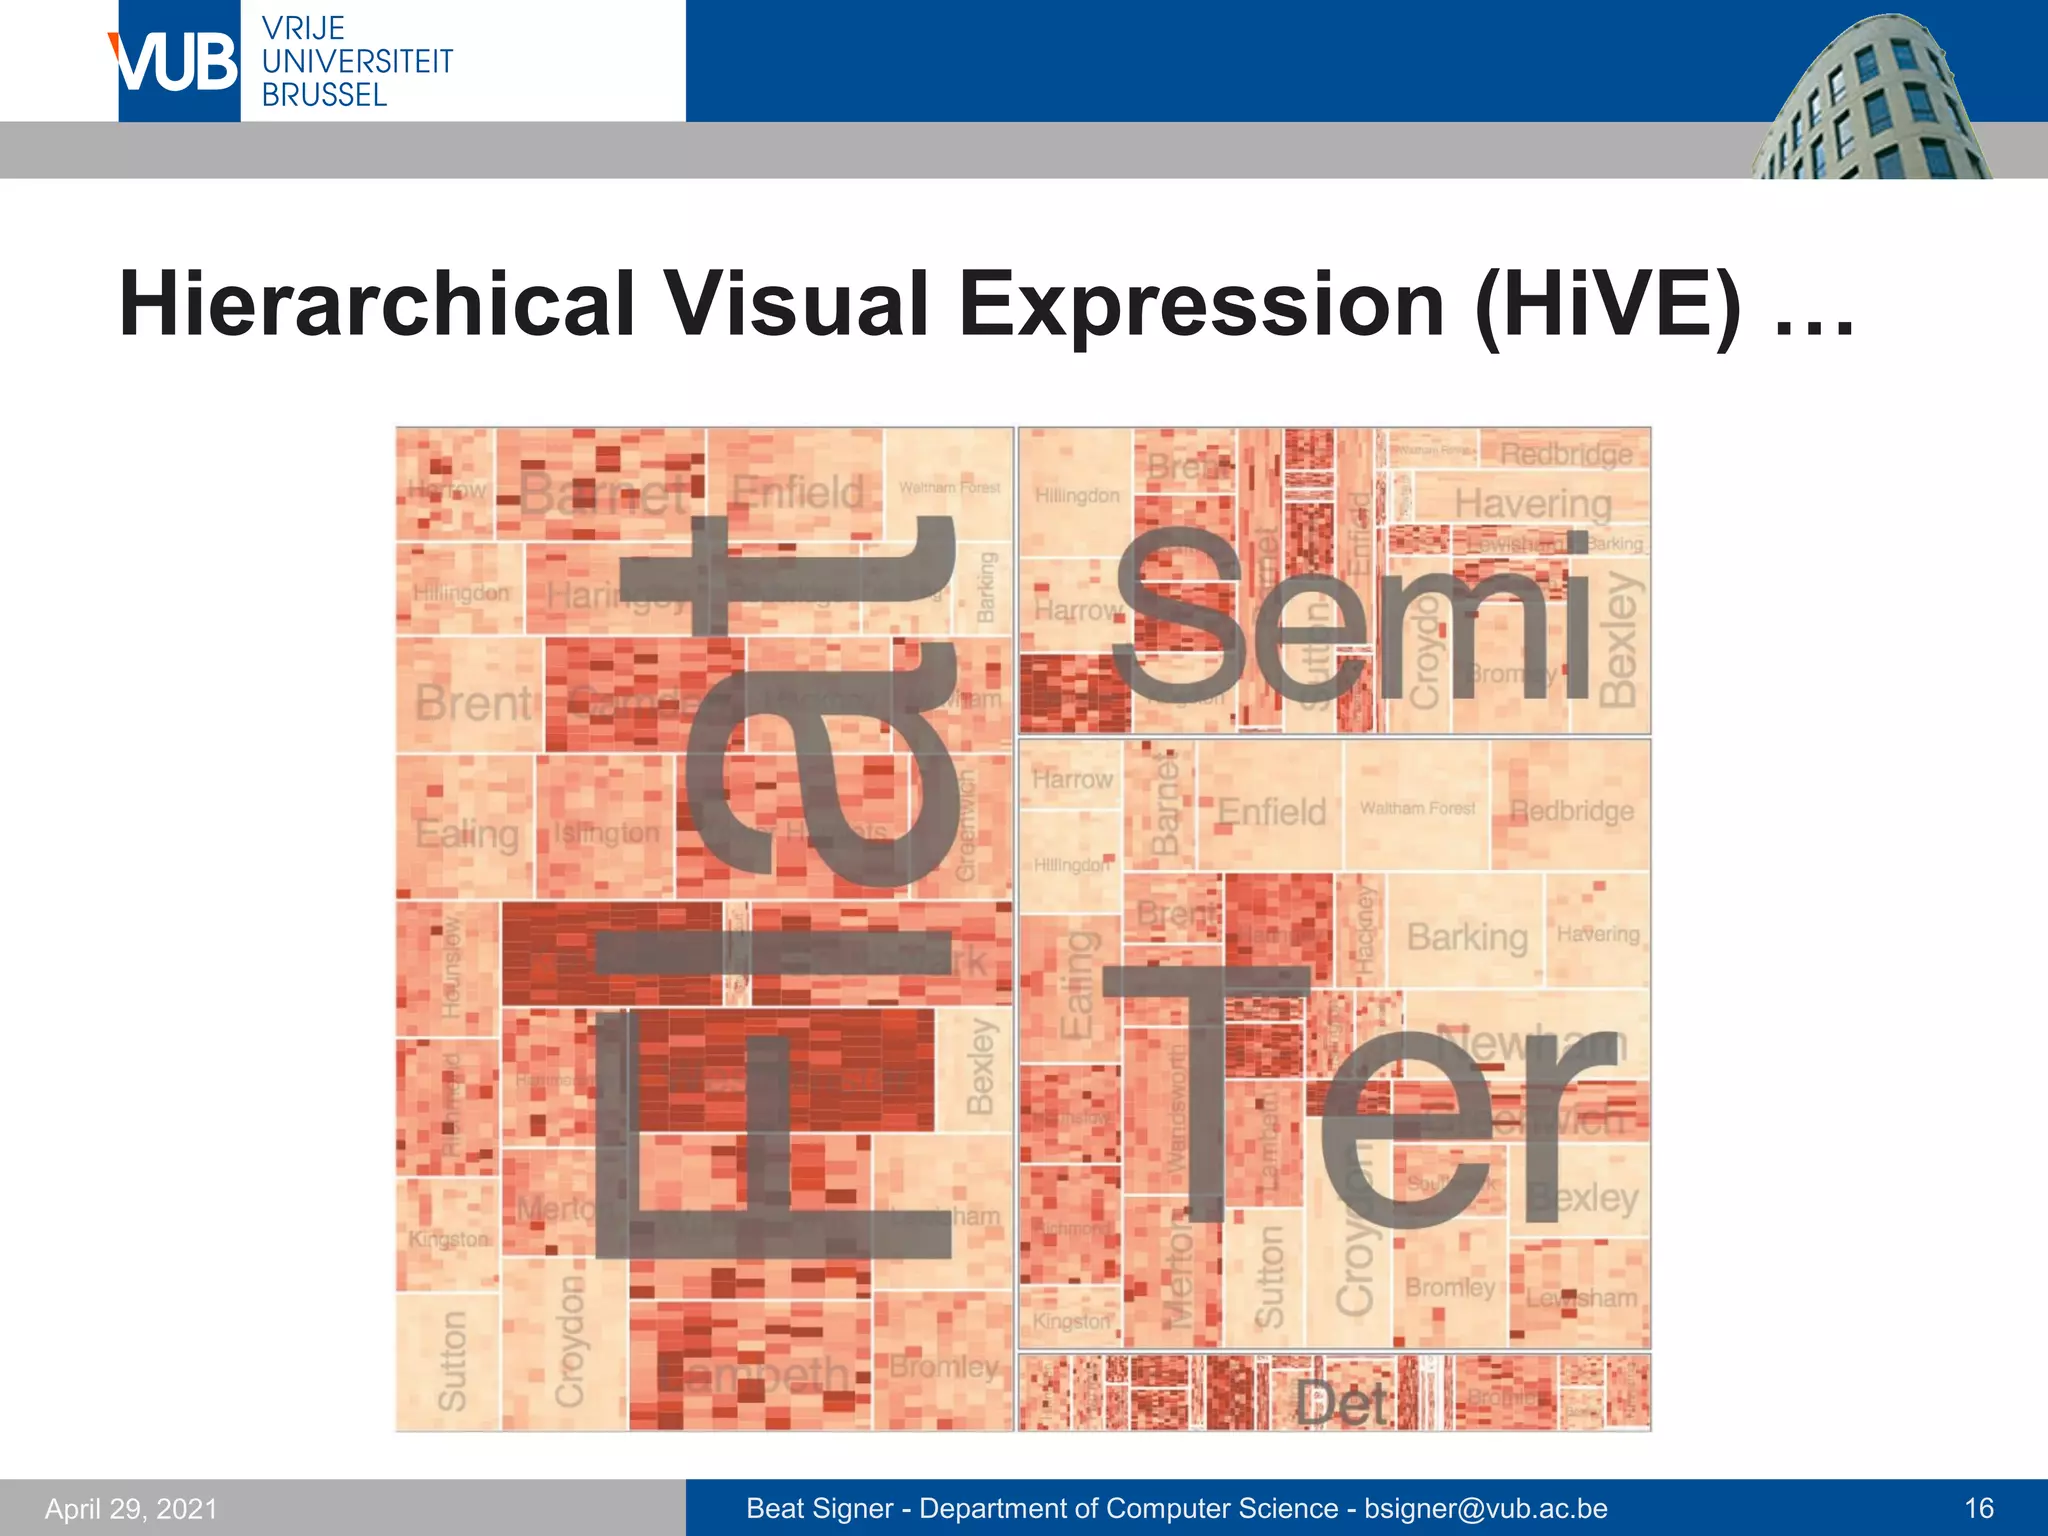
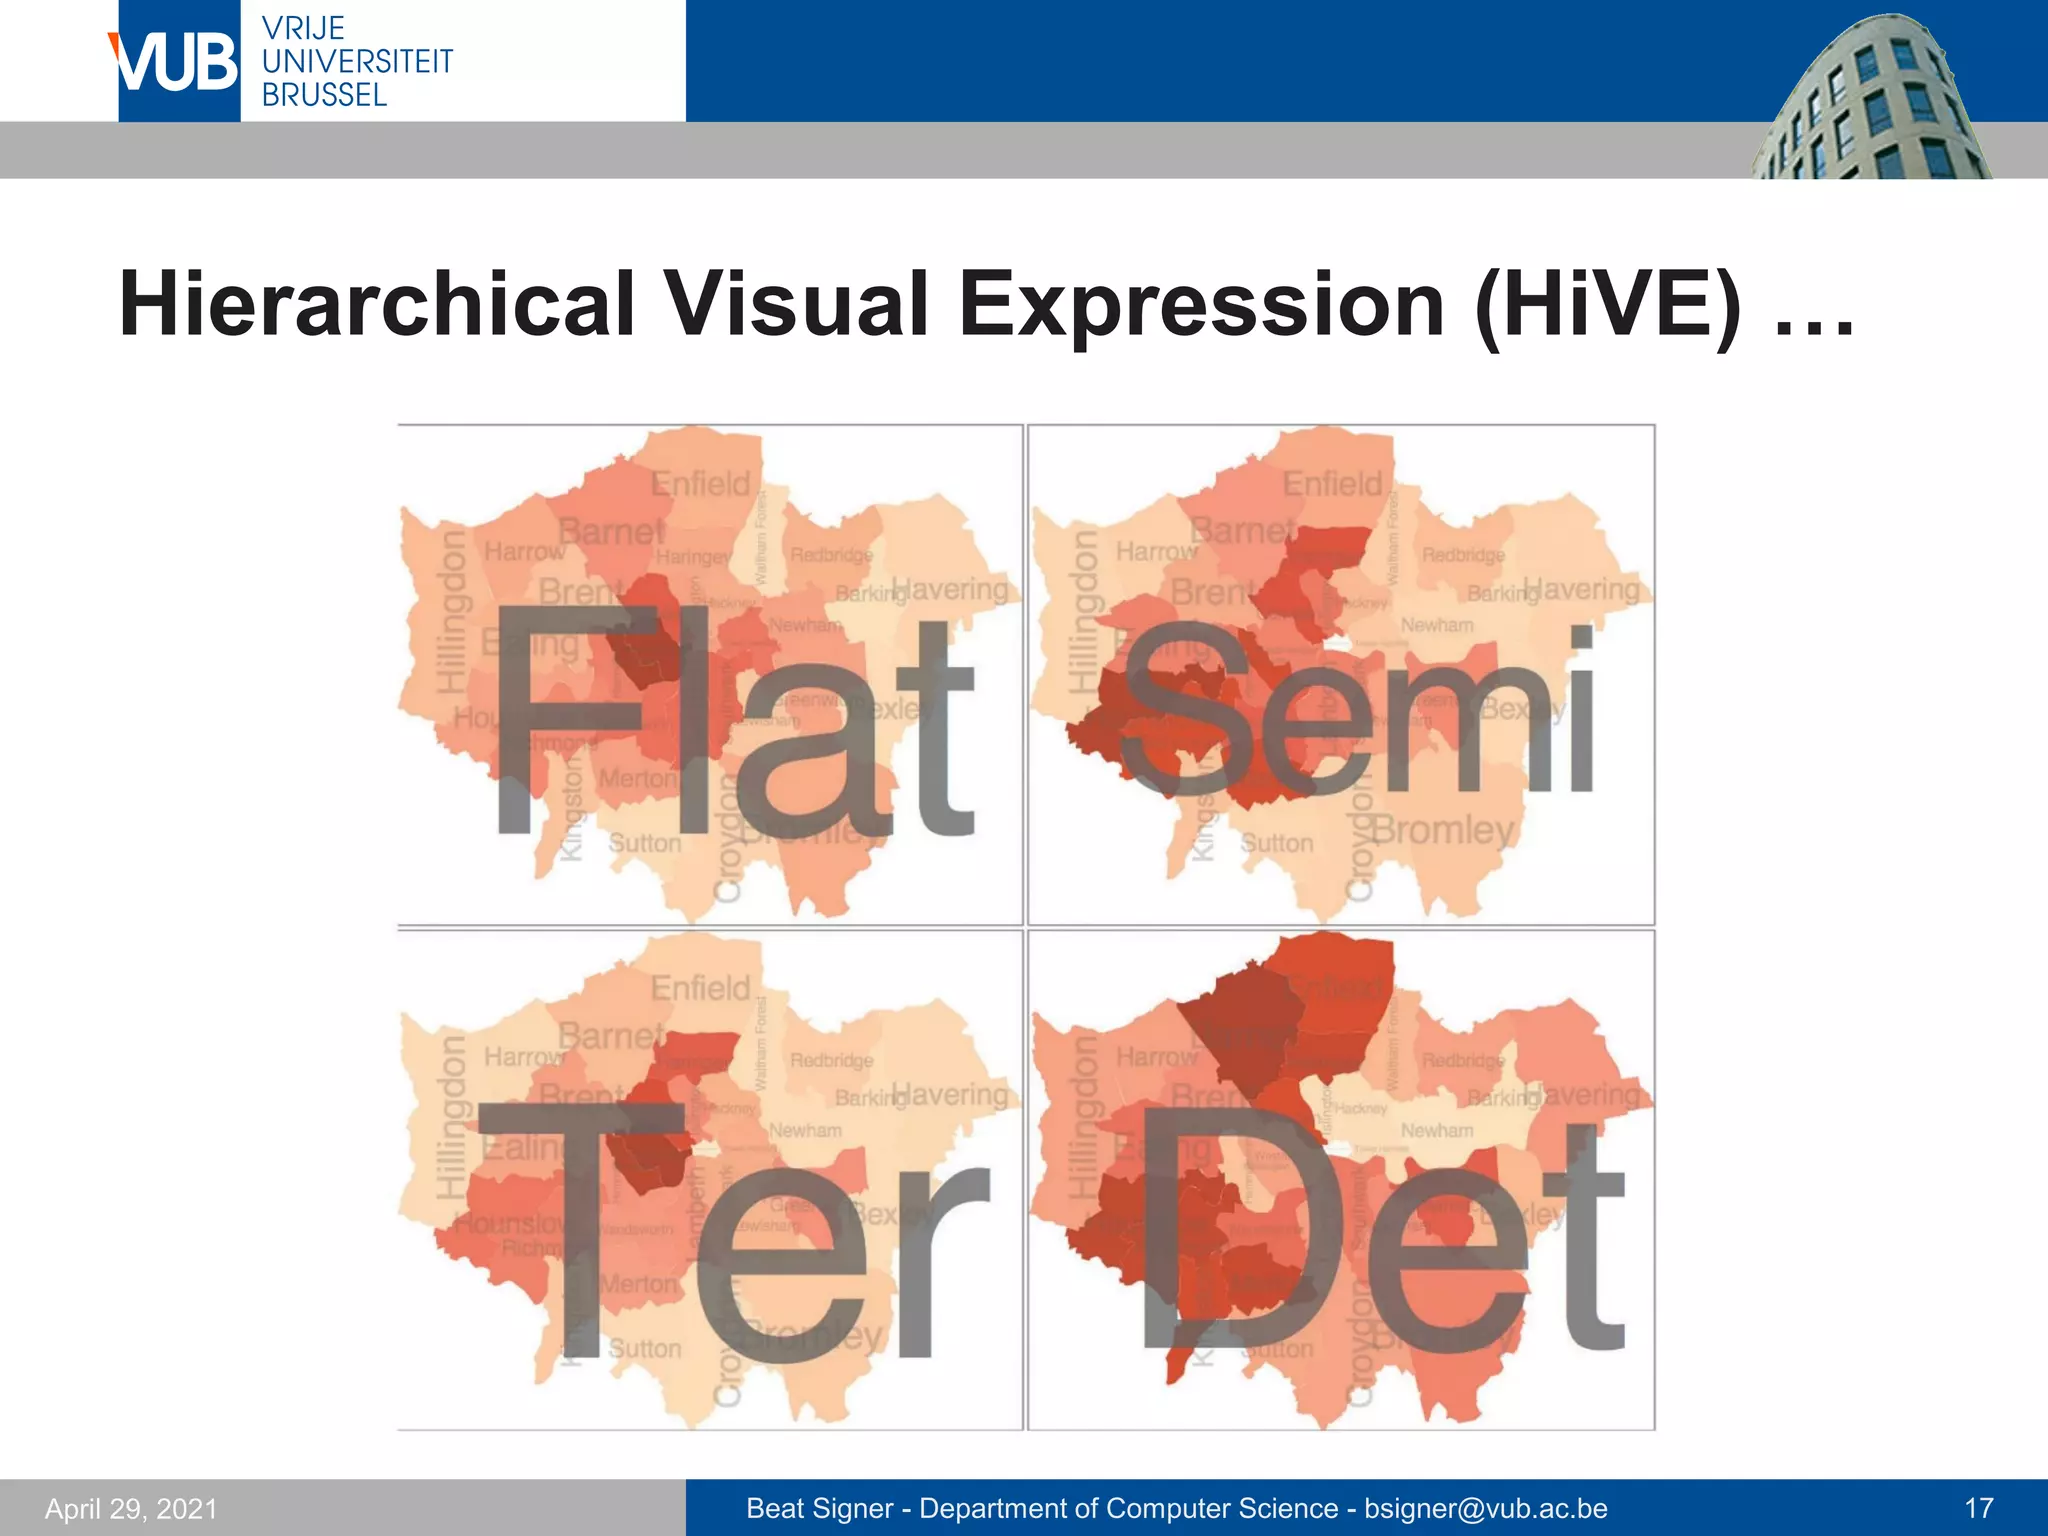

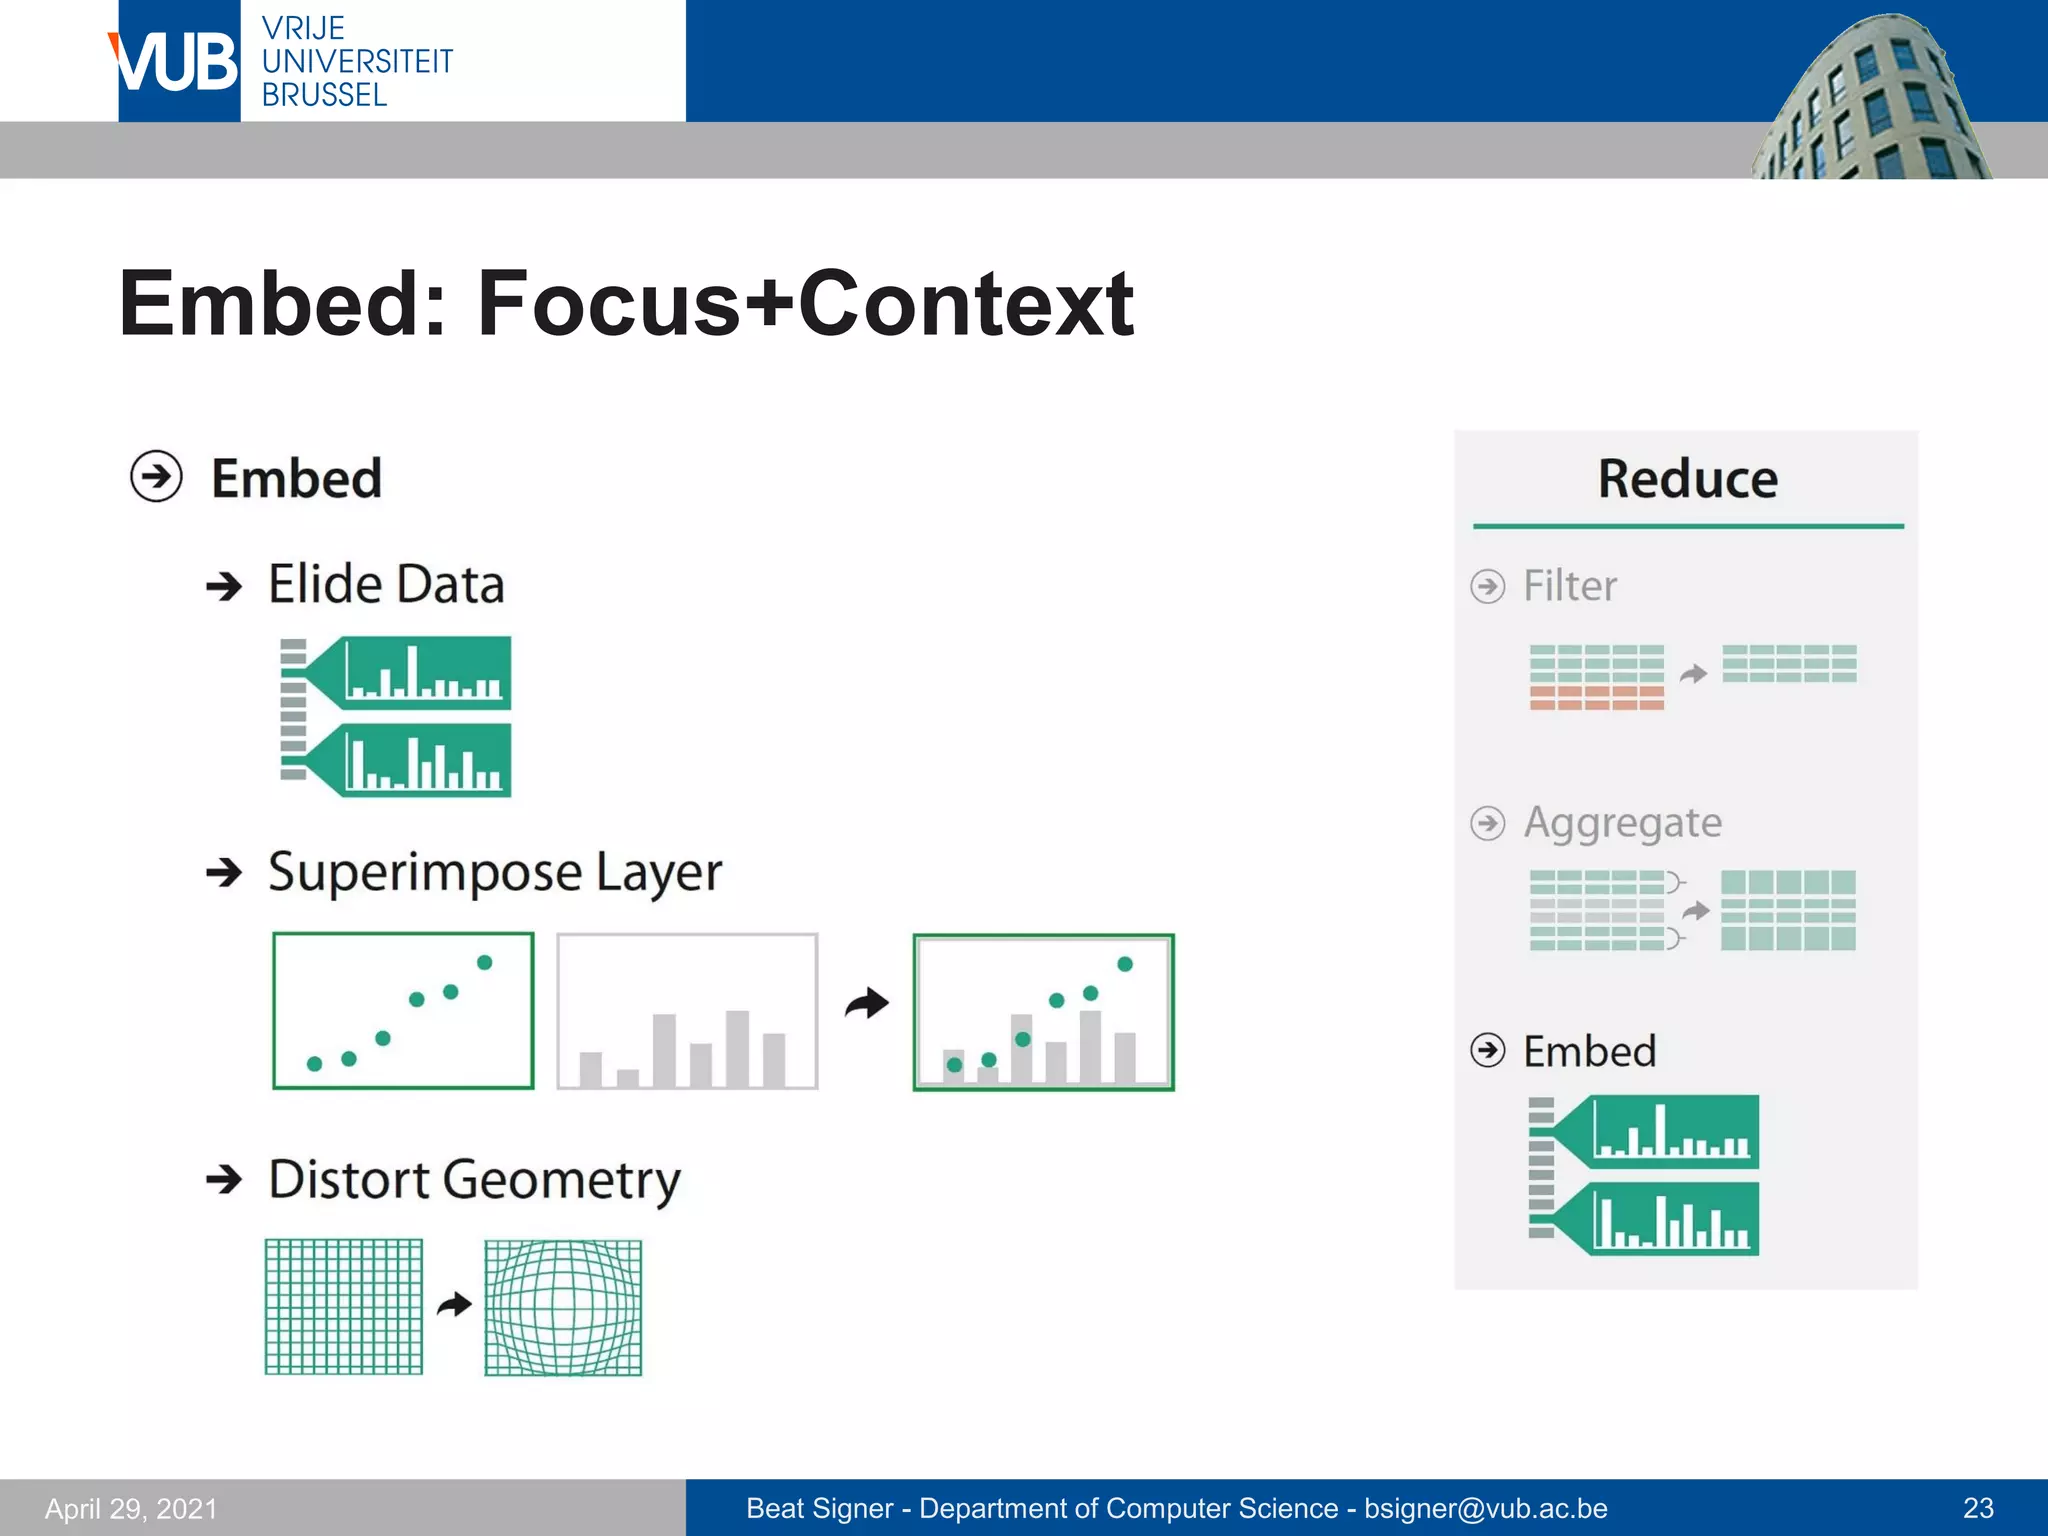
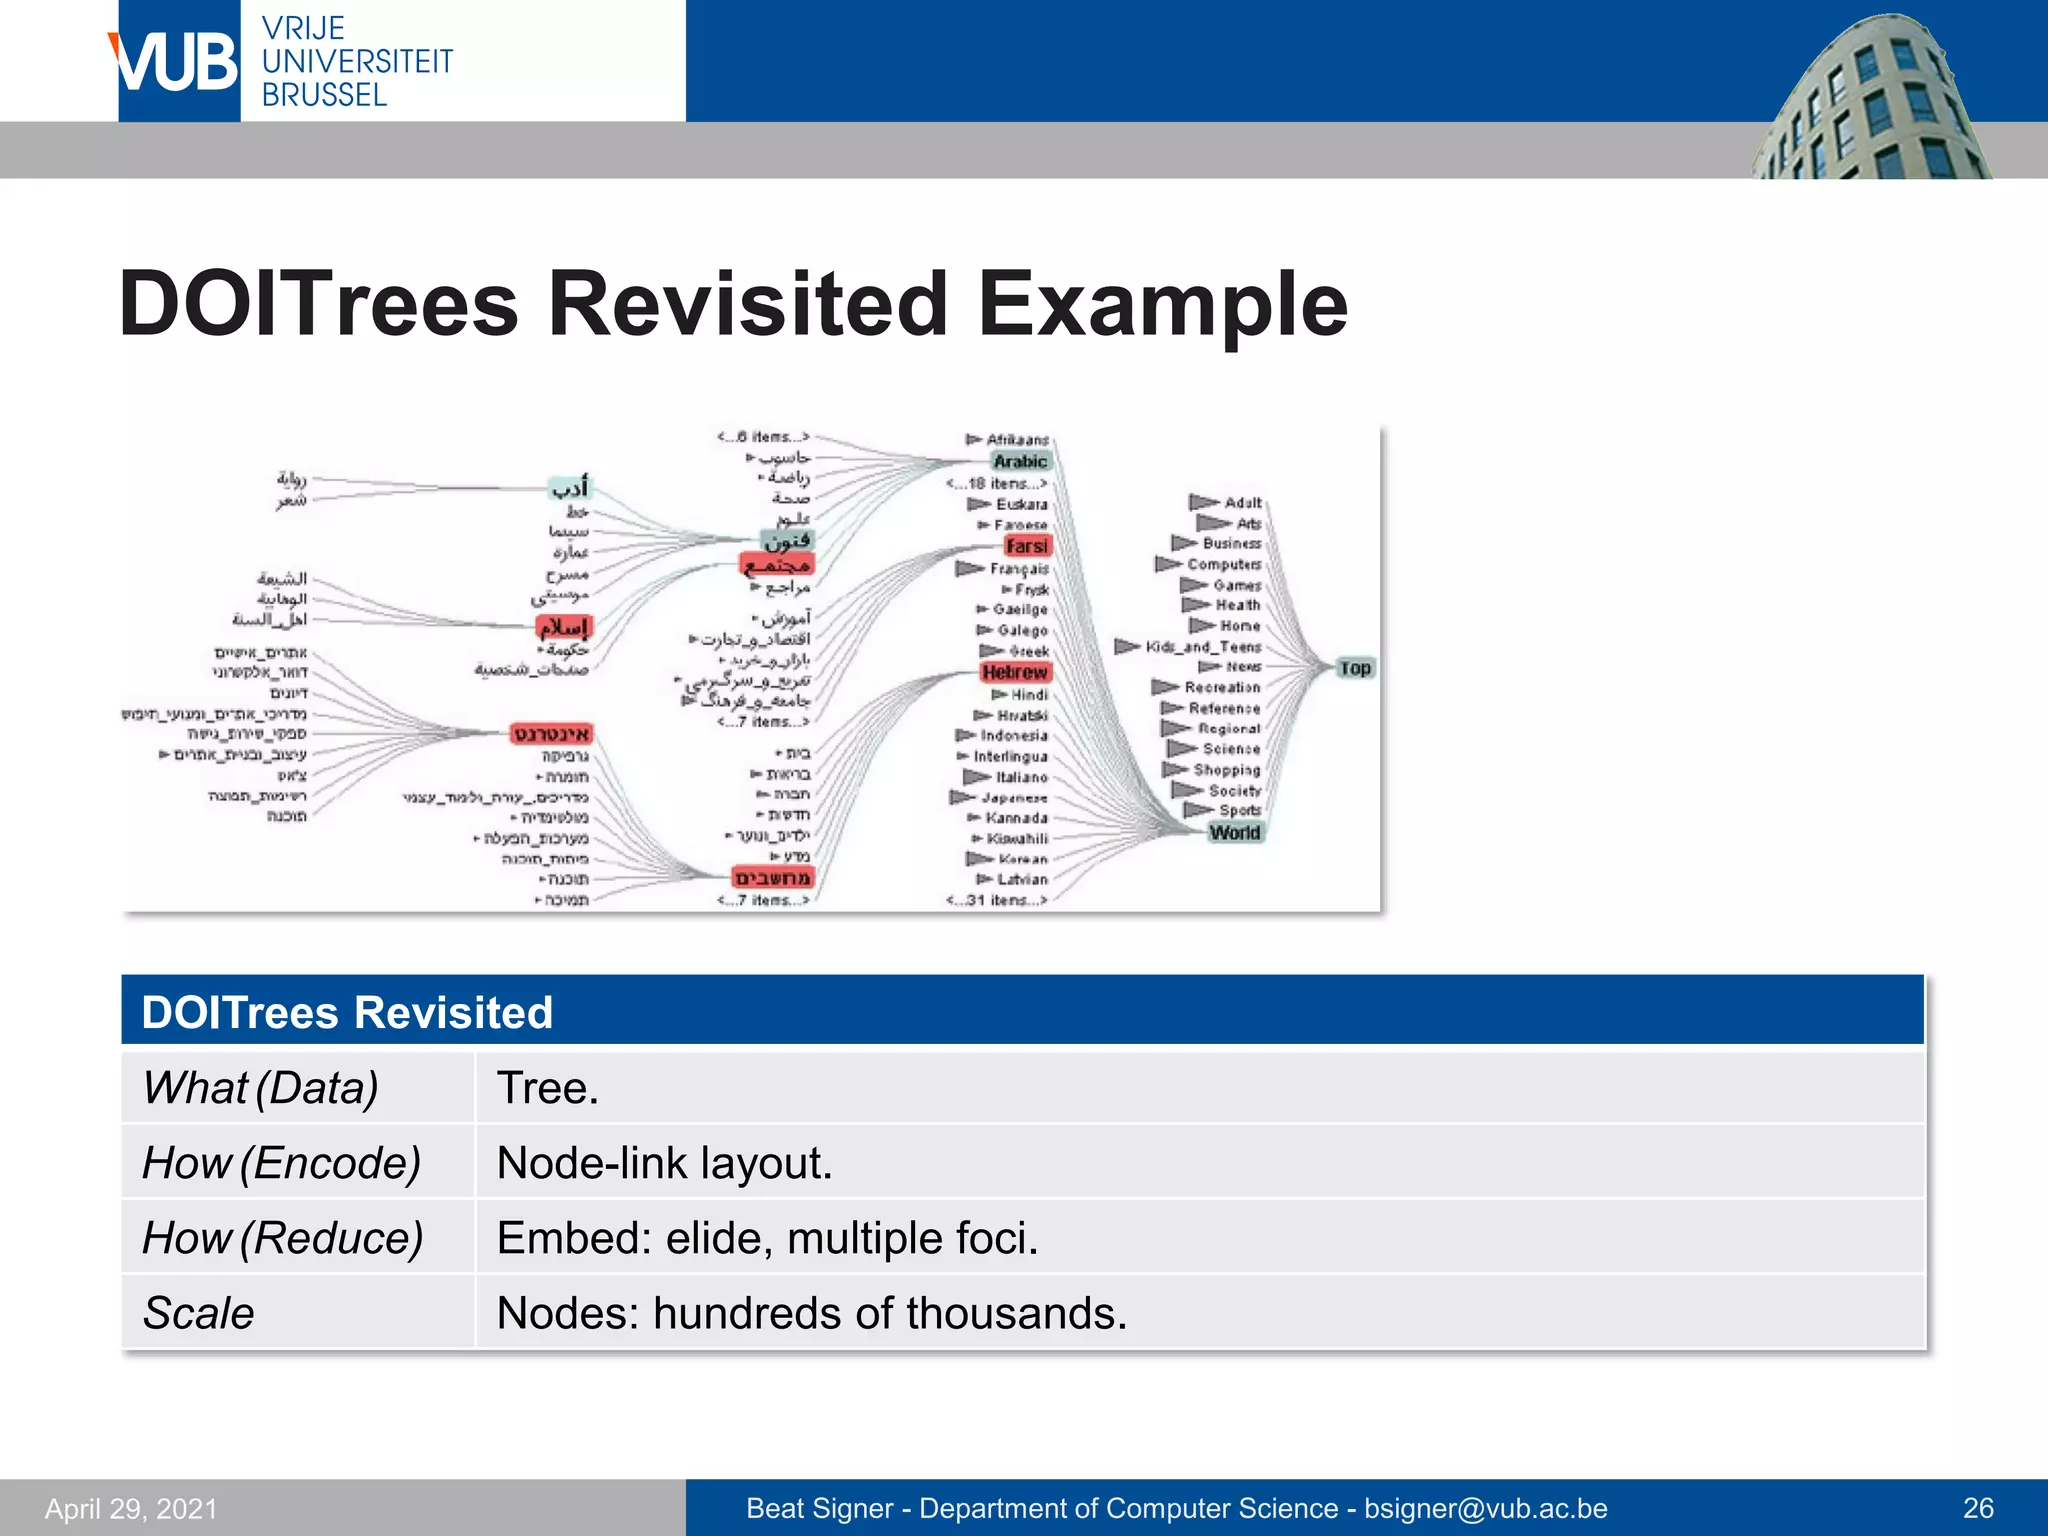


The document details methods for handling visual complexity in data visualization, highlighting the importance of interactivity and different representation techniques. It discusses major approaches such as faceting into multiple views, linking views, and embedding focus and context to improve data interpretation. Additionally, examples like bird's-eye maps, superimposed charts, and distortion techniques illustrate how to navigate large datasets effectively.