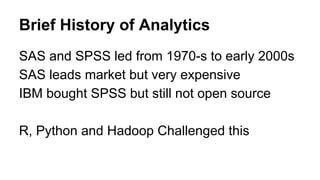
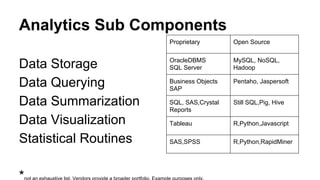
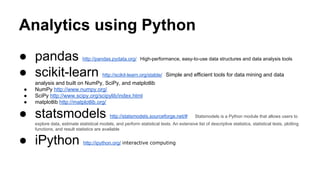
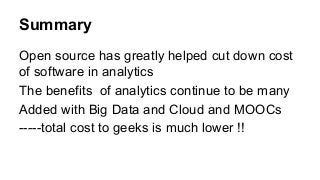
This document discusses the rise of open source analytics tools and languages. It notes that SAS and SPSS previously dominated the market but were very expensive. R, Python, and Hadoop have provided lower-cost open source alternatives for data storage, querying, visualization, and statistical analysis. The document reviews popular open source tools like R, Python, RapidMiner, and Hadoop ecosystems. It also discusses commercial offerings that build on open source like Revolution Analytics. Overall, open source has helped reduce the costs of analytics software and enabled more organizations to benefit from data-driven insights.
A changing market landscape and open source innovations are having a dramatic impact on the consumability and ease of use of data science tools. Join this session to learn about the impact these trends and changes will have on the future of data science. If you are a data scientist, or if your organization relies on cutting edge analytics, you won't want to miss this!
Fishing Graphs in a Hadoop Data Lake by Jörg Schad and Max Neunhoeffer at Big...Big Data Spain
Hadoop clusters can store nearly everything in a cheap and blazingly fast way to your data lake. Answering questions and gaining insights out of this ever growing stream becomes the decisive part for many businesses.
https://www.bigdataspain.org/2017/talk/fishing-graphs-in-a-hadoop-data-lake
Big Data Spain 2017
16th - 17th November Kinépolis Madrid
Big Data refers to a large amount of data both structured and unstructured. For managing and analyzing this amount of data we need technologies like Hadoop and language like R.
http://www.techsparks.co.in/thesis-in-big-data-with-r/
Analyzing Big data in R and Scala using Apache Spark 17-7-19Ahmed Elsayed
We can make a data mining to get the prediction about the future data, which is mined from an old data especially Big data using a machine learning algorithms based on two clusters. One is the intrinsic for managing the file system of Big data, which is called Hadoop. The other is essentially to make fast analysis of Big data which is called Apache Spark. In order to achieve this purpose we will use R based on Rstudio or Scala based on Zeppelin.
An introduction to Microsoft R Services,
Microsoft R Open and Microsoft R Server.
This presentation will briefly cover the following:
-Why consider MRO and R Server
-R Server
-MRO
-Microsoft R Services/R Server Platform
-DistributedR
-RevoScaleR/ScaleR
-ConnectR
-DevelopR
-DeployR
-Resources
-References
Presented by: Joseph Rickert, Data Scientist Community Manager, Revolution Analytics, Sep 25 2014.
Whenever data scientists are asked about what software they use R always comes up at the top of the list. In one recent survey, only SQL was rated higher than R. In this webinar we will explore what makes R so popular and useful. Starting with the big picture, we describe how R is organized and how to find your way around the R world. Then we will work through some examples highlighting features of R that make it attractive for data science work including:
Acquiring data
Data manipulation
Exploratory data analysis
Model building
Machine learning
Analysts predict that the Hadoop market will reach $50.2 billion USD by 2020.1 Applications driving these large expenditures are some of the most important workloads for businesses today including:
• Analyzing clickstream data, including site-side clicks and web media tags. • Measuring sentiment by scanning product feedback, blog feeds, social media comments, and Twitter streams. • Analysis of behavior and risk by capturing vehicle telematics. • Optimizing product performance and utilization by gathering data from built-in sensors. • Tracking and analyzing people and material movement with location-aware systems. • Identifying system performance and intrusion attempts by analyzing server and network log. • Enabling automatic document and speech categorization. • Extracting learning from digitized images, voice, video, and other media types.
Predictive analytics on large data sets provides organizations with a key opportunity to improve a broad variety of business outcomes, and many have embraced Apache Hadoop as the platform of choice.
In the last few years, large businesses have adopted Apache Hadoop as a next-generation data platform, one capable of managing large data assets in a way that is flexible, scalable, and relatively low cost. However, to realize predictive benefits of big data, organizations must be able to develop or hire individuals with the requisite statistics skills, then provide them with a platform for analyzing massive data assets collected in Hadoop “data lakes.”
As users adopted Hadoop, many discovered performance and complexity limited Hadoop’s use for broad predictive analytics use. In response, the Hadoop community has focused on the Apache Spark platform to provide Hadoop with significant performance improvements. With Spark atop Hadoop, users can leverage Hadoop’s big-data management capabilities while achieving new performance levels by running analytics in Apache Spark.
What remains is a challenge—conquering the complexity of Hadoop when developing predictive analytics applications.
In this white paper, we’ll describe how Microsoft R Server helps data scientists, actuaries, risk analysts, quantitative analysts, product planners, and other R users to capture the benefits of Apache Spark on Hadoop by providing a straightforward platform that eliminates much of the complexity of using Spark and Hadoop to conduct analyses on large data assets.
This is a power point presentation on Hadoop and Big Data. This covers the essential knowledge one should have when stepping into the world of Big Data.
This course is available on hadoop-skills.com for free!
This course builds a basic fundamental understanding of Big Data problems and Hadoop as a solution. This course takes you through:
• This course builds Understanding of Big Data problems with easy to understand examples and illustrations.
• History and advent of Hadoop right from when Hadoop wasn’t even named Hadoop and was called Nutch
• What is Hadoop Magic which makes it so unique and powerful.
• Understanding the difference between Data science and data engineering, which is one of the big confusions in selecting a carrier or understanding a job role.
• And most importantly, demystifying Hadoop vendors like Cloudera, MapR and Hortonworks by understanding about them.
This course is available for free on hadoop-skills.com
Presentation given by US Chief Scientist, Mario Inchiosa, at the June 2013 Hadoop Summit in San Jose, CA.
ABSTRACT: Hadoop is rapidly being adopted as a major platform for storing and managing massive amounts of data, and for computing descriptive and query types of analytics on that data. However, it has a reputation for not being a suitable environment for high performance complex iterative algorithms such as logistic regression, generalized linear models, and decision trees. At Revolution Analytics we think that reputation is unjustified, and in this talk I discuss the approach we have taken to porting our suite of High Performance Analytics algorithms to run natively and efficiently in Hadoop. Our algorithms are written in C++ and R, and are based on a platform that automatically and efficiently parallelizes a broad class of algorithms called Parallel External Memory Algorithms (PEMA’s). This platform abstracts both the inter-process communication layer and the data source layer, so that the algorithms can work in almost any environment in which messages can be passed among processes and with almost any data source. MPI and RPC are two traditional ways to send messages, but messages can also be passed using files, as in Hadoop. I describe how we use the file-based communication choreographed by MapReduce and how we efficiently access data stored in HDFS.
This session will demonstrate how the all-star line-up featuring R and Storm enables real-time processing on massive data sets; a real home run! The presenters will use actual baseball data and a real-world use case to compose an implementation of the use case as Storm components (spouts, bolts, etc.) and highlight how R can be an effective tool in prototyping a solution. Attendees will leave the session with information that could easily be applied for other use cases such as video game analytics, fraud detection, intrusion detection, and consumer propensity to buy calculations.
The business need for real-time analytics at large scale has focused attention on the use of Apache Storm, but an approach that is sometimes overlooked is the use of Storm and R together. This novel combination of real-time processing with Storm and the practical but powerful statistical analysis offered by R substantially extends the usefulness of Storm as a solution to a variety of business critical problems. By architecting R into the Storm application development process, Storm developers can be much more effective. The aim of this design is not necessarily to deploy faster code but rather to deploy code faster. Just a few lines of R code can be used in place of lengthy Storm code for the purpose of early exploration – you can easily evaluate alternative approaches and quickly make a working prototype.
(Presented by David Smith at useR!2016, June 2016. Recording: https://channel9.msdn.com/Events/useR-international-R-User-conference/useR2016/R-at-Microsoft )
Since the acquisition of Revolution Analytics in April 2015, Microsoft has embarked upon a project to build R technology into many Microsoft products, so that developers and data scientists can use the R language and R packages to analyze data in their data centers and in cloud environments.
In this talk I will give an overview (and a demo or two) of how R has been integrated into various Microsoft products. Microsoft data scientists are also big users of R, and I'll describe a couple of examples of R being used to analyze operational data at Microsoft. I'll also share some of my experiences in working with open source projects at Microsoft, and my thoughts on how Microsoft works with open source communities including the R Project.
High Performance Predictive Analytics in R and HadoopDataWorks Summit
Hadoop is rapidly being adopted as a major platform for storing and managing massive amounts of data, and for computing descriptive and query types of analytics on that data. However, it has a reputation for not being a suitable environment for high performance complex iterative algorithms such as logistic regression, generalized linear models, and decision trees. At Revolution Analytics we think that reputation is unjustified, and in this talk I discuss the approach we have taken to porting our suite of High Performance Analytics algorithms to run natively and efficiently in Hadoop. Our algorithms are written in C++ and R, and are based on a platform that automatically and efficiently parallelizes a broad class of algorithms called Parallel External Memory Algorithms (PEMA’s). This platform abstracts both the inter-process communication layer and the data source layer, so that the algorithms can work in almost any environment in which messages can be passed among processes and with almost any data source. MPI and RPC are two traditional ways to send messages, but messages can also be passed using files, as in Hadoop. I describe how we use the file-based communication choreographed by MapReduce and how we efficiently access data stored in HDFS.
27 Aug 2013 Webinar High Performance Predictive Analytics in Hadoop and R presented by Mario E. Inchiosa, PhD., US Data Scientist and Kathleen Rohrecker, Director of Product Marketing
TDWI Accelerate, Seattle, Oct 16, 2017: Distributed and In-Database Analytics...Debraj GuhaThakurta
Event: TDWI Accelerate, Seattle, Oct 16, 2017
Topic: Distributed and In-Database Analytics with R
Presenter: Debraj GuhaThakurta
Tags: R, Spark, SQL Server
TWDI Accelerate Seattle, Oct 16, 2017: Distributed and In-Database Analytics ...Debraj GuhaThakurta
Event: TDWI Accelerate Seattle, October 16, 2017
Topic: Distributed and In-Database Analytics with R
Presenter: Debraj GuhaThakurta
Description: How to develop scalable and in-DB analytics using R in Spark and SQL-Server
Performance and Scale Options for R with Hadoop: A comparison of potential ar...Revolution Analytics
R and Hadoop go together. In fact, they go together so well, that the number of options available can be confusing to IT and data science teams seeking solutions under varying performance and operational requirements.
Which configuration is faster for big files? Which is faster for sharing data and servers among groups? Which eliminates data movement? Which is easiest to manage? Which works best with iterative and multistep algorithms? What are the hardware requirements of each alternative?
This webinar is intended to help new users of R with Hadoop select their best architecture for integrating Hadoop and R, by explaining the benefits of several popular configurations, their performance potential, workload handling and programming model and administrative characteristics.
Presenters from Revolution Analytics will describe the options for using Revolution R Open and Revolution R Enterprise with Hadoop including servers, edge nodes, rHadoop and ScaleR. We’ll then compare the characteristics of each configuration as regards performance but also programming model, administration, data movement, ease of scaling, mixed workload handling, and performance for large individual analyses vs. mixed workloads.
A Hands-on Intro to Data Science and R Presentation.pptSanket Shikhar
Using popular data science tools such as Python and R, the book offers many examples of real-life applications, with practice ranging from small to big data.
Can you teach coding to kids in a mobile game app in local languages. Do you need to be good in English to learn coding in R or Python?
How young can we train people in coding-
something we worked on for six months but now we are giving up due to lack of funds is this idea.
Feel free to use it, it is licensed cc-by-sa
Accelerate your Kubernetes clusters with Varnish CachingThijs Feryn
A presentation about the usage and availability of Varnish on Kubernetes. This talk explores the capabilities of Varnish caching and shows how to use the Varnish Helm chart to deploy it to Kubernetes.
This presentation was delivered at K8SUG Singapore. See https://feryn.eu/presentations/accelerate-your-kubernetes-clusters-with-varnish-caching-k8sug-singapore-28-2024 for more details.
Smart TV Buyer Insights Survey 2024 by 91mobiles.pdf91mobiles
91mobiles recently conducted a Smart TV Buyer Insights Survey in which we asked over 3,000 respondents about the TV they own, aspects they look at on a new TV, and their TV buying preferences.
Builder.ai Founder Sachin Dev Duggal's Strategic Approach to Create an Innova...Ramesh Iyer
In today's fast-changing business world, Companies that adapt and embrace new ideas often need help to keep up with the competition. However, fostering a culture of innovation takes much work. It takes vision, leadership and willingness to take risks in the right proportion. Sachin Dev Duggal, co-founder of Builder.ai, has perfected the art of this balance, creating a company culture where creativity and growth are nurtured at each stage.
JMeter webinar - integration with InfluxDB and GrafanaRTTS
Watch this recorded webinar about real-time monitoring of application performance. See how to integrate Apache JMeter, the open-source leader in performance testing, with InfluxDB, the open-source time-series database, and Grafana, the open-source analytics and visualization application.
In this webinar, we will review the benefits of leveraging InfluxDB and Grafana when executing load tests and demonstrate how these tools are used to visualize performance metrics.
Length: 30 minutes
Session Overview
-------------------------------------------
During this webinar, we will cover the following topics while demonstrating the integrations of JMeter, InfluxDB and Grafana:
- What out-of-the-box solutions are available for real-time monitoring JMeter tests?
- What are the benefits of integrating InfluxDB and Grafana into the load testing stack?
- Which features are provided by Grafana?
- Demonstration of InfluxDB and Grafana using a practice web application
To view the webinar recording, go to:
https://www.rttsweb.com/jmeter-integration-webinar
"Impact of front-end architecture on development cost", Viktor TurskyiFwdays
I have heard many times that architecture is not important for the front-end. Also, many times I have seen how developers implement features on the front-end just following the standard rules for a framework and think that this is enough to successfully launch the project, and then the project fails. How to prevent this and what approach to choose? I have launched dozens of complex projects and during the talk we will analyze which approaches have worked for me and which have not.
GraphRAG is All You need? LLM & Knowledge GraphGuy Korland
Guy Korland, CEO and Co-founder of FalkorDB, will review two articles on the integration of language models with knowledge graphs.
1. Unifying Large Language Models and Knowledge Graphs: A Roadmap.
https://arxiv.org/abs/2306.08302
2. Microsoft Research's GraphRAG paper and a review paper on various uses of knowledge graphs:
https://www.microsoft.com/en-us/research/blog/graphrag-unlocking-llm-discovery-on-narrative-private-data/
Slack (or Teams) Automation for Bonterra Impact Management (fka Social Soluti...Jeffrey Haguewood
Sidekick Solutions uses Bonterra Impact Management (fka Social Solutions Apricot) and automation solutions to integrate data for business workflows.
We believe integration and automation are essential to user experience and the promise of efficient work through technology. Automation is the critical ingredient to realizing that full vision. We develop integration products and services for Bonterra Case Management software to support the deployment of automations for a variety of use cases.
This video focuses on the notifications, alerts, and approval requests using Slack for Bonterra Impact Management. The solutions covered in this webinar can also be deployed for Microsoft Teams.
Interested in deploying notification automations for Bonterra Impact Management? Contact us at sales@sidekicksolutionsllc.com to discuss next steps.
LF Energy Webinar: Electrical Grid Modelling and Simulation Through PowSyBl -...DanBrown980551
Do you want to learn how to model and simulate an electrical network from scratch in under an hour?
Then welcome to this PowSyBl workshop, hosted by Rte, the French Transmission System Operator (TSO)!
During the webinar, you will discover the PowSyBl ecosystem as well as handle and study an electrical network through an interactive Python notebook.
PowSyBl is an open source project hosted by LF Energy, which offers a comprehensive set of features for electrical grid modelling and simulation. Among other advanced features, PowSyBl provides:
- A fully editable and extendable library for grid component modelling;
- Visualization tools to display your network;
- Grid simulation tools, such as power flows, security analyses (with or without remedial actions) and sensitivity analyses;
The framework is mostly written in Java, with a Python binding so that Python developers can access PowSyBl functionalities as well.
What you will learn during the webinar:
- For beginners: discover PowSyBl's functionalities through a quick general presentation and the notebook, without needing any expert coding skills;
- For advanced developers: master the skills to efficiently apply PowSyBl functionalities to your real-world scenarios.
GDG Cloud Southlake #33: Boule & Rebala: Effective AppSec in SDLC using Deplo...James Anderson
Effective Application Security in Software Delivery lifecycle using Deployment Firewall and DBOM
The modern software delivery process (or the CI/CD process) includes many tools, distributed teams, open-source code, and cloud platforms. Constant focus on speed to release software to market, along with the traditional slow and manual security checks has caused gaps in continuous security as an important piece in the software supply chain. Today organizations feel more susceptible to external and internal cyber threats due to the vast attack surface in their applications supply chain and the lack of end-to-end governance and risk management.
The software team must secure its software delivery process to avoid vulnerability and security breaches. This needs to be achieved with existing tool chains and without extensive rework of the delivery processes. This talk will present strategies and techniques for providing visibility into the true risk of the existing vulnerabilities, preventing the introduction of security issues in the software, resolving vulnerabilities in production environments quickly, and capturing the deployment bill of materials (DBOM).
Speakers:
Bob Boule
Robert Boule is a technology enthusiast with PASSION for technology and making things work along with a knack for helping others understand how things work. He comes with around 20 years of solution engineering experience in application security, software continuous delivery, and SaaS platforms. He is known for his dynamic presentations in CI/CD and application security integrated in software delivery lifecycle.
Gopinath Rebala
Gopinath Rebala is the CTO of OpsMx, where he has overall responsibility for the machine learning and data processing architectures for Secure Software Delivery. Gopi also has a strong connection with our customers, leading design and architecture for strategic implementations. Gopi is a frequent speaker and well-known leader in continuous delivery and integrating security into software delivery.
UiPath Test Automation using UiPath Test Suite series, part 4DianaGray10
Welcome to UiPath Test Automation using UiPath Test Suite series part 4. In this session, we will cover Test Manager overview along with SAP heatmap.
The UiPath Test Manager overview with SAP heatmap webinar offers a concise yet comprehensive exploration of the role of a Test Manager within SAP environments, coupled with the utilization of heatmaps for effective testing strategies.
Participants will gain insights into the responsibilities, challenges, and best practices associated with test management in SAP projects. Additionally, the webinar delves into the significance of heatmaps as a visual aid for identifying testing priorities, areas of risk, and resource allocation within SAP landscapes. Through this session, attendees can expect to enhance their understanding of test management principles while learning practical approaches to optimize testing processes in SAP environments using heatmap visualization techniques
What will you get from this session?
1. Insights into SAP testing best practices
2. Heatmap utilization for testing
3. Optimization of testing processes
4. Demo
Topics covered:
Execution from the test manager
Orchestrator execution result
Defect reporting
SAP heatmap example with demo
Speaker:
Deepak Rai, Automation Practice Lead, Boundaryless Group and UiPath MVP
Neuro-symbolic is not enough, we need neuro-*semantic*Frank van Harmelen
Neuro-symbolic (NeSy) AI is on the rise. However, simply machine learning on just any symbolic structure is not sufficient to really harvest the gains of NeSy. These will only be gained when the symbolic structures have an actual semantics. I give an operational definition of semantics as “predictable inference”.
All of this illustrated with link prediction over knowledge graphs, but the argument is general.
3. Brief History of Analytics
SAS and SPSS led from 1970-s to early 2000s
SAS leads market but very expensive
IBM bought SPSS but still not open source
R, Python and Hadoop Challenged this
5. Analytics Sub Components
Data Storage
Data Querying
Data Summarization
Data Visualization
Statistical Routines
Proprietary Open Source
OracleDBMS
SQL Server
Business Objects
SAP
SQL, SAS,Crystal
Reports
Tableau
SAS,SPSS
6. Analytics Sub Components
Data Storage
Data Querying
Data Summarization
Data Visualization
Statistical Routines
Proprietary Open Source
OracleDBMS
SQL Server
MySQL, NoSQL,
Hadoop
Business Objects
SAP
Pentaho, Jaspersoft
SQL, SAS,Crystal
Reports
Still SQL,Pig, Hive
Tableau R,Python,Javascript
SAS,SPSS R,Python,RapidMiner
7. Analytics using Python
● pandas http://pandas.pydata.org/ High-performance, easy-to-use data structures and data analysis tools
● scikit-learn http://scikit-learn.org/stable/ Simple and efficient tools for data mining and data
analysis and built on NumPy, SciPy, and matplotlib
● NumPy http://www.numpy.org/
● SciPy http://www.scipy.org/scipylib/index.html
● matplotlib http://matplotlib.org/
● statsmodels http://statsmodels.sourceforge.net/# Statsmodels is a Python module that allows users to
explore data, estimate statistical models, and perform statistical tests. An extensive list of descriptive statistics, statistical tests, plotting
functions, and result statistics are available
● iPython http://ipython.org/ interactive computing
8. Analytics using R
http://www.r-project.org/
● RStudio and Revolution Analytics
● sqldf https://code.google.com/p/sqldf/ and RODBC http://cran.r-project.org/web/packages/RODBC/index.html
● ggplot2 http://ggplot2.org/ and ggmap and shiny
● RHadoop et al https://github.com/RevolutionAnalytics/RHadoop
● car, stats, forecast, sna,tm
● rattle and Rcommander (with plugins)
More at http://rforanalytics.wordpress.com/
11. Analytics using R
<blatant self promotion>
http://www.amazon.com/R-Business-Analytics-A-Ohri/dp/1461443423
R for Business Analytics looks at some of the most common tasks performed
by business analysts and helps the user navigate the wealth of information in R
and its packages. With this information the reader can select the packages that
can help process the analytical tasks with minimum effort and maximum usefulness
. The use of Graphical User Interfaces (GUI) is emphasized in this book to
further cut down and bend the famous learning curve in learning R.
</blatant self promotion>
12. Analytics using Rapid Miner
Early adopter of open source analytics
Recently moved from Germany to USA
following PE infusion
One of the first marketplace for analytics
extensions http://marketplace.rapid-i.com/UpdateServer/
One of the best GUI - Drag and Drop using flow
15. Analytics using other languages
Julia- faster than R http://julialang.org/
Julia is a high-level, high-performance dynamic programming language for technical computing, with syntax that is familiar to
users of other technical computing environments. It provides a sophisticated compiler, distributed parallel execution, numerical
accuracy, and an extensive mathematical function library. The library, largely written in Julia itself, also integrates mature, best-of-
breed C and Fortran libraries for linear algebra, random number generation, signal processing, and string processing.
18. Analytics using other languages
Clojure- for JVM http://clojure.org/
Clojure is a dynamic programming language that targets the Java Virtual Machine . It is designed to be a general-purpose
language, combining the approachability and interactive development of a scripting language with an efficient and robust
infrastructure for multithreaded programming. Clojure is a compiled language - it compiles directly to JVM bytecode, yet remains
completely dynamic. Every feature supported by Clojure is supported at runtime. Clojure is a dialect of Lisp
https://bigml.com/gallery/models
19. Analytics using other languages
bigml.com (using clojure)
https://bigml.com/gallery/models
20. Analytics using other languages
Scala- for big data analytics http://www.scala-lang.org/
● A Scalable language
● Object-Oriented
● Functional
● Seamless Java Interop
● Functions are Objects
● Future-Proof
● Fun
34. R -Revolution Analytics
Free for Academics
World Wide !!
RevoScaleR package
for Big Data
Recommended Install -
http://info.revolutionanalytics.com/free-academic.html
36. R -Big Data Packages
http://cran.r-project.org/web/views/HighPerformanceComputing.html
● The RHIPE package, started by Saptarshi Guha and now developed by a core team via GitHub, provides an interface
between R and Hadoop for analysis of large complex data wholly from within R using the Divide and Recombine approach
to big data. ( link )
● The rmr package by Revolution Analytics also provides an interface between R and Hadoop for a Map/Reduce
programming framework. ( link )
● A related package, segue package by Long, permits easy execution of embarassingly parallel task on Elastic Map Reduce
(EMR) at Amazon. ( link )
● The RProtoBuf package provides an interface to Google's language-neutral, platform-neutral, extensible mechanism for
serializing structured data. This package can be used in R code to read data streams from other systems in a distributed
MapReduce setting where data is serialized and passed back and forth between tasks.
● The HistogramTools package provides a number of routines useful for the construction, aggregation, manipulation, and
plotting of large numbers of Histograms such as those created by Mappers in a MapReduce application.
39. So many packages- CRAN Views to
the rescue
http://cran.r-project.org/web/views/
Bayesian Bayesian Inference
ChemPhys Chemometrics and Computational Physics
ClinicalTrials Clinical Trial Design, Monitoring, and Analysis
Cluster Cluster Analysis & Finite Mixture Models
DifferentialEquations Differential Equations
Distributions Probability Distributions
Econometrics Computational Econometrics
Environmetrics Analysis of Ecological and Environmental Data
ExperimentalDesign Design of Experiments (DoE) & Analysis of Experimental Data
Finance Empirical Finance
Genetics Statistical Genetics
Graphics Graphic Displays & Dynamic Graphics & Graphic Devices & Visualization
HighPerformanceComputing High-Performance and Parallel Computing with R
MachineLearning Machine Learning & Statistical Learning
MedicalImaging Medical Image Analysis
MetaAnalysis Meta-Analysis
Multivariate Multivariate Statistics
NaturalLanguageProcessing Natural Language Processing
40. So many packages- CRAN Views to
the rescue
http://cran.r-project.org/web/views/
NumericalMathematics Numerical Mathematics
OfficialStatistics Official Statistics & Survey Methodology
Optimization Optimization and Mathematical Programming
Pharmacokinetics Analysis of Pharmacokinetic Data
Phylogenetics Phylogenetics, Especially Comparative Methods
Psychometrics Psychometric Models and Methods
ReproducibleResearch Reproducible Research
Robust Robust Statistical Methods
SocialSciences Statistics for the Social Sciences
Spatial Analysis of Spatial Data
SpatioTemporal Handling and Analyzing Spatio-Temporal Data
Survival Survival Analysis
TimeSeries Time Series Analysis
WebTechnologies Web Technologies and Services
gR gRaphical Models in R
41. R in the Browser
http://www.r-fiddle.org/#/
http://statace.com/
http://www.rstudio.com/ide/server/
42. R -Hadoop Packages
https://github.com/RevolutionAnalytics/RHadoop/wiki
● plyrmr - higher level plyr-like data processing for structured data, powered by rmr
● rmr - functions providing Hadoop MapReduce functionality in R
● rhdfs - functions providing file management of the HDFS from within R
● rhbase - functions providing database management for the HBase distributed database from within R
http://amplab-extras.github.io/SparkR-pkg/
SparkR is an R package that provides a light-weight frontend to use Apache Spark from R.
https://github.com/nexr/RHive
RHive is an R extension facilitating distributed computing via HIVE query. RHive allows easy usage of HQL(Hive SQL) in R, and
allows easy usage of R objects and R functions in Hive.
43. R - Cloud Computing
http://cran.r-project.org/web/views/WebTechnologies.html
44. R -Big Data Packages
http://cran.r-project.org/web/views/HighPerformanceComputing.html
Large memory and out-of-memory data
● The biglm package by Lumley uses incremental computations to offer lm() and glm() functionality to data sets stored
outside of R's main memory.
● The ff package by Adler et al. offers file-based access to data sets that are too large to be loaded into memory, along with
a number of higher-level functions.
● The bigmemory package by Kane and Emerson permits storing large objects such as matrices in memory (as well as via
files) and uses external pointer objects to refer to them. .
● A large number of database packages, and database-alike packages (such as sqldf by Grothendieck and data.table
● The HadoopStreaming package provides a framework for writing map/reduce scripts for use in Hadoop Streaming; it also
facilitates operating on data in a streaming fashion which does not require Hadoop.
● The speedglm package permits to fit (generalised) linear models to large data.
● The biglars package by Seligman et al can use the ff to support large-than-memory datasets for least-angle regression,
lasso and stepwise regression.
● The bigrf package provides a Random Forests implementation with support for parellel execution and large memory.
● The MonetDB.R package allows R to access the MonetDB column-oriented, open source database system as a backend.
45. Data Scientist Tool Kit
● web scraping
● visualization
● machine learning
● data mining
● modeling
● sna
● social media analytics
● web analytics
● reproducible research
● TS forecasting
● spatial analysis
● data storage
● data querying
46. Data Scientist Programming Skills
Java http://www.learnjavaonline.org/
Python http://www.codecademy.com/tracks/python
SQL http://www.w3schools.com/sql/
R http://bigdatauniversity.com/bdu-wp/bdu-course/introduction-to-data-analysis-using-r/
http://www.statmethods.net/
Hadoop http://hortonworks.com/hadoop-training/
Linuxhttps://github.com/WilliamHackmore/linuxgems/blob/master/cheat_sheet.org.sh
47. Other place to learn
MOOCs 1 https://www.edx.org/ 2 https://www.coursera.org/ 3 https://www.udacity.com/ 4 https://www.udemy.com/
Books
Courses
Workshops
48. Summary
Open source has greatly helped cut down cost
of software in analytics
The benefits of analytics continue to be many
Added with Big Data and Cloud and MOOCs
-----total cost to geeks is much lower !!