Download to read offline
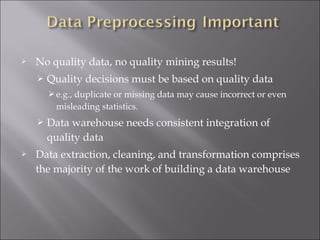
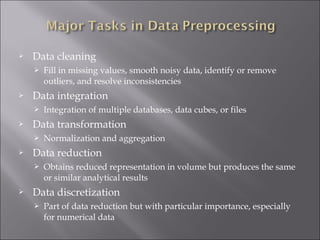
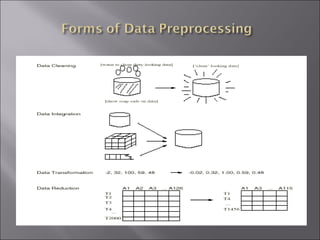
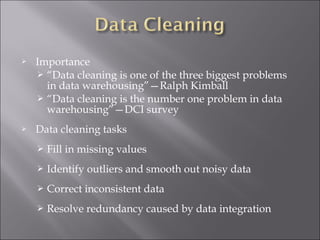
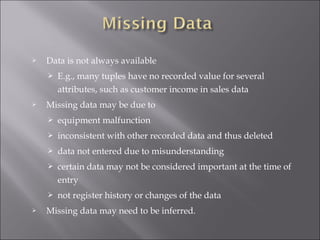
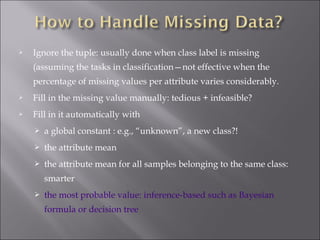
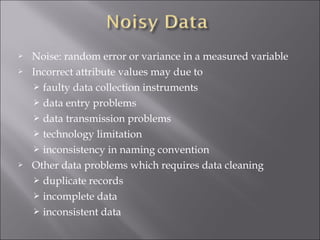
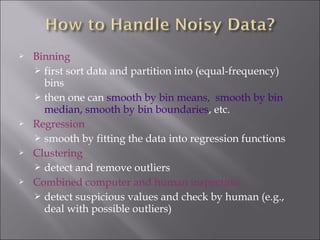
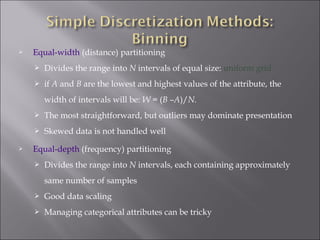
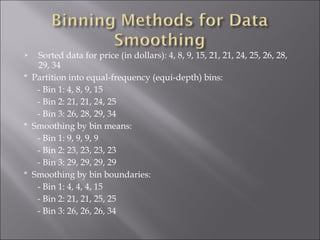
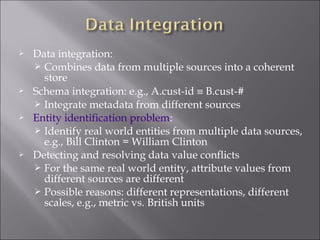
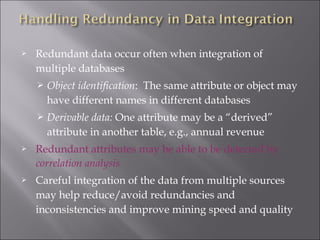
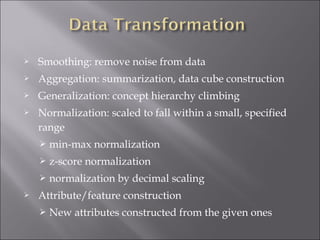
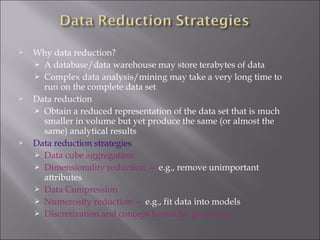
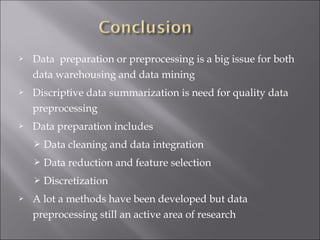

This document discusses data preparation techniques for data warehousing and mining projects, including descriptive data summarization, data cleaning, integration and transformation, and reduction. It covers cleaning techniques like handling missing data, identifying outliers, and resolving inconsistencies. Data integration challenges like schema matching and resolving conflicts are also addressed. Methods for data reduction like aggregation, generalization, normalization and attribute construction are summarized.