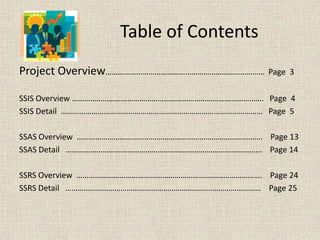
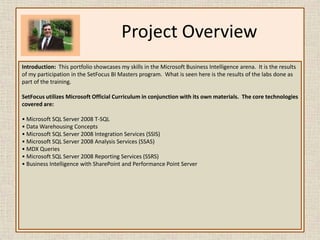
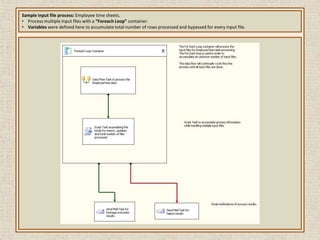
This portfolio showcases skills in Microsoft Business Intelligence, including SQL Server Integration Services (SSIS), Analysis Services (SSAS), and Reporting Services (SSRS). The document outlines projects involving:
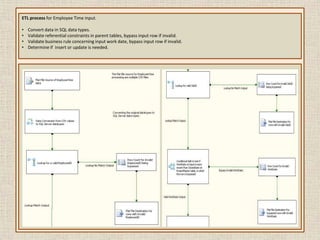
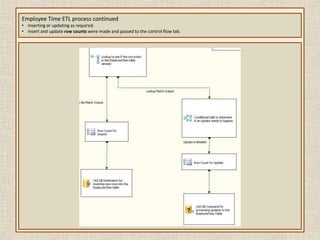
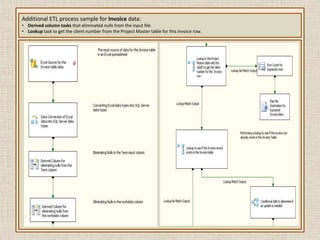
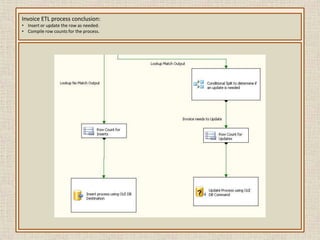
1) Designing an ETL process in SSIS to load data from various sources into a SQL database.
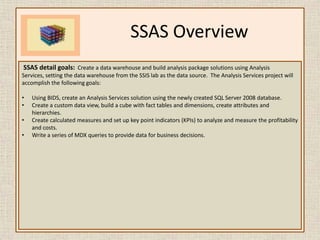
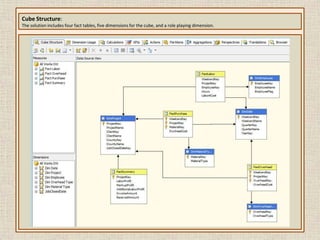
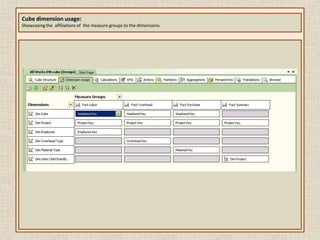
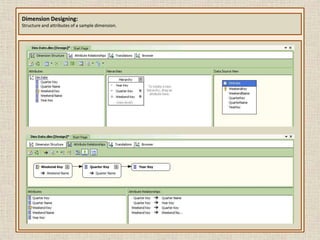
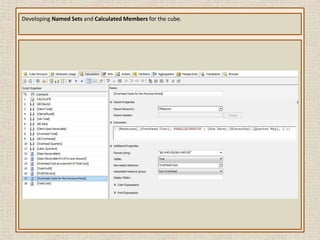
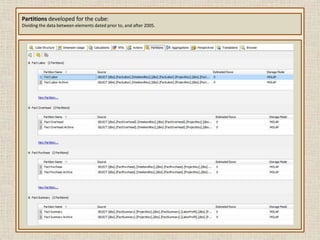
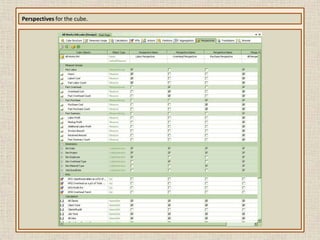
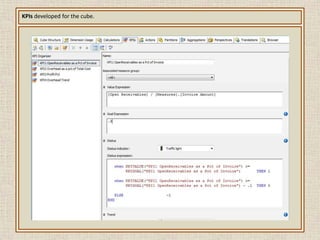
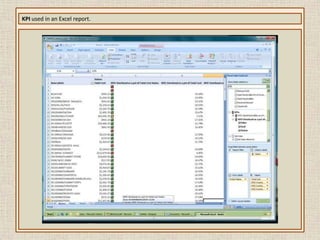
2) Building a data warehouse cube in SSAS with dimensions, measures, and KPIs.
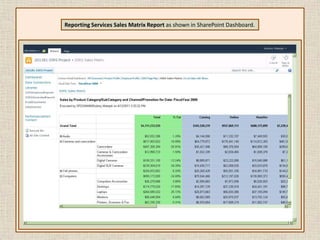
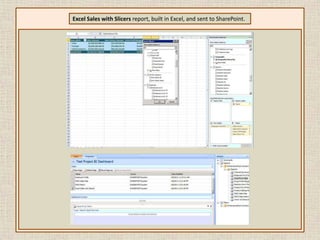
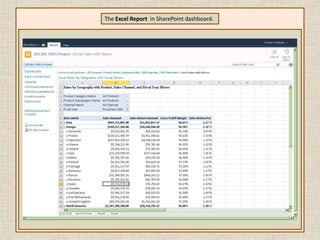
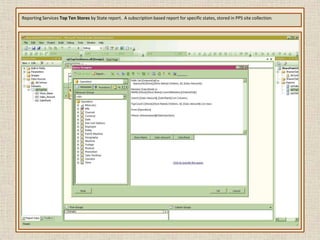
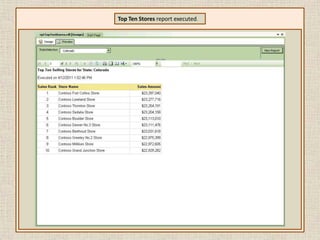
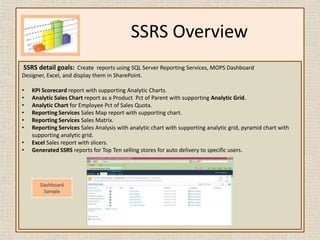
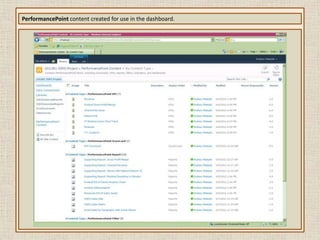
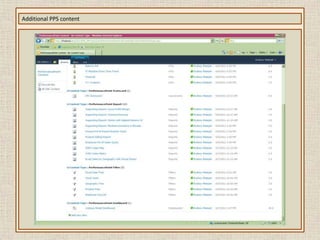
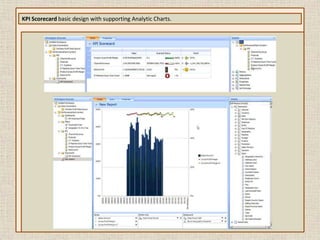
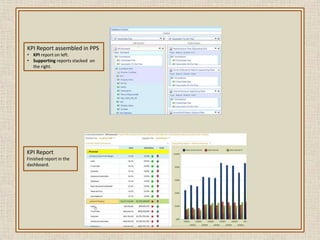
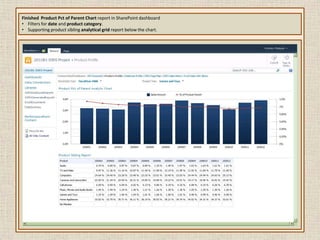
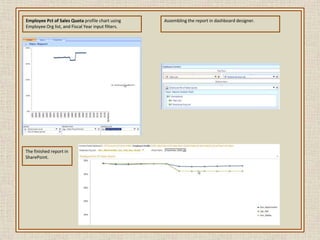
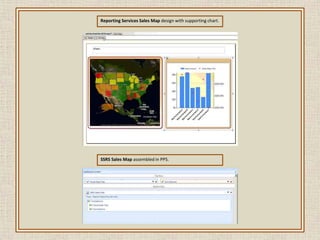
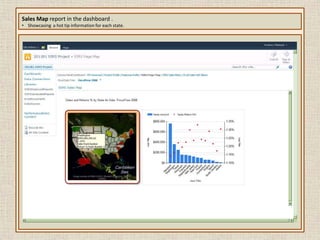
3) Creating SSRS reports including a sales scorecard, maps, and matrices and displaying them on a PerformancePoint dashboard in SharePoint.
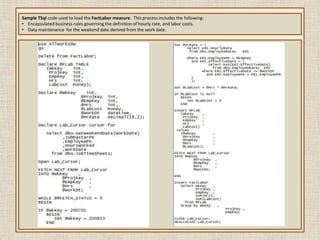
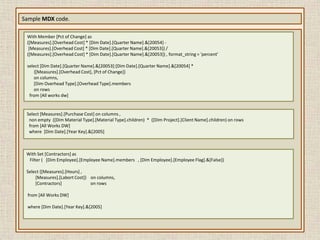
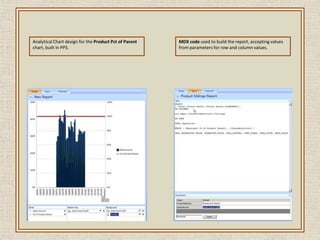
![Sample MDX code.With Member [Pct of Change] as([Measures].[Overhead Cost] * [Dim Date].[Quarter Name].&[20054] - [Measures].[Overhead Cost] * [Dim Date].[Quarter Name].&[20053]) / ([Measures].[Overhead Cost] * [Dim Date].[Quarter Name].&[20053]) , format_string = 'percent'select [Dim Date].[Quarter Name].&[20053]:[Dim Date].[Quarter Name].&[20054] * {[Measures].[Overhead Cost], [Pct of Change]} on columns, [Dim Overhead Type].[Overhead Type].members on rows from [All works dw]Select [Measures].[Purchase Cost] on columns , non empty ([Dim Material Type].[Material Type].children) * ([Dim Project].[Client Name].children) on rows from [All Works DW] where [Dim Date].[Year Key].&[2005]With Set [Contractors] as Filter ( [Dim Employee].[Employee Name].members , [Dim Employee].[Employee Flag].&[False])Select {[Measures].[Hours] , [Measures].[Labort Cost]} on columns, [Contractors] on rows from [All Works DW] where [Dim Date].[Year Key].&[2005]](https://image.slidesharecdn.com/rodneymatejekportfolio-13062530058533-phpapp02-110524110736-phpapp02/85/Rodney-Matejek-Portfolio-34-320.jpg)