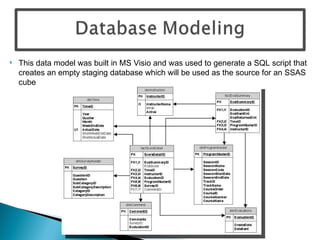
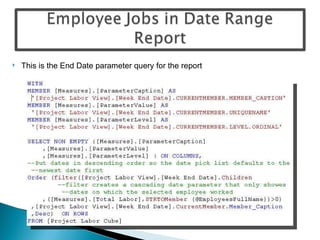
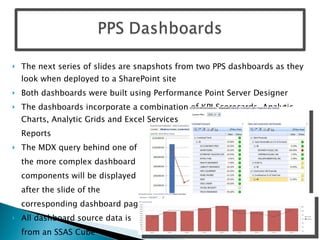
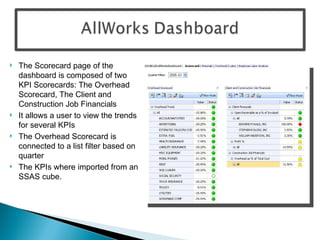
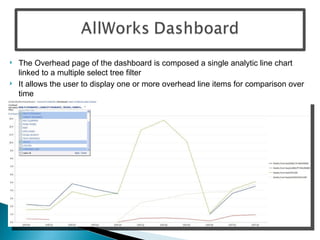
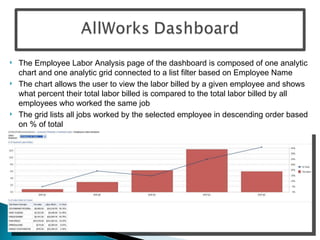
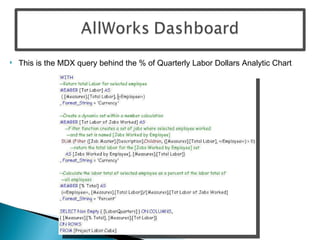
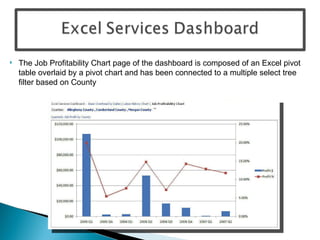
Business  Intelligence   Portfolio Microsoft  Technologies Gregory Lee [email_address] 828.638.5525
Database Modeling T-SQL SQL Server Integration Services (SSIS) SQL Server Analysis Services (SSAS ) MDX SQL Server Reporting Services (SSRS) Performance Point Server (PPS)
This data model was built in MS Visio and was used to generate a SQL script that creates an empty staging database which will be used as the source for an SSAS cube
 
The following Stored Procedure is used as the definition for a parameter in an SSRS report
Master Control Flow
This control flow is called by the Master package A series of Excel files are processed using a Foreach Loop container A Script task is used to maintain a total count of records processed across all Excel files An E-mail will be sent upon success or failure of the package Time Sheet Control Flow
Time Sheet Data Flow
Time Sheet Script Task Counter
My Experience with SSAS involves the following: Creating data sources and data source views Creating cubes using the cube wizard Creating/editing dimension/fact relationships on the dimension usage tab Building dimension hierarchies Creating Calculated Members and KPIs Setting up MOLAP partitions Creating Perspectives Implement data security in cubes using Roles
Two calculated members are used in the KPI
KPIProfitPct setup
KPIProfitPct display in MS Excel 2007
% Change in Current Quarter over Last quarter
Monthly Sales Including QTD, YTD and  All Time
This SSRS report compares weekly overhead expenses for the selected quarter to that of the previous quarter and displays the % change This report contains two quarter parameters: one controls the quarter selection and the other is used to display the previous quarter header Conditional formatting is used to display %  change > 0 in red and  <= 0 in black
This is the primary query for the report
This is the quarter parameter query for the report
This is the previous quarter parameter query
This SSRS report displays hours worked and total labor billed per weekending date within a selected date range for a given employee This report contains three parameters: Employee Name, Begin Date and End Date A cascading parameter is used for Begin Date and End Date so that  only week end dates  where the employee  worked will be available for selection
This is the primary query for the report This is the Employee Name parameter query for the report
This is the Begin Date parameter query for the report
This is the End Date parameter query for the report
The next series of slides are snapshots from two PPS dashboards as they look when deployed to a SharePoint site Both dashboards were built using Performance Point Server Designer The dashboards incorporate a combination of KPI Scorecards, Analytic Charts, Analytic Grids and Excel Services  Reports The MDX query behind one of  the more complex dashboard  components will be displayed  after the slide of the  corresponding dashboard page All dashboard source data is  from an SSAS Cube
The Scorecard page of the dashboard is composed of two KPI Scorecards: The Overhead Scorecard, The Client and Construction Job Financials It allows a user to view the trends for several KPIs The Overhead Scorecard is connected to a list filter based on quarter The KPIs where imported from an SSAS cube.
The Overhead page of the dashboard is composed a single analytic line chart linked to a multiple select tree filter It allows the user to display one or more overhead line items for comparison over time
The Employee Labor Analysis page of the dashboard is composed of one analytic chart and one analytic grid connected to a list filter based on Employee Name The chart allows the user to view the labor billed by a given employee and shows what percent their total labor billed is compared to the total labor billed by all employees who worked the same job The grid lists all jobs worked by the selected employee in descending order based on % of total
This is the MDX query behind the % of Quarterly Labor Dollars Analytic Chart
The Job Profitability Chart page of the dashboard is composed of an Excel pivot table overlaid by a pivot chart and has been connected to a multiple select tree filter based on County
My experience with SharePoint Server is related to the following: Creating new SharePoint sites  Adding Libraries to a SharePoint site Adding/Editing Web Parts to existing pages  Deploying SSRS documents, Excel spreadsheets and PPS Dashboards into specified document libraries Setting up shared schedules Scheduling SSRS reports using an independent or a shared schedule Granting users and/or groups access to libraries and library content

MS Bi Portfolio Gregory Lee

  • 1.
    Business Intelligence Portfolio Microsoft Technologies Gregory Lee [email_address] 828.638.5525
  • 2.
    Database Modeling T-SQLSQL Server Integration Services (SSIS) SQL Server Analysis Services (SSAS ) MDX SQL Server Reporting Services (SSRS) Performance Point Server (PPS)
  • 3.
    This data modelwas built in MS Visio and was used to generate a SQL script that creates an empty staging database which will be used as the source for an SSAS cube
  • 4.
  • 5.
    The following StoredProcedure is used as the definition for a parameter in an SSRS report
  • 6.
  • 7.
    This control flowis called by the Master package A series of Excel files are processed using a Foreach Loop container A Script task is used to maintain a total count of records processed across all Excel files An E-mail will be sent upon success or failure of the package Time Sheet Control Flow
  • 8.
  • 9.
    Time Sheet ScriptTask Counter
  • 10.
    My Experience withSSAS involves the following: Creating data sources and data source views Creating cubes using the cube wizard Creating/editing dimension/fact relationships on the dimension usage tab Building dimension hierarchies Creating Calculated Members and KPIs Setting up MOLAP partitions Creating Perspectives Implement data security in cubes using Roles
  • 11.
    Two calculated membersare used in the KPI
  • 12.
  • 13.
  • 14.
    % Change inCurrent Quarter over Last quarter
  • 15.
    Monthly Sales IncludingQTD, YTD and All Time
  • 16.
    This SSRS reportcompares weekly overhead expenses for the selected quarter to that of the previous quarter and displays the % change This report contains two quarter parameters: one controls the quarter selection and the other is used to display the previous quarter header Conditional formatting is used to display % change > 0 in red and <= 0 in black
  • 17.
    This is theprimary query for the report
  • 18.
    This is thequarter parameter query for the report
  • 19.
    This is theprevious quarter parameter query
  • 20.
    This SSRS reportdisplays hours worked and total labor billed per weekending date within a selected date range for a given employee This report contains three parameters: Employee Name, Begin Date and End Date A cascading parameter is used for Begin Date and End Date so that only week end dates where the employee worked will be available for selection
  • 21.
    This is theprimary query for the report This is the Employee Name parameter query for the report
  • 22.
    This is theBegin Date parameter query for the report
  • 23.
    This is theEnd Date parameter query for the report
  • 24.
    The next seriesof slides are snapshots from two PPS dashboards as they look when deployed to a SharePoint site Both dashboards were built using Performance Point Server Designer The dashboards incorporate a combination of KPI Scorecards, Analytic Charts, Analytic Grids and Excel Services Reports The MDX query behind one of the more complex dashboard components will be displayed after the slide of the corresponding dashboard page All dashboard source data is from an SSAS Cube
  • 25.
    The Scorecard pageof the dashboard is composed of two KPI Scorecards: The Overhead Scorecard, The Client and Construction Job Financials It allows a user to view the trends for several KPIs The Overhead Scorecard is connected to a list filter based on quarter The KPIs where imported from an SSAS cube.
  • 26.
    The Overhead pageof the dashboard is composed a single analytic line chart linked to a multiple select tree filter It allows the user to display one or more overhead line items for comparison over time
  • 27.
    The Employee LaborAnalysis page of the dashboard is composed of one analytic chart and one analytic grid connected to a list filter based on Employee Name The chart allows the user to view the labor billed by a given employee and shows what percent their total labor billed is compared to the total labor billed by all employees who worked the same job The grid lists all jobs worked by the selected employee in descending order based on % of total
  • 28.
    This is theMDX query behind the % of Quarterly Labor Dollars Analytic Chart
  • 29.
    The Job ProfitabilityChart page of the dashboard is composed of an Excel pivot table overlaid by a pivot chart and has been connected to a multiple select tree filter based on County
  • 30.
    My experience withSharePoint Server is related to the following: Creating new SharePoint sites Adding Libraries to a SharePoint site Adding/Editing Web Parts to existing pages Deploying SSRS documents, Excel spreadsheets and PPS Dashboards into specified document libraries Setting up shared schedules Scheduling SSRS reports using an independent or a shared schedule Granting users and/or groups access to libraries and library content