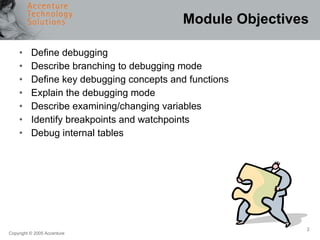
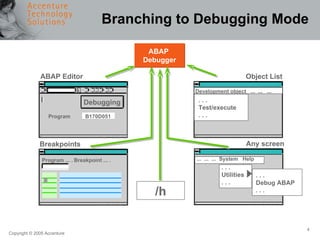
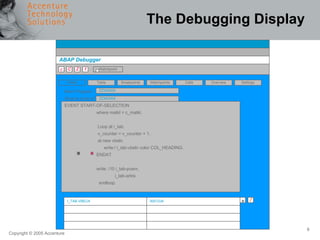
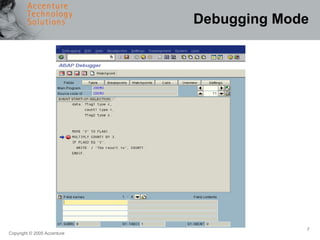
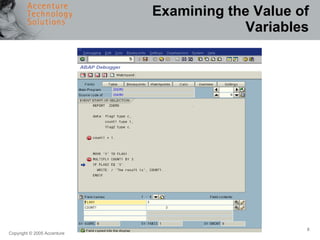
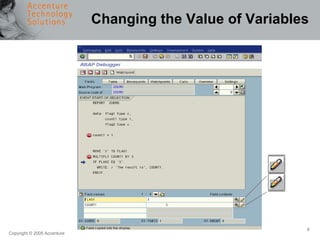
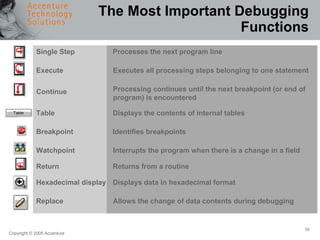
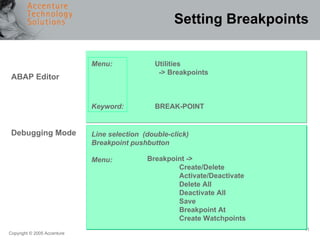
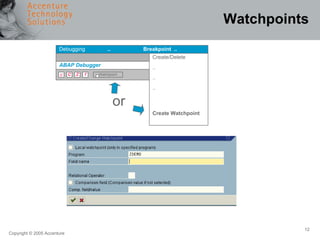
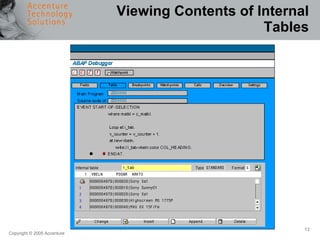
Debugging
Module Objectives Define debugging Describe branching to debugging mode Define key debugging concepts and functions Explain the debugging mode Describe examining/changing variables Identify breakpoints and watchpoints Debug internal tables
What is Debugging? Tool used to identify and eliminate errors in ABAP programs Allows the verification of program logic in a step-by-step manner by examining the results of individual statements
Branching to Debugging Mode Program ... . Breakpoint ... . ABAP Editor ABAP  Debugger Debugging Program  B170D051 Breakpoints Object List Development object  ...  ...  ... . . . Test/execute . . . Any screen ...  ...  ...  System  Help . . . Utilities . . . . . . Debug ABAP . . . /h
Key Debugging Concepts Debugger modes Examining the value of variables Changing the value of variables Setting breakpoints Setting watchpoints Viewing contents of internal tables
The Debugging Display  ABAP Debugger Watchpoint f Z C C Table Breakpoints Watchpoints Calls Overview Settings Fields Main Program Source code of EVENT START-OF-SELECTION where matkl = c_matkl.    Loop at i_tab.    v_counter = v_counter + 1.    at new vbeln.    write:/ i_tab-vbeln color COL_HEADING.  ENDAT.  write: /10 i_tab-posnr,    i_tab-arktx.    endloop.  ZZXXXXX ZZXXXXX I_TAB-VBELN 0001234 + /
Debugging Mode
Examining the Value of Variables
Changing the Value of Variables
The Most Important Debugging Functions Single Step Execute Continue Table Breakpoint Watchpoint Return Hexadecimal display Replace Processes the next program line Allows the change of data contents during debugging Processing continues until the next breakpoint (or end of  program) is encountered Displays the contents of internal tables Displays data in hexadecimal format Interrupts the program when there is a change in a field Identifies breakpoints Executes all processing steps belonging to one statement Returns from a routine
Setting Breakpoints Menu: Keyword: Utilities -> Breakpoints BREAK-POINT Line selection  (double-click) Breakpoint pushbutton Menu: ABAP Editor Debugging Mode Breakpoint ->  Create/Delete Activate/Deactivate  Delete All Deactivate All Save Breakpoint At Create Watchpoints
Watchpoints Debugging   ..  Breakpoint  .. ABAP Debugger Watchpoint f Z C C or Create/Delete .. .. .. Create Watchpoint
Viewing Contents of Internal Tables
Exercise Exercise 7  – Use the ABAP Debugger, 20 minutes
Question and Answers Any questions?

0106 debugging

  • 1.
  • 2.
    Module Objectives Definedebugging Describe branching to debugging mode Define key debugging concepts and functions Explain the debugging mode Describe examining/changing variables Identify breakpoints and watchpoints Debug internal tables
  • 3.
    What is Debugging?Tool used to identify and eliminate errors in ABAP programs Allows the verification of program logic in a step-by-step manner by examining the results of individual statements
  • 4.
    Branching to DebuggingMode Program ... . Breakpoint ... . ABAP Editor ABAP Debugger Debugging Program B170D051 Breakpoints Object List Development object ... ... ... . . . Test/execute . . . Any screen ... ... ... System Help . . . Utilities . . . . . . Debug ABAP . . . /h
  • 5.
    Key Debugging ConceptsDebugger modes Examining the value of variables Changing the value of variables Setting breakpoints Setting watchpoints Viewing contents of internal tables
  • 6.
    The Debugging Display ABAP Debugger Watchpoint f Z C C Table Breakpoints Watchpoints Calls Overview Settings Fields Main Program Source code of EVENT START-OF-SELECTION where matkl = c_matkl. Loop at i_tab. v_counter = v_counter + 1. at new vbeln. write:/ i_tab-vbeln color COL_HEADING. ENDAT. write: /10 i_tab-posnr, i_tab-arktx. endloop. ZZXXXXX ZZXXXXX I_TAB-VBELN 0001234 + /
  • 7.
  • 8.
    Examining the Valueof Variables
  • 9.
    Changing the Valueof Variables
  • 10.
    The Most ImportantDebugging Functions Single Step Execute Continue Table Breakpoint Watchpoint Return Hexadecimal display Replace Processes the next program line Allows the change of data contents during debugging Processing continues until the next breakpoint (or end of program) is encountered Displays the contents of internal tables Displays data in hexadecimal format Interrupts the program when there is a change in a field Identifies breakpoints Executes all processing steps belonging to one statement Returns from a routine
  • 11.
    Setting Breakpoints Menu:Keyword: Utilities -> Breakpoints BREAK-POINT Line selection (double-click) Breakpoint pushbutton Menu: ABAP Editor Debugging Mode Breakpoint -> Create/Delete Activate/Deactivate Delete All Deactivate All Save Breakpoint At Create Watchpoints
  • 12.
    Watchpoints Debugging .. Breakpoint .. ABAP Debugger Watchpoint f Z C C or Create/Delete .. .. .. Create Watchpoint
  • 13.
    Viewing Contents ofInternal Tables
  • 14.
    Exercise Exercise 7 – Use the ABAP Debugger, 20 minutes
  • 15.
    Question and AnswersAny questions?

Editor's Notes

  • #4 ATS App. Prog. – ABAP Programming Module Presentations When should debugging be used? When a program is syntactically correct but has logical flaws When actual results do not match expected results When component testing a program Anytime detailed examination of source code logic is required
  • #5 Several options exist for debugging a program: Start the program using the Debugging function (from the ABAP Editor initial screen, select either the Debugging pushbutton, or via menu option Program -> Execute -> Debugging From the Repository Browser’s object list, use the menu option Development Object -> Test/Execute and then select Debugging from the pop-up dialogue box. From any screen, select Systems -> Utilities -> Debug ABAP. From any screen, type /h in the system command line and press ENTER. Set break-points in the program and execute it normally. When the break-point is encountered, the program will enter the debug mode.
  • #7 The pushbuttons across the top of the screen provide links to other debugging information and will be discussed throughout this Module. The source code window displays the statements currently being executed or may be used to scroll through the code to set breakpoints. Breakpoints are identified with a stop sign and will be discussed in detail later in this Module. The field evaluation window displays the value of selected fields.
  • #8 When entering the debugger, there is a choice of seven different views: Fields - displays the field’s content and technical characteristics Table - displays the contents of an internal table Breakpoint - interrupts a program at a given line of code. Breakpoints can be static or dynamic. Watchpoint - interrupts a program only when there is a change in the contents of a particular field or filed string. It is possible to define multiple watchpoints, attach conditions to them, and link two or more watchpoints using a relational operator. Calls - displays an active event chain and the call sequence up to the current breakpoint. The most recent active call appears at the top of the list and the previous calls appear underneath. Overview - displays the structure of the programs being debugged. This view shows the event names and event types within a program and indicates which section is currently being used. Settings - displays the different options and error handling a user has when debugging
  • #9 ATS App. Prog. – ABAP Programming Module Presentations To display the value of a particular variable, double-click on the variable, which will copy it to the field evaluation window. The variable name may also be typed directly in the Field names column of the field evaluation window.
  • #10 While executing the program in debug mode, the value of a field may be modified. Once a field has been selected and the corresponding values are displayed in the field evaluation window, the field value may be manually changed in the Field contents column. The Change pushbutton (pencil icon) should then be selected to activate the field value change.
  • #12 There are different methods of setting breakpoints for a program: ABAP Editor Position the cursor on a program line. Save the breakpoint by selecting Utilities -> Break-points -> Set Or, use the ABAP statement BREAK-POINT to set breakpoints in the program. You can set personalised breakpoints using the statement BREAK USERNAME. Debugging mode Position the cursor on a program line. Set a breakpoint with F2, double-click, or select via Break-point -> Set/ Delete. The breakpoint at function allows you to set breakpoints at strategic points in the program code. The breakpoint button displays an overview of the breakpoints that have been set within the program.
  • #13 A watchpoint is a signal within a program’s code that tells the ABAP runtime processor to interrupt a program at a particular point in the code. Watchpoints are set from the debugger. Set and remove watchpoints as needed. Watchpoints are field-specific. Use a watchpoint to observe the changes to a particular field. The debugger interrupts the program when the field’s contents change. Watchpoints can be set either locally and globally. Global watchpoints are valid in all programs that are called. Local watchpoints are only valid within a specified program. Watchpoints: Up to five watchpoints can be defined Conditional watchpoints can be defined using <, <=, =, <>, >=, > Watchpoints can be combined with AND or OR Local and global watchpoints (i.e., stop only in my program) can be set defined. Menu from Debugging mode: Watchpoint -> Create Watchpoint.
  • #14 The contents of internal tables may be displayed by selecting the Tables pushbutton at the top of the Debugging screen.