Download to read offline


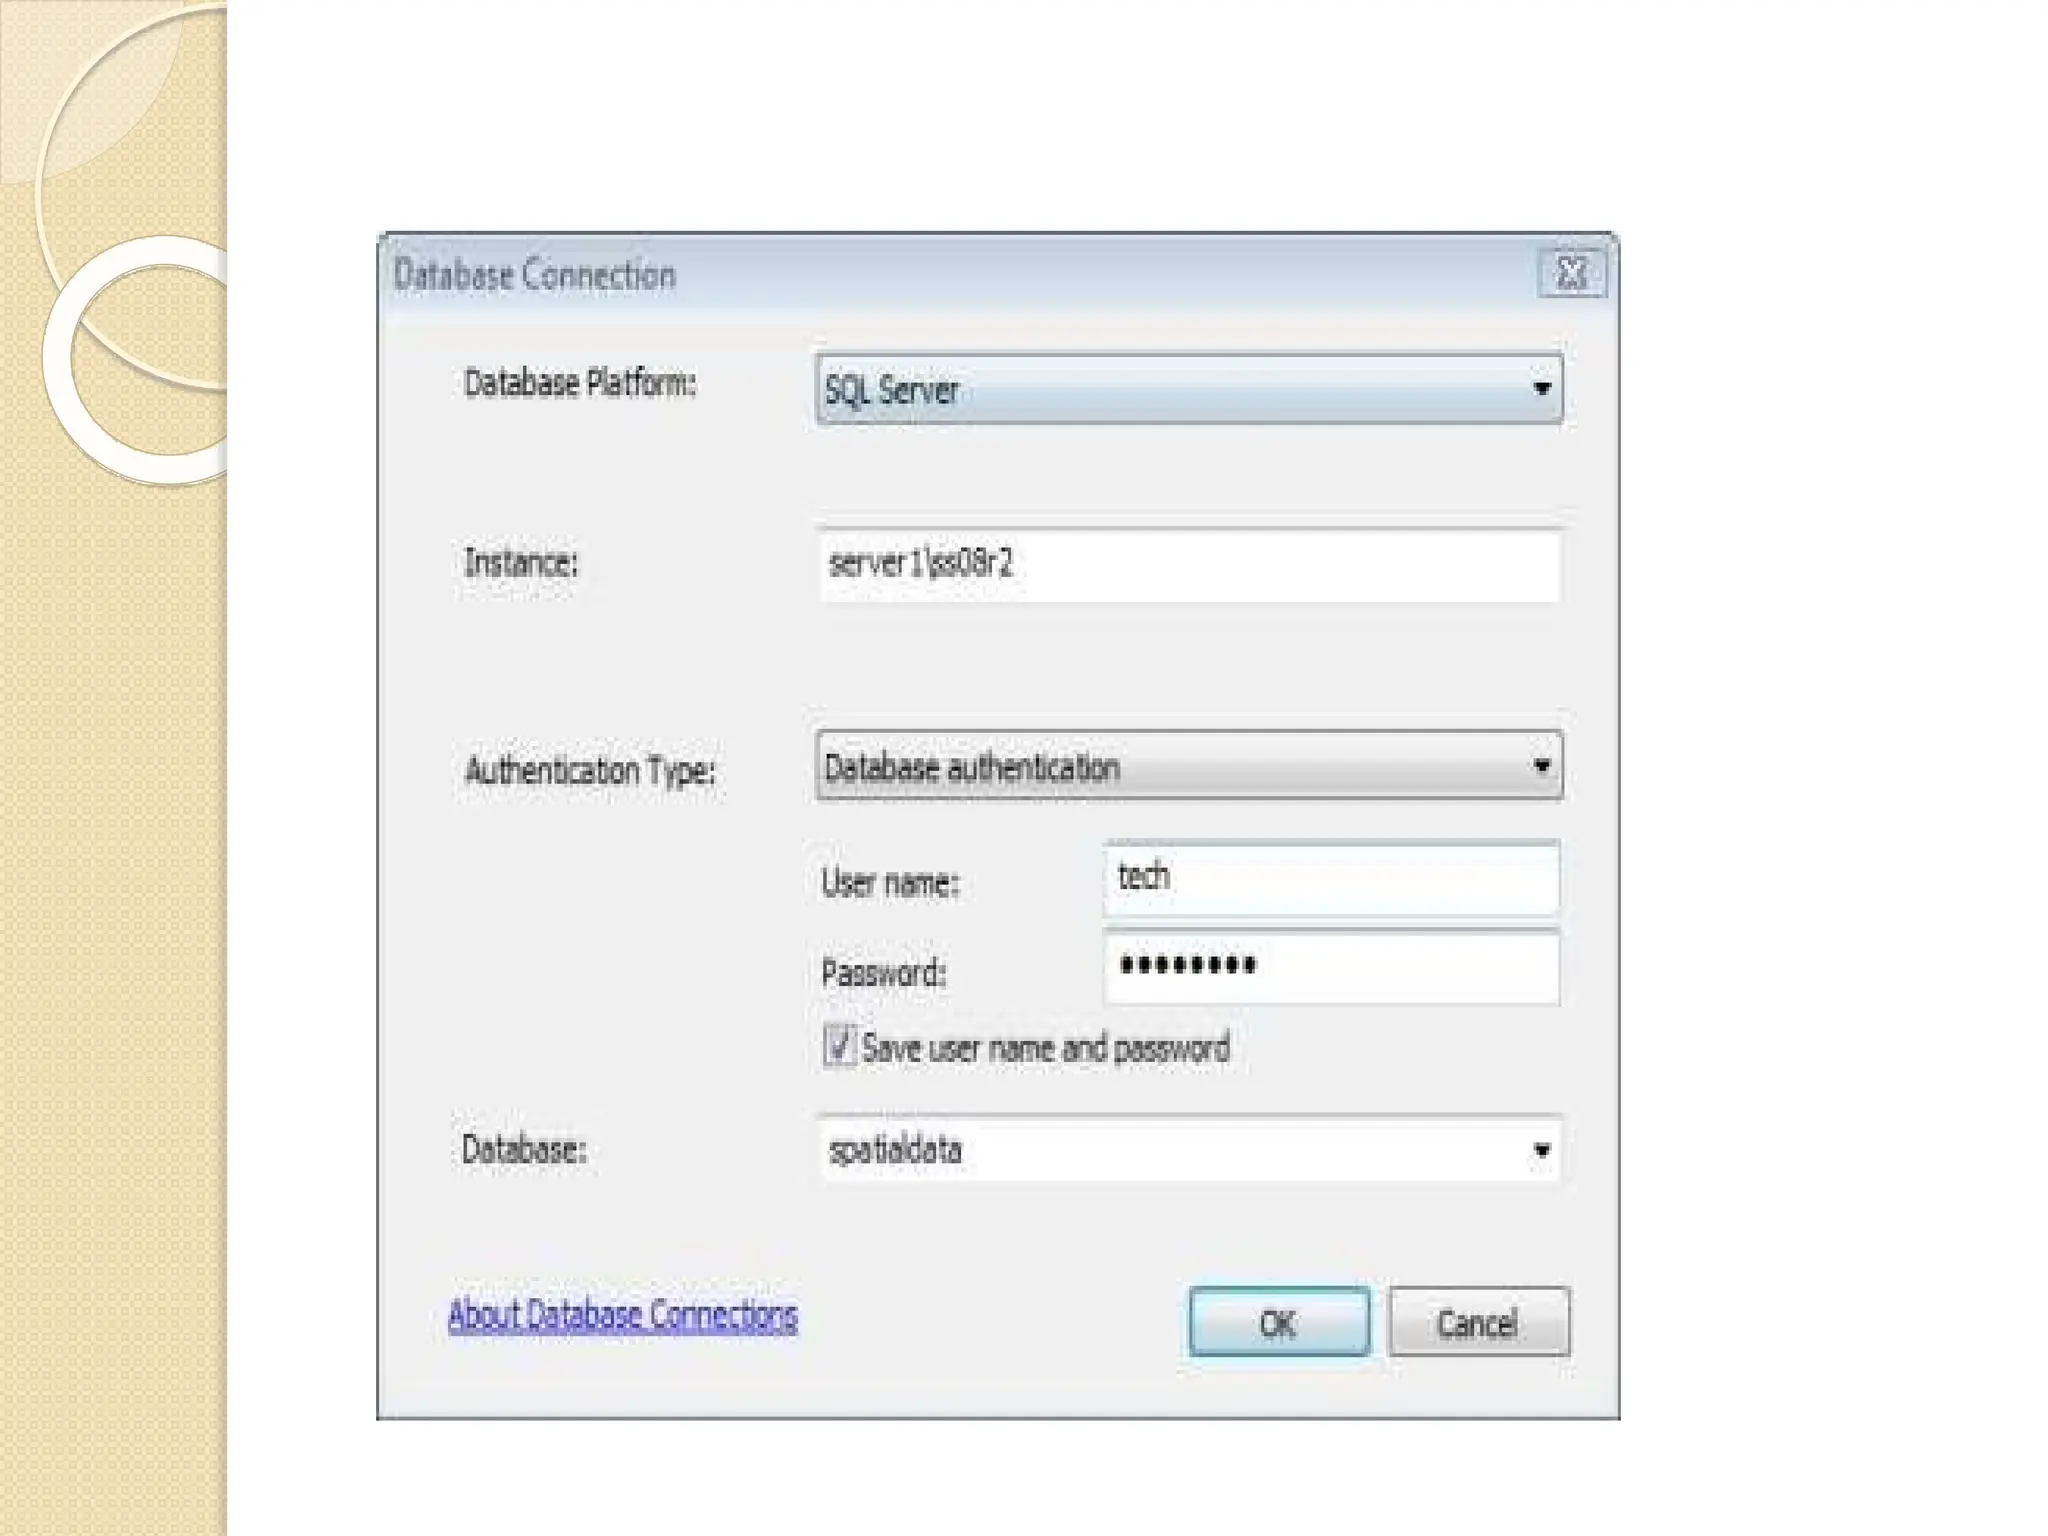
![Connect to the database
⚫ The
following
steps describe using the Database
Connection dialog box.
1. Expand Database Connections in the Catalog
tree in ArcGIS or ArcCatalog and double-click
Add Database Connection.
2. Choose SQL Server from the
Database Platform drop-down list.
3. Type the SQL Server instance name
in
the Instance text box.
For example, if user are using a default
SQL Server instance, user can specify the instance name
or the IP address of the server in the Instance text
box. If specifying an IPV6 address, enclose the
address in brackets. For example, if the IPV6 address
of the server is 2000:ab1:0:2:f333:c432:55f6:d7ee,
type [2000:ab1:0:2:f333:c432:55f6:d7ee]
in the Instance text box.](https://image.slidesharecdn.com/digitizationandgps-241118061133-6dbcafe4/75/data-input-technique-Digitization-and-GPS-pptx-116-2048.jpg)

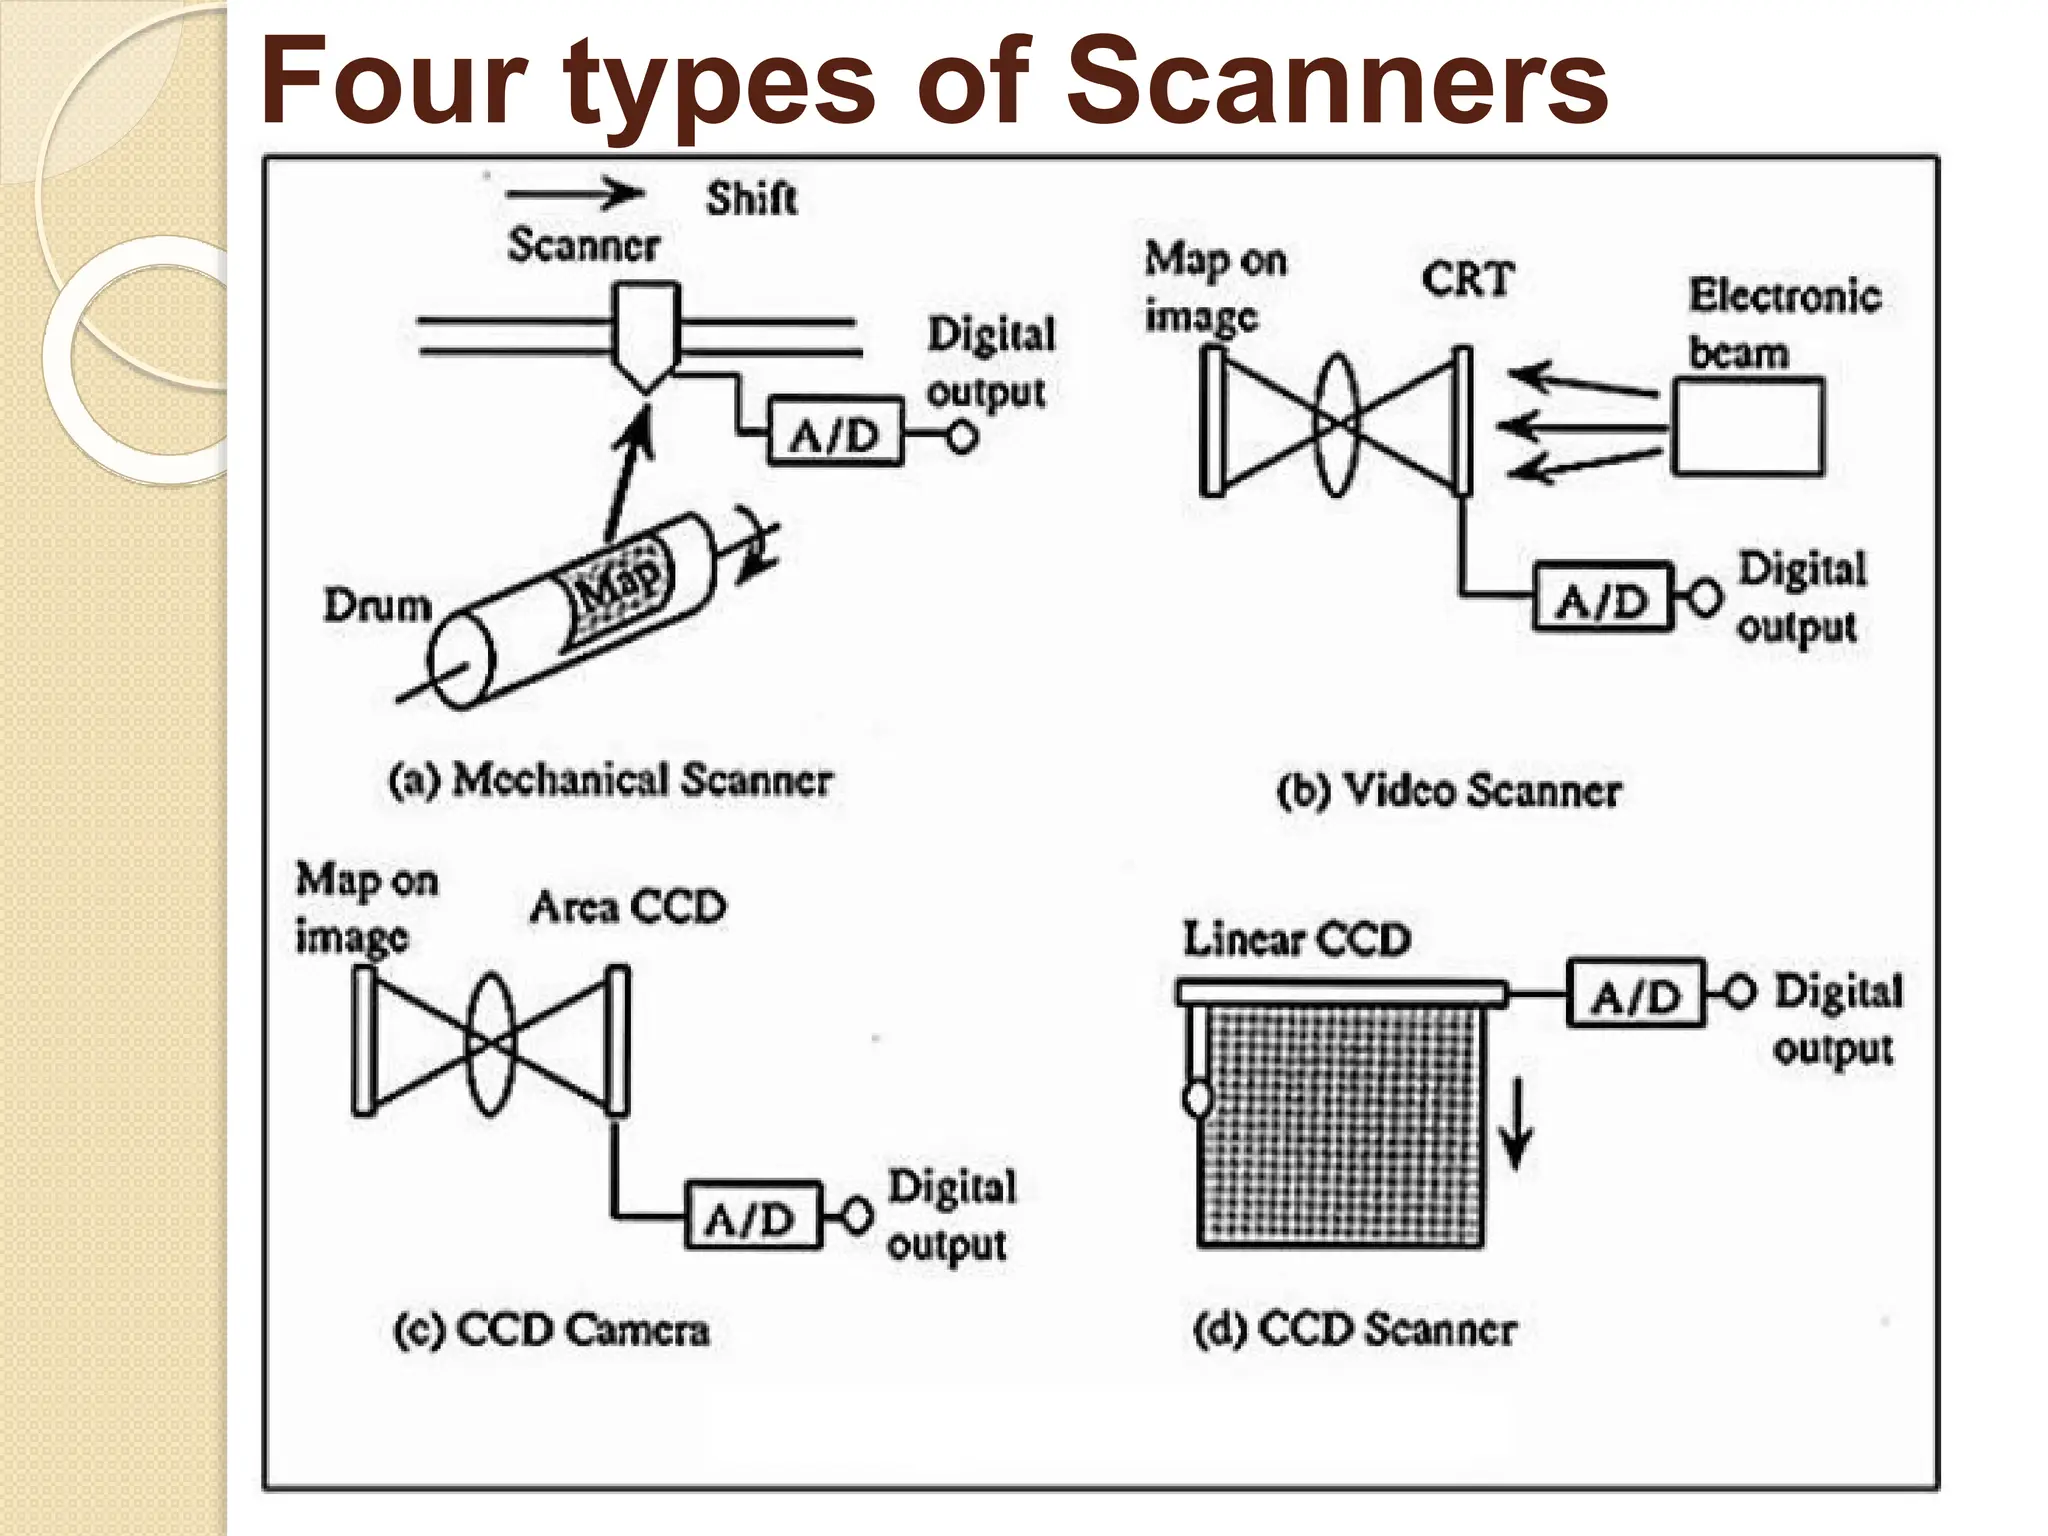
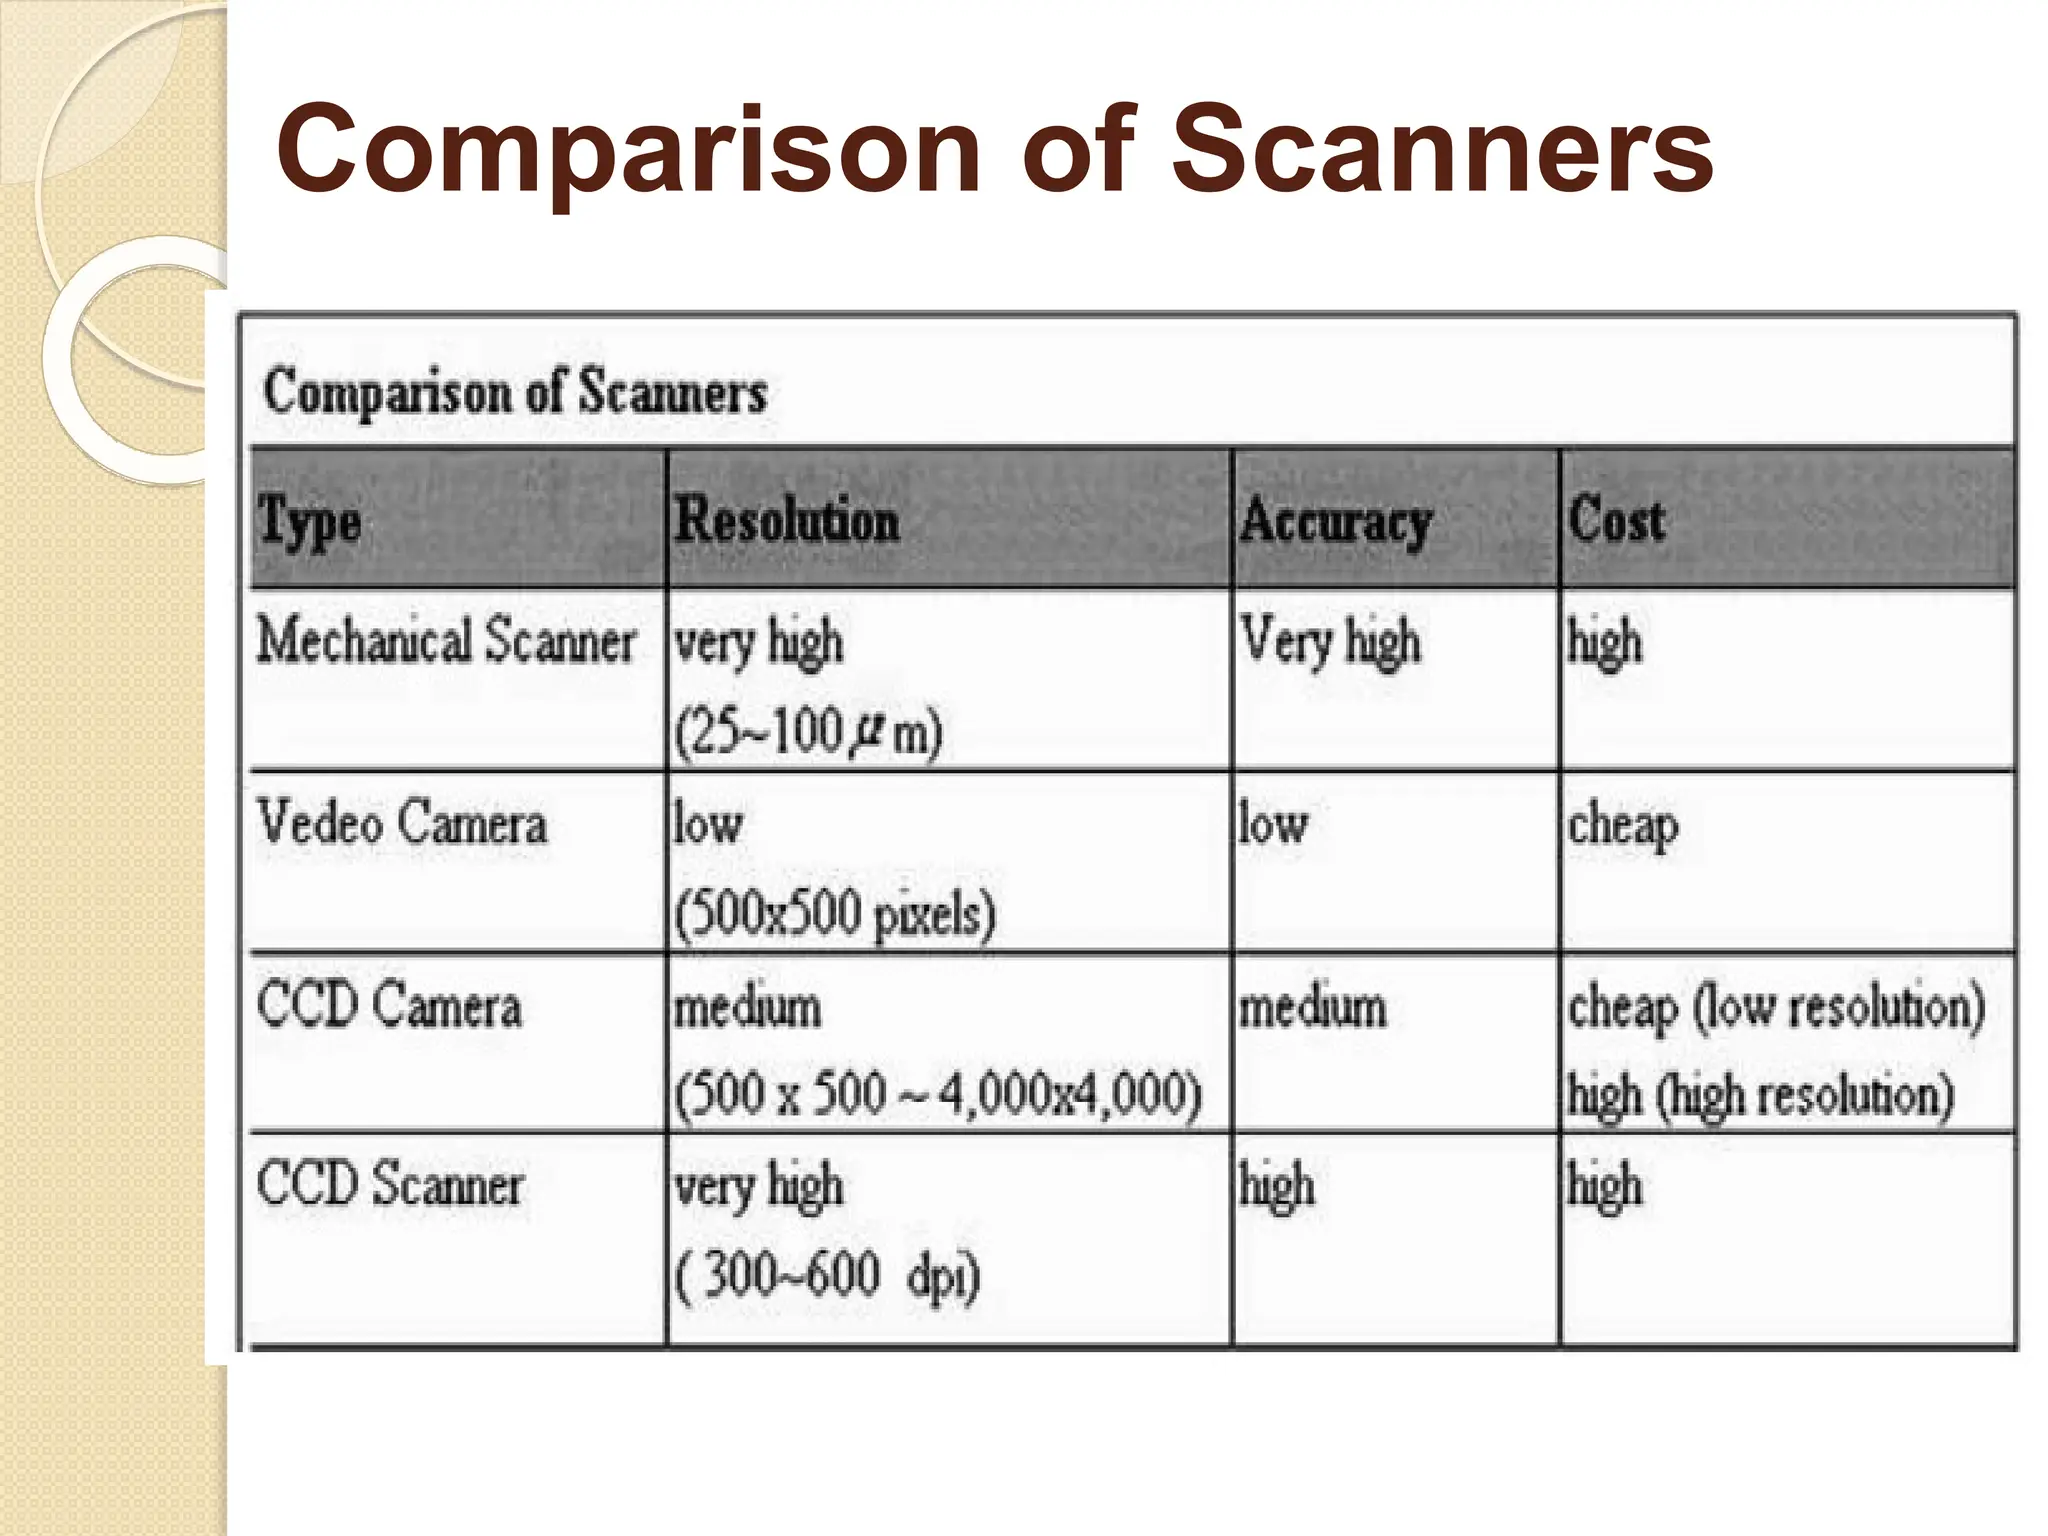
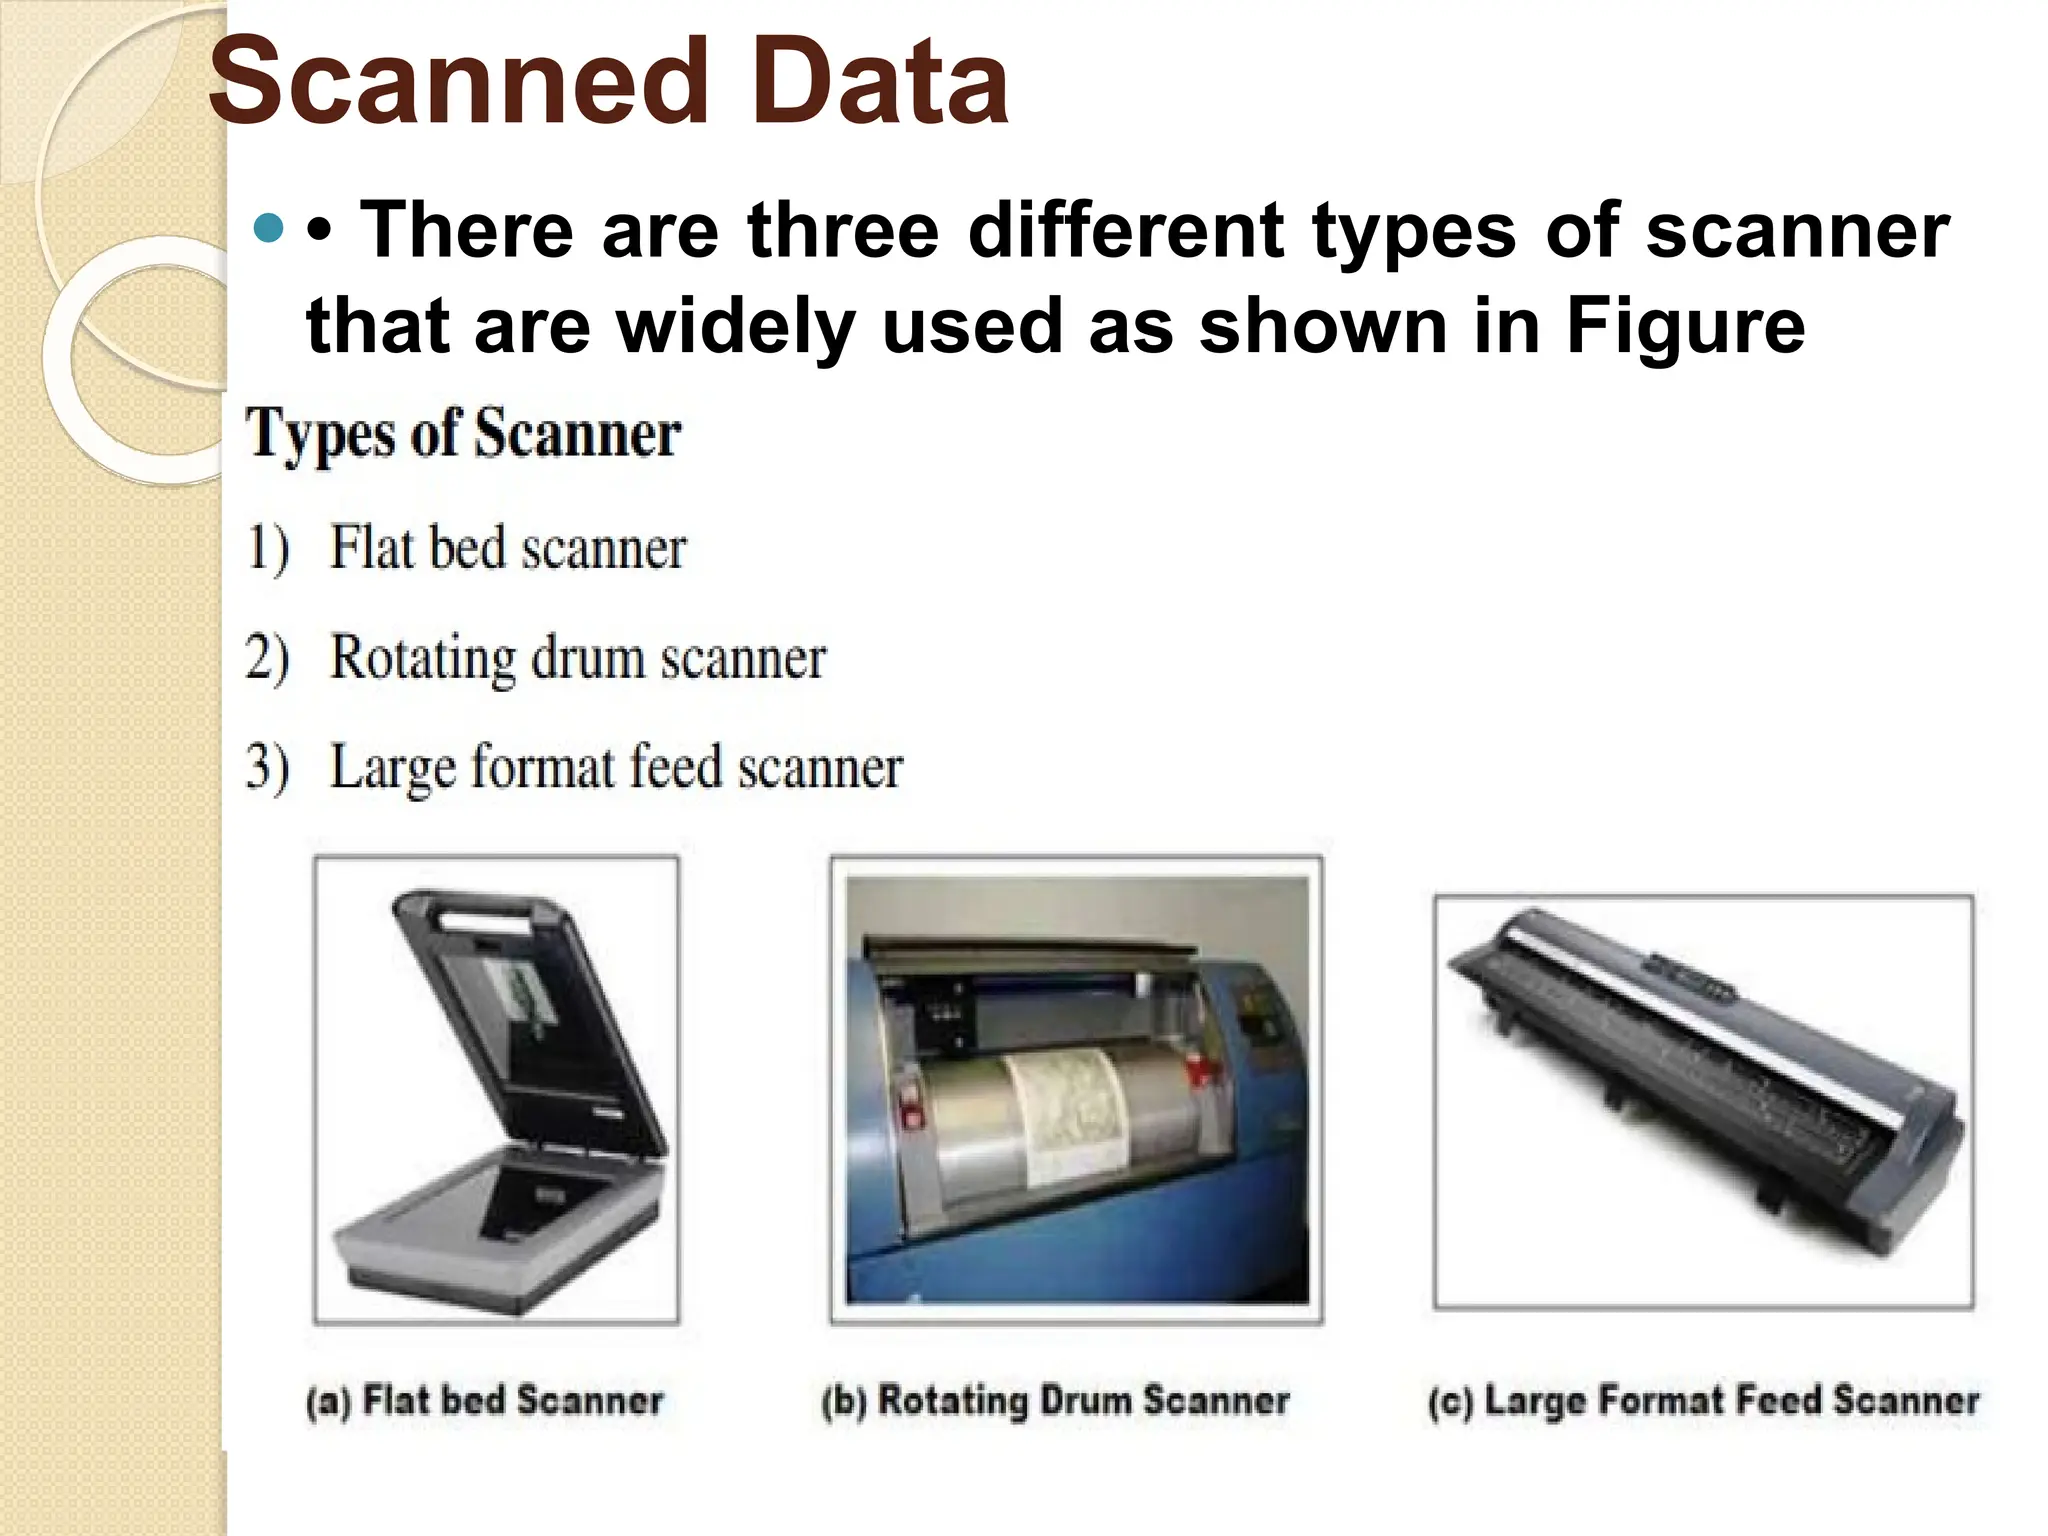
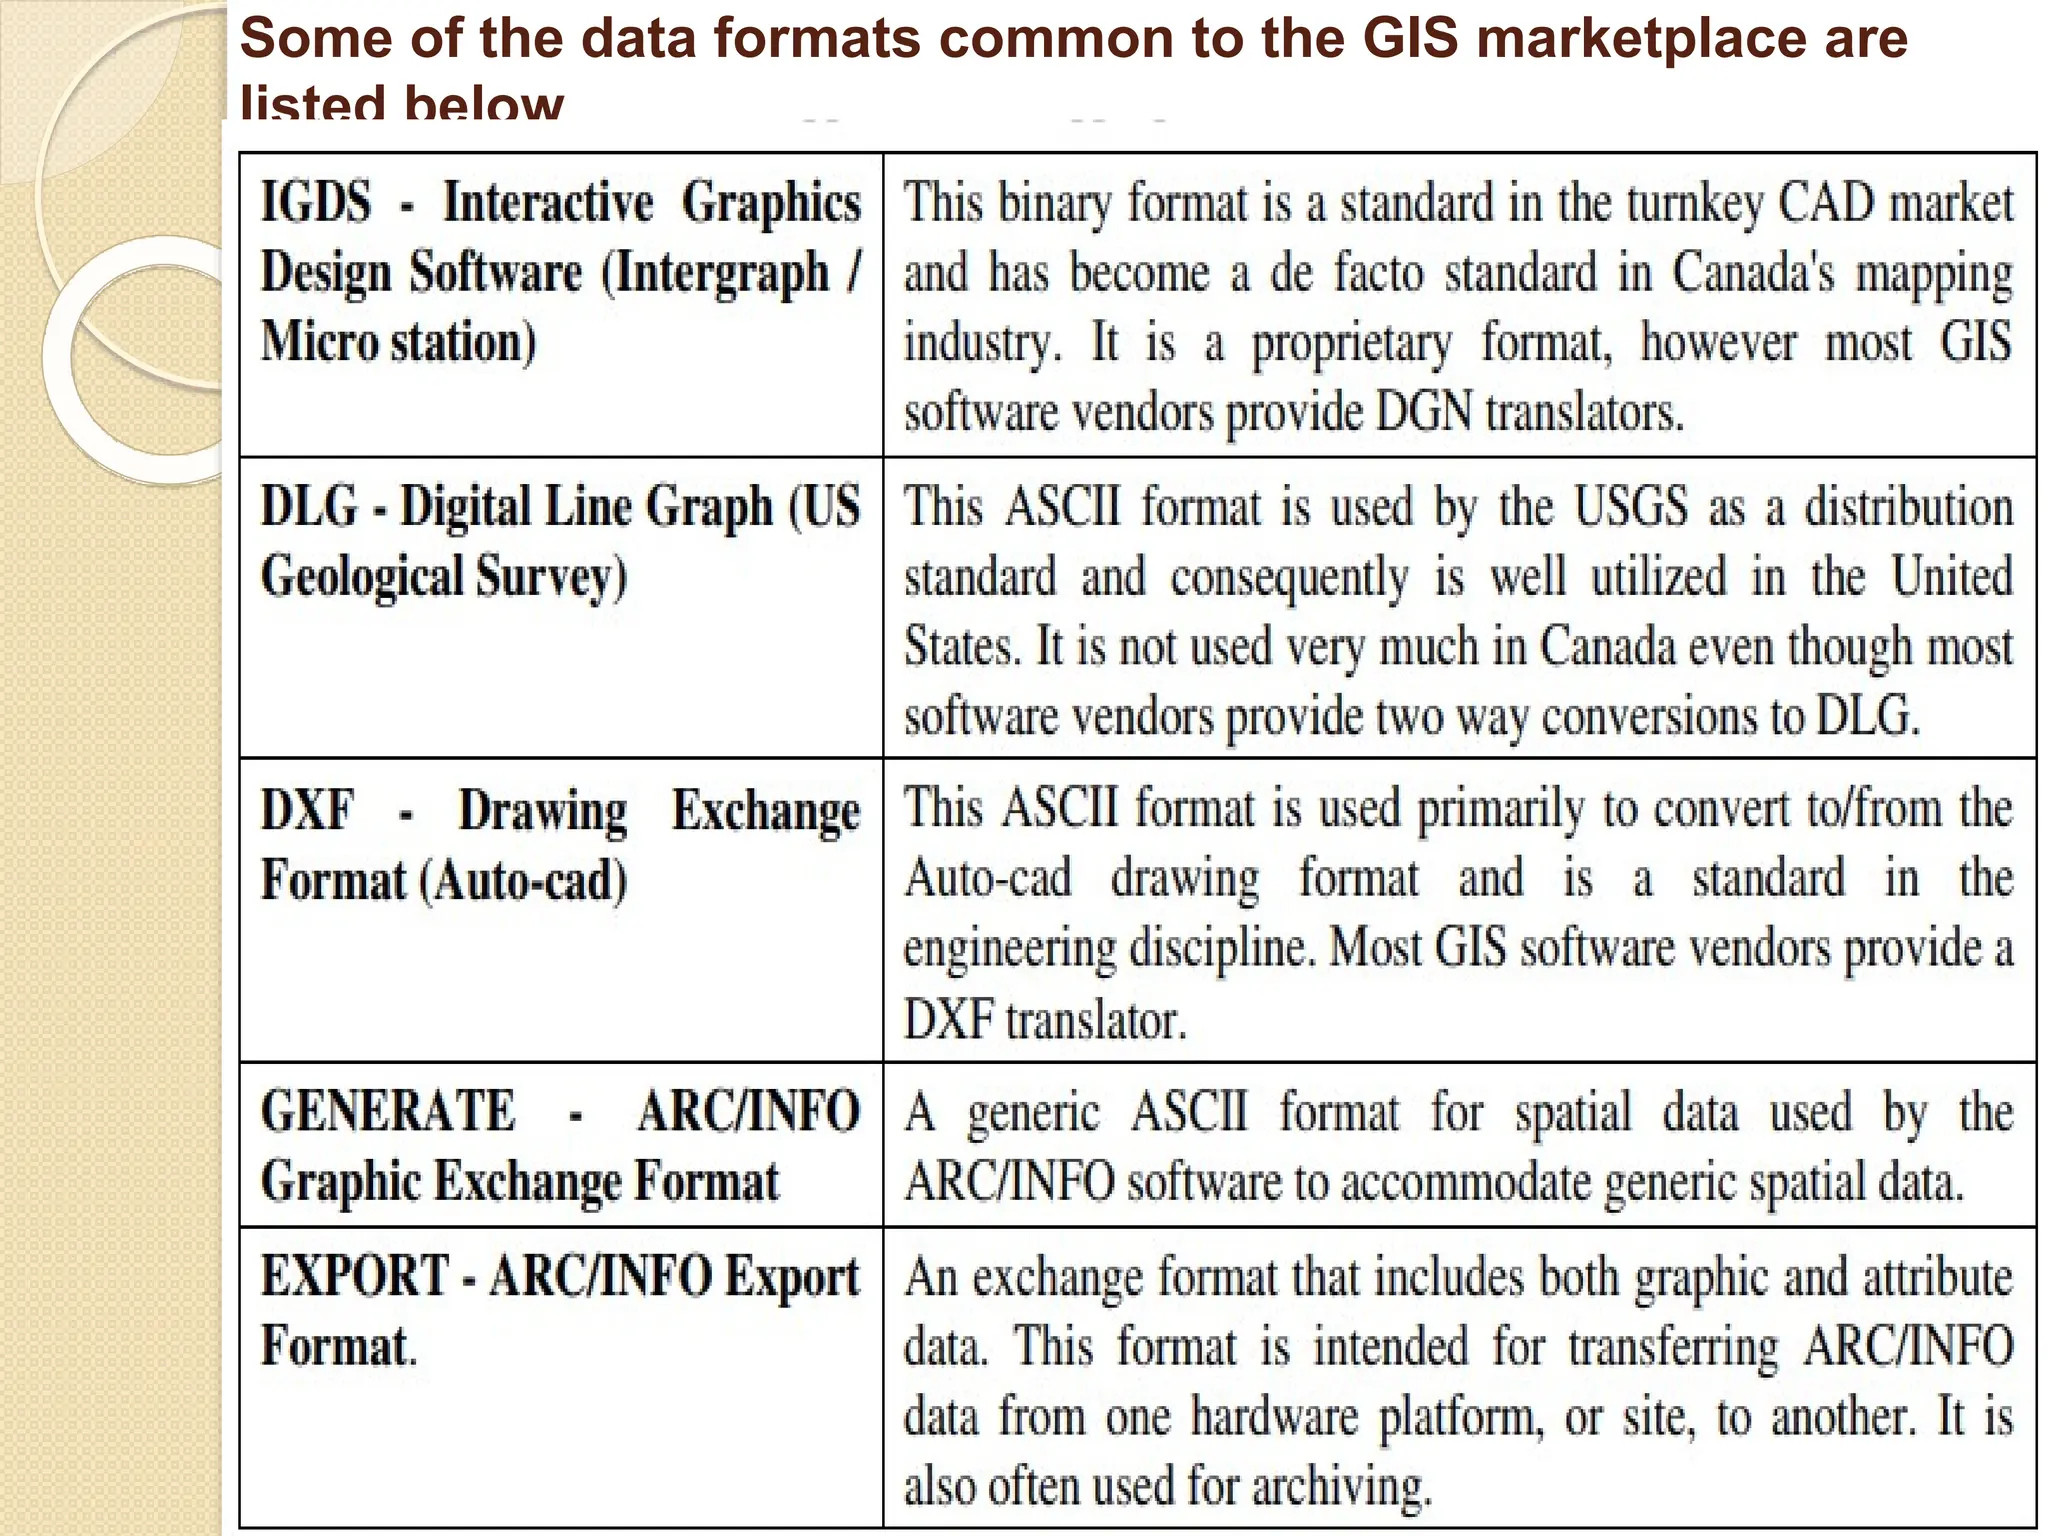
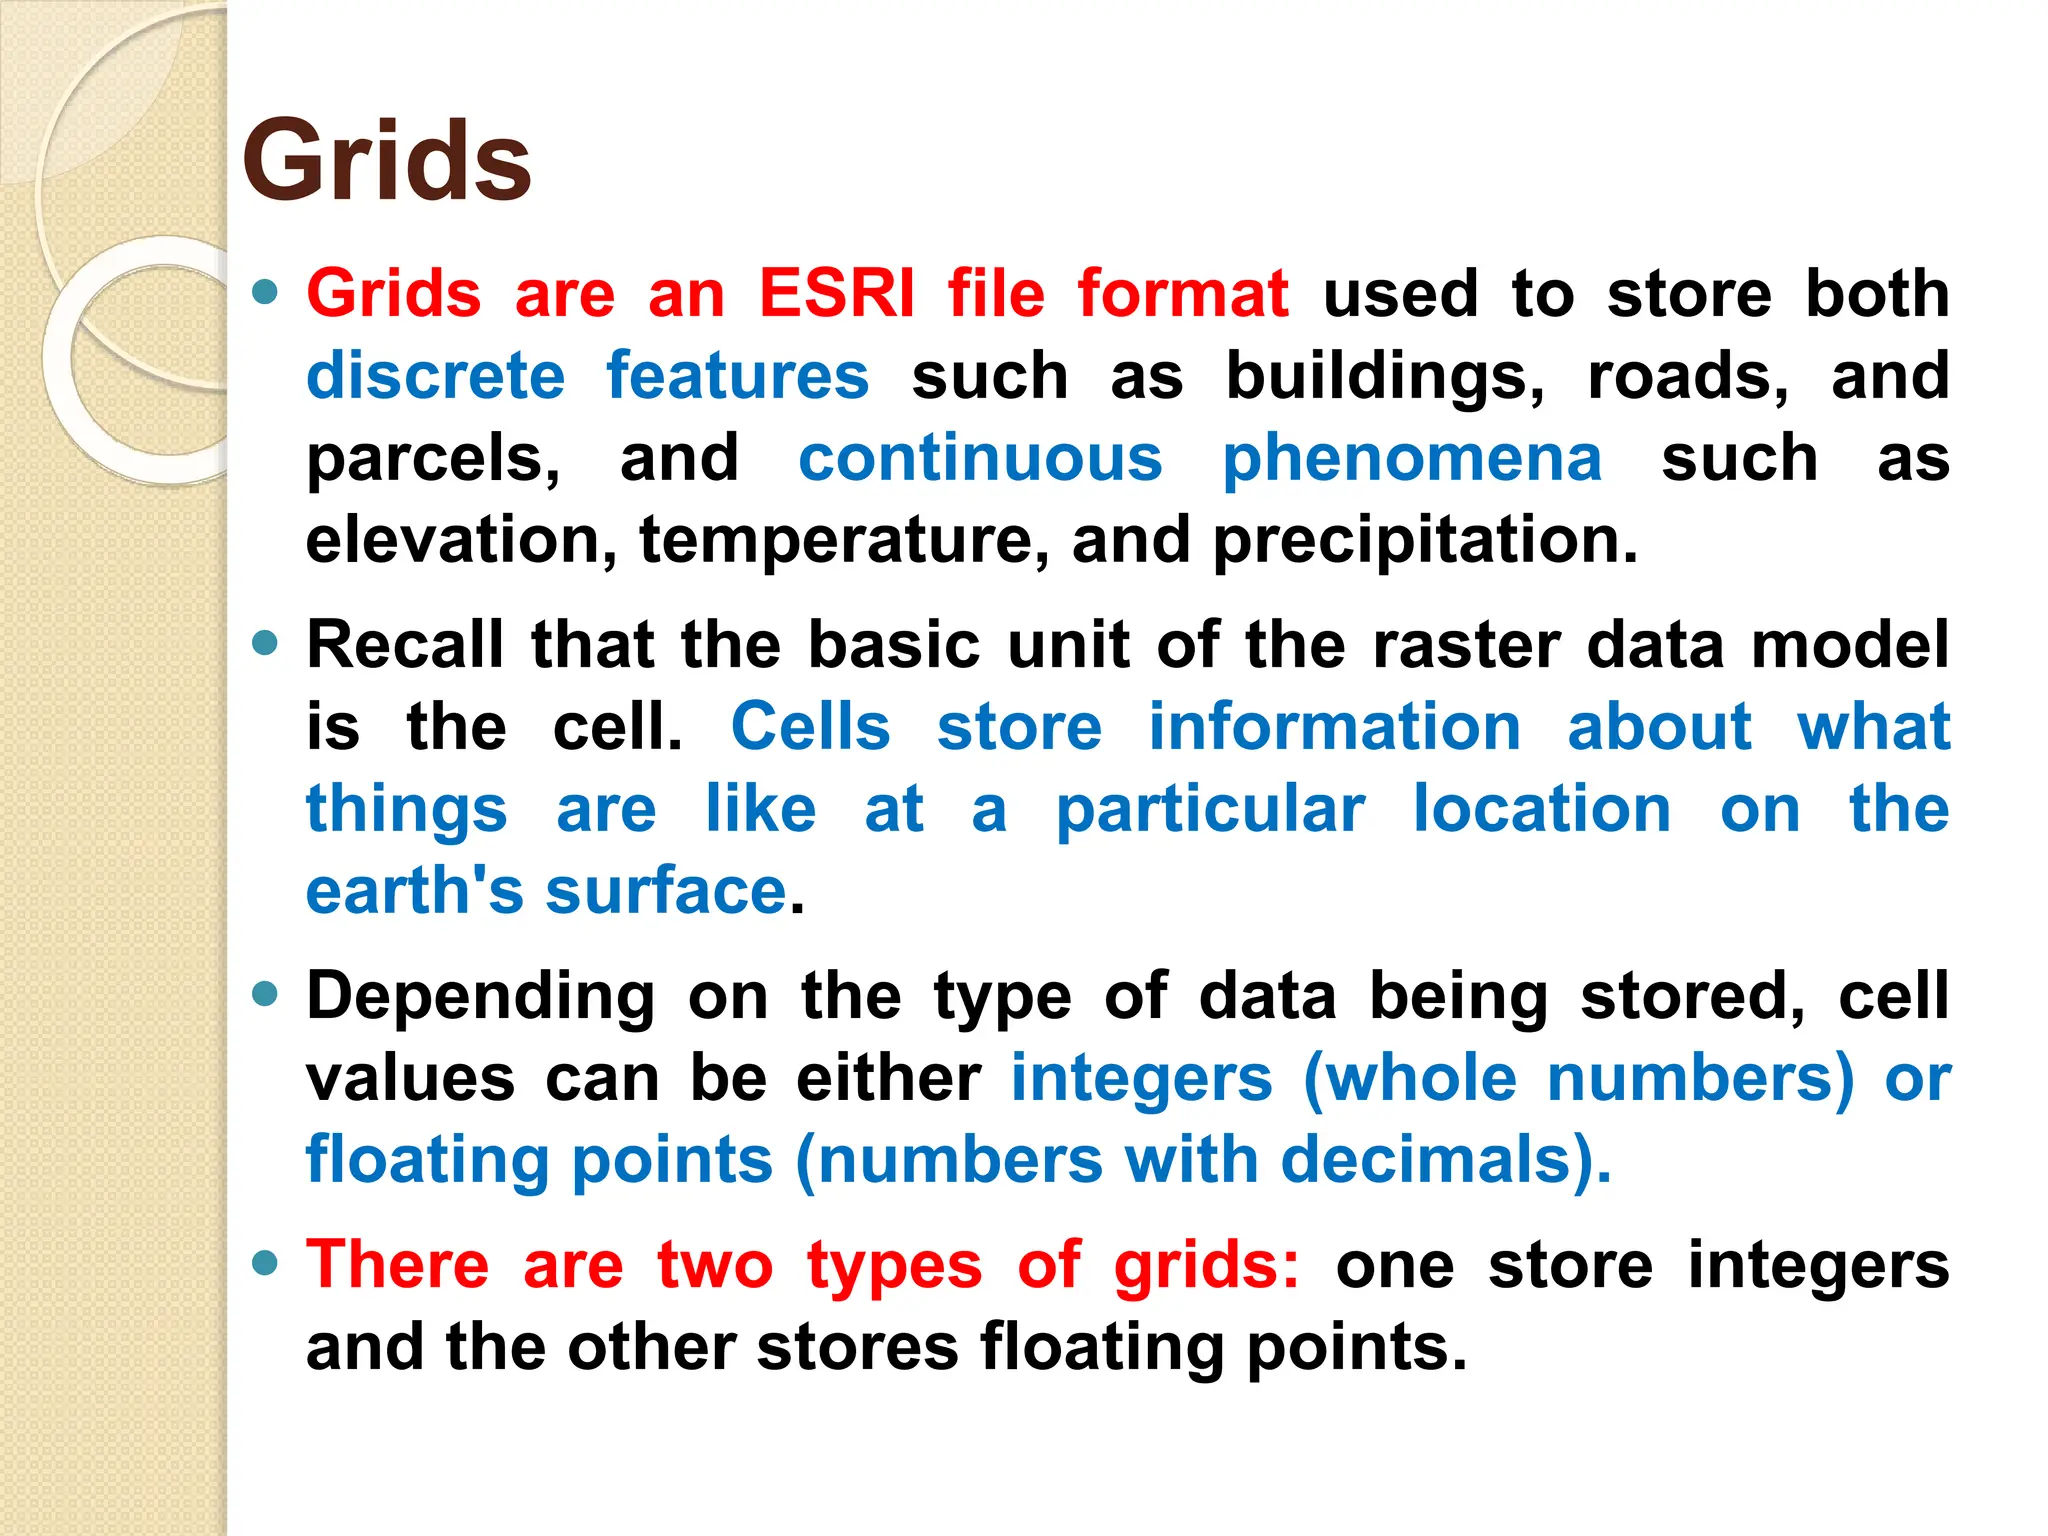
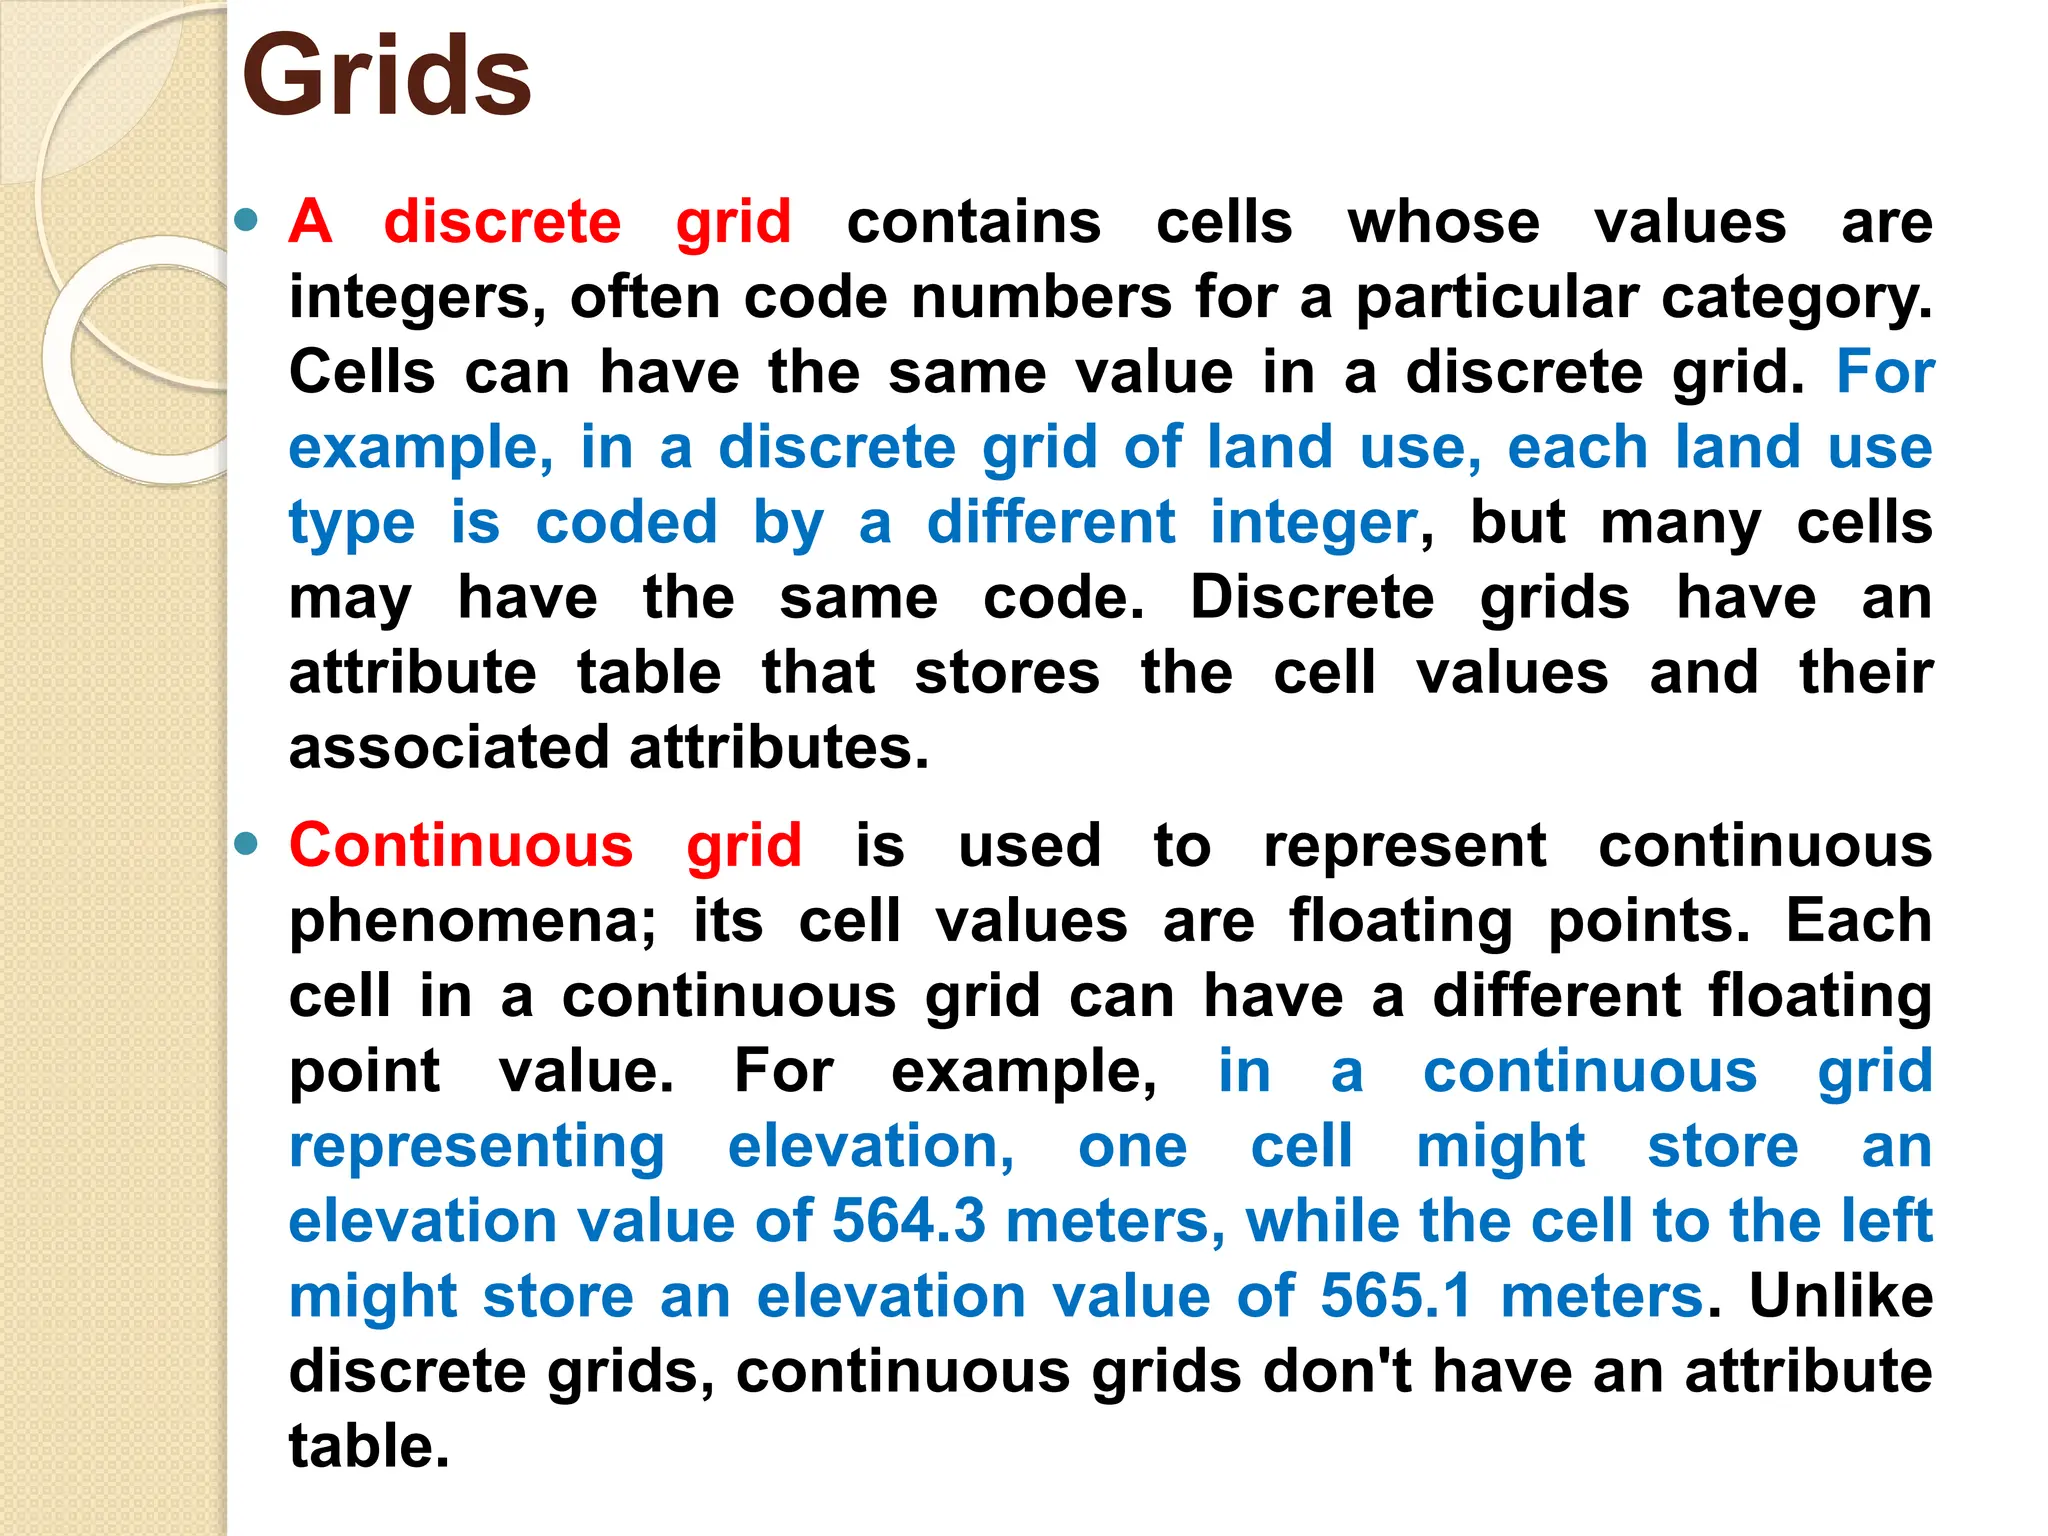
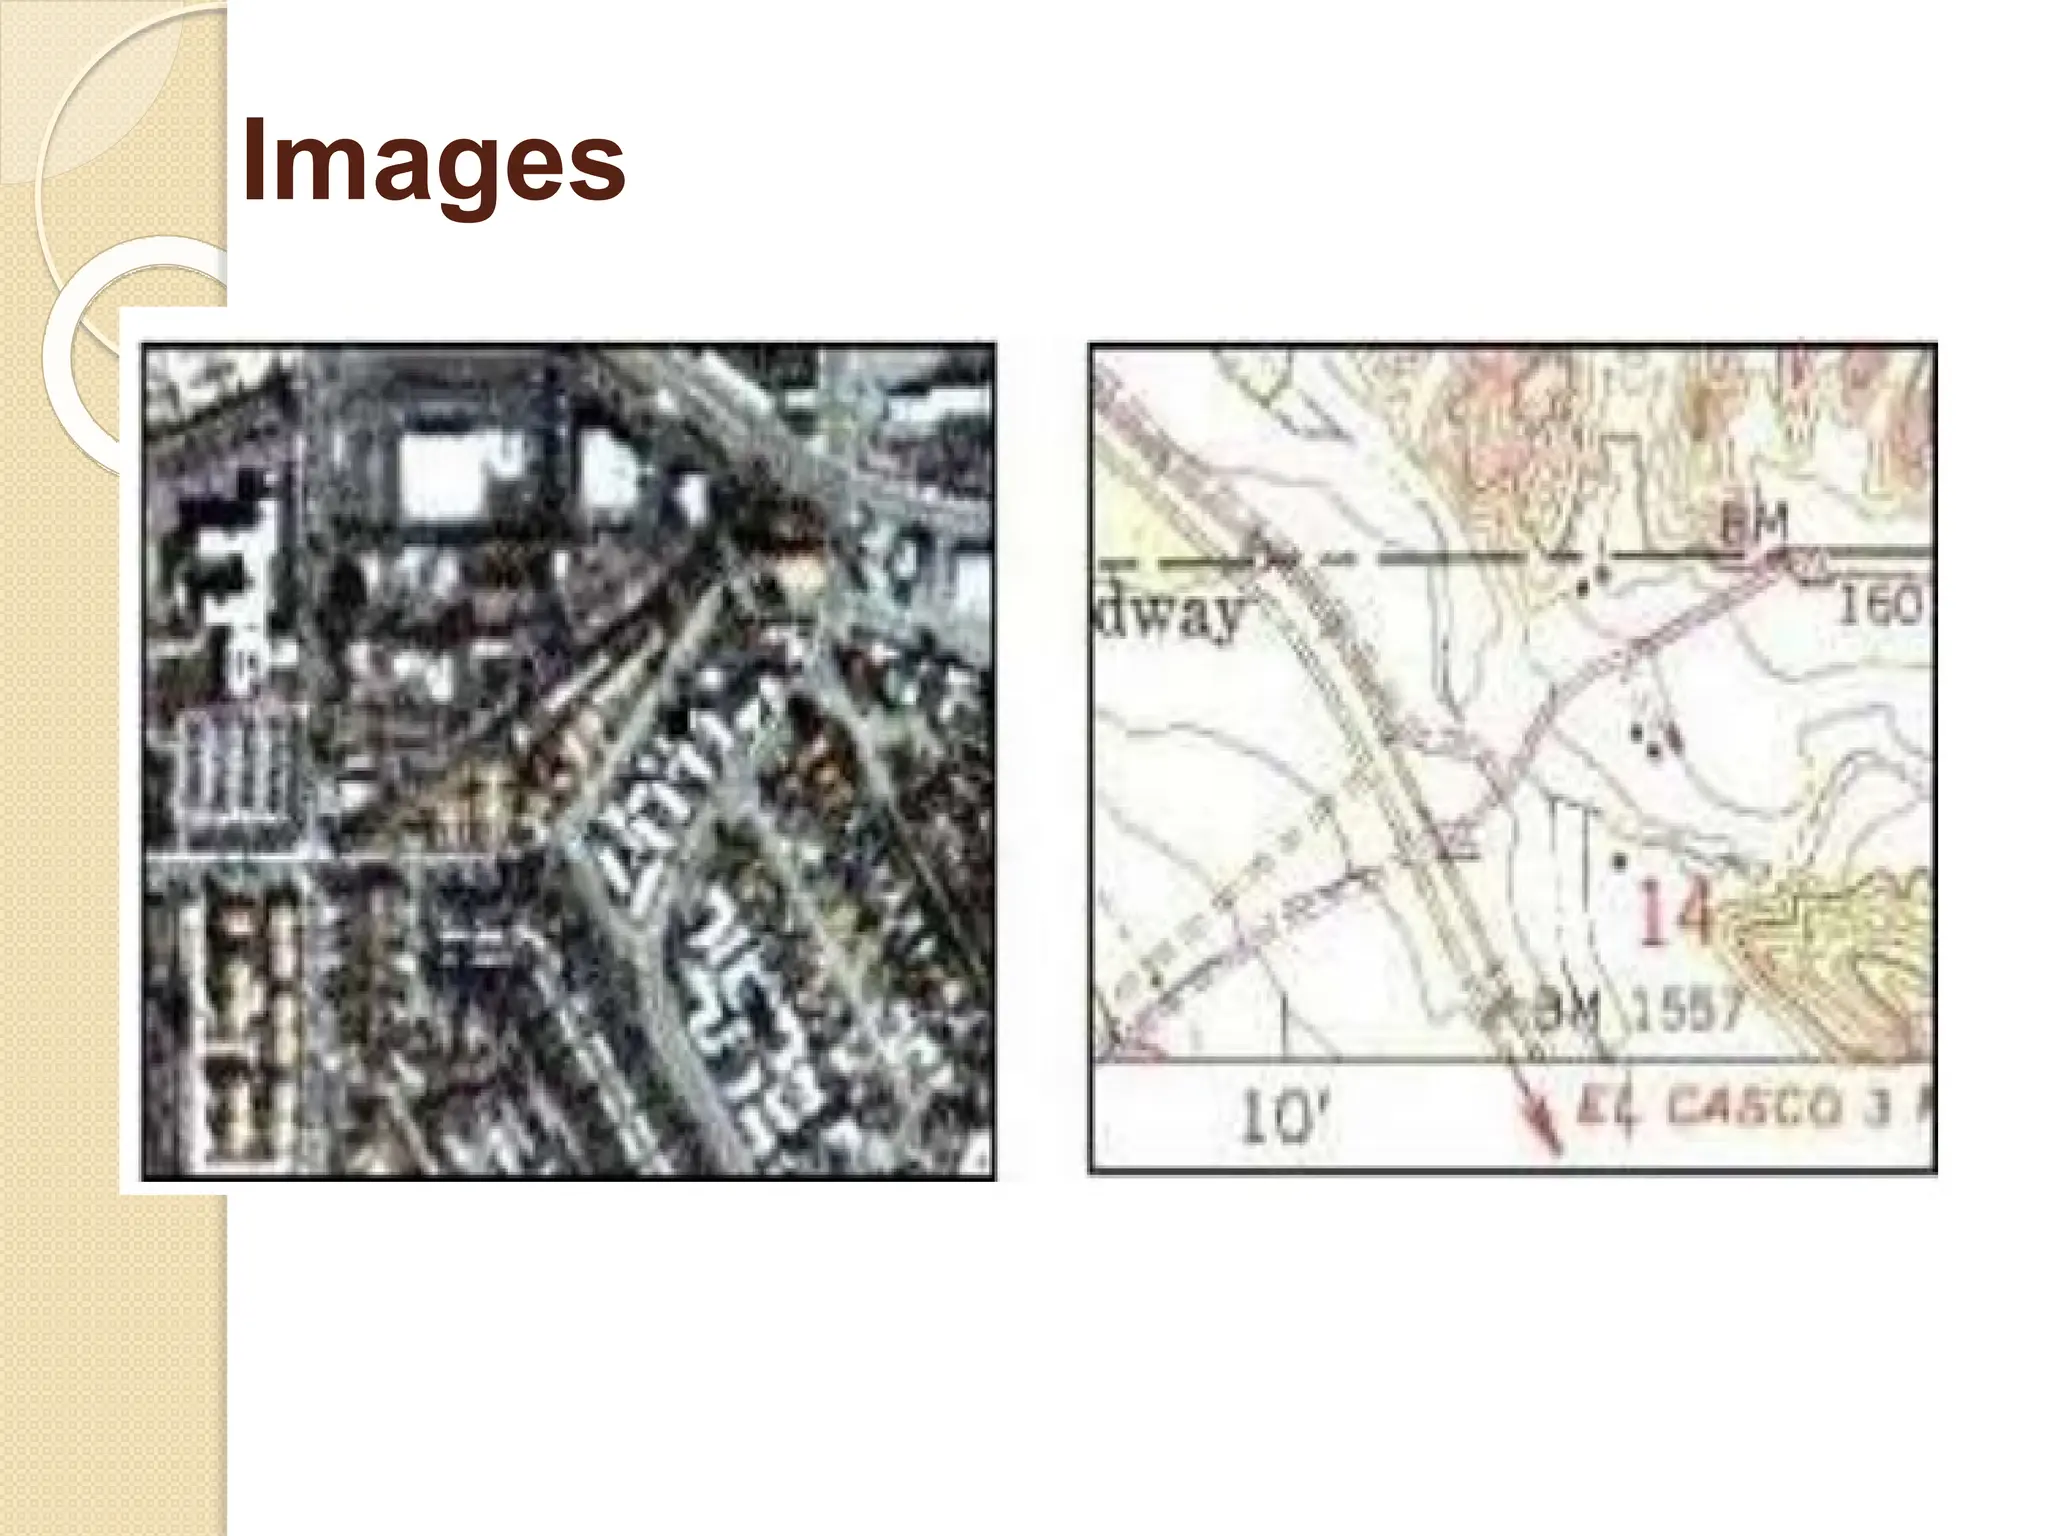
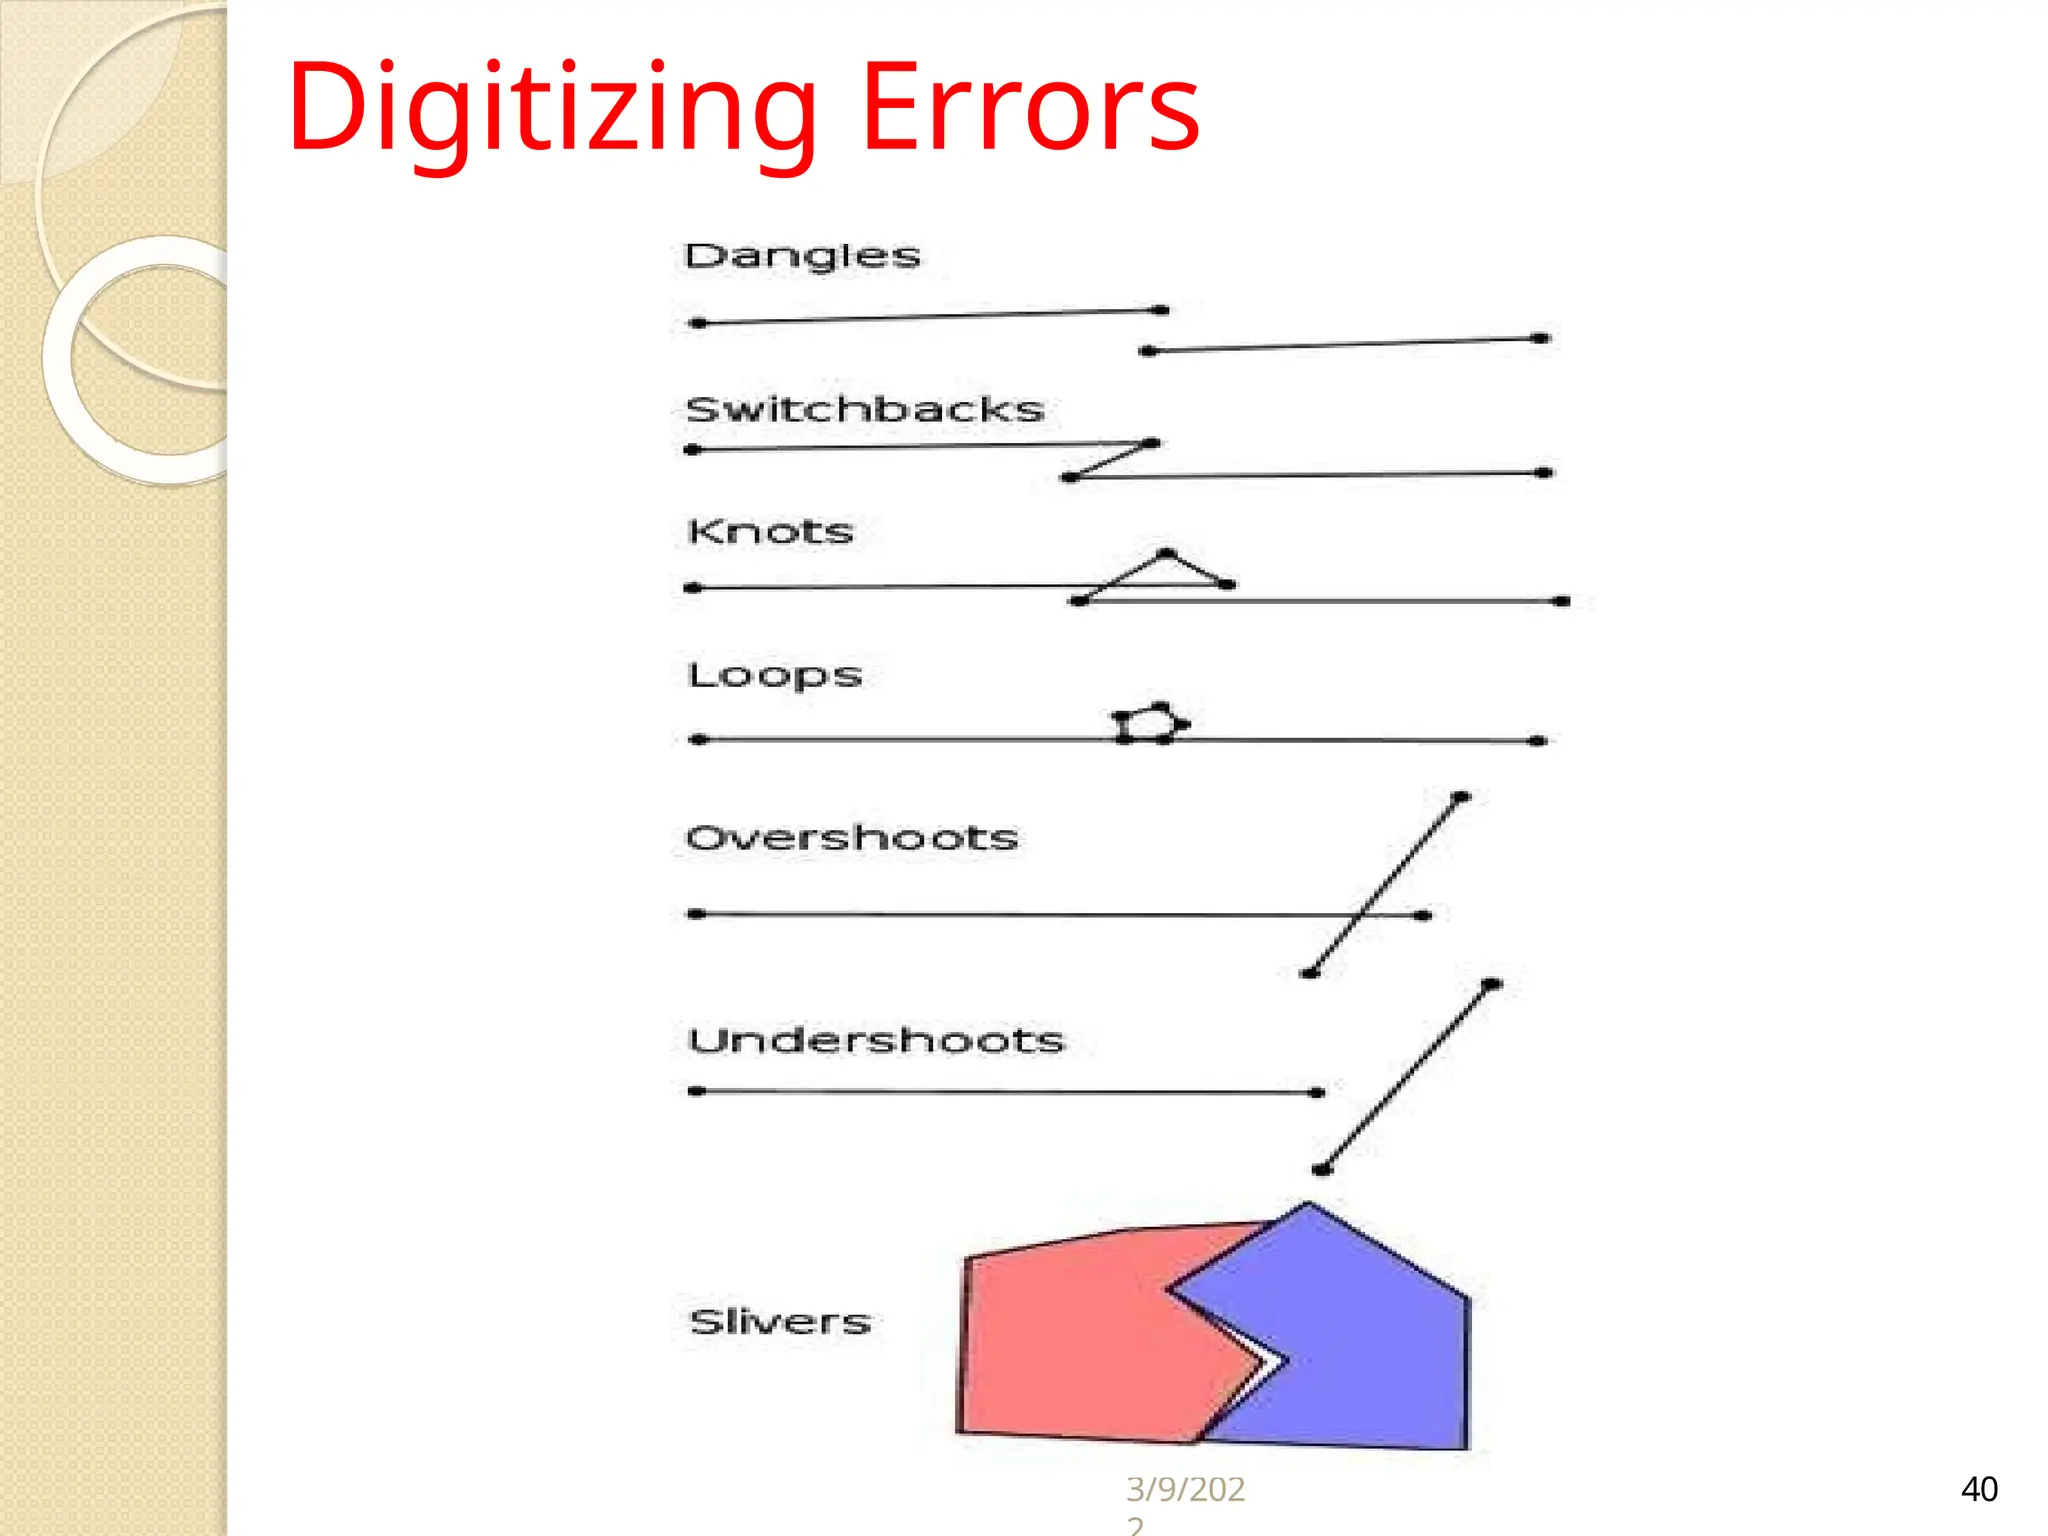
The document discusses various types of scanners used for converting analog maps into digital raster data, including mechanical, video, CCD cameras, and flatbed scanners, each with their pros and cons. It outlines data input techniques for GIS, such as manual digitizing, automatic scanning, and coordinate geometry entry, emphasizing the importance of accuracy and efficiency amid the challenges of cost and complexity. Additionally, it covers raster data formats like grids and images, detailing their characteristics and how they store spatial information for GIS applications.