This document discusses data sampling and collection methods. It begins by defining quantitative and qualitative data, and primary and secondary data. The main methods of primary data collection are observation, interviewing, and questionnaires. Secondary data refers to existing data collected by others. The document then defines data sampling as selecting part of a data set to make inferences about the whole. Sampling is needed to save time and money. Random sampling gives the best results while non-random sampling includes quota, accidental, judgemental, expert and snowball sampling. Mixed sampling uses elements of both random and non-random designs.
A Model of Decision Support System for Research Topic Selection and Plagiaris...theijes
The paper proposes a model of the decision support system for deciding a research topic in academia. The biggest challenge for a student in the field of research is to identify area and topic of research. The paper explains the model which helps student to identify the most suitable area and/or topic for academic research. The model is also design to assist supervisors to explore latest areas of research as well as to get rid of non intentional plagiarism. The model facilitates the user to select either keyword bases topic search or questionnaire based topic search. The model uses local database and service of a Meta search engine in decision making activity
What is Data Collection?
Types of Data
Issues to be Considered for Data Collection
Methods of Primary Data Collection:
Questionnaire Method, Interviews Method,
Focus Group Discussions (FGD), Observation
Method, Survey Method, Case Study
Method, Diaries Method
Methods of Secondary Data Collection
Methods of Legal Research.
Application of recommendation system with AHP method and sentiment analysisTELKOMNIKA JOURNAL
Over time, people needs are increasing. Needs that must be met, often cause problems in the people in determining a choice. People must make the right choice and according to their needs. Not an easy thing for people to make these choices. Therefore, a recommendation system is needed to support people in making decisions that fit their criteria. This research provides a system that can provide recommendations for decision support people according to their criteria, which are web-based. The decision-making system in this research uses the analytical hierarchy process (AHP) method. AHP is a multi-criteria decision-making method, which in this research one of the criteria is using sentiment analysis. Sentiment analysis is the process of understanding, extracting, and processing textual data to get sentiment information from an opinion sentence. The opinion sentiment value of each alternative will be included in the AHP calculation to get the best alternative recommendations according to the criteria of people. The result of this research is that the system can provide recommendations to people or users according to their criteria and alternatives as well as public opinion about each alternative.
When to Ask Participants to Think Aloud: A Comparative Study of Concurrent an...CSCJournals
This paper presents the results of a study that compared two think-aloud usability testing methods: the concurrent think-aloud and the retrospective think-aloud methods. Data from task performance, testing experience, and usability problems were collected from 30 participants equally distributed between the two think-aloud conditions. The results suggest that while the thinking aloud method had no impact on task performance and testing experience, participants using the concurrent think-aloud method reported a larger number of problems with the test interface than participants using the retrospective think-aloud method. These findings suggest a reason for preferring the concurrent think-aloud method to the retrospective one.
Data analysis chapter 18 from the companion website for educational researchYamith José Fandiño Parra
This is a slide show of chapter 18 from Educational Research: Competencies for Analysis and Applications. Primarily intended for instructor use in the classroom, it is also available for students’ study use or to review as an advance organizer before class lectures or discussions.
Framework for opinion as a service on review data of customer using semantics...IJECEIAES
At opinion mining plays a significant role in representing the original and unbiased perception of the products/services. However, there are various challenges associated with performing an effective opinion mining in the present era of distributed computing system with dynamic behaviour of users. Existing approaches is more laborious towards extracting knowledge from the reviews of user which is further subjected to various rounds of operation with complex procedures. The proposed system addresses the problem by introducing a novel framework called as opinion-as-a-service which is meant for direct utilization of the extracted knowledge in most user friendly manner. The proposed system introduces a set of three sequential algorithm that performs aggregated of incoming stream of opinion data, performing indexing, followed by applying semantics for extracting knowledge. The study outcome shows that proposed system is better than existing system in mining performance.
With the emergence of virtualization and cloud computing technologies, several services are housed on virtualization platform. Virtualization is the technology that many cloud service providers rely on for efficient management and coordination of the resource pool. As essential services are also housed on cloud platform, it is necessary to ensure continuous availability by implementing all necessary measures. Windows Active Directory is one such service that Microsoft developed for Windows domain networks. It is included in Windows Server operating systems as a set of processes and services for authentication and authorization of users and computers in a Windows domain type network. The service is required to run continuously without downtime. As a result, there are chances of accumulation of errors or garbage leading to software aging which in turn may lead to system failure and associated consequences. This results in software aging. In this work, software aging patterns of Windows active directory service is studied. Software aging of active directory needs to be predicted properly so that rejuvenation can be triggered to ensure continuous service delivery. In order to predict the accurate time, a model that uses time series forecasting technique is built.
Clustering Students of Computer in Terms of Level of ProgrammingEditor IJCATR
Educational data mining (EDM) is one of the applications of data mining. In educational data mining, there are two key domains, i.e. student domain and faculty domain. Different type of research work has been done in both domains.
In existing system the faculty performance has calculated on the basis of two parameters i.e. Student feedback and the result of student in that subject. In existing system we define two approaches one is multiple classifier approach and the other is a single classifier approach and comparing them, for relative evaluation of faculty performance using data mining
Techniques. In multiple classifier approach K-nearest neighbor (KNN) is used in first step and Rule based classification is used in the second step of classification while in single classifier approach only KNN is used in both steps of classification.
But in proposed system, I will analyse the faculty performance using 4 parameters i.e., student complaint about faculty, Student review feedback for faculty, students feedback, and students result etc.
For this proposed system I will be going to use opinion mining technique for analyzing performance of faculty and calculating score of each faculty.
Different Methods of Collection of DataP. Veeresha
Data collection is a term used to describe a process of preparing and collecting data.
Data are the basic inputs to any decision making process in any fields like education, business, industries…. etc
The primary data are those which are collected afresh and for the first time, and thus happen to be original in character. It is real time data and which are collected by the researcher himself.
Secondary data means data that are already available i.e., they refer to the data which have already been collected and analyzed by someone else.
data collection is just systematic way approach for gather and measure information form variety source for the aim of get complete and accurate of an area that interested
The Art Pastor's Guide to Sabbath | Steve ThomasonSteve Thomason
What is the purpose of the Sabbath Law in the Torah. It is interesting to compare how the context of the law shifts from Exodus to Deuteronomy. Who gets to rest, and why?
Welcome to TechSoup New Member Orientation and Q&A (May 2024).pdfTechSoup
In this webinar you will learn how your organization can access TechSoup's wide variety of product discount and donation programs. From hardware to software, we'll give you a tour of the tools available to help your nonprofit with productivity, collaboration, financial management, donor tracking, security, and more.
How to Make a Field invisible in Odoo 17Celine George
It is possible to hide or invisible some fields in odoo. Commonly using “invisible” attribute in the field definition to invisible the fields. This slide will show how to make a field invisible in odoo 17.
The French Revolution, which began in 1789, was a period of radical social and political upheaval in France. It marked the decline of absolute monarchies, the rise of secular and democratic republics, and the eventual rise of Napoleon Bonaparte. This revolutionary period is crucial in understanding the transition from feudalism to modernity in Europe.
For more information, visit-www.vavaclasses.com
This is a presentation by Dada Robert in a Your Skill Boost masterclass organised by the Excellence Foundation for South Sudan (EFSS) on Saturday, the 25th and Sunday, the 26th of May 2024.
He discussed the concept of quality improvement, emphasizing its applicability to various aspects of life, including personal, project, and program improvements. He defined quality as doing the right thing at the right time in the right way to achieve the best possible results and discussed the concept of the "gap" between what we know and what we do, and how this gap represents the areas we need to improve. He explained the scientific approach to quality improvement, which involves systematic performance analysis, testing and learning, and implementing change ideas. He also highlighted the importance of client focus and a team approach to quality improvement.
Students, digital devices and success - Andreas Schleicher - 27 May 2024..pptxEduSkills OECD
Andreas Schleicher presents at the OECD webinar ‘Digital devices in schools: detrimental distraction or secret to success?’ on 27 May 2024. The presentation was based on findings from PISA 2022 results and the webinar helped launch the PISA in Focus ‘Managing screen time: How to protect and equip students against distraction’ https://www.oecd-ilibrary.org/education/managing-screen-time_7c225af4-en and the OECD Education Policy Perspective ‘Students, digital devices and success’ can be found here - https://oe.cd/il/5yV
Palestine last event orientationfvgnh .pptxRaedMohamed3
An EFL lesson about the current events in Palestine. It is intended to be for intermediate students who wish to increase their listening skills through a short lesson in power point.
1.4 modern child centered education - mahatma gandhi-2.pptx
Data collection f488555b7cca4b22cd8bcc61db2c2238
1. 29-09-2020
1
1
Data Sampling and Collection
Dr Dhaval Pujara
Professor & Head
Department of Electronics & Communication Engineering,
Institute of Technology, Nirma University
Ahmedabad 382 481
Email: dhaval.pujara@nirmauni.ac.in
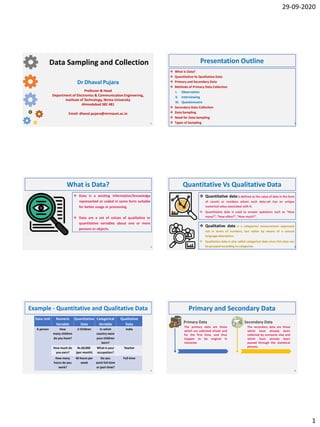
2
Presentation Outline
What is Data?
Quantitative Vs Qualitative Data
Primary and Secondary Data
Methods of Primary Data Collection
I. Observation
II. Interviewing
III. Questionnaire
Secondary Data Collection
Data Sampling
Need for Data Sampling
Types of Sampling
3
What is Data?
Data is a existing information/knowledge
represented or coded in some form suitable
for better usage or processing.
Data are a set of values of qualitative or
quantitative variables about one or more
persons or objects.
4
Quantitative Vs Qualitative Data
Quantitative data is defined as the value of data in the form
of counts or numbers where each data-set has an unique
numerical value associated with it.
Quantitative data is used to answer questions such as “How
many?”, “How often?”, “How much?”.
Qualitative data is a categorical measurement expressed
not in terms of numbers, but rather by means of a natural
language description.
Qualitative data is also called categorical data since this data can
be grouped according to categories.
5
Example - Quantitative and Qualitative Data
Data Unit Numeric
Variable
Quantitative
Data
Categorical
Variable
Qualitative
Data
A person How
many children
do you have?
2 Children In which
country were
your children
born?
India
How much do
you earn?
Rs.60,000
(per month)
What is your
occupation?
Teacher
How many
hours do you
work?
40 hours per
week
Do you
work full-time
or part-time?
Full-time
6
Primary and Secondary Data
The primary data are those
which are collected afresh and
for the first time, and thus
happen to be original in
character.
Primary Data
The secondary data are those
which have already been
collected by someone else and
which have already been
passed through the statistical
process.
Secondary Data
2. 29-09-2020
2
7
Primary and Secondary Data
The task of data collection begins after a research problem
has been defined and research design/plan chalked out.
1
A researcher as per requirement of study may decide on
use of primary data or secondary data or both.
2
Secondary data are already available, one has to carefully
choose the sources , relevancy of data and reliability.
3
Sources of secondary data are existing literature, reports
of professional agencies, archives, Internet, etc.
4
While collecting secondary data one has to follow legal
procedures required and maintain the academic ethics.
5
8
Methods of Data Collection
The selection of Data Collection Method depends on several
parameters, like:
a) Nature, scope and object of the research being undertaken
b) Availability of funds
c) Availability of Time
d) Precision required
9
Methods of Data Collection
1
0
Primary Data Collection
When a researcher is more interested in the behaviour than
in the perceptions of individuals, the data are to be collected
by observations.
There are two types of observations:
I. Participant Observation;
II. Non-Participant Observation
In Participant Observation, a researcher participate in the
activities of the group being observed in the same manner as
its members, with or without their knowing that they are
being observed.
In Non-Participant Observation, a researcher, does not get
involved in the activities of the group but remain a passive
observer, watching and listening to its activities and drawing
conclusions from this.
Observation
1
1
Problems
Observation as a Method of Data Collection
When individuals or groups become aware that they are being observed, they may
change their behaviour. The observations may be faulty in such situations.
There is always a possibility of observer bias.
The interpretations drawn from observations may vary from observer to observer.
There is the possibility of incomplete observation and/or recording.
An observer may watch keenly but at the expense of detailed recording.
The opposite problem may occur when the observer takes detailed notes but in doing
so misses some of the interaction.
1
2
Primary Data Collection
Interviewing is a commonly used
method of collecting information from
people.
In this technique, the researcher has a
freedom
to decide the format and content of
questions to be asked,
to select the wording of the
questions,
to decide the way we want to ask the
questions
to choose the order in which the
questions are to be asked.
Interviewing
3. 29-09-2020
3
1
3
Merits & Demerits
Interviewing as a Method of Data Collection
Merits:
More and in-depth information obtained
Personal Information
Greater Flexibility
Adaptation as per the respondent
Demerits:
Bias of Interviewer
Expensive/Time Consuming
Need expertise
1
4
Primary Data Collection
A questionnaire is a written list of questions, the answers to
which are recorded by respondents.
The layout of a questionnaire should be such that it is easy to
read and the sequence of questions should be easy to follow.
A questionnaire should be developed in an interactive style.
The most common approach to collecting information is to
send the questionnaire to prospective respondents by mail.
Questionnaire
1
5
Sample Questionnaire
1
6
Merits & Demerits
Questionnaire as a Method of Data Collection
Merits:
Low Cost
Time Saving
No interviewer’s bias
Respondent’s convenience
Demerits:
Can be used only for educated people
Many questions remain unanswered
The respondent can consult other persons before filling in the questionnaire.
Sometimes different respondent’s interpreted questions differently
1
7
Secondary Data Collection
Secondary data means data that are already available.
The data which have already been collected and analysed by someone else.
Secondary data may either be published data or unpublished data.
Usually published data are available in:
various publications of the central, state are local governments;
various publications of foreign governments or of international bodies
technical and trade journals;
books, magazines and newspapers;
reports and publications of various associations connected with business and
industry, banks, stock exchanges, etc.;
reports prepared by research scholars, universities, economists, etc. in different
fields; and
statistics, historical documents, and other sources of published information. 1
8
What is Data Sampling?
Sampling may be defined as the
selection of some part of an
aggregate on the basis of which a
judgement or inference about the
aggregate or totality is made.
In other words, it is the process of
obtaining information about an
entire population by examining
only a part of it
4. 29-09-2020
4
1
9
Concept of Data Sampling
2
0
Need for Data Sampling
Sampling is used in practice for a variety
of reasons :
Sampling can save time and money.
It produces results at a relatively faster
speed.
Sampling remains the only way when
population contains infinitely many
members.
Sampling is useful when a test involves the
destruction of the item under study.
2
1
Sampling Terminology
Study Population:
The class, families living in the city from which you select your sample are called the
population or study population, and are usually denoted by the letter N.
Sample Size:
The number of students, families from whom you obtain the required information is called
the sample size and is usually denoted by the letter n.
Sample:
The small group of students, families from whom you collect the required information is
called the sample.
Sample Statistics:
Your findings based on the information obtained from your respondents (sample) are called
sample statistics.
2
2
Types of Sampling
Random / Probability
Sampling Designs
1
Non-Random /
Non-Probability
Sampling Designs
2
Mixed
Sampling Designs
3
2
3
Types of Sampling
Random / Probability
Sampling Designs
1
A random sample is a sample in which every member of a
population has an equal chance of being selected.
The results of random sampling are amongst the best if
adequate sample size is selected.
The random samples can be generated by the Computer
Programme or by a table of randomly generated numbers.
2
4
Types of Sampling
Non-Random /
Non-Probability
Sampling Designs
2
Non-probability sampling designs do not follow the theory of
probability in the choice of elements from the sampling
population.
There are five commonly used non-random designs:
1. Quota sampling
2. Accidental sampling
3. Judgemental sampling or purposive sampling
4. Expert sampling
5. Snowball sampling
5. 29-09-2020
5
2
5
Types of Sampling
Quota sampling: In this sampling method, the researchers choose samples according to
specific traits or qualities.
Accidental sampling: This method involves taking a population sample that is close at hand,
rather than carefully determined and obtained.
Judgemental sampling or purposive sampling: In this method, the researchers rely on their
own judgment when choosing members of the population to participate in their study.
Expert sampling: In this method, the sample are selected from experts in the field you're
studying. It's used when you need the opinions or assessment of people with a high degree
of knowledge about the study area.
2
6
Types of Sampling
Snowball sampling: It is the process of selecting a sample using networks. To start with, a
few individuals in a group or organisation are selected and the required information is
collected from them. They are then asked to identify other people in the group or
organisation, and the people selected by them become a part of the sample. Information is
collected from them, and then these people are asked to identify other members of the
group and, in turn, those identified become the basis of further data collection.
2
7
Types of Sampling
Mixed
Sampling Designs
3
It has the characteristics of both random and non-random
sampling designs.
*SRS – Simple Random Selection
2
8