Download as POTX, PPTX
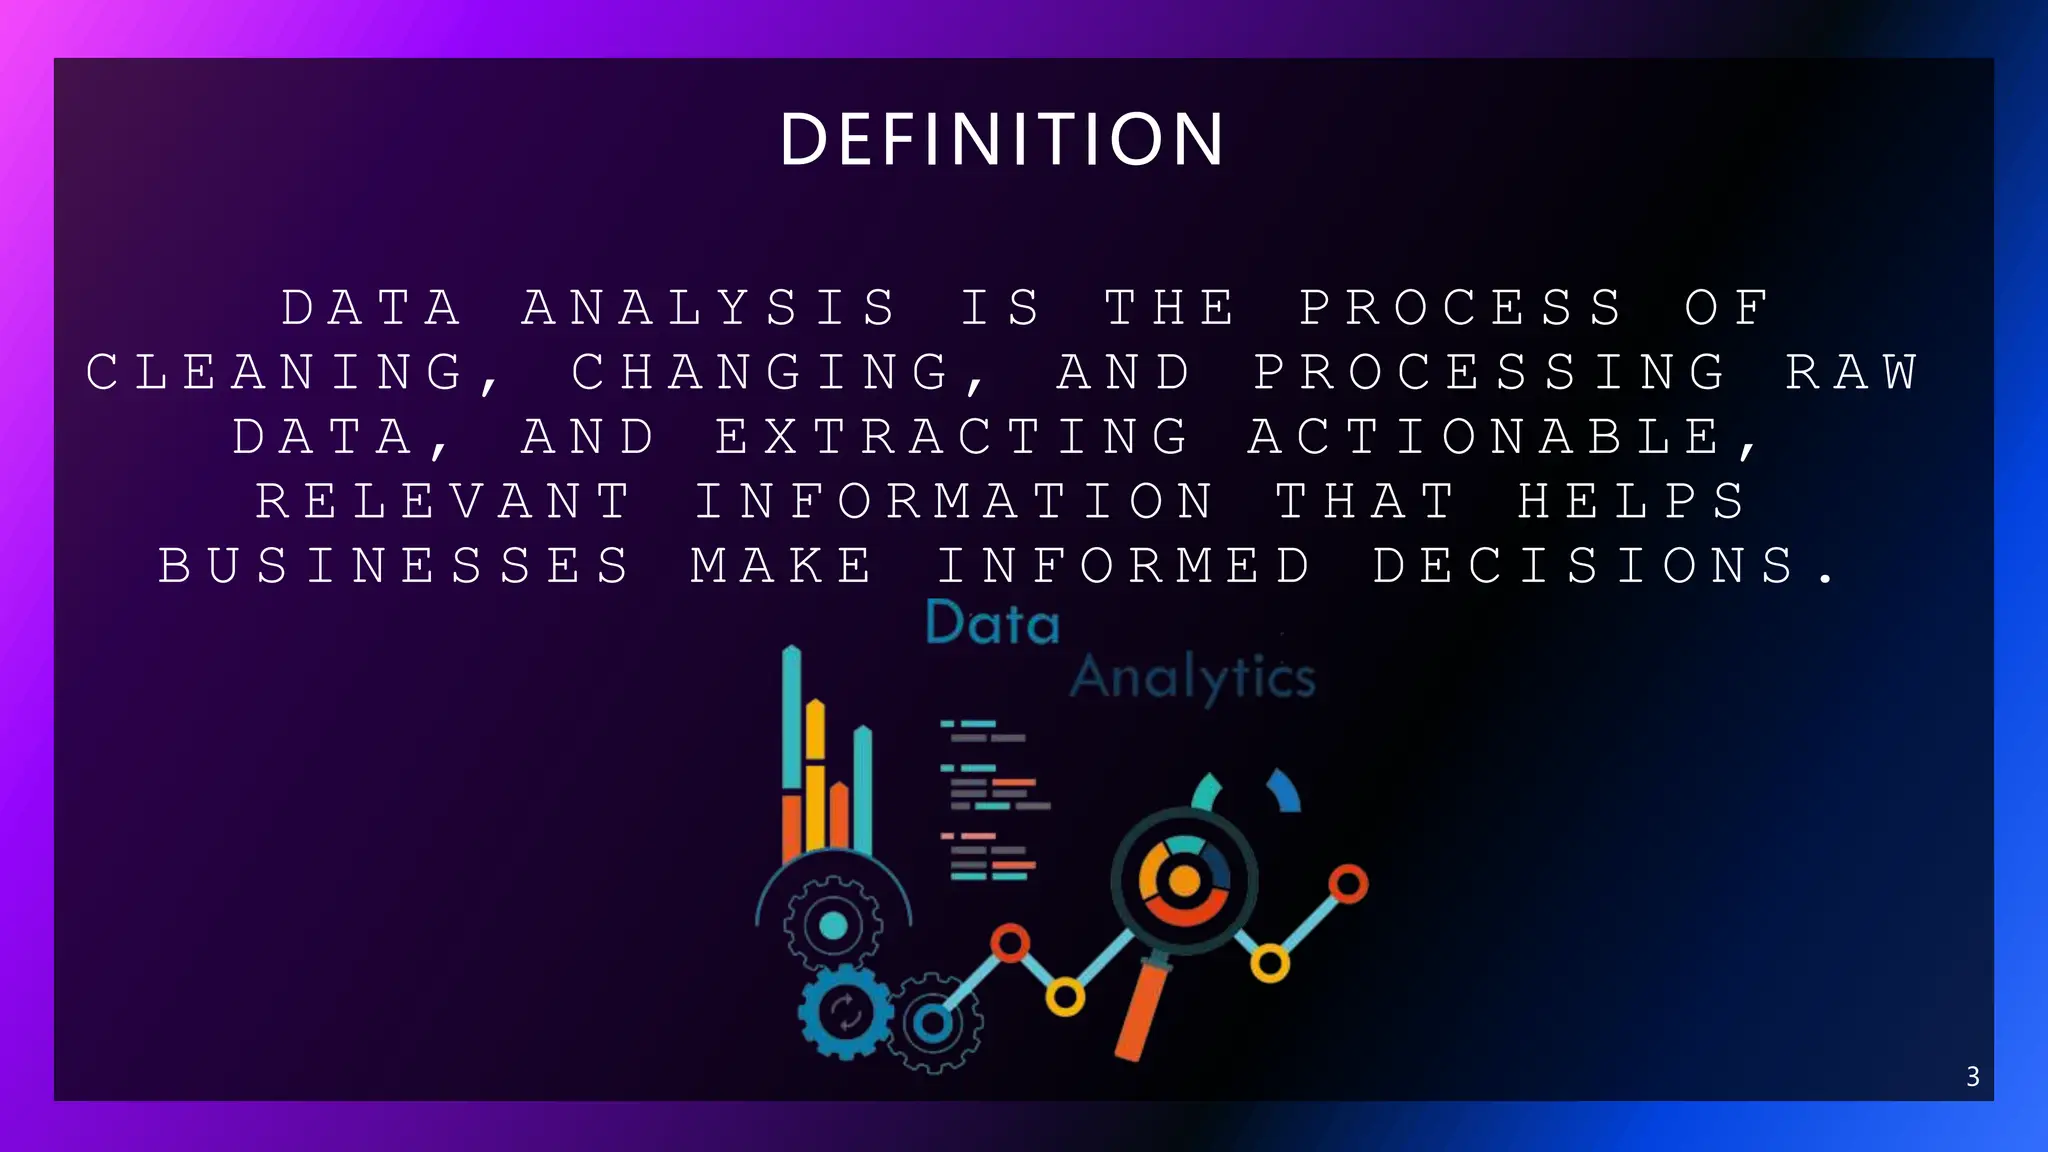
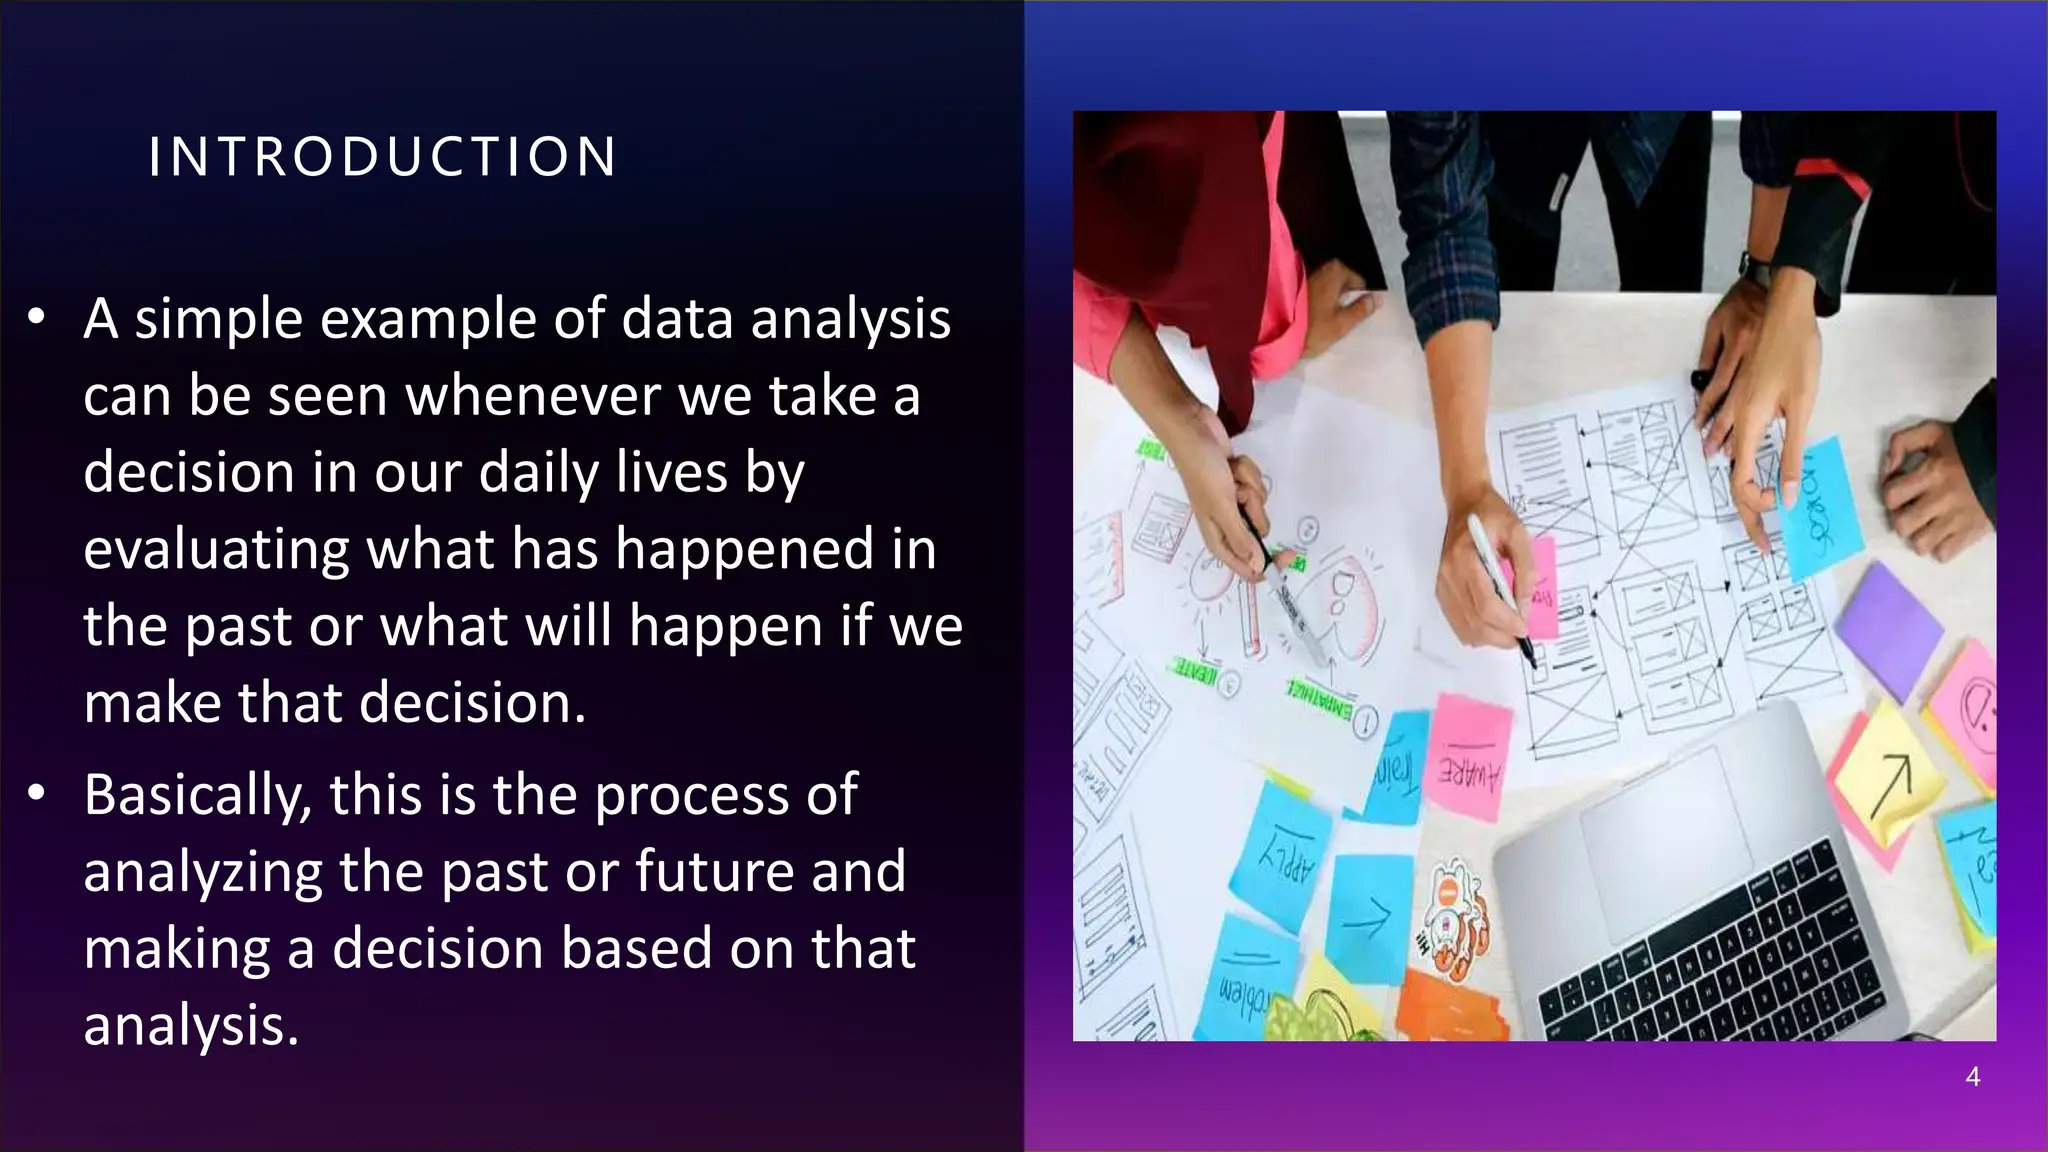
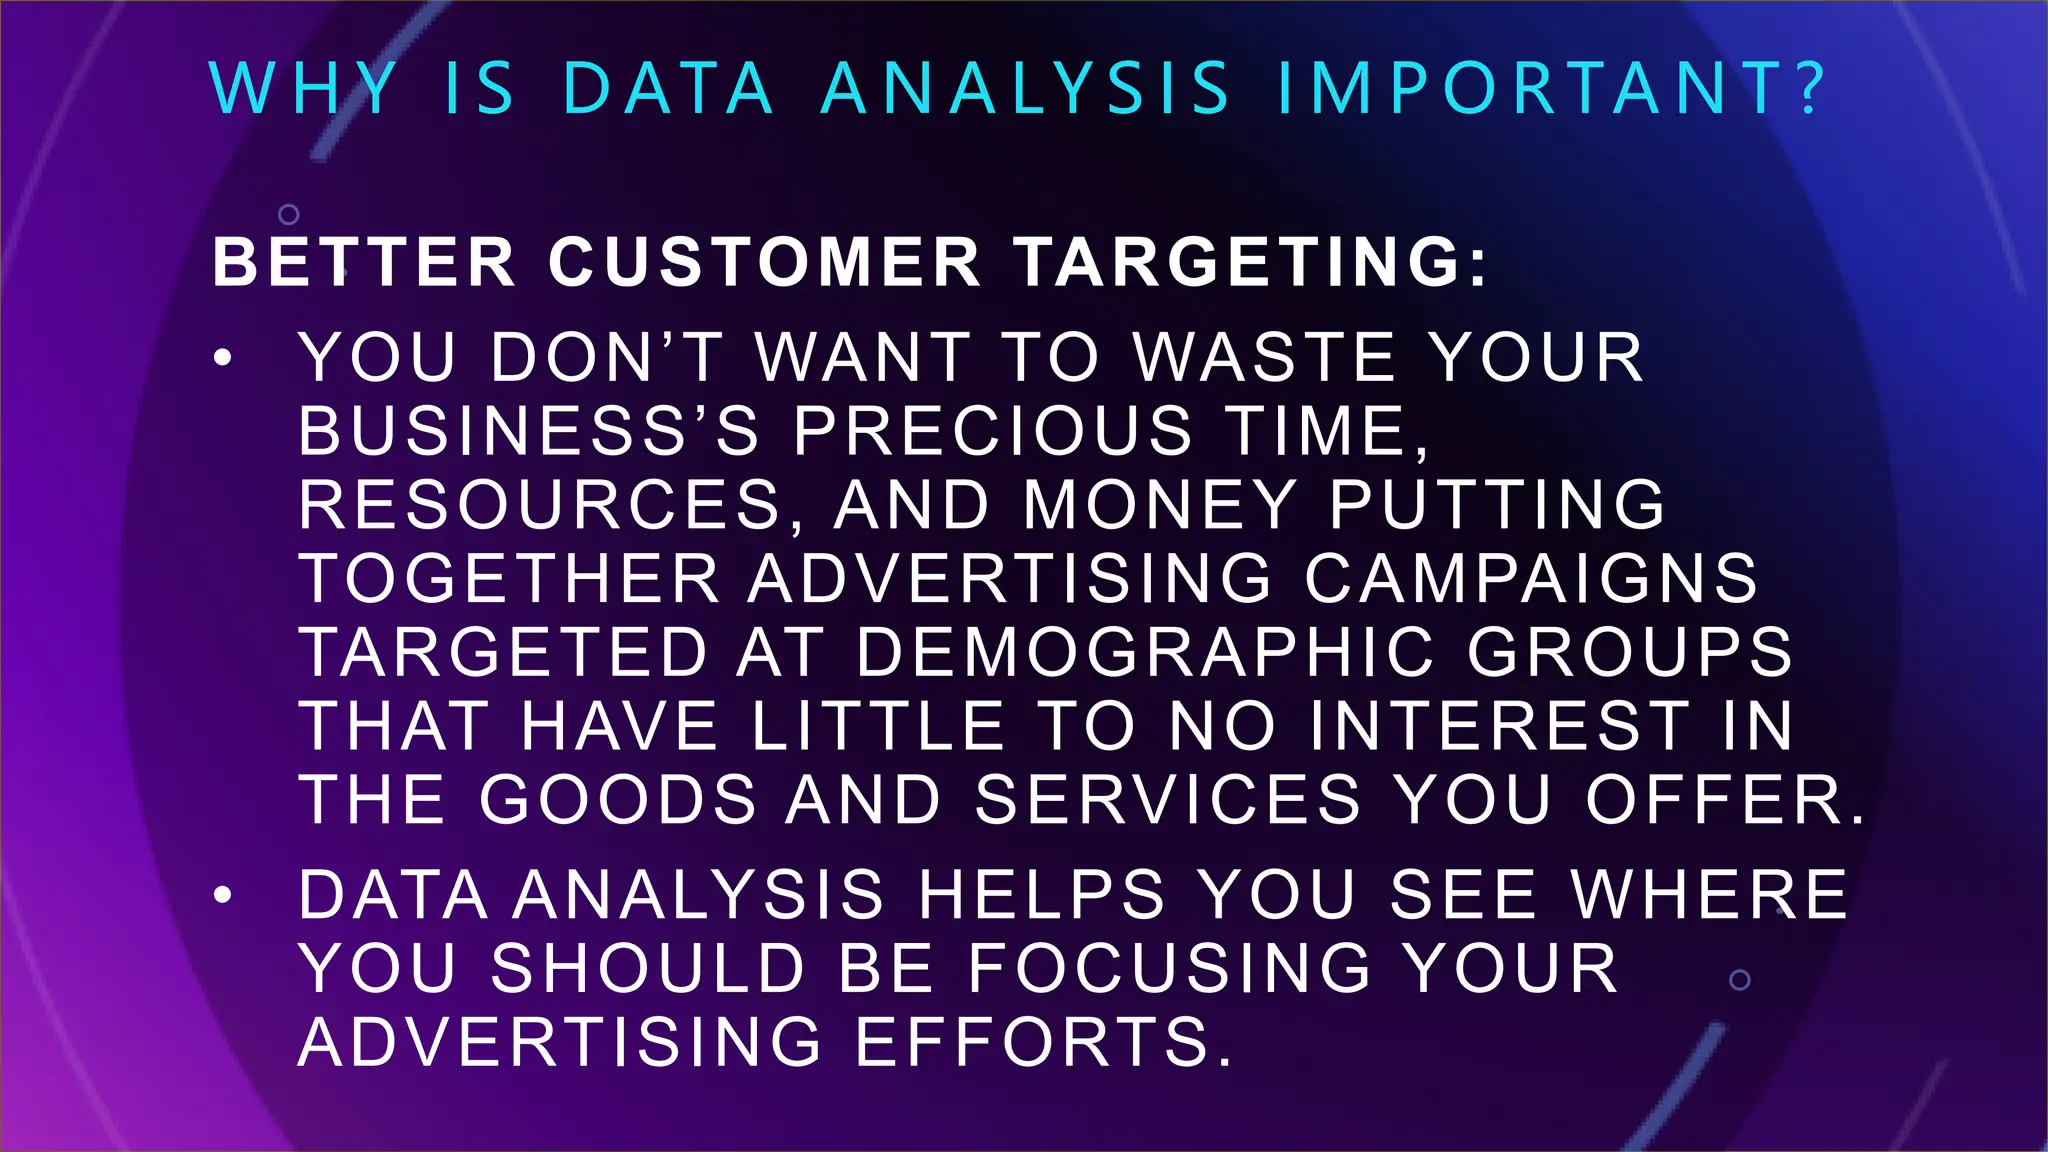
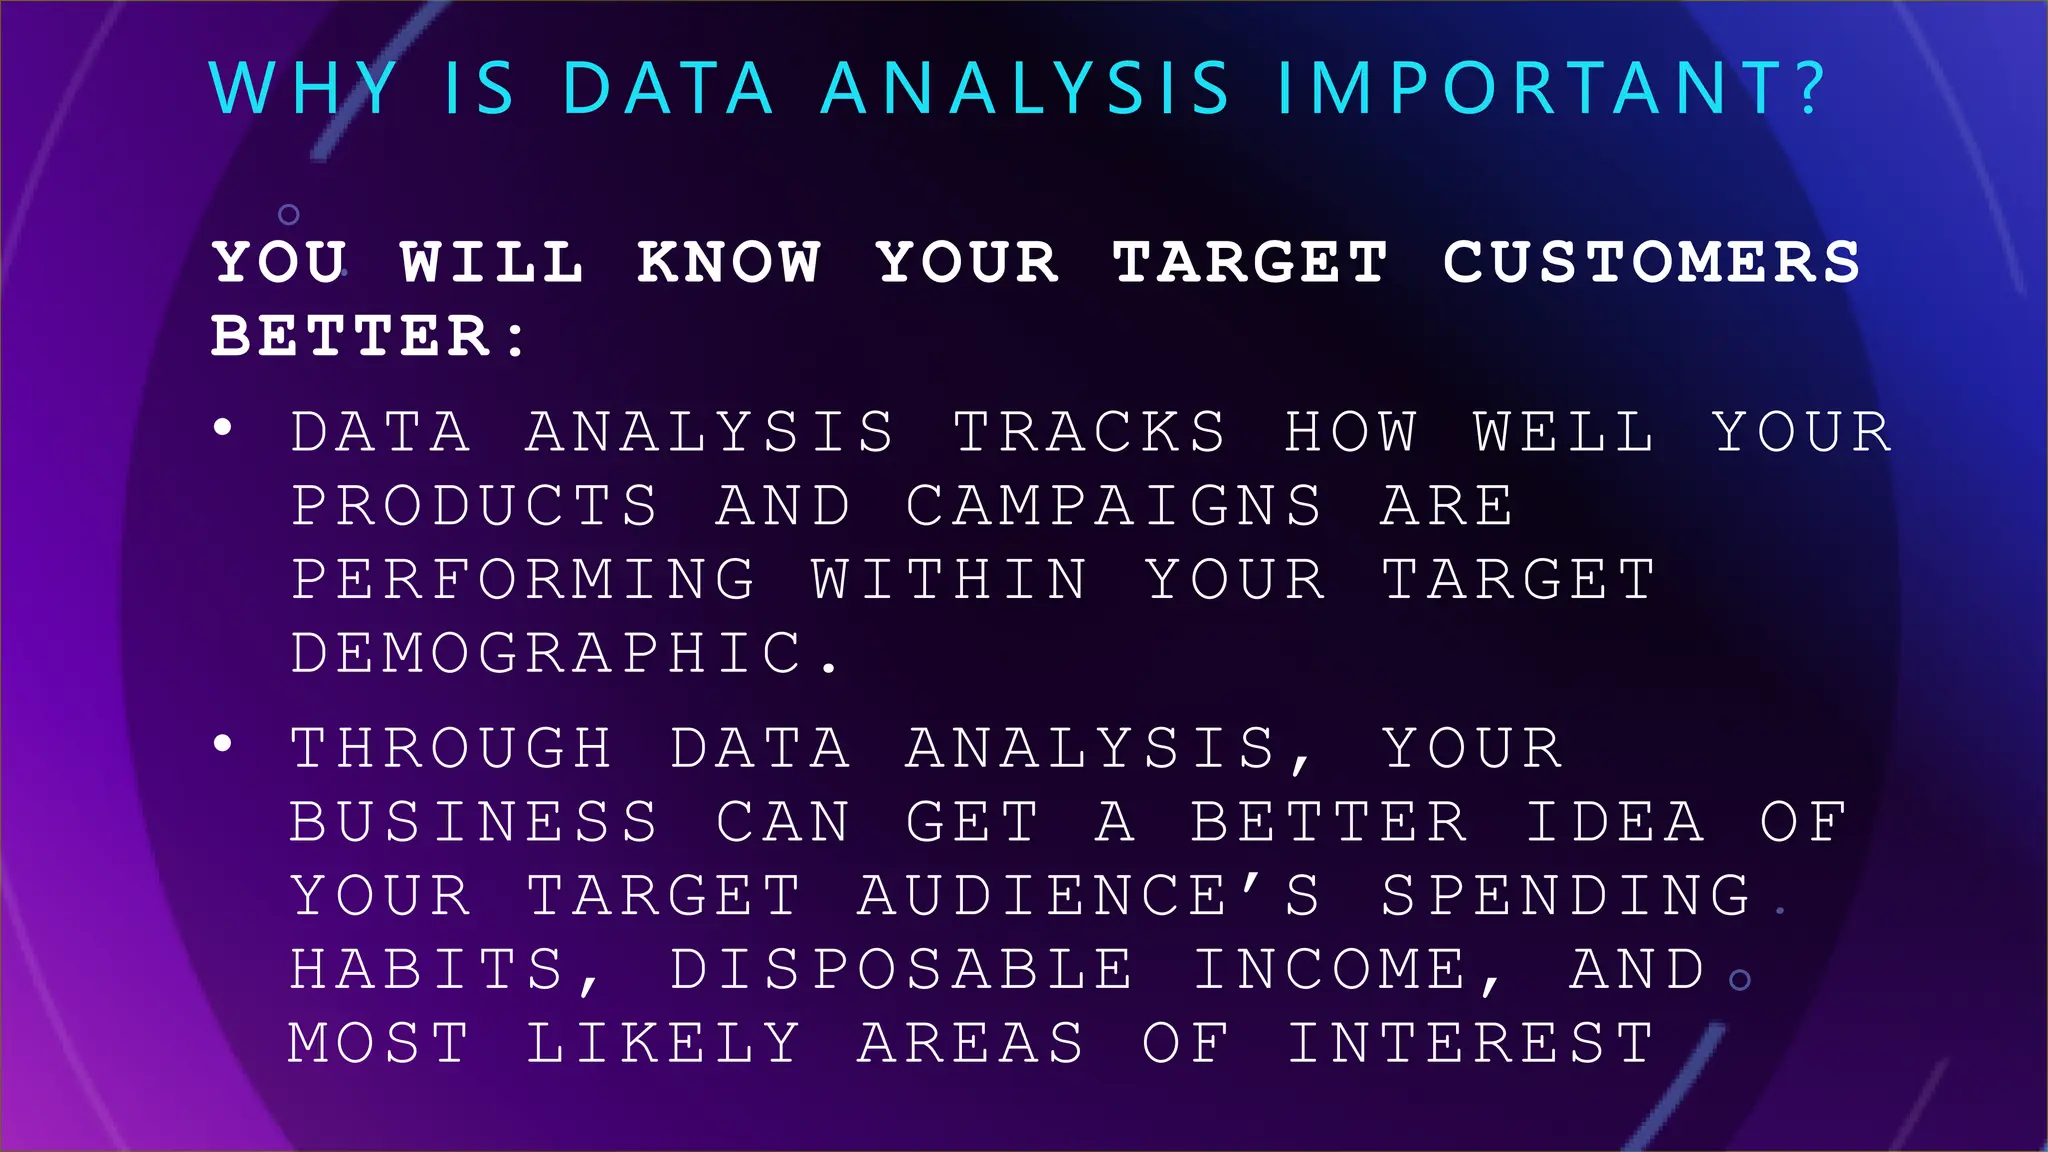
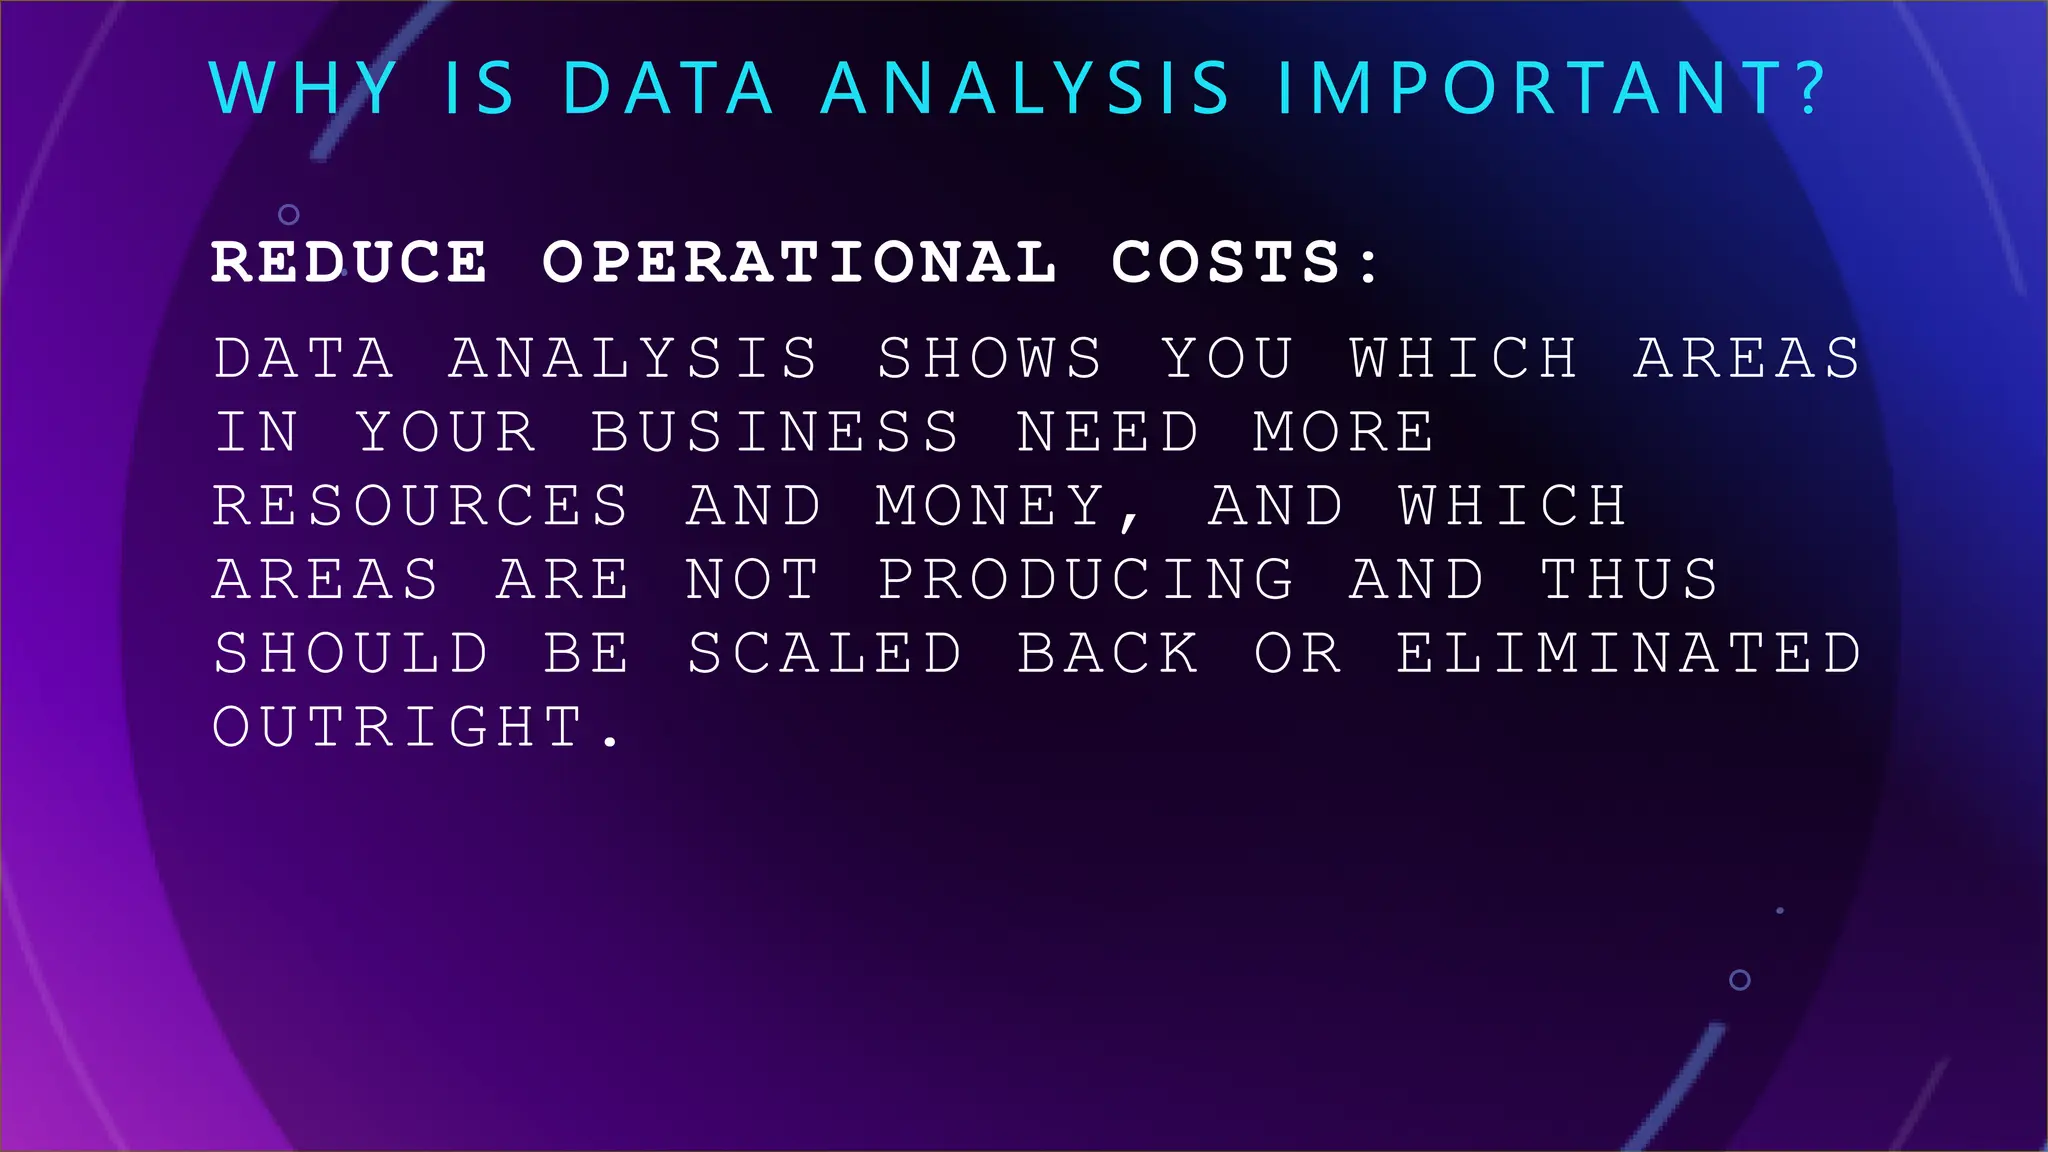
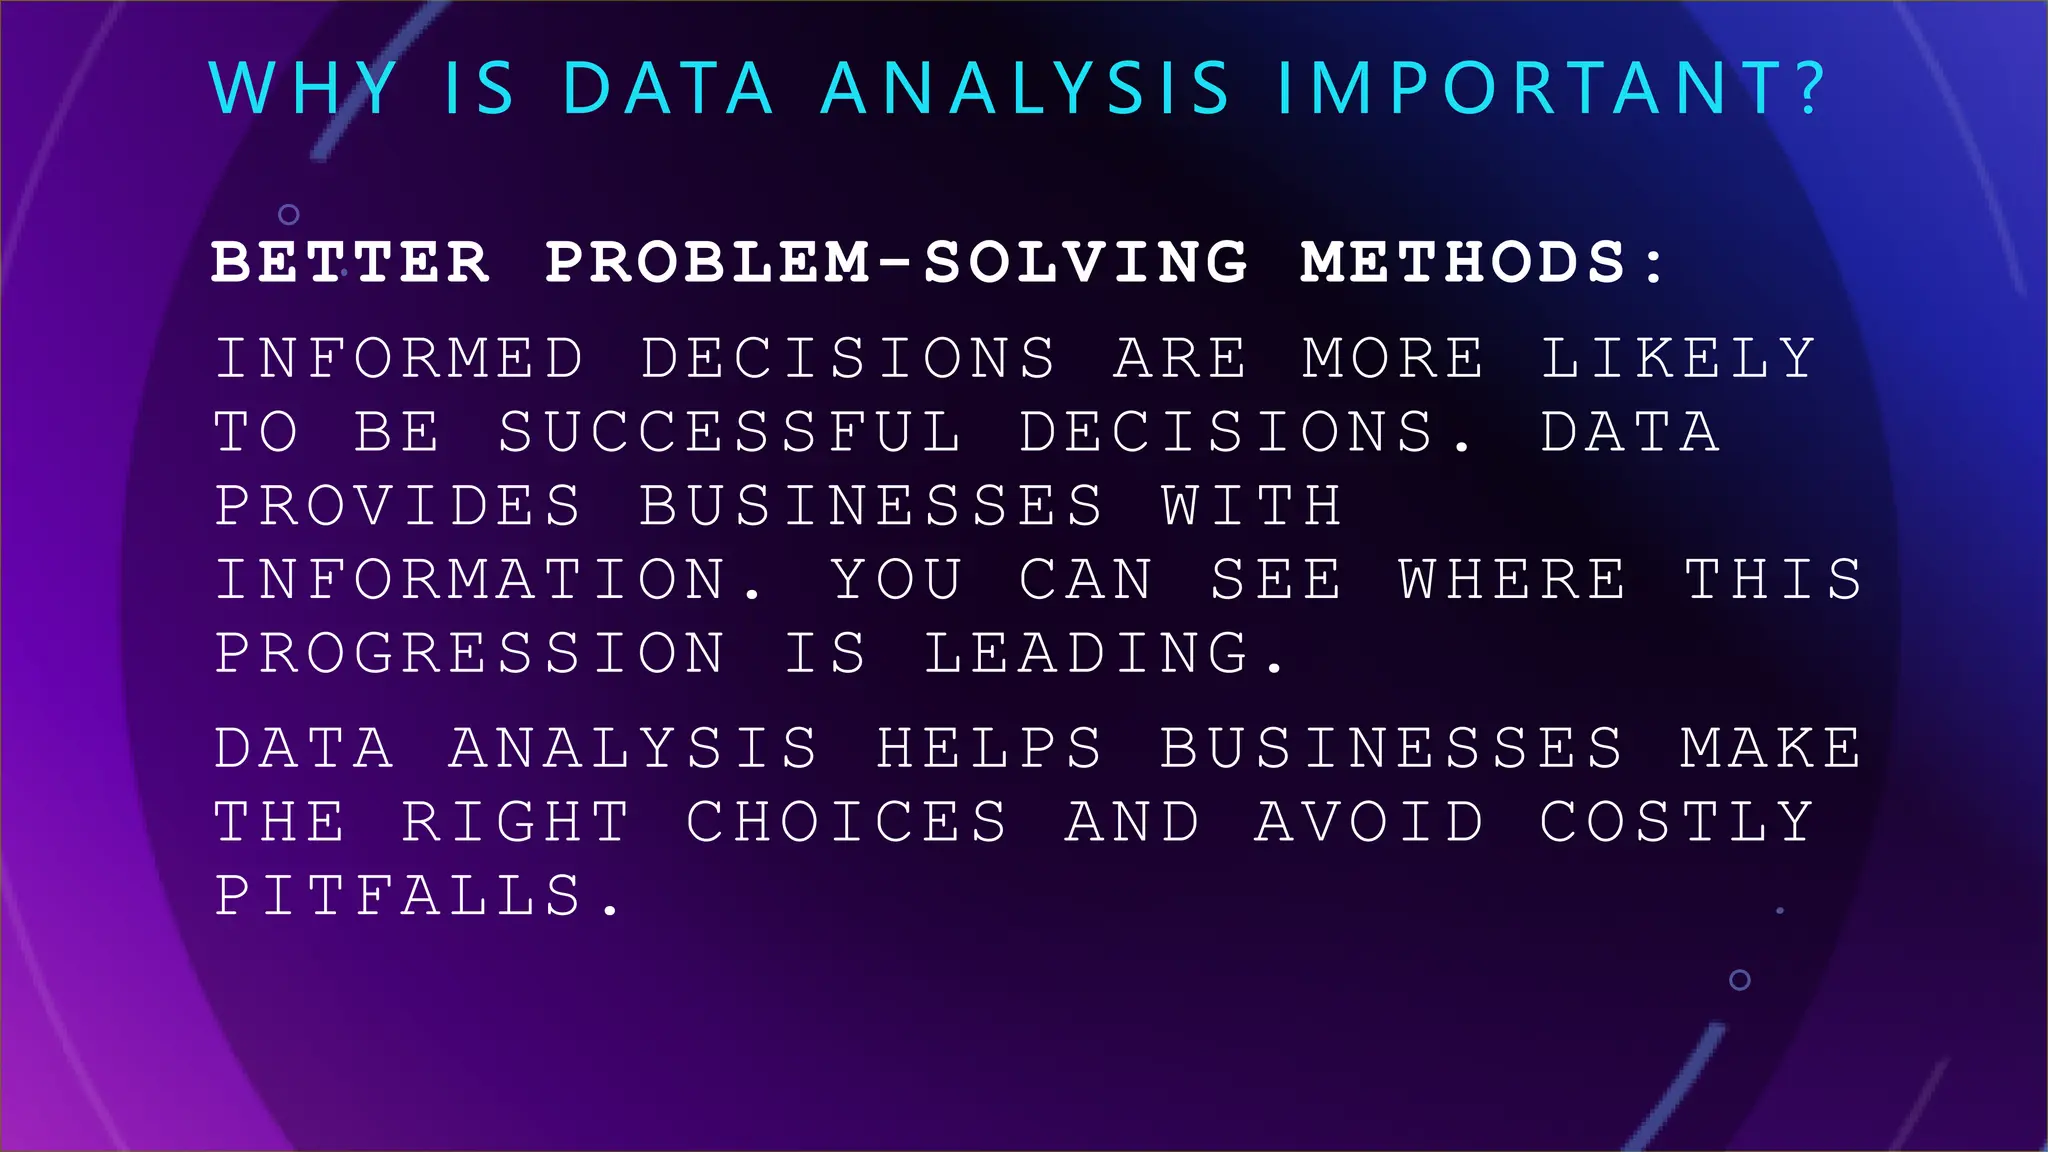
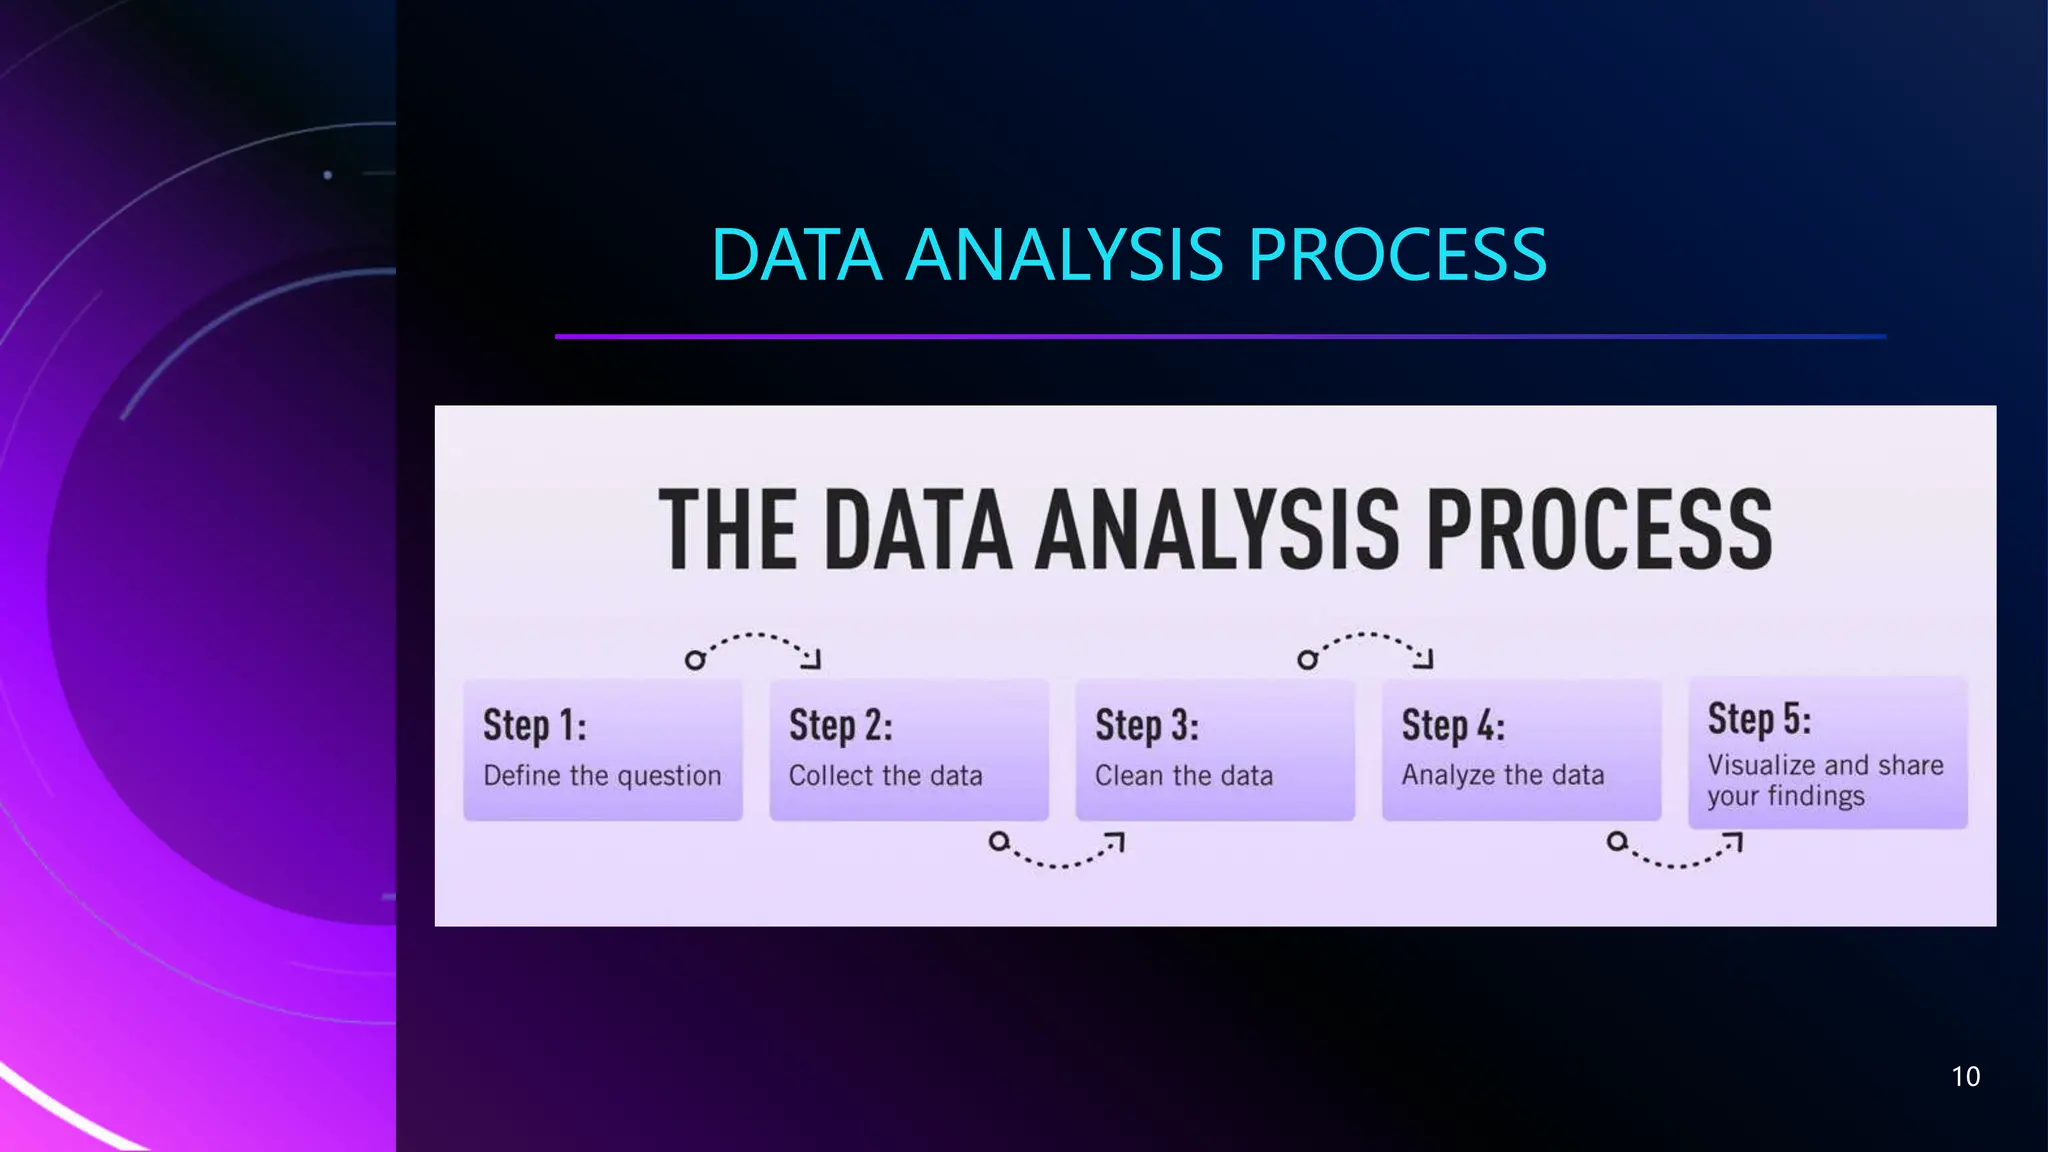


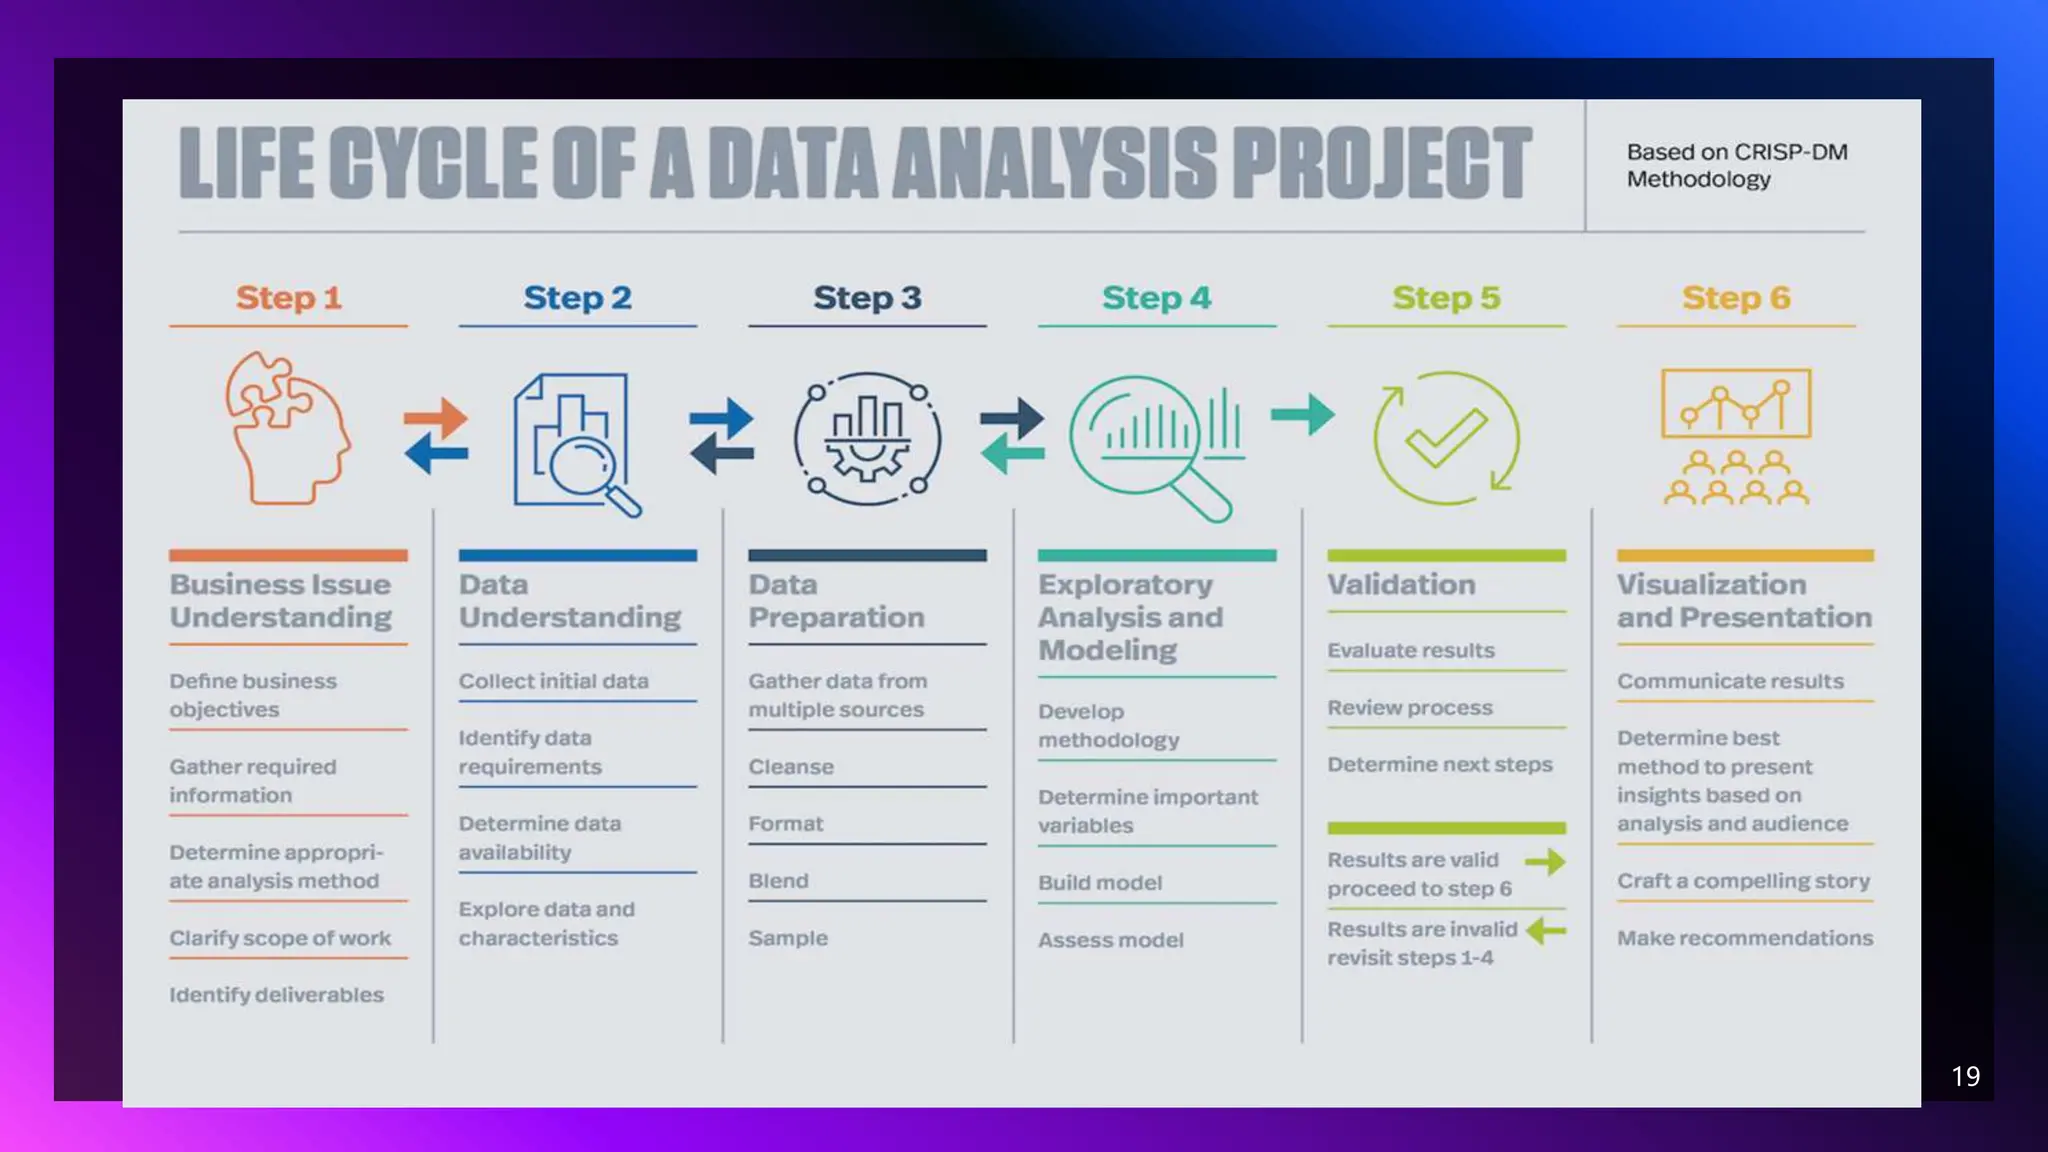


This document outlines the fundamentals of data analytics, focusing on its definition, importance, process, and types of analysis. It emphasizes how data analysis enables better decision-making for businesses by improving customer targeting, reducing operational costs, and providing accurate data. The document details a five-step data analysis process, including defining objectives, collecting and cleaning data, analyzing it, and sharing results, while also covering different types of analysis such as diagnostic, predictive, and prescriptive.