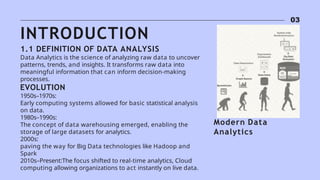
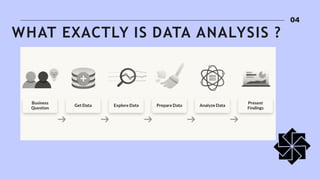
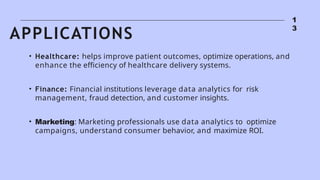
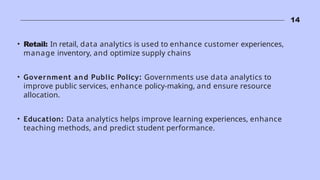
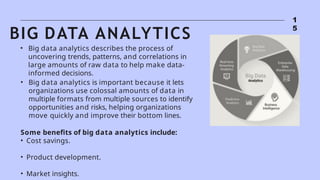
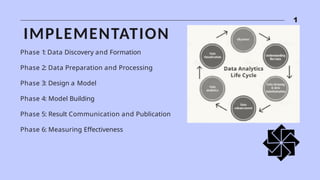
DATA ANALYSIS
ITS APPLICATION AND IMPORTANCE
AKUNURI DHANUSH -21X31A0509 18 NOVEMBER 2024
TABLE OF CONTENTS
01. INTRODUCTION
TO DATA ANALYSIS
02. DATA ANALYSIS
TECHNIQUES
03. DATA
VISUALIZATION
04. TOOLS AND
TECHNOLOGIES
05. APPLICATIONS &
IMPLEMENTATIONS
06. DATA SECURITY
&PRIVACY CONCERNS
07. FUTURE TRENDS
&IMPORTANCE
0
2
03
Modern Data
Analytics
INTRODUCTION
1.1 DEFINITION OF DATA ANALYSIS
Data Analytics is the science of analyzing raw data to uncover
patterns, trends, and insights. It transforms raw data into
meaningful information that can inform decision-making
processes.
EVOLUTION
1950s–1970s:
Early computing systems allowed for basic statistical analysis
on data.
1980s–1990s:
The concept of data warehousing emerged, enabling the
storage of large datasets for analytics.
2000s:
paving the way for Big Data technologies like Hadoop and
Spark
2010s–Present:The focus shifted to real-time analytics, Cloud
computing allowing organizations to act instantly on live data.
WHAT EXACTLY IS DATA ANALYSIS ?
04
1.2 TYPES OF DATA
05
06
Internal Data Sources
Data is generated through regular business
operations, such as sales records, customer
interactions, and financial transactions.
External Data Sources
Publicly available data that may be accessed by
anyone, is frequently offered by governmental
bodies, academic institutions, or non-profit
organisations.
Sensor and IoT Data Sources
Information is gathered by sensors and
Connected Devices including wearable Fitness
Trackers , Smart Home Gadgets and Industrial
Sensors.
1.3 SOURCES OF DATA
0
7
Relational Databases:
Examples: MySQL, PostgreSQL, Oracle.
NoSQL Databases:
Examples: MongoDB, Cassandra.
Data Lakes: Large repositories for storing raw, unprocessed data in its native format.
Examples: Hadoop, AWS S3.
Cloud Storage:
Examples: Google Cloud, Microsoft Azure.
1.4 D ATA S TO R A G E A N D D ATA B A S E S
0
7
Descriptive Analysis
It means a method used to summarize and
describe a data set’s main features.
Diagnostic Analysis
It is a technique used to look into and pinpoint
the root of a particular issue or problem.
Predictive Analysis
In order to predict future trends or events
Prescriptive Analysis
Answers the question “What should we do next?”.
It recommends the course of action to be taken.
2 . DATA ANALYSIS TECHNIQUES
3. DATA VISUALISATION
9
Data visualization translates complex data sets into visual formats that
are easier for the human brain to comprehend. This can include a variety
of visual tools such as:
Charts: Bar charts, line charts, pie charts, etc.
Graphs: Scatter plots, histograms, etc.
Maps: Geographic maps, heat maps, etc.
Dashboards: Interactive platforms that combine multiple visualizations.
The primary goal of data visualization is to make data more accessible
and easier to interpret, allowing users to identify patterns, trends, and
outliers quickly. This is particularly important in the context of big data,
where the sheer volume of information can be overwhelming without
effective visualization techniques..
10
Representations
Data visualization is the graphical
representation of information and data. It leverages
visual elements such as charts, graphs, and maps to
help users understand data more intuitively.
Common Tools for Data Visualization:
Tableau: Renowned for creating interactive,
shareable dashboards.
Microsoft Power BI: Integrated with Microsoft
ecosystem (Excel, Azure, etc.).
Google Data Studio: Free tool for creating
customizable and interactive reports.
Python Libraries (e.g., Matplotlib, Seaborn,
Plotly, Bokeh): Widely used in custom
visualization solutions for data science projects.
4. TOOLS AND TECHNOLOGIES
1
1
1
2
5. APPLICATIONS OF DATA ANALYSIS
1
3
• Healthcare: helps improve patient outcomes, optimize operations, and
enhance the efficiency of healthcare delivery systems.
• Finance: Financial institutions leverage data analytics for risk
management, fraud detection, and customer insights.
• Marketing: Marketing professionals use data analytics to optimize
campaigns, understand consumer behavior, and maximize ROI.
APPLICATIONS
14
• Retail: In retail, data analytics is used to enhance customer experiences,
manage inventory, and optimize supply chains
• Government and Public Policy: Governments use data analytics to
improve public services, enhance policy-making, and ensure resource
allocation.
• Education: Data analytics helps improve learning experiences, enhance
teaching methods, and predict student performance.
1
5
• Big data analytics is important because it lets
organizations use colossal amounts of data in
multiple formats from multiple sources to identify
opportunities and risks, helping organizations
move quickly and improve their bottom lines.
Some benefits of big data analytics include:
• Cost savings.
• Product development.
• Market insights.
BIG DATA ANALYTICS
• Big data analytics describes the process of
uncovering trends, patterns, and correlations in
large amounts of raw data to help make data-
informed decisions.
1
6
Phase 1
: Data Discovery and Formation
Phase 2: Data Preparation and Processing
Phase 3: Design a Model
Phase 4: Model Building
Phase 5: Result Communication and Publication
Phase 6: Measuring Effectiveness
IMPLEMENTATION
IMPACT OF DATA ANALYSIS
Impact of Data Analysis
Data analysis, whether on a small or large scale, can have a profound impact on business
performance. It can drive significant changes, leading to improved efficiency, increased
profitability, and a deeper understanding of market trends and customer behavior.
Informed decision-making
Allows businesses to make informed decisions based on facts, figures, and trends, rather than
relying on guesswork or intuition. It provides a solid foundation for strategic planning and policy-
making.
Impact on small businesses
For small businesses, even simple data analysis can lead to significant improvements. For
example, analyzing sales data can help identify which products are performing well and which
are not.
Impact on large businesses
For larger businesses, the impact of data analysis can be even more profound. Big data
analysis can uncover complex patterns and trends that would be impossible to detect .
1
8
THE CRITICAL ROLE OF DATA
ANALYSIS
19
2
0
6. UNDERSTANDING DATA PRIVACY IN
DATA ANALYTICS
21
7. TRENDS SHAPING THE FUTURE
OF DATA ANALYSIS
22
2
3
CONCLUSIO
N Data analysis is not just about numbers and statistics. It's about
asking the right questions, being curious about patterns and
trends, and having the courage to make data-driven decisions.
It's about telling a story with data, a story that can influence
strategies, change perspectives, and drive innovation.
The world of data is at your fingertips, waiting to be
explored.
THANK YOU

DATA ANALYSIS THE PRESENTATION BRIEFLY DONE

  • 1.
    DATA ANALYSIS ITS APPLICATIONAND IMPORTANCE AKUNURI DHANUSH -21X31A0509 18 NOVEMBER 2024
  • 2.
    TABLE OF CONTENTS 01.INTRODUCTION TO DATA ANALYSIS 02. DATA ANALYSIS TECHNIQUES 03. DATA VISUALIZATION 04. TOOLS AND TECHNOLOGIES 05. APPLICATIONS & IMPLEMENTATIONS 06. DATA SECURITY &PRIVACY CONCERNS 07. FUTURE TRENDS &IMPORTANCE 0 2
  • 3.
    03 Modern Data Analytics INTRODUCTION 1.1 DEFINITIONOF DATA ANALYSIS Data Analytics is the science of analyzing raw data to uncover patterns, trends, and insights. It transforms raw data into meaningful information that can inform decision-making processes. EVOLUTION 1950s–1970s: Early computing systems allowed for basic statistical analysis on data. 1980s–1990s: The concept of data warehousing emerged, enabling the storage of large datasets for analytics. 2000s: paving the way for Big Data technologies like Hadoop and Spark 2010s–Present:The focus shifted to real-time analytics, Cloud computing allowing organizations to act instantly on live data.
  • 4.
    WHAT EXACTLY ISDATA ANALYSIS ? 04
  • 5.
    1.2 TYPES OFDATA 05
  • 6.
    06 Internal Data Sources Datais generated through regular business operations, such as sales records, customer interactions, and financial transactions. External Data Sources Publicly available data that may be accessed by anyone, is frequently offered by governmental bodies, academic institutions, or non-profit organisations. Sensor and IoT Data Sources Information is gathered by sensors and Connected Devices including wearable Fitness Trackers , Smart Home Gadgets and Industrial Sensors. 1.3 SOURCES OF DATA
  • 7.
    0 7 Relational Databases: Examples: MySQL,PostgreSQL, Oracle. NoSQL Databases: Examples: MongoDB, Cassandra. Data Lakes: Large repositories for storing raw, unprocessed data in its native format. Examples: Hadoop, AWS S3. Cloud Storage: Examples: Google Cloud, Microsoft Azure. 1.4 D ATA S TO R A G E A N D D ATA B A S E S
  • 8.
    0 7 Descriptive Analysis It meansa method used to summarize and describe a data set’s main features. Diagnostic Analysis It is a technique used to look into and pinpoint the root of a particular issue or problem. Predictive Analysis In order to predict future trends or events Prescriptive Analysis Answers the question “What should we do next?”. It recommends the course of action to be taken. 2 . DATA ANALYSIS TECHNIQUES
  • 9.
    3. DATA VISUALISATION 9 Datavisualization translates complex data sets into visual formats that are easier for the human brain to comprehend. This can include a variety of visual tools such as: Charts: Bar charts, line charts, pie charts, etc. Graphs: Scatter plots, histograms, etc. Maps: Geographic maps, heat maps, etc. Dashboards: Interactive platforms that combine multiple visualizations. The primary goal of data visualization is to make data more accessible and easier to interpret, allowing users to identify patterns, trends, and outliers quickly. This is particularly important in the context of big data, where the sheer volume of information can be overwhelming without effective visualization techniques..
  • 10.
    10 Representations Data visualization isthe graphical representation of information and data. It leverages visual elements such as charts, graphs, and maps to help users understand data more intuitively. Common Tools for Data Visualization: Tableau: Renowned for creating interactive, shareable dashboards. Microsoft Power BI: Integrated with Microsoft ecosystem (Excel, Azure, etc.). Google Data Studio: Free tool for creating customizable and interactive reports. Python Libraries (e.g., Matplotlib, Seaborn, Plotly, Bokeh): Widely used in custom visualization solutions for data science projects.
  • 11.
    4. TOOLS ANDTECHNOLOGIES 1 1
  • 12.
  • 13.
    1 3 • Healthcare: helpsimprove patient outcomes, optimize operations, and enhance the efficiency of healthcare delivery systems. • Finance: Financial institutions leverage data analytics for risk management, fraud detection, and customer insights. • Marketing: Marketing professionals use data analytics to optimize campaigns, understand consumer behavior, and maximize ROI. APPLICATIONS
  • 14.
    14 • Retail: Inretail, data analytics is used to enhance customer experiences, manage inventory, and optimize supply chains • Government and Public Policy: Governments use data analytics to improve public services, enhance policy-making, and ensure resource allocation. • Education: Data analytics helps improve learning experiences, enhance teaching methods, and predict student performance.
  • 15.
    1 5 • Big dataanalytics is important because it lets organizations use colossal amounts of data in multiple formats from multiple sources to identify opportunities and risks, helping organizations move quickly and improve their bottom lines. Some benefits of big data analytics include: • Cost savings. • Product development. • Market insights. BIG DATA ANALYTICS • Big data analytics describes the process of uncovering trends, patterns, and correlations in large amounts of raw data to help make data- informed decisions.
  • 16.
    1 6 Phase 1 : DataDiscovery and Formation Phase 2: Data Preparation and Processing Phase 3: Design a Model Phase 4: Model Building Phase 5: Result Communication and Publication Phase 6: Measuring Effectiveness IMPLEMENTATION
  • 17.
    IMPACT OF DATAANALYSIS Impact of Data Analysis Data analysis, whether on a small or large scale, can have a profound impact on business performance. It can drive significant changes, leading to improved efficiency, increased profitability, and a deeper understanding of market trends and customer behavior. Informed decision-making Allows businesses to make informed decisions based on facts, figures, and trends, rather than relying on guesswork or intuition. It provides a solid foundation for strategic planning and policy- making. Impact on small businesses For small businesses, even simple data analysis can lead to significant improvements. For example, analyzing sales data can help identify which products are performing well and which are not. Impact on large businesses For larger businesses, the impact of data analysis can be even more profound. Big data analysis can uncover complex patterns and trends that would be impossible to detect . 1 8
  • 18.
    THE CRITICAL ROLEOF DATA ANALYSIS 19
  • 19.
    2 0 6. UNDERSTANDING DATAPRIVACY IN DATA ANALYTICS
  • 20.
    21 7. TRENDS SHAPINGTHE FUTURE OF DATA ANALYSIS
  • 21.
  • 22.
    2 3 CONCLUSIO N Data analysisis not just about numbers and statistics. It's about asking the right questions, being curious about patterns and trends, and having the courage to make data-driven decisions. It's about telling a story with data, a story that can influence strategies, change perspectives, and drive innovation. The world of data is at your fingertips, waiting to be explored.
  • 23.