Table of Contents
•Overview of Diagnostic Analytics
• Why Diagnostic Analytics is Used
• Origin and Evolution
• Common Tools in Diagnostic Analytics
• Integration with Data Management Process Flow
• Importance in Business
• Other Introductory Topics
• Summary
3.
Overview of DiagnosticAnalytics
• Diagnostic analytics explores data to uncover causes behind
observed outcomes.
• Characteristics:
• Drills down from descriptive insights.
• Utilizes statistical methods and data mining techniques.
• Aims to identify root causes of trends and patterns.
4.
Origin and Evolution
•Historical Context:
• Emergence from operations research and statistical analysis.
• Early use in quality control and manufacturing.
• Evolution:
• Integration with data mining and machine learning.
• Adoption in various industries including healthcare, finance,
and marketing
What is Causality?
•The relationship between cause and effect, where a change
in one variable leads to a change in another.
• Causal Inference: Process of determining whether one event
caused another.
7.
Challenges in EstablishingCausality
• Confounding Variables:
• Factors that are correlated with both the cause and the effect,
leading to incorrect conclusions.
• Correlation vs. Causation:
• Correlation does not imply causation.
• Need for additional evidence to establish causality.
• Reverse Causality:
• Situation where the effect precedes the cause.
• Common in dynamic systems and feedback loops.
Types of CausalRelationships
• Direct Causality:
• Clear and direct relationship between cause and effect.
• Indirect Causality:
• Cause indirectly influences the effect through intermediate
variables.
• Spurious Causality:
• False causation due to confounding variables.
• Partial Causality:
• Cause only partially influences the effect, other factors also
contribute.
10.
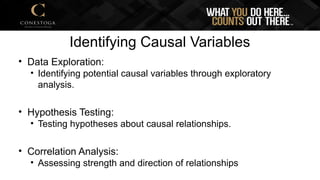
Identifying Causal Variables
•Data Exploration:
• Identifying potential causal variables through exploratory
analysis.
• Hypothesis Testing:
• Testing hypotheses about causal relationships.
• Correlation Analysis:
• Assessing strength and direction of relationships
11.
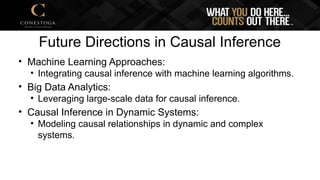
Future Directions inCausal Inference
• Machine Learning Approaches:
• Integrating causal inference with machine learning algorithms.
• Big Data Analytics:
• Leveraging large-scale data for causal inference.
• Causal Inference in Dynamic Systems:
• Modeling causal relationships in dynamic and complex
systems.
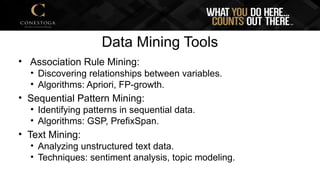
Data Mining Tools
•Association Rule Mining:
• Discovering relationships between variables.
• Algorithms: Apriori, FP-growth.
• Sequential Pattern Mining:
• Identifying patterns in sequential data.
• Algorithms: GSP, PrefixSpan.
• Text Mining:
• Analyzing unstructured text data.
• Techniques: sentiment analysis, topic modeling.
15.
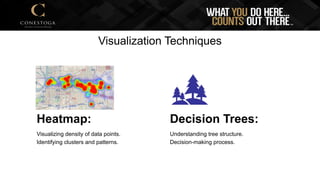
Visualization Tools
• ScatterPlots:
• Visualizing relationships between two variables.
• Heatmaps:
• Displaying density of data points.
• Decision Trees:
• Representing decision-making processes.
16.
Integration with DataManagement Flow
• Data Collection:
• Identifying relevant data sources.
• Collecting structured and unstructured data.
• Data Handling:
• Cleaning and preprocessing data.
• Feature engineering.
• Problem Identification:
• Formulating hypotheses.
• Defining business questions.
17.
Importance in Business
•Business Impact Analysis:
• Evaluating the effects of business decisions.
• Assessing risks and opportunities.
• Solution Development:
• Designing strategies to address identified issues.
• Developing products/services based on customer needs.
• Product/Service Enhancement:
• Optimizing existing offerings.
• Identifying areas for improvement.
18.
Importance in Business
•Root Cause Identification:
• Understanding underlying causes of problems.
• Preventing recurrence of issues.
• Strategic Planning:
• Informing long-term business strategies.
• Identifying market trends and opportunities.
19.
Other Introductory Topics
•Business Intelligence vs. Diagnostic Analytics:
• Differences in focus and methodology.
• Complementary roles in data analysis.
• Role of Critical Thinking:
• Importance in forming hypotheses.
• Evaluating validity of findings.
20.
Other Introductory Topics(Cont.)
• Ethical Considerations:
• Privacy and data security.
• Bias and fairness in analysis.
• Regulatory Compliance:
• Ensuring adherence to data protection laws.
• Compliance with industry standards.
21.
Statistical Analysis inDetail
• Linear Regression:
• Modeling relationships between variables.
• Assumptions and interpretation.
• Logistic Regression:
• Predicting binary outcomes.
• Applications in classification.
22.
Statistical Analysis inDetail
• Time Series Analysis:
• Analyzing sequential data points.
• Forecasting future trends.
• ANOVA (Analysis of Variance):
• Comparing means across multiple groups.
• Understanding sources of variation.
23.
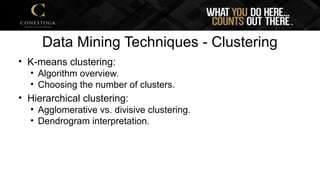
Data Mining Techniques- Clustering
• K-means clustering:
• Algorithm overview.
• Choosing the number of clusters.
• Hierarchical clustering:
• Agglomerative vs. divisive clustering.
• Dendrogram interpretation.
24.
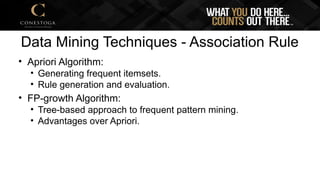
Data Mining Techniques- Association Rule
• Apriori Algorithm:
• Generating frequent itemsets.
• Rule generation and evaluation.
• FP-growth Algorithm:
• Tree-based approach to frequent pattern mining.
• Advantages over Apriori.
25.
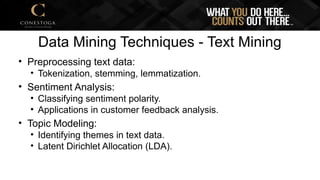
Data Mining Techniques- Text Mining
• Preprocessing text data:
• Tokenization, stemming, lemmatization.
• Sentiment Analysis:
• Classifying sentiment polarity.
• Applications in customer feedback analysis.
• Topic Modeling:
• Identifying themes in text data.
• Latent Dirichlet Allocation (LDA).
Data
• This coursecan be summed up in a single word. Data.
• What’s so important about data?
• It drives all our business decisions
• It dictates how we run our companies
• It predicts future trends
• It helps us understand impossible scenarios.
• Data is the life-blood of every industry
• However, data must hold value, this value is defined by the
‘data quality factors’
31.
Data Quality Factors
•Relevance
• Accuracy
• Timeliness
• Completeness
• Volume
• Variety
• Velocity
• Validity
• Accessibility
• Security
• Cost
• We define data by multiple factors
• Not all data is made equal, so let’s explore the critical factors
32.
Data Quality Factors(1/4)
• Relevance:
• How pertinent the data is to the intended purpose.
• Provides valuable insights and informs decision-making.
• Accuracy:
• The degree to which data is free from errors or inaccuracies.
• Ensures reliability and trustworthiness in decision-making.
• Timeliness:
• How current the data is at the time of analysis.
• Timely data allows for real-time insights and immediate actions.
33.
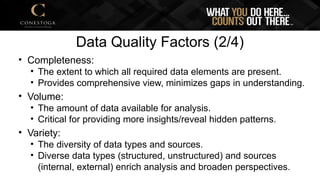
Data Quality Factors(2/4)
• Completeness:
• The extent to which all required data elements are present.
• Provides comprehensive view, minimizes gaps in understanding.
• Volume:
• The amount of data available for analysis.
• Critical for providing more insights/reveal hidden patterns.
• Variety:
• The diversity of data types and sources.
• Diverse data types (structured, unstructured) and sources
(internal, external) enrich analysis and broaden perspectives.
34.
Data Quality Factors(3/4)
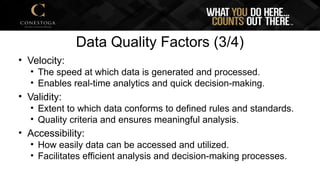
• Velocity:
• The speed at which data is generated and processed.
• Enables real-time analytics and quick decision-making.
• Validity:
• Extent to which data conforms to defined rules and standards.
• Quality criteria and ensures meaningful analysis.
• Accessibility:
• How easily data can be accessed and utilized.
• Facilitates efficient analysis and decision-making processes.
35.
Data Quality Factors(4/4)
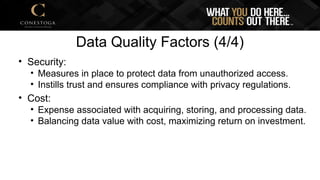
• Security:
• Measures in place to protect data from unauthorized access.
• Instills trust and ensures compliance with privacy regulations.
• Cost:
• Expense associated with acquiring, storing, and processing data.
• Balancing data value with cost, maximizing return on investment.
36.
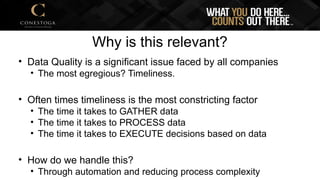
Why is thisrelevant?
• Data Quality is a significant issue faced by all companies
• The most egregious? Timeliness.
• Often times timeliness is the most constricting factor
• The time it takes to GATHER data
• The time it takes to PROCESS data
• The time it takes to EXECUTE decisions based on data
• How do we handle this?
• Through automation and reducing process complexity