Download to read offline


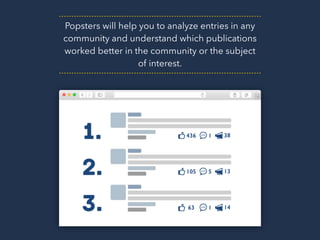

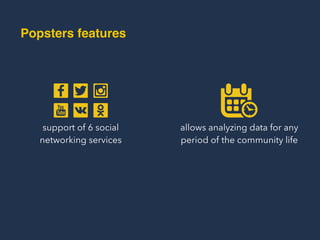
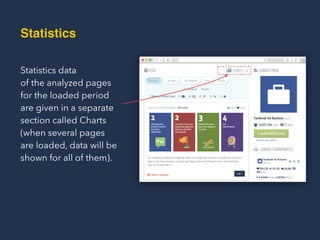
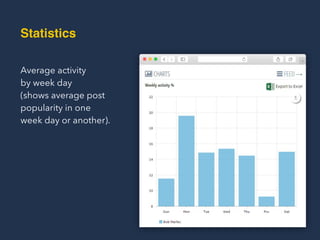
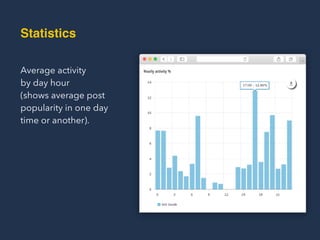

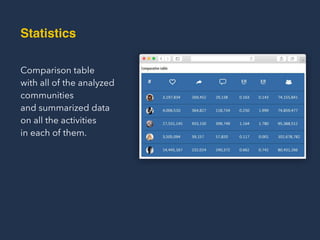
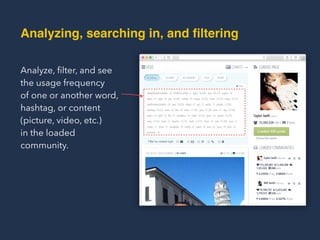
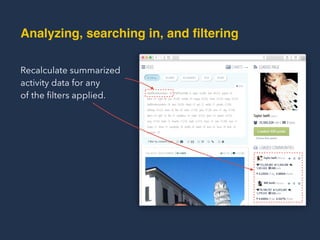
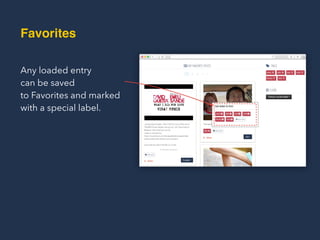
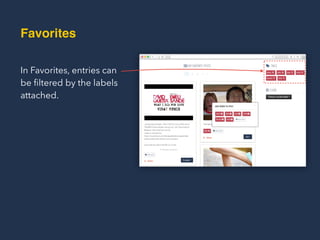
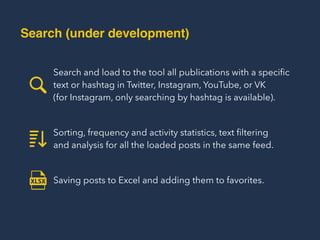
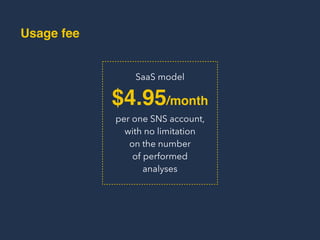


Popsters is a social media content analytics tool that enables users to analyze community entries across various social networking services, helping marketers understand which posts gain more engagement. The tool features functionalities like sorting, filtering, and saving analysis results to different formats, allowing users to enhance their content's effectiveness and track performance over time. It operates on a subscription model priced at $4.95 per month per account, with discounts for longer commitments.


