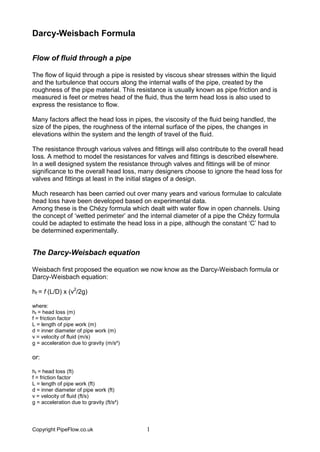
The document discusses formulas for calculating head loss in pipes due to fluid flow resistance. It describes the Darcy-Weisbach formula, which expresses head loss as a function of friction factor, pipe length and diameter, fluid velocity, and gravity. It also discusses the work of researchers like Darcy, Fanning, Colebrook and White who contributed to developing and refining formulas for calculating friction factors and head loss. The Moody chart enabled determining friction factors graphically based on Reynolds number and relative pipe roughness.
Reynolds number and geometry concept, Momentum integral equations, Boundary layer equations, Flow over a flat plate, Flow over cylinder, Pipe flow, fully developed laminar pipe flow, turbulent pipe flow, Losses in pipe flow
Minor losses are a major part in calculating the flow, pressure, or energy reduction in piping systems. Liquid moving through pipes carries momentum and energy due to the forces acting upon it such as pressure and gravity. Just as certain aspects of the system can increase the fluids energy, there are components of the system that act against the fluid and reduce its energy, velocity, or momentum. Friction and minor losses in pipes are major contributing factors.
Dimension less numbers in applied fluid mechanicstirath prajapati
In dimensional analysis, a dimensionless quantity is a quantity to which no physical dimension is assigned. It is also known as a bare number or pure number or a quantity of dimension one[1] and the corresponding unit of measurement in the SI is one (or 1) unit[2][3] and it is not explicitly shown. Dimensionless quantities are widely used in many fields, such as mathematics, physics, chemistry, engineering, and economics. Examples of quantities, to which dimensions are regularly assigned, are length, time, and speed, which are measured in dimensional units, such as meter , second and meter per second. This is considered to aid intuitive understanding. However, especially in mathematical physics, it is often more convenient to drop the assignment of explicit dimensions and express the quantities without dimensions, e.g., addressing the speed of light simply by the dimensionless number 1.
Pipe Flow Friction factor in fluid mechanicsUsman Shah
This slide will explain you the chemical engineering terms .Al about the basics of this slide are explain in it. The basics of fluid mechanics, heat transfer, chemical engineering thermodynamics, fluid motions, newtonian fluids, are explain in this process. ,education ,chemical engineerin ,chemical engineering ,fluid mechanics ,heat transfer ,chemical process principles ,macdonald ,kfc ,mazeo ,chemicals ,engineers ,cv formatin ,law ,laptop.
Head losses
Major Losses
Minor Losses
Definition • Dimensional Analysis • Types • Darcy Weisbech Equation • Major Losses • Minor Losses • Causes Head Losses
3. • Head loss is loss of energy per unit weight. • Head = Energy of Fluid / Weight • Head losses can be – Kinetic Head – Potential Head – Pressure Head 6/10/2015 4Danial Gondal Head Loss
4. • Kinetic Head – K.H. = kinetic energy / Weight = v² /2g • Potential Head – P.H = Potential Energy / Weight = mgz /mg = z • Pressure Head – P.H = P/ ρ g 6/10/2015 5
5. • (P/ ρ g) + (v² /2g ) + (z) = constant • (FL-2F-1L3LT-2L-1T2) + (L2T-2L1T2)+(L) = constant • (L) + (L) + (L) = constant • As L represent height so it is dimensionally L. 6/10/2015 6 Dimensional Analysis
6. • However the equation (P/ ρ g) + (v² /2g ) + (z) = constant Is valid for Bernoulli's Inviscid flow case. As we are studying viscous flow so (P1/ ρ g) + (v1² /2g ) + (z1) = EGL1(Energy Grade Line At point 1) (P2/ ρ g) + (v2² /2g ) + (z2) = EGL2(Energy Grade Line At point 2) 6/10/2015 7 Head Loss
7. • For Inviscid Flow EGL1 - EGL2= 0 • For Viscous Flow EGL1 - EGL2= Hf 6/10/2015 8 Head Loss
8. MAJOR LOSSES IN PIPES
9. •Friction loss is the loss of energy or “head” that occurs in pipe flow due to viscous effects generated by the surface of the pipe. • Friction Loss is considered as a "major loss" •In mechanical systems such as internal combustion engines, it refers to the power lost overcoming the friction between two moving surfaces. •This energy drop is dependent on the wall shear stress (τ) between the fluid and pipe surface. 6/10/2015 10 Friction Loss
10. •The shear stress of a flow is also dependent on whether the flow is turbulent or laminar. •For turbulent flow, the pressure drop is dependent on the roughness of the surface. •In laminar flow, the roughness effects of the wall are negligible because, in turbulent flow, a thin viscous layer is formed near the pipe surface that causes a loss in energy, while in laminar flow, this viscous layer is non-existent. 6/10/2015 11 Friction Loss
11. Frictional head losses are losses due to shear stress on the pipe walls. The general equation for head loss due to friction is the Darcy-Weisbach equation, which is where f = Darcy-Weisbach friction factor, L = length of pipe, D = pipe diameter, and V = cross sectional average flow velocity.
1. Introduction to Kinematics
2. Methods of Describing Fluid Motion
a). Lagrangian Method
b). Eulerian Method
3. Flow Patterns
- Stream Line
- Path Line
- Streak Line
- Streak Tube
4. Classification of Fluid Flow
a). Steady and Unsteady Flow
b). Uniform and Non-Uniform Flow
c). Laminar and Turbulent Flow
d). Rotational and Irrotational Flow
e). Compressible and Incompressible Flow
f). Ideal and Real Flow
g). One, Two and Three Dimensional Flow
5. Rate of Flow (Discharge) and Continuity Equation
6. Continuity Equation in Three Dimensions
7. Velocity and Acceleration
8. Stream and Velocity Potential Functions
Effect of Height and Surface Roughness of a Broad Crested Weir on the Dischar...RafidAlboresha
Weir is usually incorporated as control or regulation devices in hydraulic systems,
with flow measurement as their secondary. It is normally intended for use in the field and thus
to regulate broad discharges. Broad-Crested weir is among the oldest common weir types. In this
paper, the effect of height and surface roughness for different Board Crested weirs models were
studied on discharge coefficient (Cd) in a horizontal open channel. In the crest of the weir,
certain materials may be combined with concrete (e.g., boulders) or may be used as cladding to
minimize the effect of water overflow (e.g. stone). The weir surface should not be considered
smooth in this case, and the discharge coefficient (Cd) must be re-estimated. For these purposes, laboratory flume was used to study the effect of height and surface roughness on the discharge coefficients with four of the different weir models dimensions of the concrete blocks. In this study, the flow conditions were considered to be free water flow and the viscosity effect was neglected. In all cases, the weir height effect was directly proportional to the discharge coefficient while the surface roughness effect was found to be inversely proportional to the coefficient Cd of the case study.
lab 4 requermenrt.pdf
MECH202 – Fluid Mechanics – 2015 Lab 4
Fluid Friction Loss
Introduction
In this experiment you will investigate the relationship between head loss due to fluid friction and
velocity for flow of water through both smooth and rough pipes. To do this you will:
1) Express the mathematical relationship between head loss and flow velocity
2) Compare measured and calculated head losses
3) Estimate unknown pipe roughness
Background
When a fluid is flowing through a pipe, it experiences some resistance due to shear stresses, which
converts some of its energy into unwanted heat. Energy loss through friction is referred to as “head
loss due to friction” and is a function of the; pipe length, pipe diameter, mean flow velocity,
properties of the fluid and roughness of the pipe (the later only being a factor for turbulent flows),
but is independent of pressure under with which the water flows. Mathematically, for a turbulent
flow, this can be expressed as:
hL=f
L
D
V
2
2 g
(Eq.1)
where
hL = Head loss due to friction (m)
f = Friction factor
L = Length of pipe (m)
V = Average flow velocity (m/s)
g = Gravitational acceleration (m/s^2)
Friction head losses in straight pipes of different sizes can be investigated over a wide range of
Reynolds' numbers to cover the laminar, transitional, and turbulent flow regimes in smooth pipes. A
further test pipe is artificially roughened and, at the higher Reynolds' numbers, shows a clear
departure from typical smooth bore pipe characteristics.
Experiment 4: Fluid Friction Loss
The head loss and flow velocity can also be expressed as:
1) hL∝V −whe n flow islaminar
2) hL∝V
n
−whe n flow isturbulent
where hL is the head loss due to friction and V is the fluid velocity. These two types of flow are
seperated by a trasition phase where no definite relationship between hL and V exist. Graphs
of hL −V and log (hL) − log (V ) are shown in Figure 1,
Figure 1. Relationship between hL ( expressed by h) and V ( expressed by u ) ;
as well as log (hL) and log ( V )
Experiment 4: Fluid Friction Loss
Experimental Apparatus
In Figure 2, the fluid friction apparatus is shown on the right while the Hydraulic bench that
supplies the water to the fluid friction apparatus is shown on the left. The flow rate that the
hydraulic bench provides can be measured by measuring the time required to collect a known
volume.
Figure 2. Experimental Apparatus
Experimental Procedure
1) Prime the pipe network with water by running the system until no air appears to be discharging
from the fluid friction apparatus.
2) Open and close the appropriate valves to obtain water flow through the required test pipe, the four
lowest pipes of the fluid friction apparatus will be used for this experiment. From the bottom to the
top, these are; the rough pipe with large diameter and then smooth pipes with three successively
smaller diameters.
3) Measure head loss ...
Episode 38 : Bin and Hopper Design
< 1960s storage bins were designed by guessing
Then in 1960s A.W. Jenike changed all.- He developed theory, methods to apply, inc. the eqns. And measurement of necessary particles properties.
SAJJAD KHUDHUR ABBAS
Ceo , Founder & Head of SHacademy
Chemical Engineering , Al-Muthanna University, Iraq
Oil & Gas Safety and Health Professional – OSHACADEMY
Trainer of Trainers (TOT) - Canadian Center of Human
Development
This presentation was created to provide a quick refresher to single-phase fluid flow line sizing. The content of this presentation was obtained from various literature (handbooks and website).
Please provide your comments
3 ijaems jun-2015-17-comparative pressure drop in laminar and turbulent flowsINFOGAIN PUBLICATION
The study of Turbulent flow characteristics in complex geometries receives considerable attention due to its Importance in many engineering applications and has been the subject of interest for researchers. Some of these include the energy conversion systems found in same design of heat exchangers, nuclear reactor, solar collectors & cooling of industrial machines and electronic components. Flow in channels with baffle plates occurs in many industrial applications such as heat exchangers, filtration, chemical reactors, and desalination. These baffles cause turbulence which leads to increases friction within the pipe or duct and leads significant pressure drop.
This work is concern with the comparative flow and pressure distribution analysis of a smooth and segmented Baffles pipe. In which pressure drop during the flow is examined and with the help of hydrodynamic characteristics performance is predicted with the help of Finite element volume tool ANSYS- Fluent, where simulation is been done. The goal is to carry out evaluating pressure drop across the pipe using different turbulent model and at simulation is done for wide range of Reynolds number in both laminar and turbulent flow regimes. The FEV results are validated with well published results in literature and furthermore with experimentation. The FEV and experimental results show good agreement.
Connector Corner: Automate dynamic content and events by pushing a buttonDianaGray10
Here is something new! In our next Connector Corner webinar, we will demonstrate how you can use a single workflow to:
Create a campaign using Mailchimp with merge tags/fields
Send an interactive Slack channel message (using buttons)
Have the message received by managers and peers along with a test email for review
But there’s more:
In a second workflow supporting the same use case, you’ll see:
Your campaign sent to target colleagues for approval
If the “Approve” button is clicked, a Jira/Zendesk ticket is created for the marketing design team
But—if the “Reject” button is pushed, colleagues will be alerted via Slack message
Join us to learn more about this new, human-in-the-loop capability, brought to you by Integration Service connectors.
And...
Speakers:
Akshay Agnihotri, Product Manager
Charlie Greenberg, Host
Elevating Tactical DDD Patterns Through Object CalisthenicsDorra BARTAGUIZ
After immersing yourself in the blue book and its red counterpart, attending DDD-focused conferences, and applying tactical patterns, you're left with a crucial question: How do I ensure my design is effective? Tactical patterns within Domain-Driven Design (DDD) serve as guiding principles for creating clear and manageable domain models. However, achieving success with these patterns requires additional guidance. Interestingly, we've observed that a set of constraints initially designed for training purposes remarkably aligns with effective pattern implementation, offering a more ‘mechanical’ approach. Let's explore together how Object Calisthenics can elevate the design of your tactical DDD patterns, offering concrete help for those venturing into DDD for the first time!
Software Delivery At the Speed of AI: Inflectra Invests In AI-Powered QualityInflectra
In this insightful webinar, Inflectra explores how artificial intelligence (AI) is transforming software development and testing. Discover how AI-powered tools are revolutionizing every stage of the software development lifecycle (SDLC), from design and prototyping to testing, deployment, and monitoring.
Learn about:
• The Future of Testing: How AI is shifting testing towards verification, analysis, and higher-level skills, while reducing repetitive tasks.
• Test Automation: How AI-powered test case generation, optimization, and self-healing tests are making testing more efficient and effective.
• Visual Testing: Explore the emerging capabilities of AI in visual testing and how it's set to revolutionize UI verification.
• Inflectra's AI Solutions: See demonstrations of Inflectra's cutting-edge AI tools like the ChatGPT plugin and Azure Open AI platform, designed to streamline your testing process.
Whether you're a developer, tester, or QA professional, this webinar will give you valuable insights into how AI is shaping the future of software delivery.
Essentials of Automations: Optimizing FME Workflows with ParametersSafe Software
Are you looking to streamline your workflows and boost your projects’ efficiency? Do you find yourself searching for ways to add flexibility and control over your FME workflows? If so, you’re in the right place.
Join us for an insightful dive into the world of FME parameters, a critical element in optimizing workflow efficiency. This webinar marks the beginning of our three-part “Essentials of Automation” series. This first webinar is designed to equip you with the knowledge and skills to utilize parameters effectively: enhancing the flexibility, maintainability, and user control of your FME projects.
Here’s what you’ll gain:
- Essentials of FME Parameters: Understand the pivotal role of parameters, including Reader/Writer, Transformer, User, and FME Flow categories. Discover how they are the key to unlocking automation and optimization within your workflows.
- Practical Applications in FME Form: Delve into key user parameter types including choice, connections, and file URLs. Allow users to control how a workflow runs, making your workflows more reusable. Learn to import values and deliver the best user experience for your workflows while enhancing accuracy.
- Optimization Strategies in FME Flow: Explore the creation and strategic deployment of parameters in FME Flow, including the use of deployment and geometry parameters, to maximize workflow efficiency.
- Pro Tips for Success: Gain insights on parameterizing connections and leveraging new features like Conditional Visibility for clarity and simplicity.
We’ll wrap up with a glimpse into future webinars, followed by a Q&A session to address your specific questions surrounding this topic.
Don’t miss this opportunity to elevate your FME expertise and drive your projects to new heights of efficiency.
LF Energy Webinar: Electrical Grid Modelling and Simulation Through PowSyBl -...DanBrown980551
Do you want to learn how to model and simulate an electrical network from scratch in under an hour?
Then welcome to this PowSyBl workshop, hosted by Rte, the French Transmission System Operator (TSO)!
During the webinar, you will discover the PowSyBl ecosystem as well as handle and study an electrical network through an interactive Python notebook.
PowSyBl is an open source project hosted by LF Energy, which offers a comprehensive set of features for electrical grid modelling and simulation. Among other advanced features, PowSyBl provides:
- A fully editable and extendable library for grid component modelling;
- Visualization tools to display your network;
- Grid simulation tools, such as power flows, security analyses (with or without remedial actions) and sensitivity analyses;
The framework is mostly written in Java, with a Python binding so that Python developers can access PowSyBl functionalities as well.
What you will learn during the webinar:
- For beginners: discover PowSyBl's functionalities through a quick general presentation and the notebook, without needing any expert coding skills;
- For advanced developers: master the skills to efficiently apply PowSyBl functionalities to your real-world scenarios.
The Art of the Pitch: WordPress Relationships and SalesLaura Byrne
Clients don’t know what they don’t know. What web solutions are right for them? How does WordPress come into the picture? How do you make sure you understand scope and timeline? What do you do if sometime changes?
All these questions and more will be explored as we talk about matching clients’ needs with what your agency offers without pulling teeth or pulling your hair out. Practical tips, and strategies for successful relationship building that leads to closing the deal.
UiPath Test Automation using UiPath Test Suite series, part 3DianaGray10
Welcome to UiPath Test Automation using UiPath Test Suite series part 3. In this session, we will cover desktop automation along with UI automation.
Topics covered:
UI automation Introduction,
UI automation Sample
Desktop automation flow
Pradeep Chinnala, Senior Consultant Automation Developer @WonderBotz and UiPath MVP
Deepak Rai, Automation Practice Lead, Boundaryless Group and UiPath MVP
GDG Cloud Southlake #33: Boule & Rebala: Effective AppSec in SDLC using Deplo...James Anderson
Effective Application Security in Software Delivery lifecycle using Deployment Firewall and DBOM
The modern software delivery process (or the CI/CD process) includes many tools, distributed teams, open-source code, and cloud platforms. Constant focus on speed to release software to market, along with the traditional slow and manual security checks has caused gaps in continuous security as an important piece in the software supply chain. Today organizations feel more susceptible to external and internal cyber threats due to the vast attack surface in their applications supply chain and the lack of end-to-end governance and risk management.
The software team must secure its software delivery process to avoid vulnerability and security breaches. This needs to be achieved with existing tool chains and without extensive rework of the delivery processes. This talk will present strategies and techniques for providing visibility into the true risk of the existing vulnerabilities, preventing the introduction of security issues in the software, resolving vulnerabilities in production environments quickly, and capturing the deployment bill of materials (DBOM).
Speakers:
Bob Boule
Robert Boule is a technology enthusiast with PASSION for technology and making things work along with a knack for helping others understand how things work. He comes with around 20 years of solution engineering experience in application security, software continuous delivery, and SaaS platforms. He is known for his dynamic presentations in CI/CD and application security integrated in software delivery lifecycle.
Gopinath Rebala
Gopinath Rebala is the CTO of OpsMx, where he has overall responsibility for the machine learning and data processing architectures for Secure Software Delivery. Gopi also has a strong connection with our customers, leading design and architecture for strategic implementations. Gopi is a frequent speaker and well-known leader in continuous delivery and integrating security into software delivery.
DevOps and Testing slides at DASA ConnectKari Kakkonen
My and Rik Marselis slides at 30.5.2024 DASA Connect conference. We discuss about what is testing, then what is agile testing and finally what is Testing in DevOps. Finally we had lovely workshop with the participants trying to find out different ways to think about quality and testing in different parts of the DevOps infinity loop.
JMeter webinar - integration with InfluxDB and GrafanaRTTS
Watch this recorded webinar about real-time monitoring of application performance. See how to integrate Apache JMeter, the open-source leader in performance testing, with InfluxDB, the open-source time-series database, and Grafana, the open-source analytics and visualization application.
In this webinar, we will review the benefits of leveraging InfluxDB and Grafana when executing load tests and demonstrate how these tools are used to visualize performance metrics.
Length: 30 minutes
Session Overview
-------------------------------------------
During this webinar, we will cover the following topics while demonstrating the integrations of JMeter, InfluxDB and Grafana:
- What out-of-the-box solutions are available for real-time monitoring JMeter tests?
- What are the benefits of integrating InfluxDB and Grafana into the load testing stack?
- Which features are provided by Grafana?
- Demonstration of InfluxDB and Grafana using a practice web application
To view the webinar recording, go to:
https://www.rttsweb.com/jmeter-integration-webinar
Encryption in Microsoft 365 - ExpertsLive Netherlands 2024Albert Hoitingh
In this session I delve into the encryption technology used in Microsoft 365 and Microsoft Purview. Including the concepts of Customer Key and Double Key Encryption.
GenAISummit 2024 May 28 Sri Ambati Keynote: AGI Belongs to The Community in O...
Darcy weisbach formula
1. Copyright PipeFlow.co.uk 1
Darcy-Weisbach Formula
Flow of fluid through a pipe
The flow of liquid through a pipe is resisted by viscous shear stresses within the liquid
and the turbulence that occurs along the internal walls of the pipe, created by the
roughness of the pipe material. This resistance is usually known as pipe friction and is
measured is feet or metres head of the fluid, thus the term head loss is also used to
express the resistance to flow.
Many factors affect the head loss in pipes, the viscosity of the fluid being handled, the
size of the pipes, the roughness of the internal surface of the pipes, the changes in
elevations within the system and the length of travel of the fluid.
The resistance through various valves and fittings will also contribute to the overall head
loss. A method to model the resistances for valves and fittings is described elsewhere.
In a well designed system the resistance through valves and fittings will be of minor
significance to the overall head loss, many designers choose to ignore the head loss for
valves and fittings at least in the initial stages of a design.
Much research has been carried out over many years and various formulae to calculate
head loss have been developed based on experimental data.
Among these is the Chézy formula which dealt with water flow in open channels. Using
the concept of ‘wetted perimeter’ and the internal diameter of a pipe the Chézy formula
could be adapted to estimate the head loss in a pipe, although the constant ‘C’ had to
be determined experimentally.
The Darcy-Weisbach equation
Weisbach first proposed the equation we now know as the Darcy-Weisbach formula or
Darcy-Weisbach equation:
hf = f (L/D) x (v2
/2g)
where:
hf = head loss (m)
f = friction factor
L = length of pipe work (m)
d = inner diameter of pipe work (m)
v = velocity of fluid (m/s)
g = acceleration due to gravity (m/s²)
or:
hf = head loss (ft)
f = friction factor
L = length of pipe work (ft)
d = inner diameter of pipe work (ft)
v = velocity of fluid (ft/s)
g = acceleration due to gravity (ft/s²)
2. Copyright PipeFlow.co.uk 2
However the establishment of the friction factors was still an unresolved issue which
needed further work.
Friction Factors
Fanning did much experimentation to provide data for friction factors, however the head
loss calculation using the Fanning Friction factors has to be applied using the hydraulic
radius equation (not the pipe diameter). The hydraulic radius calculation involves
dividing the cross sectional area of flow by the wetted perimeter. For a round pipe with
full flow the hydraulic radius is equal to ¼ of the pipe diameter, so the head loss
equation becomes:
hf = f f(L/Rh) x (v2
/2g) where Rh = hydraulic radius, f f = Fanning friction factor
Darcy introduced the concept of relative roughness, where the ratio of the internal
roughness of a pipe to the internal diameter of a pipe, will affect the friction factor for
turbulent flow. In a relatively smoother pipe the turbulence along the pipe walls has less
overall effect, hence a lower friction factor is applied.
The work of many others including Poiseuille, Hagen, Reynolds, Prandtl, Colebrook and
White have contributed to the development of formulae for calculation of friction factors
and head loss due to friction.
The Darcy Friction factor (which is 4 times greater than the Fanning Friction factor)
used with Weisbach equation has now become the standard head loss equation for
calculating head loss in pipes where the flow is turbulent. Initially the Darcy-Weisbach
equation was difficult apply, since no electronic calculators were available and many
calculations had to be carried out by hand.
The Colebrook-White equation which provides a mathematical method for calculation
of the friction factor (for pipes that are neither totally smooth nor wholly rough) has the
friction factor term f on both sides of the formula and is difficult to solve without trial and
error (i.e. mathematical iteration is normally required to find f).
fD
e
f
Re
35.9
log214.1/1 10 for Re > 4000
where:
f = friction factor
e = internal roughness of the pipe
D = inner diameter of pipe work
Due to the difficulty of solving the Colebrook-White equation to find f, the use of the
empirical ‘Hazen-Williams’ formulae for flow of water at 60º F (15.5º C) has persisted for
many years. To use the Hazen-Williams formula a head loss coefficient must be used.
Unfortunately the value of the head loss coefficient can vary from around 80 up to 130
and beyond and this can make the ‘Hazen-Williams’ formulae unsuitable for accurate
prediction of head loss.
The Moody Chart
3. Copyright PipeFlow.co.uk 3
In 1944 LF Moody plotted the data from the Colebrook equation and this chart which is
now known as ‘The Moody Chart’ or sometimes the Friction Factor Chart, enables a
user to plot the Reynolds number and the Relative Roughness of the pipe and to
establish a reasonably accurate value of the friction factor for turbulent flow conditions.
The Moody Chart encouraged the use of the Darcy-Weisbach friction factor and this
quickly became the method of choice for hydraulic engineers. Many forms of head loss
calculator were developed to assist with the calculations, amongst these a round slide
rule offered calculations for flow in pipes on one side and flow in open channels on the
reverse side.
The development of the personnel computer from the 1980’s onwards reduced the time
needed to perform the friction factor and head loss calculations, which in turn has
widened the use of the Darcy-Weisbach formula to the point that all other formula are
now largely unused.